
Abstract
End-of-semester evaluations provide scalable data for university administrators, but typically do not provide instructors with timely feedback to inform their teaching practices. Midsemester evaluations have the potential to provide instructors with beneficial formative feedback that can contribute to improved teaching practices and student engagement. However, existing research on the construction of valid, reliable midsemester tools is rare, and there are no existing midsemester evaluation scales that were constructed using education research and psychometric analysis. To address this gap, we designed and piloted a midsemester evaluation of teaching with 29 instructors and 1,350 undergraduate students. We found evidence that our Mid-Semester Evaluation of College Teaching (MSECT) is a valid and reliable measure of four constructs of effective teaching: classroom climate, content, teaching practices, and assessment. Furthermore, our factor structure remained consistent across instructor genders, providing evidence that the MSECT may be less susceptible to gender bias than prior student evaluation measures.
Introduction
Many university instructors collect feedback from their students at two points: midway through the semester and at the end of the semester. The end-of-semester student evaluations of teaching (SETs) are often mandated by the school’s administration or accreditation body. Midsemester evaluations (MSEs) are often voluntary and provide feedback to instructors to improve their teaching within the current term instead of waiting until the next semester. Although end-of-semester SETs have been the subject of decades of critical research (Spooren et al., 2017), much less is known in the literature about MSEs of college teaching.
Formative feedback—which takes place during the process, and is typically low-stakes—is essential for improving performance (Hattie & Timperley, 2007). MSE feedback is typically only reported to the instructor to improve their practice, and not to department chairs or deans (Overall & Marsh, 1979). Therefore, MSEs can be thought of as formative evaluation, and may relate to improvements in teaching. However, designing and implementing a formative teaching evaluation instrument requires both instructors’ time and an expertise in measurement and pedagogy—resources many instructors do not have. Therefore, the field would benefit from a standardized validated instrument because instructors across disciplines could be confident that the feedback they collect is useful without spending time on scale construction.
It is rare for college teaching evaluations to be rigorously evaluated for reliability and validity. In our search, we found no published MSE instruments that are grounded in the education literature, designed for use at midsemester, and that have held up to psychometric scrutiny. In light of this gap, we constructed and assessed a brief, multidimensional evaluation measure designed to be used for MSEs of teaching in higher education contexts. It is particularly important that MSEs’ validity and reliability are assessed, as there is a growing body of literature identifying these problems with end-of-semester evaluations (Spooren et al., 2017).
Theoretical Framework
We draw on theory that identifies the importance of high-quality feedback for improving performance to ground our discussion on the importance of SETs. Hattie and Timperley (2007) note that to improve the quality of accomplishing a complex task, feedback is most effective when it provides information specifically related to the task, and is situated within the context (e.g., within the course an instructor is teaching) so that the feedback can be immediately applied. Feedback on a task is most powerful in improving performance when it is provided during task acquisition. We apply these theories to the practice of teaching in higher education. Although this area of research has focused on the importance of students’ receiving feedback from instructors, it implies that instructors would also benefit from formative feedback from knowledgeable others, including their students.
The content of the feedback is an important determinant of its effectiveness (Hattie & Timperley, 2007; Kember et al., 2002). In this case, we want to generate student feedback on aspects of teaching that are within the instructors’ control, that are strongly related to student learning, and that remain relevant across course disciplines and contexts. When determining what aspects of teaching to assess, we turn to education frameworks such as the Self-System Model of Motivational Development (Skinner et al., 2008), Expectancy-Value Theory perspective (Wigfield & Eccles, 2000), and the Zone of Proximal Development (Vygotsky, 1978). There is a vast literature base to draw from when defining effective college teaching (e.g., Alcott, 2017; Alderman, 2013; Atkinson & Siew Leng, 2013; Bain, 2012; Chickering & Gamson, 1987; Corkin et al., 2017; Murphy & Alexander, 2000).
We designed our measure of effective teaching to align with the Fearless Teaching Framework (FTF), which is a theoretical frame that defines effective teaching as that which promotes students’ motivation and engagement, leading to academic achievement (Donlan et al., 2019). The FTF distills decades of education research and theory into broad categories of effective teaching. Taken together, the foundational education literature indicates that teaching is most effective when it takes place in warm climates that are supportive for learning, includes content that students value and are able to understand, incorporates evidence-based teaching practices such as the inclusion of active learning, and relies on valid assessment strategies that provides guiding feedback to students (Donlan et al., 2019). The FTF, therefore, defines effective teaching based on four essential pieces: climate, content, practice, and assessment (Donlan et al., 2019). It is important to note that the fundamental elements of effective teaching (e.g., the course climate) may be enacted differently across disciplines and classroom contexts, but their overall importance remains (e.g., Corkin et al., 2014; Zubrunn et al., 2014),
SETs
The most common SETs are conducted at the end of each semester. Institutionally standardized end-of-semester SETs enable universities to take a quick, low-cost “quantitative snapshot” of students’ perceptions of teaching and course design (Surgenor, 2013, p. 364). SETs traditionally consist of both Likert-type and open-ended survey items designed to collect quantitative and qualitative feedback about teaching at a scale that might not be possible or economical with other research methods (Hammonds et al., 2017; Richardson, 2005). The feedback gained by end-of-semester SETs can be used by individual instructors to improve their teaching and by administrators for promotion and tenure decisions (Richardson, 2005).
Despite the nearly ubiquitous use of end-of-semester SETs at universities internationally, there are well-documented issues with their validity, reliability, bias, and usefulness (Richardson, 2005; Spooren et al., 2013, 2017; Zabaleta, 2007). Although a few scales have emerged in the literature as being valid and reliable instruments (e.g., Marsh, 1982; Students’ Evaluations of Educational Quality [SEEQ]), most universities still use SETs, constructed in-house, without deeply assessing the instrument’s psychometric properties (Spooren et al., 2017).
The construct validity of end-of-semester SET data is widely debated, and researchers often focus on the observation that despite the field’s agreement that SET instruments must be founded in teaching and learning literature (Richardson, 2005), there is not a research-based conceptual framework that grounds SET items (Spooren et al., 2017). Instead, the typical approach to designing SETs is to choose items based on assessments of student satisfaction and a review of survey items used by other institutions, regardless of whether the item is well-constructed, or connects to current education research (Kember et al., 2002; Marsh, 1987). For example, in spite of the growing evidence that active learning teaching strategies are related to improvements in student learning, SETs typically do not ask students to report on active learning (Kember et al., 2002).
Validity concerns also emerge from the significant evidence that homegrown SET data are biased by a number of factors unrelated to instructional practices. For example, research has demonstrated bias by the gender of the instructor, grade inflation, and if the course is required or an elective (Marsh & Roche, 2000; Spooren, 2010, 2017). Echoing this issue of validity, Oon et al. (2017) and Socha (2013) found that most homegrown end-of semester SETs are not usually assessed psychometrically. This is a problem because without psychometric analysis it is impossible to know the extent to which SET data provide a valid, reliable assessment of teaching quality, or effectiveness.
In addition, the short, summative surveys most commonly administered as SETs do not reliably assess the multidimensionality of teaching (Knol et al., 2016). Although many SETs load onto only one dimension (i.e., teaching effectiveness or student satisfaction), Marsh (1987) and Apodaca and Grad (2005), among other scholars, argue that a multidimensional understanding of teaching quality is more valid and accurate because teaching is not a unidimensional practice (Ambrose et al., 2010; Donlan et al., 2019).
Another weakness in the current practice of administering end-of-semester SETs is that instructors often receive feedback about the Fall semester after the Spring semester has begun, meaning they are unable to use the Fall SETs to revise their course for the Spring. For SETs to provide formative feedback to instructors, summaries of the results would need to be given to instructors well before the start of the semester.
To address the weaknesses of end-of-semester SETs, researchers (e.g., Cohen, 1980) recommend also using MSEs of teaching. Using an MSE designed to collect actionable information, instructors can gain timely, formative feedback from students while they still have time in the semester to implement changes (Costello et al., 2002). Formative feedback has been shown to positively predict the use of more effective teaching practices (e.g., Hampton & Reiser, 2004) and positively relate to the student experience (Costello et al., 2002; Overall & Marsh, 1979). MSEs are often used solely for formative feedback to improve teaching and not for promotion or tenure (Overall & Marsh, 1979). Therefore, instructors can react to feedback in a low-stakes environment initially, and then administer end-of-semester SETs which are often high-stakes.
Purpose of the Study
To assist instructors in their use of MSEs, we constructed a brief survey scale for their use in college classrooms to collect feedback from their students. The scale has four subscales that align with the FTF: climate, content, practice, and assessment. The purpose of this study is to assess the psychometric properties of the scale, including the extent to which it assesses multiple dimensions of teaching (see Figure 1), and any potential form-invariance by instructor gender. We assess invariance by gender to investigate the scale’s susceptibility to potential bias by instructor gender, as is often present in other SETs.
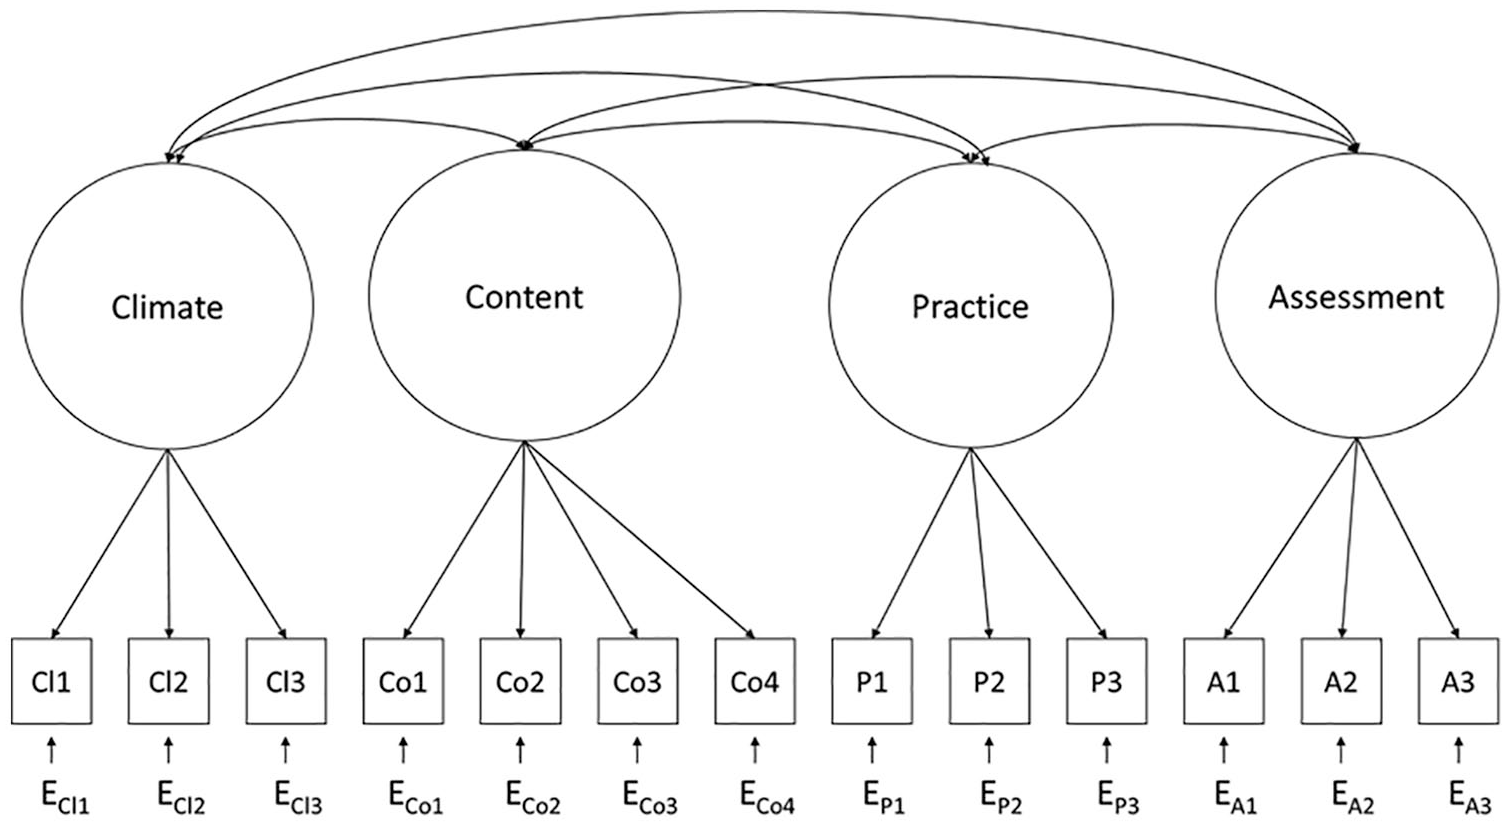
Conceptual model.
Method
Instrument Development
We designed the Mid-Semester Evaluation of College Teaching (MSECT) to align with the FTF (Donlan et al., 2019), which defines effective teaching through four dimensions: classroom climate, course content, teaching practices, and assessment strategies. These four dimensions were chosen because there is education theory and research that indicates they are strong predictors of student motivation, engagement, and academic success (e.g., Lave & Wenger, 1991; Skinner et al., 2008; Vygotsky, 1978; Wigfield & Eccles, 2000). Furthermore, they are aspects of the classroom experience that the instructor has direct control over, in contrast to class size, physical environment of the room, or demographic characteristics.
The instrument was written with the goal of effective midsemester SETs in mind. The authors drafted each item to correspond with one of the dimensions of the FTF. The items were written to be actionable—meaning that instructors would be able to make changes to their courses based on the feedback they receive. The items were also written to be useful in a wide range of academic disciplines and classroom settings, and the overall scale was designed to be short so that data could be collected during class sessions. The original instrument contained two items designed only for online courses. These were removed from these analyses because none of the courses in this pilot study were taught online.
After the first iteration of the items was written, we assessed the content validity by soliciting feedback from a panel of expert faculty developers and education researchers. These experts were selected because of their knowledge and experience on the topics such as active learning pedagogy, learning assessments, and inclusive climate. Each of these experts served as a professional faculty developer or education researcher at their university’s teaching and learning center. The experts suggested minor wording changes, which were incorporated into the measure. The experts then confirmed the content validity of the final instrument.
Measures
MSECT
The instrument has four subscales: climate, content, practices, and assessment. All questions on the MSECT used the same response set (1 = strongly disagree; 6 = strongly agree). All items are positively worded. All items are intended to measure the students’ perceptions of the teaching and the course. The full items can be found in Table 4.
Climate subscale
A positive classroom climate is supportive, inclusive, accessible, and equitable for diverse groups of students (Morin et al., 2014). The climate subscale consisted of three items designed to assess the multiple dimensions of classroom climate, such as support, accessibility, and inclusion (α = .84).
Content subscale
Course content is more engaging for students when it is relevant to their lives, builds upon the students’ existing knowledge, developmentally appropriate, and in line with the learning objectives (Howard, 2001; Lave & Wenger, 1991).The content subscale included four items and was designed to assess the extent to which students perceived that instructors selected relevant, engaging, developmentally appropriate content (α = .76).
Practice subscale
Teaching practices that positively influence learning and motivation are accessible, well-organized (Wentzel & Brophy, 2014), and aligned with the active learning research (Alexander & Winne, 2006). Effective teachers communicate clear and high expectations for their students, and explain why the course goals are relevant to the students’ lives. The practice subscale included three items about evidence-based teaching practices, such as active learning and scaffolding (α = .73).
Assessment subscale
Assessments (e.g., assignments, tests, projects) encourage student engagement when they are aligned with the course objectives, clearly explained, and do not cause unnecessary stress (Wass et al., 2018).
The assessment subscale consisted of three items that were included to measure the extent to which students perceived that the graded elements were clear and fair (α = .80.)
The final questions of the survey address demographics such as gender, race, and year in school. Gender and race were measured with multiple choice questions in which students could check all responses that applied. To identify their gender, students could check multiple options from male, female, and other. Similarly, students identified their race by selecting among multiple options (e.g., American Indian, White).
Procedure
In Fall 2017 and Spring 2018, we recruited instructors teaching undergraduate courses with at least 30 students. Instructors were informed that their participation would not impact their employment at the University. In addition, they were informed that the evaluation results would only be shared with the research team and the instructor, themselves.
Instructors were asked to share an online survey link with their students during class after students had received feedback on at least one major graded assignment (approximately 8 weeks into a 16-week semester). In an announcement before the students took the online survey, students were encouraged to participate because it would inform the instructor’s teaching awareness and practice. Students were informed that their responses would be confidential and would only be reported to the instructor as anonymized aggregates.
Sample
We collected MSE data from 1,350 undergraduate students in the 2017 to 2018 academic school year (
Student Demographic Information.

Student responses were deleted from the final data set if they failed to identify their course or their instructor, or they completed the MSE for a course or instructor that was not participating in the study. In addition, we only include student responses for the first semester in which the instructor participated in the study.
Data Analysis
To begin, we randomly split our sample in SPSS so that we could perform exploratory factor analysis (EFA) on one half (n = 652), and confirmatory factor analysis (CFA) on the other (n = 698). There were no significant differences across groups. The distribution of our items contained some negative skew, and so we used a robust maximum likelihood estimator (MLE) in MPlus 8.0 to analyze our data. In total, 81.55% of cases had complete data. All analyses addressed missing data using Full Information Maximum Likelihood (Peugh & Enders, 2004).
First, we ran an EFA model with the first half of the sample that generated solutions with one to five factors to address
Next, to address
Finally, to address
To evaluate the goodness of fit for our model, we considered several commonly used model fit indices, loadings, and factor covariances: the chi-square test, the root mean square error of approximation (RMSEA), the comparative fit index (CFI), the Tucker–Lewis index (TLI), and the standardized root mean square residual (SRMR). Our criteria for good fit are a nonstatistically significant chi-square, RMSEA values below .06, SRMR values below .08, and a CFI and a TLI value greater than .95 (Hu & Bentler, 1999; Thompson, 2004). We also used the comparative measure of fit the Akaike information criterion (AIC) and the Bayesian information criterion (BIC) to determine which model was superior, with smaller values indicating better fit. Finally, we calculated the construct factor replicability, as measured by the H index with a criteria of H > .80 (Hammer, 2016; Hancock & Mueller, 2001) for each factor to determine how well a group of items represent a latent construct.
Results
We assessed the normality of the data and the extent to which there were outliers. Because there was some negative skew we used a robust estimator in our models. We calculated mean values, standard deviations, and correlations of the scale items for the full sample (see Table 2).
Summary of Correlations, Mean Values, Standard Deviations, and Interclass Correlations for Survey Items.

M = mean ; SD = standard deviation; ICC = intraclass correlation coefficient.
p < .01.
Research Question 1: What Underlying Factor Structure Approximately Fits the Data?
We conducted an EFA with half of the sample to answer this question. Using a geomin oblique rotation, we calculated solutions based on the correlation matrix that extracted one to five factors, and inspected the eigenvalues, model fit indices, and factor loadings before selecting a final model.
In the unrotated solution, there were two factors with greater than one. The rotated model fit indices are presented in Table 3. We found that the model fit indices stabilized at strong fit with four factors. The five-factor model did not converge. Therefore, we closely inspected the two-factor solution because of the eigenvalues, and the four-factor solution because of model fit indices. The loadings above .4 for the two- and four-factor solutions are presented in Table 4. In the two-factor solution, the factors were weakly correlated (r = .06, p > .05). In the four-factor, the rotated factor correlations ranged from .51 to .67, and all were statistically significant (p < .05).
Exploratory Factor Analysis Model Fit Indices.

Note. AIC = Akaike Information Criterion; BIC = Bayesian Information Criterion; RMSEA = Root Mean Square Error of Approximation; CFI = Comparative Fit Index; TLI = Tucker Lewis Index; SRMR = Standardized Root Mean Square Residual.
Exploratory Factor Analysis Factor Loading for Two- and Four-Factor Solutions.

Note. Only loadings above .4 are presented. Cl = climate; Co = content; P = practice; A = assessment.
Upon inspection of the two-factor and four-factor solutions, we found that the two-factor solution was largely a single-factor solution. That is, there were no items with factor loadings above .4 on the second factor. In contrast, in the four-factor solution, the subscales were somewhat represented in the structure. The climate items were loaded onto Factor 1, the content items were loaded onto Factor 2 (with cross loadings on Factor 1), and the assessment items were loaded onto Factor 3. One practice item was strongly loaded onto Factor 4, though the other two items did not meet the threshold.
Our goal was to select a number of factors that approximated the verisimilitude of the scale structure (Preacher et al., 2013). To do this, it is important to recognize that we approached the EFA solutions within a frame of prior research and theory—that is, we were not agnostic to the result. Instead, we were looking for a factor structure with strong quantitative standing, as well as one that is interpretable within the field. Although the eigenvalues indicated a two-factor solution may approximate the data well, the four-factor solution had stronger model fit indices, and broke the scale along its intended subscales. Therefore, we selected the four-factor model because it would allow instructors using the instrument to understand four dimensions of their teaching—climate, content, practice, and assessment—as opposed to a unidimensional model of teaching. We assessed the strength of this choice in our second research question.
Research Question 2: In Alignment With Our Theoretical Frame, to What Extent Do Latent Climate, Content, Practice, and Assessment Factors Fit the Underlying Structure of the Data?
To address this research question, we ran CFA on the second half of the sample to confirm the factor structure we chose in
CFA Model Standardized Factor Loadings and Factor Replicability Scores (H).
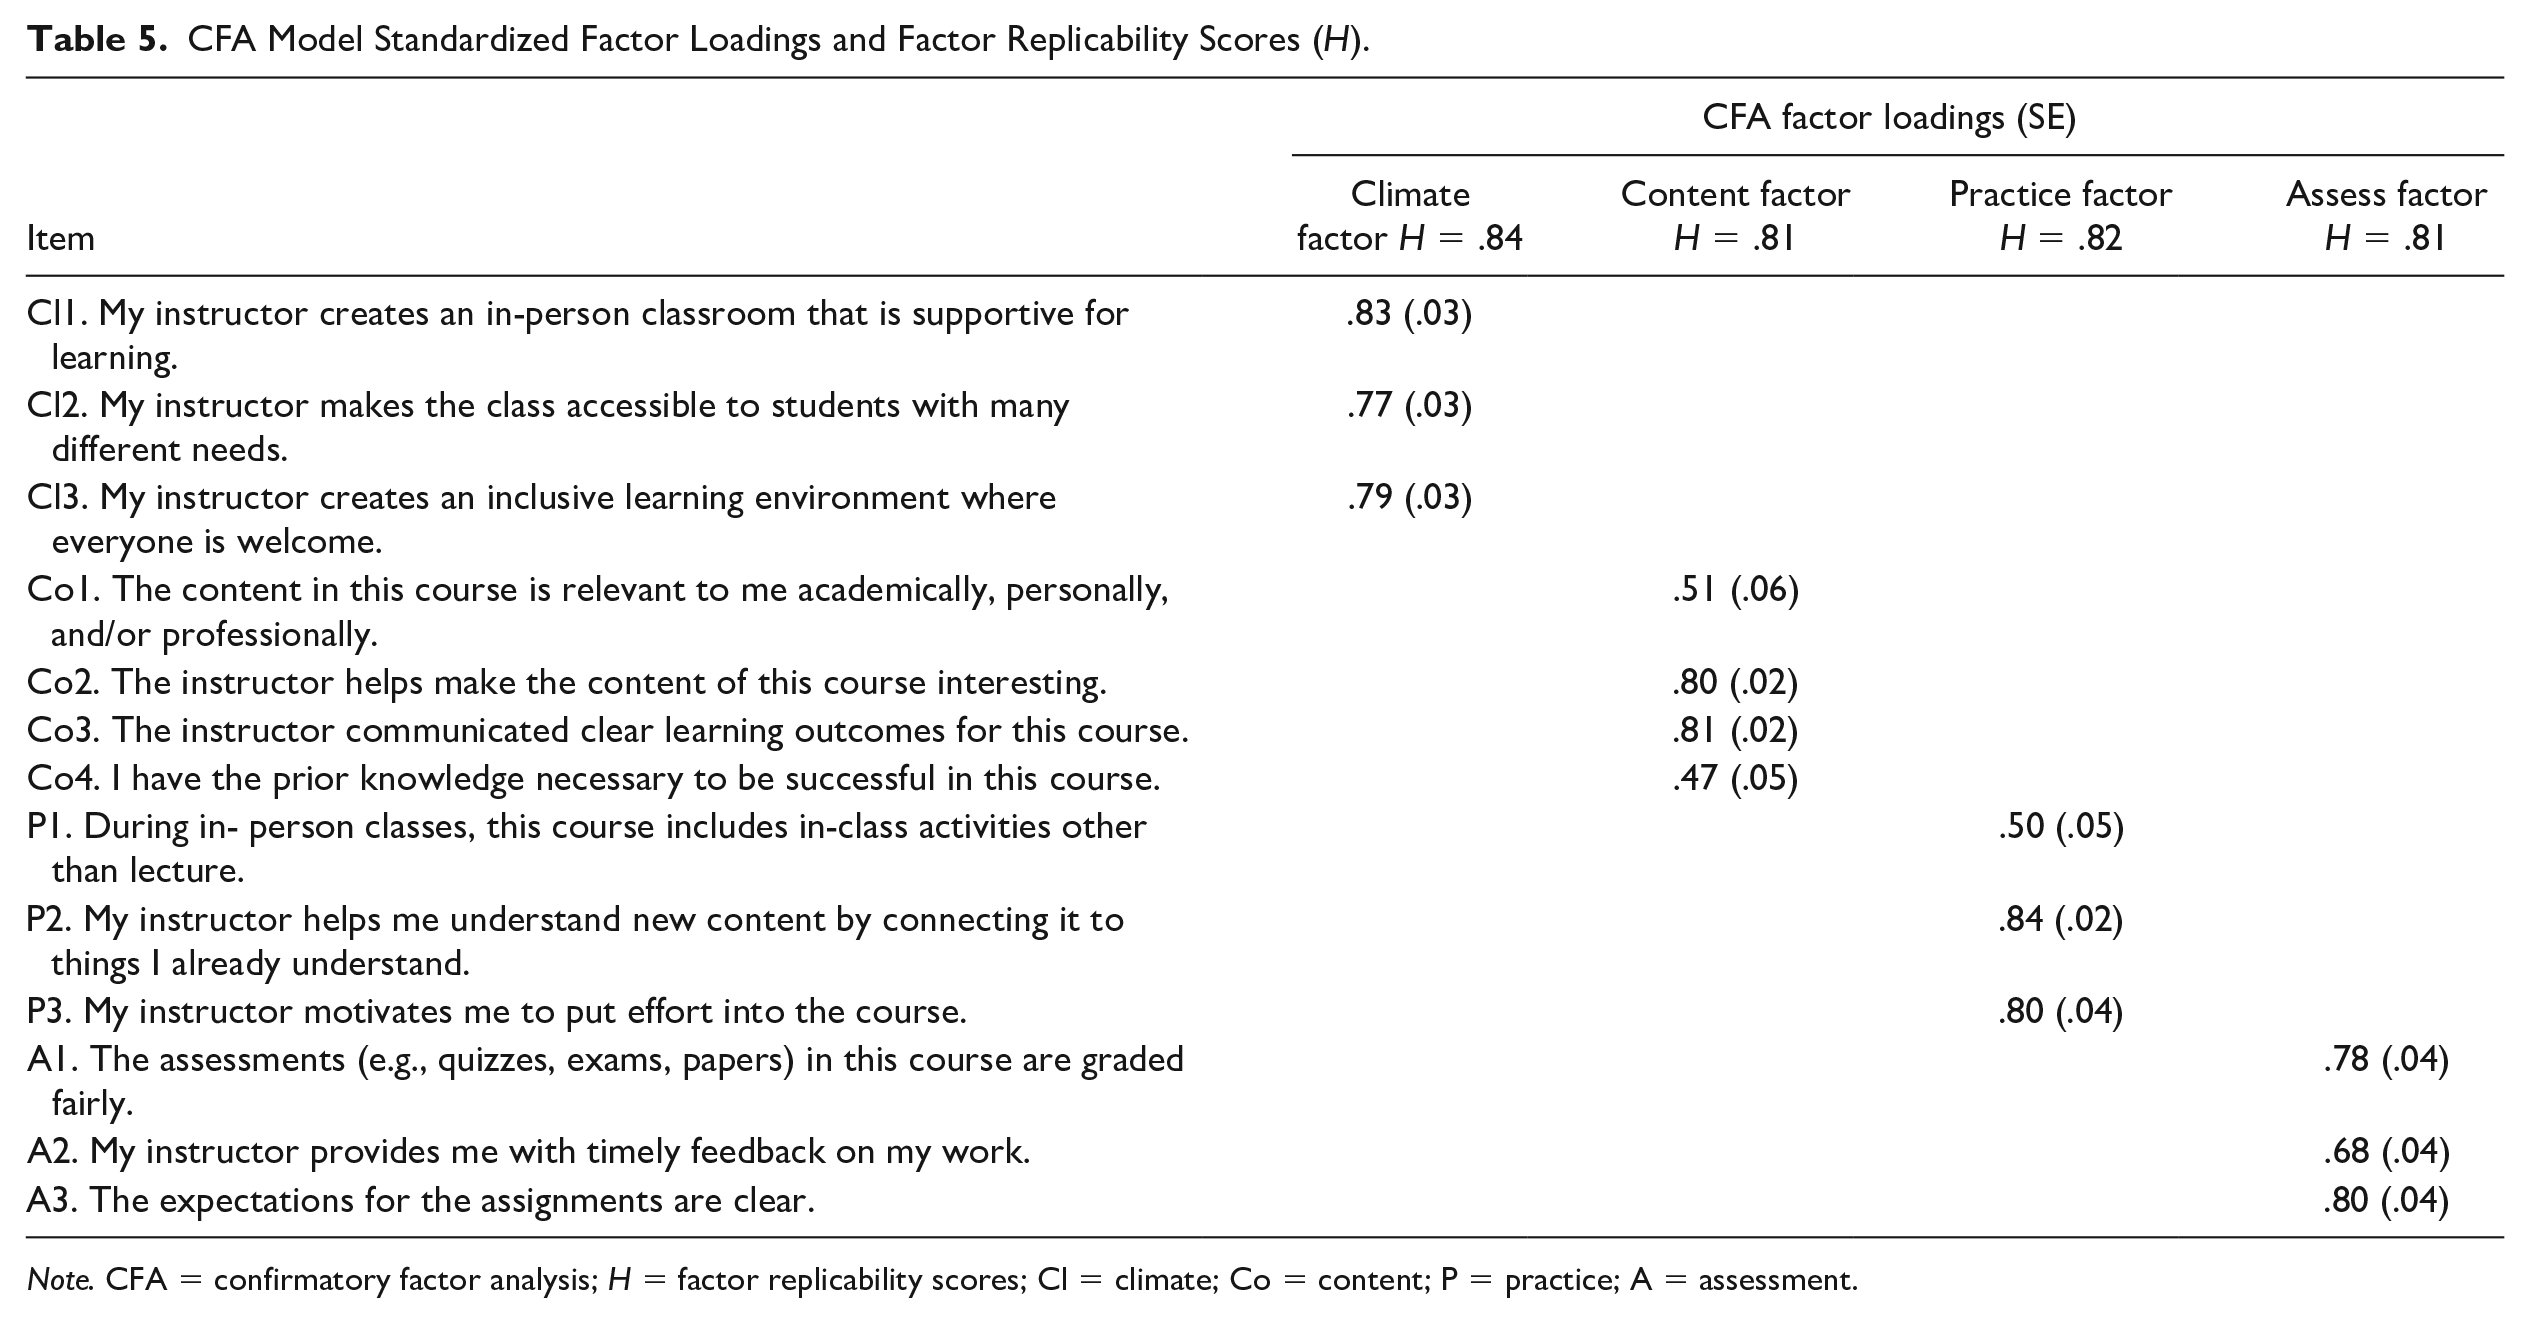
Note. CFA = confirmatory factor analysis; H = factor replicability scores; Cl = climate; Co = content; P = practice; A = assessment.
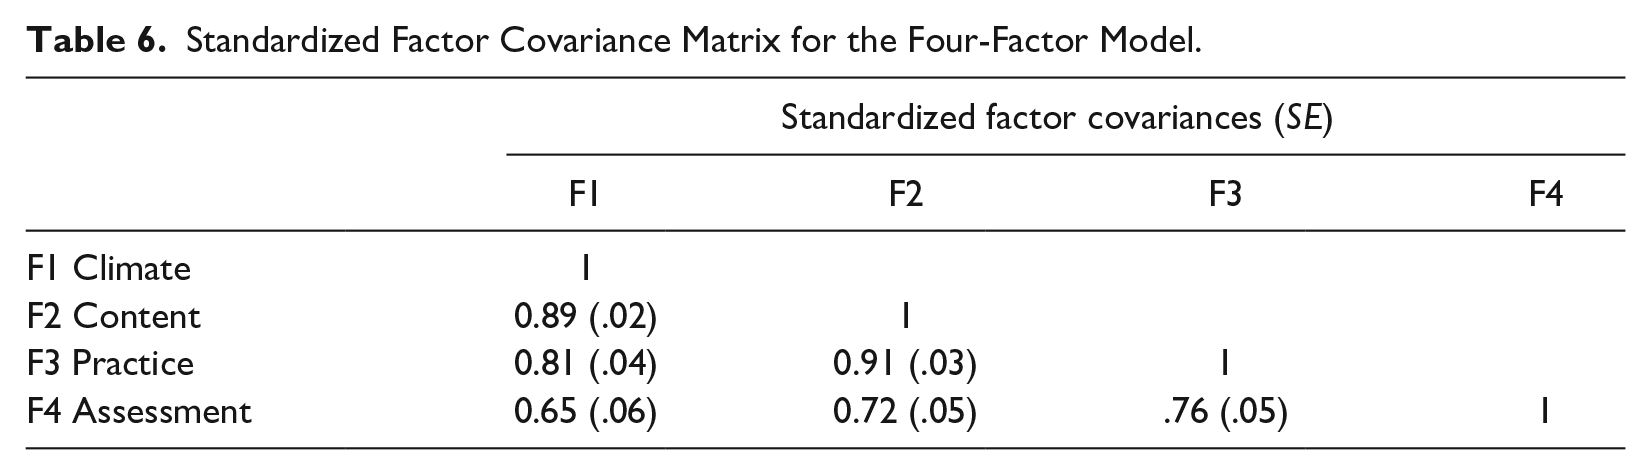
Because we were interested in assessing related but separate dimensions of teaching we also examined the factor covariance matrix to assess evidence of the model’s validity. The four-factor model’s factor covariance matrix is provided in Table 6, and shows that the content factor and climate factor (r = .88, p < .01) and the content factor and practice factor (r = .91, p < .01) were very strongly positively related to one another. Factor replicability was acceptable across all factors (i.e., >.8).
Standardized Factor Covariance Matrix for the Four-Factor Model.
Research Question 3: To What Extent Is the Model’s Factor Structure Invariant Across Instructor Gender?
We assessed equal-form invariance to determine the extent to which the model structure was invariant across instructor gender (Kline, 2011). The data were divided into two independent groups: men (n = 761) and women instructors (n = 455). We specified the same model across these two groups, and allowed all parameters to be freely estimated. The model loaded each of the 13 items onto its corresponding factor (climate, content, practice, and assessment), and allowed all of the factors to covary. Although the model converged normally, there was an error with identification because the numbers of parameters exceeded the number of clusters. Therefore, we reran the model without nesting students into courses, which resolved the problem with identification. This model fit the data well—n = 1,216; χ2(136) = 360.11, p < .01; AIC = 40,491.15; BIC = 40,858.59; RMSEA = .05; CFI = .95; TLI = .94, SRMR = .05—and the loadings were similar across the gender groups (see Table 5), providing evidence of model invariance. We calculated H values for all of the factors by gender, and found that some H values were slightly worse for women, though still marginally acceptable (>.7; see Table 7).
Factor Loadings by Gender.

Note. H = factor replicability scores; Cl = climate; Co = content; P = practice; A = assessment.
Discussion
MSEs can provide formative feedback to instructors on their teaching. However, there are not currently any validated scales for MSEs of college teaching. To address this gap, we designed and implemented a short multidimensional tool, the MSECT. We gathered data across two semesters, and split the sample in two random halves. We performed EFA on the first half, and found evidence that a two-factor or four-factor solution would fit the data well. Based on model fit indices, theory, and the interpretability of the solutions, we selected a four-factor model. Next, we conducted CFA with the second half and found the four-factor model fit the data well. Finally, prior literature indicates that many end-of-semester course evaluation tools are biased, and work differently for men and women instructors (Spooren et al., 2017). In light of those findings, we assessed model fit for both men and women instructors, and found the model fit well and similarly for both groups.
The content of the MSECT was chosen based on decades of education theory and empirical research, underscoring the importance of classroom climate, course content, teaching practices, and assessment strategies in promoting student engagement and motivation (e.g., Atkinson et al., 2013; Corkin et al., 2014; Frymier & Shulman, 1995). Furthermore, all items were designed to be actionable, and the scale was written to be short enough to administer during class without much disruption. Our findings provide evidence that instructors could use the scale to quickly assess four dimensions of their teaching, which previously would have required multiple long-form assessments or observations that are difficult to conduct at a large scale.
Researchers have documented bias in SETs, and it is clear that the field needs new, psychometrically assessed measures (Spooren et al., 2017). Biased teaching evaluations affect high-stakes decisions such as hiring, promotion, and tenure selections. When universities rely on measures that do not provide instructors with clear, actionable feedback it makes it less likely that instructors can thrive in their teaching and support their students’ achievement. Furthermore, biased measures that favor instructors who are men may reinforce gender gaps in higher education. This study offers a potential pathway that may address both of these problems: a short, actionable survey designed to provide instructors with the formative feedback they need to grow, that is designed to function with invariance across groups.
There are limitations to this study. First, we were unable to randomly select the classrooms, courses, course delivery method (i.e., online vs. in-person), or instructors who volunteered to participate. Instead, instructors who volunteered may have been more comfortable with their teaching and more open to constructive feedback than the typical college instructor. Second, these results only analyze the quantitative findings from the scales, and do not assess the qualitative student comments students made. These comments are essential to understanding the feedback that students provide, but it was beyond the current analysis to include them. Third, these analyses only rely on the reports of students, and do not include any information from instructors about their own teaching. Fourth, we did not use precognitive interviews with students in our initial development stages because of resource constraints. We see great value in conducting cognitive interviews with students to further determine the validity of the items and instrument. Future research can extend our work with assessments of criterion validity using preexisting scales and qualitative reflections on the scales from both students and instructors.
It is also important to note that we did not assess the MSECT for invariance by instructor race. Although we believe it is vital to assess instruments by all dimensions of documented bias (e.g., gender, race, conventional attractiveness) we did not have access to the races of the instructors who participated. We believe future research should purposefully recruit samples of instructors with balanced racial distributions and conduct these analyses.
Notably, we did not assess the MSECT by testing the relationship to university wide or homemade end-of-semester SET scales (e.g., Hampton & Reiser, 2004), and instead assessed the underlying structure of the scales. Although future research should conduct assessments of criterion validity, we believe that the criterion needs to be well-designed and psychometrically validated, which most end-of-semester course evaluations are not.
In sum, we find evidence that the MSECT is a robust measure of college teaching that can provide formative feedback to instructors. With that feedback, instructors can reflect upon and improve their teaching, which should lead to better learning experiences for students, and increased student motivation engagement, and learning.
Footnotes
Declaration of Conflicting Interests
The author(s) declared no potential conflicts of interest with respect to the research, authorship, and/or publication of this article.
Funding
The author(s) received no financial support for the research, authorship, and/or publication of this article.