
Abstract
This investigation examined whether teacher practices, as measured by the Classroom Strategies Assessment System (CSAS), were associated with students’ proficiency and gain scores, as measured by the Measure of Academic Progress (MAP), in 13 high-poverty charter schools in New Jersey. Results from two-level hierarchical linear models, fitted to a sample of 2,188 Kindergarteners through eighth-grade students in 110 classrooms, revealed that instructional and behavior management strategies on the CSAS were associated with (a) MAP gains in mathematics but not in reading and (b) MAP Rasch Unit (RIT) (proficiency) scores in mathematics and reading. The relationship between CSAS scores and student achievement did not differ across grade levels. In general, students in classrooms with higher quality use of classroom strategies exhibited higher gains in mathematics and proficiency scores in mathematics and reading. Implications for research and educational practices are discussed.
While decades of research have demonstrated relationships between teacher quality and student achievement, few investigations have examined these relations in high-poverty schools (e.g., Darling-Hammond et al., 2001; Nye et al., 2004; Rivkin et al., 2005; Sanders & Horn, 1998). Expanding this line of inquiry is important because teacher quality and teacher effectiveness can exacerbate risk factors associated with students living in high-poverty settings, such as academic, social, and behavioral difficulties, as well as a host of negative familial, communal, and interpersonal factors affecting lifespan development (Stichter et al., 2009; Stormont, 2007). High-poverty schools tend to experience more teacher turnover, and have greater difficulty attracting and retaining high-quality teachers (Darling-Hammond, 1995). Teachers in high-poverty schools report greater burnout and mental health issues, and less work-related supports compared with their peers (e.g., Darling-Hammond, 1995; Hanushek et al., 2016; McKinney et al., 2007).
Similarly, teachers employed in high-poverty schools tend to have less teaching experience (Mayer et al., 2000), and are less likely to be effective teachers (Lankford et al., 2002; Nye et al., 2004). Subsequently, these teachers may use less effective teaching practices (Stichter et al., 2009) and engage in lower quality teacher–student interactions (Yoon, 2002), which may yield poor student achievement (Clunies-Ross et al., 2008; Desimone & Long, 2010; Heck, 2007). Therefore, it is important to assess the nature of classroom practices and their relationship to student achievement, to determine how such practices may benefit students in areas of instruction such as reading and mathematics, and to help inform research and practice focused on enhancing effectiveness of teaching practices in these settings.
Classroom observational assessments are a common method for school leaders to evaluate teachers’ classroom practices, gauge professional development needs, and provide feedback to teachers for improving classroom practices. Recent studies suggest the use of classroom observations when combined with postobservation conferencing can produce positive outcomes in student learning (Dee & Wyckoff, 2015; Steinberg & Sartain, 2015). As process-oriented measures, classroom observational assessments can promote effective teaching since teachers can be observed using, or not using, practices related to student learning (Goe et al., 2008). A long history of process-product research from the effective teaching literature has documented specific instructional and classroom behavioral management practices that are important for improving student outcomes (Brophy & Good, 1986; Gage & Needels, 1989). When informed by such literatures, classroom observational assessments can provide data useful for informing teacher professional development supports. In the context of high-poverty schools, such measures can be used by school leaders to support teacher growth and promote students’ exposure to effective teaching practices.
While there are several observation approaches used in school, the Danielson Framework for Teaching (FFT; Danielson, 2013) is arguably the most widely used teacher evaluation tool in schools. The FFT, a standard-based assessment focuses on constructivist models of teaching, examines teacher performance across four domains with 22 nested components of practice (i.e., preparation and planning for student learning, classroom management, instruction and professional responsibilities). The FFT was originally developed as a framework for school administrators to guide professional development conversations with Grade K–12 teachers and includes four effectiveness levels (unsatisfactory to distinguished). Scoring is completed separately at the total and domain levels based on sources of evidence such as direct classroom observation, teacher interview, and review of artifacts. Although the FFT has been found to have evidence of reliability and validity in specific use contexts (Kettler & Reddy, 2019), school personnel often use modified versions of the FFT and inconsistently implement the tool for evaluation or professional development purposes (Liu et al., 2019; Reddy et al., 2019). Modified versions of the FFT or any approach unfortunately yield questionable score inferences for high-stakes evaluation decisions or professional development plans for educators.
One teacher observational assessment that measures teachers’ use of evidence-based instructional and behavior management methods is the Classroom Strategies Assessment System (CSAS; Reddy & Dudek, 2014). The CSAS is a multirater, multidimensional tool that includes direct observation and rating scale methodology to assess the frequency and quality of evidence-based instructional and behavior management of Grade K–12 teachers. The CSAS was designed to enhance teacher professional improvement via the assessment of multiple models of effective teaching (e.g., direct instruction, student-directed learning) and behavior management via scores and online visual (graphic) performance feedback. The CSAS has evidence of reliability and validity, including prediction of student achievement and behavior (e.g., Lekwa et al., 2019; Reddy et al., 2013, 2015). Initial research has shown CSAS scores are sensitive to teachers’ classroom practices related to student proficiency status on state-mandated testing of mathematics and reading (Dudek et al., 2019; Reddy et al., 2013) and academic growth on computer adaptive standardized measures of achievement (e.g., Measures of Academic Progress; Lekwa et al., 2019).
The present study builds on this previous work through analysis of a wider age range (Kindergarten through eighth grades) in schools that serve students in communities with high levels of poverty, and a focus on unique and combined roles of teachers’ instructional and behavior management practices in explaining patterns in student achievement (i.e., gain and proficiency scores in mathematics and reading). Specifically, analyses in this study were conducted to (a) confirm associations between measures of teacher practices and student achievement and (b) to determine whether the nature of these relationships varies across Kindergarten through eighth grade. We address three primary questions.
Does assessment of classroom practices predict student reading and mathematics gains, as measured by Northwest Evaluation Association (NWEA) Measure of Academic Progress (MAP) Conditional Growth Index (CGI)?
Does assessment of classroom practices predict student reading and mathematics proficiency scores in the spring, as measured by NWEA MAP Rasch Unit (RIT) scores, controlling for their fall proficiency RIT scores and grade levels?
Does the association between classroom practices and MAP spring RIT proficiency scores, controlling for fall RIT proficiency scores, vary as a function of grade?
Method
Participants
Data for this study were collected during the 2015–2016 school year from a group of 13 high-poverty schools in New Jersey that were participating in the U.S. Department of Education funded School System Improvement (SSI) Project, a collaborative effort between charter schools and universities to improve human capital management systems through rigorous teacher evaluation. After application of inclusion criteria for analyses (described below), participants included 110 teachers in Kindergarten through eighth grades who taught reading, mathematics, or both subjects, as well as 2,188 students and 24 school administrators from 13 high-poverty schools. All schools met federal poverty status by having at least 50% of their students eligible for either free or reduced lunch (McFarland et al., 2017).
The teacher sample (n = 110) was predominantly female (94%) and European American (75%) and included representation of African Americans (10%). A bachelor’s degree was the most common highest degree earned (72%). Teachers had an average of 3.99 (SD = 3.85) years of teaching experience, and they taught a variety of grade levels. About half of the teachers sampled taught both reading and mathematics.
The student sample (n = 2,188) was well balanced with regard to gender and represented a diverse array of ethnic backgrounds including Hispanic/Latino(a) (50%), Black/African American (29%), and White/European American (15%), among others.
Trained school administers (n = 24) conducted CSAS observations of teachers as part of teachers’ routine educator evaluation process. Administrators were predominantly female (79%) and European American (54%) and included representation from African Americans (25%), and Asians (21%). Most administrators had a master’s degree (75%) as the highest degree earned.
Measures
NWEA MAP
The MAPs are computer adaptive tests assessing broad reading and mathematics skills for students in Kindergarten through 12th grades. These tests were designed to be administered multiple times across a school year to provide schools with descriptions of students’ growth in addition to single point estimates of achievement levels. NWEA (2011) reported estimates of internal consistency within the low to mid .90s for reading and mathematics across grades, as well as strong evidence of concurrent validity (estimates of .70s–.80s) and predictive validity (estimates ranging around .70) associations.
CSAS
The CSAS—Observer Form (CSAS) is a multidimensional observational assessment of teachers’ use of evidence-based instructional and classroom management strategies. The CSAS integrates direct observation with strategy rating scales and includes three components: Strategy Counts (discrete count of specific instructional and behavior management practices), Rating Scales of Instruction and Behavior Management strategies, and a Classroom Checklist that assesses the presence of specific features or procedures observed in the classroom.
The assessment involves a classroom observation of at least 30 min during which observers tally the occurrence of discrete instructional or classroom behavior management practices (Strategy Counts), and take notes related to the lesson. Observers then complete two rating scales—the Instructional Strategies (IS) Rating Scale and Behavior Management Strategies (BMS) Rating Scale. For each item, observers rate the observed frequency of evidence-based strategy use and the recommended frequency of evidence-based strategy use on a 7-point Likert-type scale ranging from one 1 (never) to 7 (always). The IS Rating Scale contains 28 items divided among five dimensions that represent strategies in distinct aspects of instruction organized within two clusters: (a) instructional methods and (b) monitoring and feedback. The BMS Rating Scale contains 26 items divided among two clusters: (a) preventive methods and (b) behavioral feedback.
The scores produced by the IS and BMS Rating Scales are called discrepancy scores. Discrepancy scores are calculated by obtaining the absolute difference between ratings of the observed strategy use and the recommended strategy use for each item. Large discrepancies are indications of a greater need for change in a teacher’s practices, whereas small discrepancies are indications of teaching that made higher quality use of evidence-based strategies (i.e., less need for change).
Reliability and validity
Reddy et al. (2013) reported different forms of evidence for validation, such as internal consistency (Cronbach’s α of .91 for IS Rating Scale and .92 for BMS Rating Scale), interrater (92% agreement for the IS Rating Scale and 88% agreement for the BMS Rating Scale) reliability, and test–retest stability (r = .86 for the IS Rating Scale and r = .80 for the BMS Rating Scale). The IS and BMS Rating Scales are theoretically and factor analytically derived with confirmatory factor indices evidencing good fit, χ2/df < 2.0, root mean square error approximation (RMSEA) <.06, adjusted goodness of fit index (AGFI) >.80 (Jöreskog & Sörbom, 1986). Also, IS and BMS items varied similarly across teacher age, years of experience, or degree.
Convergent and discriminant evidence for CSAS scores has been found with classroom assessments such as the Classroom Assessment Scoring System (CLASS; Pianta et al., 2008; Reddy et al., 2013) and Danielson Framework for Teaching (FFT; Danielson, 2013; Reddy et al., 2019), as well as student ratings of the classroom environment using the Responsive Environmental Assessment for Classroom Teaching (REACT; Nelson et al., 2014, 2017). Also, CSAS scores have been found to predict state-wide assessments (Reddy et al., 2013) and observed student academic engagement, as measured by the Cooperative Learning of Classroom for Kids (CLOCK; Lekwa et al., 2019; Volpe & DiPerna, 2010).
CSAS training
Comprehensive training on the CSAS was provided to administrators by certified CSAS trainers. CSAS trainers received standardized CSAS training, met criterion for reliable administration, as well as had extensive experience implementing the CSAS in classrooms and training school personnel to use the CSAS. First, trainees were introduced to the purpose of the CSAS, its structure, and the procedures required for its completion. Second, trainees were oriented to the scientific knowledge base guiding the CSAS. Third, trainees received opportunities to practice CSAS observations on classroom videos and receive feedback from CSAS trainers. In sum, the training provided taught observers to use several sources to determine the Strategy Ratings of Observed and Recommended Frequencies. These sources included (a) the knowledge of effective teaching principles acquired during training, (b) the knowledge of how to score the CSAS strategies (provided via training), and (c) the notes/evidence recorded during the observation period. Observers match the notes/evidence recorded during the observation with knowledge of (a) and (b) to determine the Observed and Recommended Frequencies. This is similar to other observation assessments (CLASS, Pianta et al., 2008; Framework for Effective Teaching, Danielson, 2013), where observers match their notes and evidence to the rubric-based scoring system. Finally, all trainees passed a required reliability criterion test in which they completed the CSAS.
Procedures
Data were collected during the 2015–2016 school year. Student achievement in reading and mathematics was assessed in the fall of 2015 (September) and spring of (May) 2016 using MAP Reading and Mathematics (NWEA, 2011). Teachers in participating schools received three CSAS observations (at least 30 min each), and observational periods were generally completed in October/November, January/February, and April/May. The teacher CSAS scores were averaged across observations as part of summative evaluation procedures and used as predictors of student mathematics and reading achievement scores. Research has supported averaging scores of classroom observation tools to assess the relationship of classroom practices to student outcomes (e.g., Sandilos et al., 2019).
Data Analyses
Student achievement data in reading and mathematics were modeled separately. The reading data set consisted of the CSAS scores of those teachers who taught English/language arts and the MAP reading scores of their students. Likewise, the mathematics data set included only those teachers who taught mathematics and their students MAP mathematics scores. Teachers who provided instruction in both areas were included in both data sets with the respective data.
Inclusion criteria were set to ensure that each student was associated in the data with only one teacher. We required that students worked with the same teacher at least 45% of the school year, and we included only those teachers who were present for a substantial portion of the school year (at least 45%; in both reading and math samples, teachers were present an average of 99% of the school year), were directly responsible for mathematics or reading instruction, and were the sole providers of instruction in their classrooms (data from 41 classrooms were omitted from analysis because of coteaching arrangements). The reading data set included scores from 1,814 students and 74 teachers. The mathematics data set included scores from 2,134 students and 92 teachers. Thus, after inclusion criteria described above, the combined reading and mathematics data sets represented 2,188 individual students, and 110 individual teachers. Readers should note the difference in size between these two subdata sets was the result of school organizational characteristics (e.g., different use of coteaching between reading and mathematics).
Model specification
With rates of missing data below 2% in both reading and mathematics data sets, mechanisms of missingness were not regarded as potential sources of bias in results (e.g., Little et al., 2013). Full information maximum likelihood (FIML; Enders, 2001) estimation was used to account for missing data considered at least Missing at Random (MAR). An intraclass correlation (ICC) of .12 was found for MAP reading gain scores and an ICC of .13 was found for MAP reading proficiency scores. ICC estimates of .22 and .21 were found for MAP math gain scores and proficiency scores, respectively. Altogether, these numbers indicate that, approximately 12%–22% of students’ variation in MAP achievement scores occurs across teachers and that the expected correlation between the MAP achievement scores of any two students within a classroom is nontrivial. In addition, a design effect, which quantifies the effect of independence violations on standard error estimates, was 5.35 and 5.49 for MAP reading gain and proficiency scores, respectively; design effects of 7.99 and 7.83 were observed for MAP math gain scores and proficiency scores, respectively, indicating the need for multilevel models (Peugh, 2010).
Student achievement was modeled using two different scores from MAP, the Rasch Unit (RIT) scores and the CGI scores. The RIT scores are equal interval scale scores and indicate the estimated achievement of a child at the time of testing (i.e., spring). The CGI scores indicate academic growth from fall to spring in standard deviations below or above average (NWEA, 2011). For example, a student with a CGI of 0 displayed a gain identical to that predicted by NWEA 2011 growth norms; a student with a CGI of 1 displayed a gain that is one standard deviation greater than what was predicted by NWEA 2011 growth norms.
A series of five models was specified separately for both variables in reading and mathematics to analyze the unique and combined contributions of teachers’ IS and BMS discrepancy scores to predict students’ achievement scores (see Tables 1–2). Each CSAS variable was mean-centered prior to model entry. Model 1 was an unconditional model with no predictors and was conducted to provide a baseline against which subsequent models were compared. Model 2 included fall RIT scores and students’ grade levels as predictors. Model 3 included teachers’ total CSAS discrepancy scores and their interactions with students’ grade levels as predictors. Teachers’ IS discrepancy scores, along with their interaction with grade levels were added in Model 4 and teachers’ BMS discrepancy scores along with their interaction with grade levels were entered in Model 5. Similar models were conducted to predict students’ MAP CGIs.
Assessment of Instructional and Behavior Management Practices to Predict MAP Gains in Reading and Mathematics.

Note. MAP = Measure of Academic Progress; CSAS = Classroom Strategies Assessment System; IS = Instructional Strategies; BMS = Behavior Management Strategies; AIC = Akaike information criterion.
p < .05. **p < .01. ***p < .001.
Relative model fit was evaluated through comparisons of Akaike information criterion (AIC; Akaike, 1973) to determine empirical support for the observed data (Burnham & Anderson, 1998). Pseudo-R2 estimates (Magee, 1990; Nakagawa & Schielzeth, 2013) were calculated to provide additional descriptive information for the reading and mathematics models that demonstrated the best overall fit. All analyses were conducted in R version 3.1.3 (R Core Team, 2015); hierarchical linear models were analyzed using the “lme4” package (Bates et al., 2015).
Results
Students’ baseline levels of achievement in reading and mathematics, as measured by fall administrations of MAP reading and mathematics assessments, were highly consistent with national norms at each grade level (NWEA, 2011). Students in Kindergarten had an average fall MAP RIT score of 143 in reading and 138 in mathematics; students in third grade had an average fall MAP RIT score of 188 in reading and 189 in mathematics; students in sixth grade had an average fall MAP RIT score of 210 in reading and 213 in mathematics; students in eighth grade had an average fall MAP RIT score of 222 in reading and 231 in mathematics. There was an average CGI of .11 across grades for MAP reading (SD = .28) and an average CGI of .26 in MAP mathematics across grades (SD = .30). CSAS Rating Scale Total (IS + BMS) discrepancy scores were distributed similarly between the reading (M = 30.22, SD = 23.59) and mathematics (M = 28.01, SD = 22.14) data sets. Discrepancy scores for the IS Rating Scale in reading (M = 16.92, SD = 13.11) and mathematics (M = 15.55, SD = 12.29) data sets were similar, as were those for the BMS Rating Scale in the reading (M = 12.85, SD = 10.99) and mathematics (M = 13.31, SD = 11.92).
Results of two-level hierarchical linear models of NWEA MAP reading and mathematics CGI and RIT proficiency scores are displayed in Tables 1 and 2. Model assumptions were met through examination of descriptive and diagnostic plots. Random effects included intercepts estimated separately for each teacher and represent variation in gains in CGI or RIT score that are attributable to classroom membership. No differences in classroom level variation appeared between IS and BMS Rating Scale discrepancy scores and MAP reading or mathematics CGI scores, suggesting consistent relationships between the CSAS Rating Scale discrepancy scores and gains in reading and mathematics across classrooms.
Assessment of Instructional and Behavior Management Practices to Predict MAP Proficiency in Reading and Mathematics.
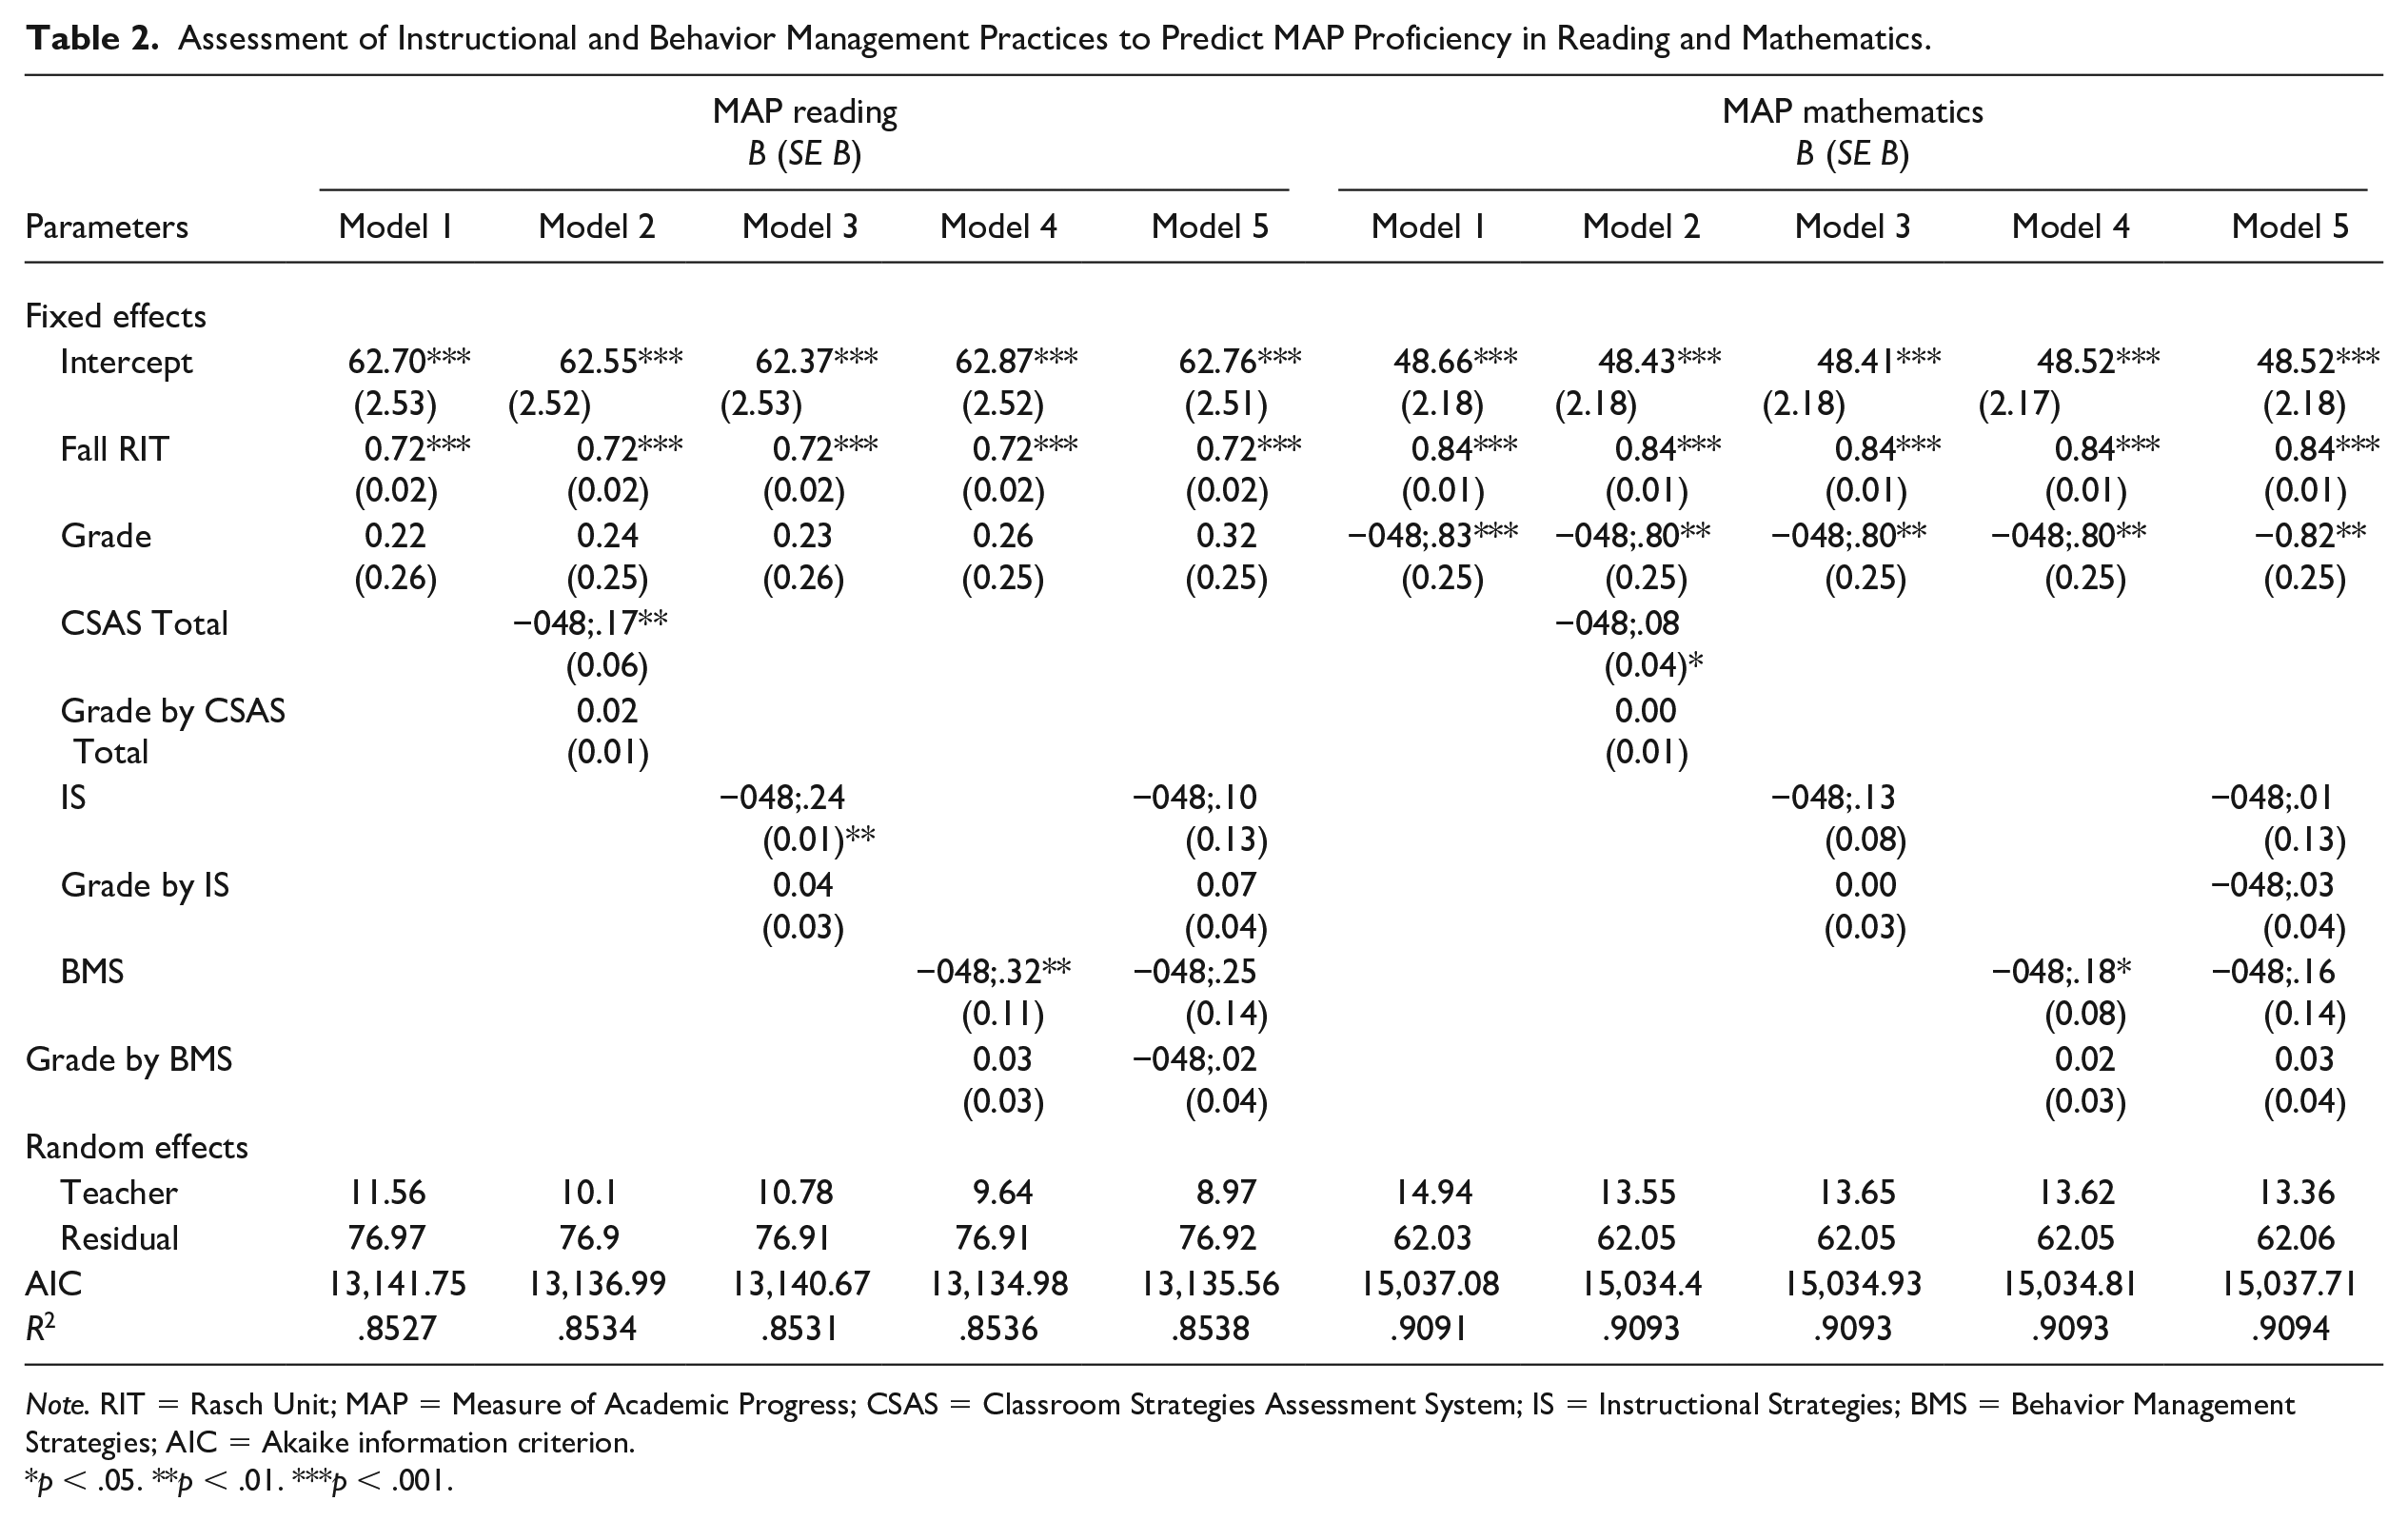
Note. RIT = Rasch Unit; MAP = Measure of Academic Progress; CSAS = Classroom Strategies Assessment System; IS = Instructional Strategies; BMS = Behavior Management Strategies; AIC = Akaike information criterion.
p < .05. **p < .01. ***p < .001.
Research Question 1: Classroom Practices Predicting Student Gains
As shown in Table 1, none of the three CSAS discrepancy scores (Total, IS, or BMS Rating Scales) were significant predictors of MAP reading CGI (MAP reading CGI Models 2, 3, or 4). Consequently, AIC values for each model indicated no substantial improvement over Model 1 (i.e., intercept). On the contrary, the IS and BMS Rating Scale Total discrepancy scores were significant predictors of MAP mathematics CGI (see MAP mathematics CGI Models 3 and 4). Both demonstrated improved fits over the null model (IS Rating Scale: ΔAIC = −3.29, R2 = .12; BMS Rating Scale: ΔAIC = −1.91, R2 = .12) and with AIC values differing by about one point offer similar empirical support. Thus, for a 1-point increase in IS or BMS Rating Scale discrepancy scores, the best fitting model predicted a decrease of about .02 MAP mathematics CGI. Model 5, IS and BMS Rating Scale Total discrepancy scores together, yielded a weaker fit, with neither predictor being statistically significant to MAP mathematics CGI.
Research Question 2: Classroom Practices Predicting Student Proficiency
To answer this question, students’ spring MAP reading and mathematics RIT scores were regressed on teachers’ averaged CSAS scores, controlling for fall reading and mathematics achievement scores and grade levels. Across all models in Table 2, fall MAP reading and mathematics RIT scores accounted for substantial proportions of variation in spring MAP reading and mathematics RIT scores. The BMS Rating Scale model was the best fitting model for spring MAP reading RIT scores (Table 2, Model 4), demonstrating a substantially improved fit relative to a null model (ΔAIC = −6.77, R2 = .85), and an AIC value more than two points lower than those obtained for models including CSAS Total (Model 2) or IS Rating Scale (Model 3). These findings show that each additional point in the BMS Rating Scale was associated with a reduction of .32 points in students’ average spring MAP reading RIT scores. A similar pattern emerged among models of MAP mathematics spring RIT scores: even though the model including the BMS Rating Scale, that is, MAP mathematics Spring RIT Model 4, was not the best fitting model, it demonstrated a similar amount of improvement over the null model (ΔAIC = −2.27, R2 = .91), and received nearly identical empirical support as those of Model 2 (i.e., CSAS Total) and Model 3 (CSAS IS Rating Scale).
Research Question 3: Classroom Practices and Student Proficiency Vary by Grade
We addressed Research Question 3 by including interaction terms between CSAS scores and students’ grade level (Table 2) and by comparing models with and without the interaction terms to evaluate change in model fit. None of the interaction terms yielded substantial changes in model fit, suggesting that the relationship between CSAS scores and student achievement is consistent across grade levels.
Discussion
Using a large sample of Kindergarten through eighth-grade teachers and their students, this investigation examined teacher observational assessment scores in relation to student growth and proficiency in 13 high-poverty charter schools in New Jersey. Findings offer evidence of CSAS discrepancy scores predicting students’ academic achievement as measured by MAP national normed indices of growth (CGIs) and proficiency (RIT scores). Specifically, CSAS scores were predictive of growth in mathematics, as well as predictive of spring status scores in reading and mathematics when controlling for fall status scores. Multilevel linear models were used to examine the degree to which scores from either scale alone, or both scales together, predicted student gains in reading and mathematics. The association between teachers’ IS and BMS discrepancy scores and achievement growth was stronger for mathematics than for reading. Interestingly, similar regression coefficients (i.e., −.02) were found for CSAS ratings of IS and BMS Total discrepancy scores, suggesting similar contributions to mathematic gains throughout a common school year.
Overall, the current study’s results offer evidence supporting the CSAS’s ability to predict student outcomes. In general, observational assessments tend to be only moderately correlated with student learning (Kane et al., 2011; Kane & Staiger, 2012). Although this study found that the CSAS accounted for a modest portion of the variation in MAP mathematics CGIs, these findings are slightly higher in magnitude than those reported in similar classroom observational research (e.g., McLean et al., 2016; Rogosa, 2002). In addition, the current study adds to the literature base supporting the CSAS as a predictor for student growth or gains in achievement (e.g., Lekwa et al., 2019; Reddy et al., 2019) through consideration of differing relationships across student age or grade levels. The current study’s results corroborate findings from other studies (Reddy et al., 2019) similarly investigating the ability of the CSAS to predict student growth, although these studies utilized student growth percentiles from a state mandated test (i.e., Partnership for Assessment of Readiness for College and Careers [PARCC]) instead of vertically scaled instrument designed specifically to enable direct measurement of growth (such as MAP).
Research by Lekwa and colleagues (2019) similarly examined the CSAS’ predictive relationship to MAP scores and found the Total CSAS discrepancy scores to predict both reading and mathematics student gain scores. Model fit for reading was improved with inclusion of the IS discrepancy scores, but not the BMS, whereas for mathematics, inclusion of the BMS discrepancy scores improved model fit but IS did not. In contrast, the current study found both the IS and BMS discrepancy scores as significant predictors of student’s MAP mathematics gains but not reading gains. The stronger results for mathematics compared with reading gains parallels previous predictive validity investigations of the CSAS using other achievement assessments (Reddy et al., 2019). This finding mirrors research on other well-known classroom observational assessments (Kane & Staiger, 2012) and may be explained by a variety of variables associated with levels and gains in student learning. For example, variations between classrooms or schools in the content of instruction have been associated with growth in student achievement (e.g., Rowan & Correnti, 2009; Sparapani et al., 2018; Taylor et al., 2002). Similarly, the degree to which instructional or behavior management strategies, as measured by the CSAS, relate to growth in student achievement could also depend variation in students’ attention to and participation in learning activities, which have been conceptualized as mediators or moderators of the relationship between teacher practices and student academic learning (e.g., McLean et al., 2016; Ponitz et al., 2009). Variations in either of these domains—curriculum or student engagement—might help explain different levels of association between measures of the qualities of teachers’ strategy use and rates of student learning in reading and mathematics.
A second way to address the contribution of scores from a teacher evaluation measure to student growth in achievement is to measure whether the scores add predictiveness to future scores (i.e., spring scores) within models that control for previous scores (i.e., fall scores). Addressed this way, discrepancy scores from the CSAS were predictive of proficiency scores in MAP mathematics and reading. Such findings are meaningful because the spring scores share similar properties to fall scores (i.e., same constructs, same method, same item bank) and scores from an indirect measure—such as a rating scale—focused on the teacher rather than the student may be disadvantaged in terms of finding a relationship that actually exists. Although effect sizes were small, added predictiveness of future test scores within a model that controls for previous test scores is supportive of the CSAS discrepancy scores. Finally, the association between teacher practices and student academic proficiency is consistent across Kindergarten through eighth grade. This finding is supportive of the current study and studies that similarly collapse scores reflective of teaching quality and student achievement into a single data set, assuming they are each reported on a common scale across grades.
Limitations and Future Research
Findings from this study include limitations and directions for future research. First, participant characteristics may limit generalizability of findings to other teachers, student populations, school contexts, regions, and states. Replication efforts are needed that utilize diverse samples, schools and regions. Second, because hierarchical linear models are conditional means models, it is likely the effect sizes may differ for students at the low and high end of the achievement distribution, warranting further investigation. The seminal work of Cronbach and Snow (1977) highlighted the possibility teacher effects may interact with students’ academic achievement and thereby amplify teacher effects for specific groups of students. Thus, future studies should consider using methodologies that are sensitive to capture potentially varying relationships between teacher effects and different levels of student achievement. Third, this study employed an assessment that measured evidence-based instructional and behavioral management practices which represent a range of strategies proven to be related to student outcomes. This study examined CSAS Total and composite scores (IS and BMS) and did not assess the associations of specific strategies (e.g., direct instruction, metacognitive strategies) on student achievement; these relationships also warrant future investigation. Finally, this study examined the relation of the assessment of classroom practices as rated by school administrators across observations to student achievement during a common year, and did not examine the associations of single observation scores on student achievement or patterns of change across observations, which are additional questions that warrant investigation.
Practical Implications and Conclusion
A central tenet in the teaching and learning literature is that effective teaching impacts student learning and behavior. Thus, research efforts examining assessment scores that purport to measure the teaching process should be related to student achievement. Such efforts are highly salient since school leaders can significantly influence teaching process components, particularly through classroom observation assessments to evaluate teacher effectiveness, provide teachers performance feedback, and enhance their professional growth. Hence, there is a need for assessments to demonstrate relationships to student learning outcomes. In the context of high-poverty schools, which struggle to retain high-quality teachers, and potentially utilize less effective teaching practices, such observational assessments can be used to promote teacher development, ensure effective instructional and classroom behavioral management strategies are being used, and maximize chances for students’ learning. Findings from this study suggest that qualities of practices vary between teachers, that quantification of these practices is reliably associated with growth in student achievement, and that this relationship is invariant across student grade levels. This is an important precondition for studying the usefulness of these data (i.e., CSAS discrepancy scores) in coaching processes (e.g., Reddy et al., 2020), which should target the teacher practices most likely to positively impact student outcomes, and should be transportable across contexts (such as grade levels) to promote feasibility or cost-effectiveness of implementation.
By way of example, some research contends that teachers working in high-poverty schools are more likely to employ procedural strategies focusing on basic instruction than conceptual teaching techniques such as higher order strategies known to prompt more advanced and deeper learning (Barr et al., 1983; Knapp et al., 1992; Smith et al., 2005). In contrast, other research asserts that students in lower socio-economic areas might lack experience tied to foundational skills, and therefore need explicit instruction and basic skills development (Muijs & Reynolds, 2005; Scheerens, 1992). Taken together, classroom observational assessments that demonstrate relationships with student outcomes, such as the CSAS, can be used by school leaders to promote effective classroom practices among their educators. In this regard, the current study’s findings offer evidence for the CSAS to be used in high-poverty schools to support teachers’ use of evidence-based instructional and behavioral management practices.
Footnotes
Authors’ Note
The current study was implemented as part of the School System Improvement (SSI) Project, a collaboration between multiple universities and charter schools funded by the U.S. Department of Education’s Office of Innovation and Improvement as part of the Teacher Incentive Fund program (awarded to Rutgers, The State University of New Jersey; #S374A120060). The positions and opinions expressed in this article are solely those of the author.
Declaration of Conflicting Interests
The author(s) declared no potential conflicts of interest with respect to the research, authorship, and/or publication of this article.
Funding
The author(s) received no financial support for the research, authorship, and/or publication of this article.