
Abstract
The 2015 Trends in International Mathematics and Science Study (TIMSS) involved 57 countries and 43 different languages to assess students’ achievement in mathematics and science. The purpose of this study is to evaluate whether items and test scores are affected as the differences between language families and cultures increase. Using differential item functioning (DIF) procedures, we compared the consistency of students’ performance across three combinations of languages and countries: (a) same language but different countries, (b) same countries but different languages, and (c) different languages and different countries. The analyses consisted of the detection of the number of DIF items for all paired comparisons within each condition, the direction of DIF, the magnitude of DIF, and the differences between test characteristic curves. As the countries were more distant with respect to cultures and language families, the presence of DIF increased. The magnitude of DIF was greatest when both language and country differed, and smallest when the languages were same, but the countries were different. Results suggest that when TIMSS results are compared across countries, the language- and country-specific differences which could reflect cultural, curriculum, or other differences should be considered.
Keywords
Introduction
Comparison of students’ educational achievement across countries has increased tremendously within the last decade. International assessment projects such as the Programme for International Student Assessment (PISA), Progress in International Reading Literacy Study (PIRLS), and Trends in International Mathematics and Science Study (TIMSS) have drawn the attention of both researchers and education policy makers because they provide empirical evidence about status of educational achievement for students in the participating countries.
Trends in International Mathematics and Science Study has grown over time in terms of the number of countries assessed and also in the linguistic and cultural diversity of the student population. In 1995, there were 45 countries that participated in TIMSS, and the tests were translated into 30 languages (Beaton et al., 1996). In 2015, 57 countries and 7 benchmarking entities (regional jurisdictions of countries such as states or provinces) participated in the study, and the tests were translated into 43 different languages. Thus, as the number of participating countries increases, so do issues of test translation.
At the national level, countries are responsible for translation and test adaptation processes based on the TIMSS guidelines (Ebbs & Korsnakova, 2016). The translation verifiers provide feedback to improve the accuracy of all instruments translated with respect to the source language, English. However, the results of TIMSS are evaluated within the context of the language and cultural diversity across the participating countries (Ercikan, 2002; Ercikan & Koh, 2005; Hauger & Sireci, 2008). In fact, there is some mistrust about the fairness of results from international assessments because translating a test from its original language to a target language does not necessarily result in two psychometrically equivalent tests (Allalouf et al., 1999; Angoff & Cook, 1988; International Test Commission, 2018; Sireci, 1997). Thus, the issue of fair comparisons across countries involved in an international assessment has drawn the interest of researchers for many years. In general, such fairness has been studied within the framework of differential item functioning (DIF) analysis. DIF studies in such assessments have focused on comparing methods or procedures (Bertrand & Boiteau, 2003; Oliveri et al., 2012), detection of DIF items (Babiar, 2011; Arim & Ercikan, 2014; Ercikan et al., 2014; Yıldırım & Berberoğlu, 2009), comparability of scores of students from different language backgrounds (Ercikan et al., 2015; Hauger & Sireci, 2008), examination of construct comparability (Ercikan & Koh, 2005; Oliveri & Ercikan, 2011), and investigating the sources that cause DIF in the international assessment projects (Ercikan, 2002).
Language and cultural diversity have been suggested as important factors to consider when interpreting TIMSS results. For example, Ercikan and Koh (2005) analyzed TIMSS 1995 data and reported substantial levels of DIF across different countries and across different language groups within a country. For example, in comparing students who took English or French versions of the exams in Canada, 14% of the mathematics and 37% of the science items exhibited DIF; and in comparing England versus France, 39% of the mathematics and 39% of the science items exhibited DIF. The levels of DIF were also large in a United States–France comparison (38% of the mathematics and 79% of the science items displayed DIF). Their study suggested that as the cultural and language diversity increased, so too did the number of DIF items. Arim and Ercikan (2014) found similar results when analyzing data from TIMSS 1999 focusing on DIF across the United States and Turkey. Approximately 23% of the mathematics items were flagged as DIF. With respect to within-country differences, Hauger and Sireci (2008) evaluated DIF with respect to whether the language of the test was the student’s native language using TIMSS 1999 data. They looked at two countries who administered the test in English (United States and Singapore) and one country who administered the test in Farsi (Iran). Unlike the between-country comparisons, they found no meaningful DIF across students who were native speakers of English or Farsi and those who were not.
Most previous literature on “translation DIF” 1 in international assessments has focused on a handful of selected countries. In contrast, Grisay et al. (2009) evaluated the deviation of item difficulty parameters from each country that participated in PISA and PIRLS reading assessments, from the “international” item parameters using the global population. Although they found a large commonality across the global and country-specific item difficulty parameters, and only a modest level of DIF on average (about one-third of a logit), they also noted higher magnitudes of DIF for the non–Indo-European language translations such as Arabic, Indonesian, Chinese, Finnish, Hebrew, Hungarian, Japanese, Korean, and Turkish.
The Grisay et al. (2009) study underscores the need to evaluate DIF across countries that differ with respect to language and suggests that languages that are more “distant” from each other (e.g., Korean vs. English, as opposed to Spanish vs. Italian) are more likely to result in DIF when test items are translated. For this reason, there is a need to evaluate DIF within TIMSS across countries where languages are similar and dissimilar. In addition, it will be useful to compare the magnitudes of DIF observed in these comparisons with the magnitudes of DIF that are observed on items administered in the same country, but in different languages. Although “language” does not substitute for “culture,” it may be more likely that students in the same country who operate in different languages may be exposed to more similar curricula than students from different countries.
Essentially, by looking at “translation DIF” both within and across a variety of countries (and language groups within countries) in TIMSS, we can evaluate the hypotheses generated from the literature: (a) translations that involve comparisons across languages from different language families will exhibit greater DIF than translations across languages from a common language family, and (b) translations involving different language comparisons in a single country will exhibit less DIF than translations involving different languages across countries. That is, we are comparing students’ performance based on language groups both within and across countries. Thus, the major hypothesis of the study is having more differences in languages and countries would lead to more DIF.
The specific research questions investigated in this study are as follows: Is the magnitude of “translation” DIF larger in comparisons involving languages from different language families relative to comparisons involving the same language family? Is the magnitude of “translation DIF” larger when the comparisons are conducted across countries than when they conducted within a single country? Is there an interaction between language family and national/international comparisons of translation DIF?
In addition to addressing these three research questions, we also illustrated several methods that can be used to evaluate translation DIF across a large number of countries and languages. Thus, the present study also advances methods and practices in analyzing international assessment data.
Method
Data
The data for this study come from the 2015 TIMSS eighth-grade mathematics assessment. The assessment involved 57 countries and 43 different languages. We selected different countries, and languages within countries, to focus on three sets of comparisons.
Samples selected
The first comparison, named as “same language, different countries,” focused on different countries that administered TIMSS in the same language. This comparison group included Australia, England, New Zealand, and USA all of whom administered TIMSS only in English. This comparison holds language constant, but the countries are different. Thus, curricula, and to some extent culture, may vary across these groups.
The second comparison focused on countries that administered TIMSS in more than one language. This “same country, different languages” group included Canada and the United Arab Emirates (UAE). Although there were other countries that administered TIMSS in more than one language, we included only countries with sample sizes of at least 250 students per test booklet and only Canada and UAE satisfied that requirement. The students in Canada responded to either English or French versions of the test, and the students in the UAE responded to either English or Arabic versions of the test. Both French and English are Indo-European languages, whereas Arabic belongs to the Semitic language family. Thus, this comparison presumably compares the language differences where the culture is rather more similar compared to the previous group.
Languages and Countries/Benchmarking Participants Compared in “Different Languages, Different Countries” Comparison.
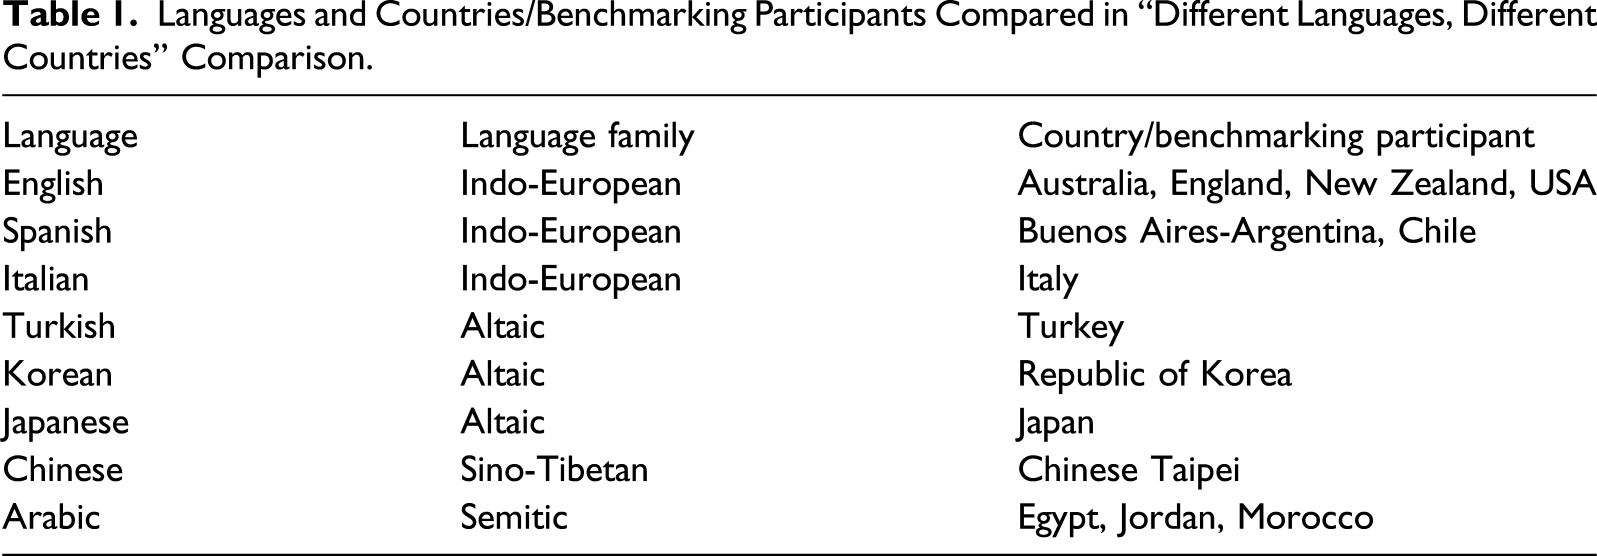
As indicated in Table 1, our analyses involved the Indo-European languages of English, Italian, and Spanish; the Altaic languages of Turkish, Korean, and Japanese; the Semitic language of Arabic; and the Sino-Tibetan language of Chinese. The languages in the same family have significant number of common features in semantics, syntax, morphology, and phonology (Eifring & Theil, 2005).
TIMSS assessment
Since the TIMSS project compares countries with different languages, the translation and adaptation of the test items are import issues during the process. Test translation and adaptation processes are actualized through multiple steps to ensure the translated versions of the instruments are as equivalent as possible to the source languages such as English and Arabic which were developed by the TIMSS and PIRLS (International Study Center and International Association for the Evaluation of Educational Achievement (IEA); Ebbs & Korsnakova, 2016). The translation or adaptation of the instruments is the responsibility of the participating countries in line with the test translation guidelines and standards provided. Once the translated versions of the instruments are available, the verification process starts with the external reviewers (Ebbs & Korsnakova, 2016).
Sample Sizes of Comparison Groups.
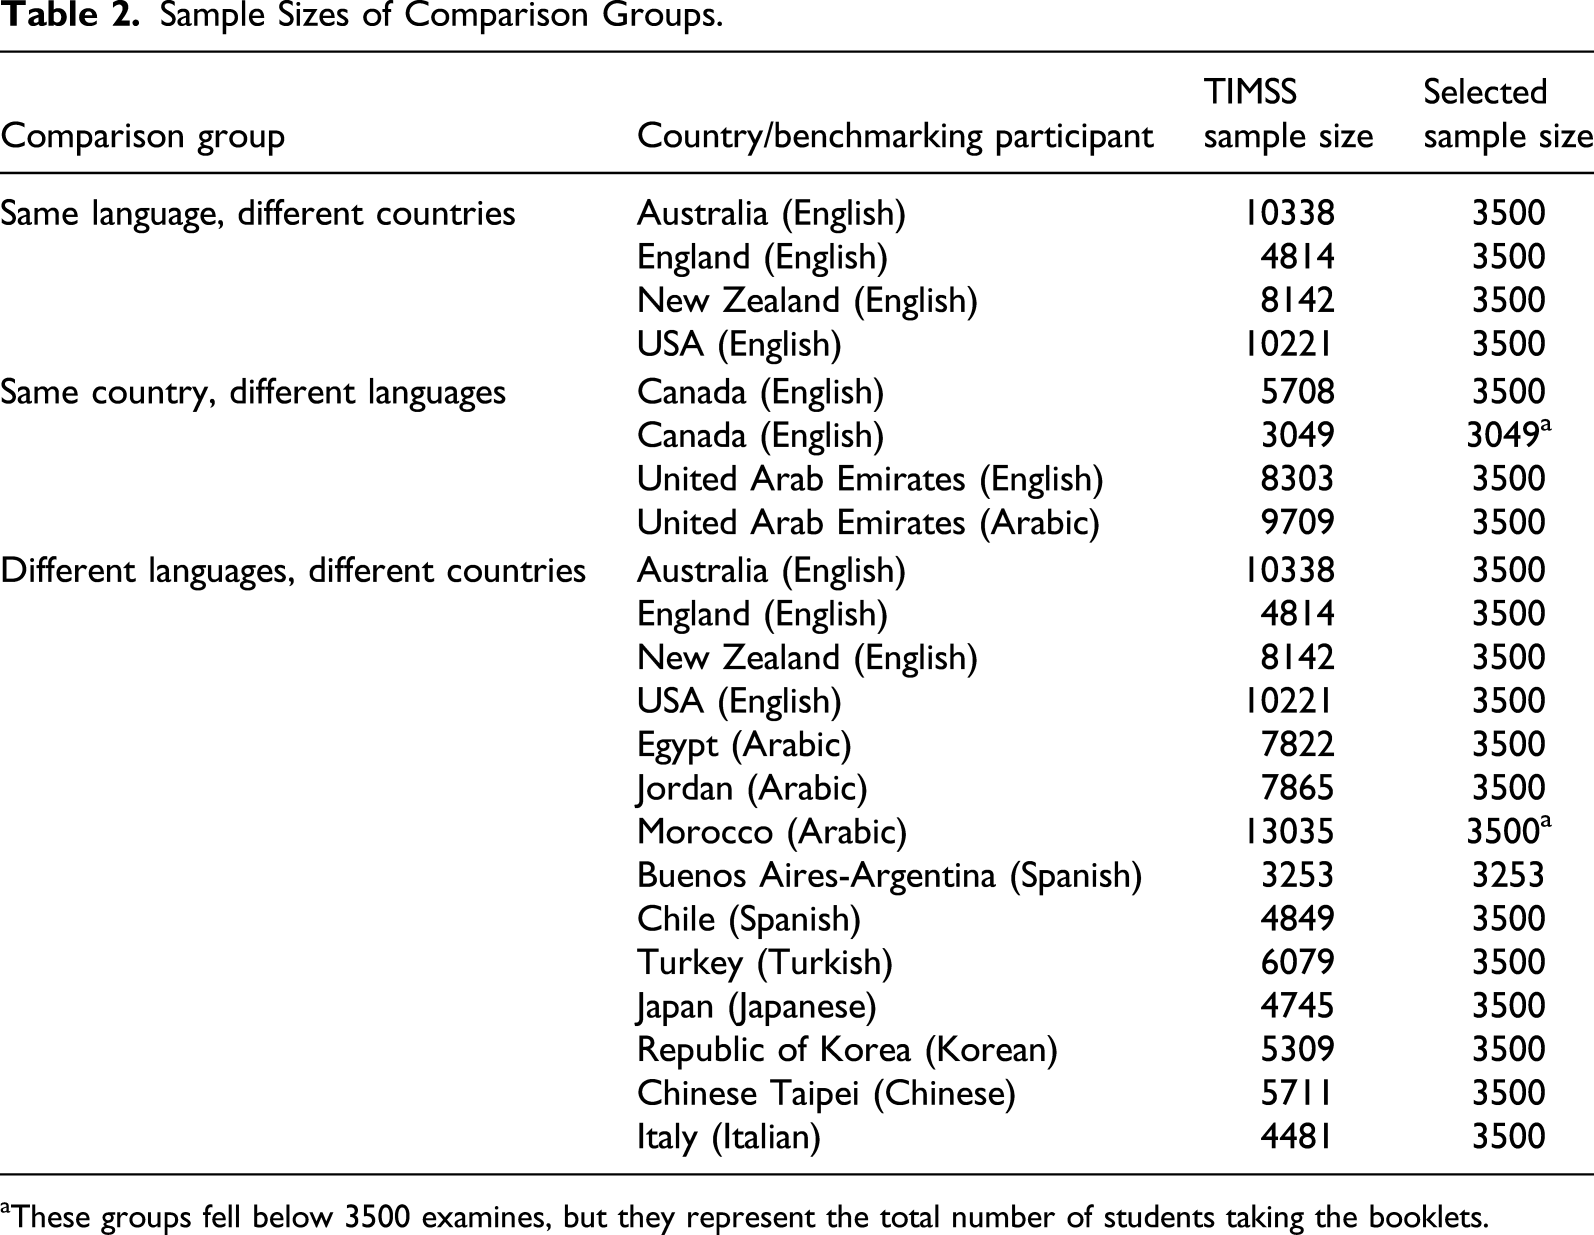
aThese groups fell below 3500 examines, but they represent the total number of students taking the booklets.
Data analysis
As explained earlier, we focused on comparisons and analyses of DIF across three conditions: (a) same language, different countries, (b) same country, different languages, and (c) different languages, different countries. First, items were separately calibrated for each country using the one-parameter logistic (1PL) item response theory (IRT) model via BILOG-MG (Zimowski et al., 2003). Then, rescaling was conducted to place the results on a common scale based on the mean/sigma method (Marco, 1977). The 1PL IRT model was used because we were primarily interested in item difficulty and were not confident that item discrimination or lower asymptote parameters could be reliably estimated given our sample sizes of 500 examinees per item.
To detect DIF, Lord’s chi-square (1980) DIF method was used. For the 1PL model, Lord’s chi-square test statistic is computed as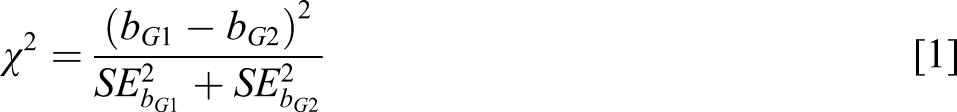
An advantage of using Lord’s chi-square for the 1PL model is that it has a convenient and interpretable effect size that is connected to ETS delta metric. Using this delta effect size measure, items can then be classified into A (negligible), B (moderate), and C (large) DIF categories. If the absolute value of the delta effect size is 1.5 or greater, then these items are classified as C (large) DIF. If the effect size is not significantly different from 0 or less than 1.0 in absolute value, then these items are classified as A (negligible) DIF. All the remaining items are set as B (moderate) DIF (Dorans & Holland, 1993). In our study, items were only considered to exhibit DIF if the findings were statistically significant and the delta effect size was at the B or C level. This focusing on effect size helped protect against conclusions of DIF due to type I errors.
The difLord function from the difR R package was used to perform the Lord’s chi-square DIF procedure. A two-step purification procedure was implemented to help mitigate the effect of the DIF items on computing the linking constants (Zenisky et al., 2003). An alpha level 0.01 was used to flag items as statistically significant.
For each of the three conditions, all the DIF analyses were carried out pair-wise across the countries within each group. Since some of the languages were formed by the data of two or more countries for the third condition, we calculated the average values for the DIF results across countries. For example, while comparing English and Arabic language results, we averaged the DIF results across all 12 comparisons across the countries involved in English/Arabic DIF (see Table 2). Collapsing across countries loses the variability due to countries and instead focuses on the language.
The number of DIF items and the direction of DIF were evaluated for each of the three conditions as the first step of the analyses. In the second step, we evaluated the magnitudes of DIF indexes obtained for all 202 items across three conditions. For this purpose, the means of Lord’s chi-square values obtained for 202 items were compared using a dependent (repeated measures) ANOVA.
As a final step in the analyses, to visually inspect the overall magnitude of the DIF at the total test score level and to assess whether item-level DIF may be balanced (i.e., cancel out) or imbalanced (i.e., favoring one group) when considering all items simultaneously, the test characteristic curves (TCCs) for each country were compared across the three conditions. This analysis helps understand if there were any effect of DIF on test score comparisons across the countries. The TCCs were obtained by summing up all the 202 item characteristic curves, using the item parameters that were calibrated separately for each country, and then placed on a common scale using the mean/sigma method (Marco, 1977). Then, they were divided by 202 (i.e., the number of total items). This conversion produced the graphs of TCCs with the metric in between 0 and 1 which is interpreted as the probability of correct response rate at a given proficiency level. Presumably, if there is any difference between the TCCs of any two countries, this might be the result of DIF obtained in paired comparison. The TCC analysis allowed for a visual inspection of the magnitude and direction of the overall impact of DIF, if any.
Results
The results of the analyses are presented with respect to the (a) number of DIF items, (b) direction of DIF, (c) magnitude of DIF, and (d) TCCs for each of three sets of comparisons.
Number of DIF items
Figure 1 illustrates the number of DIF items for the paired comparisons across the countries in same language, but different countries group. Number of differential item functioning items in “same language, different countries” comparison.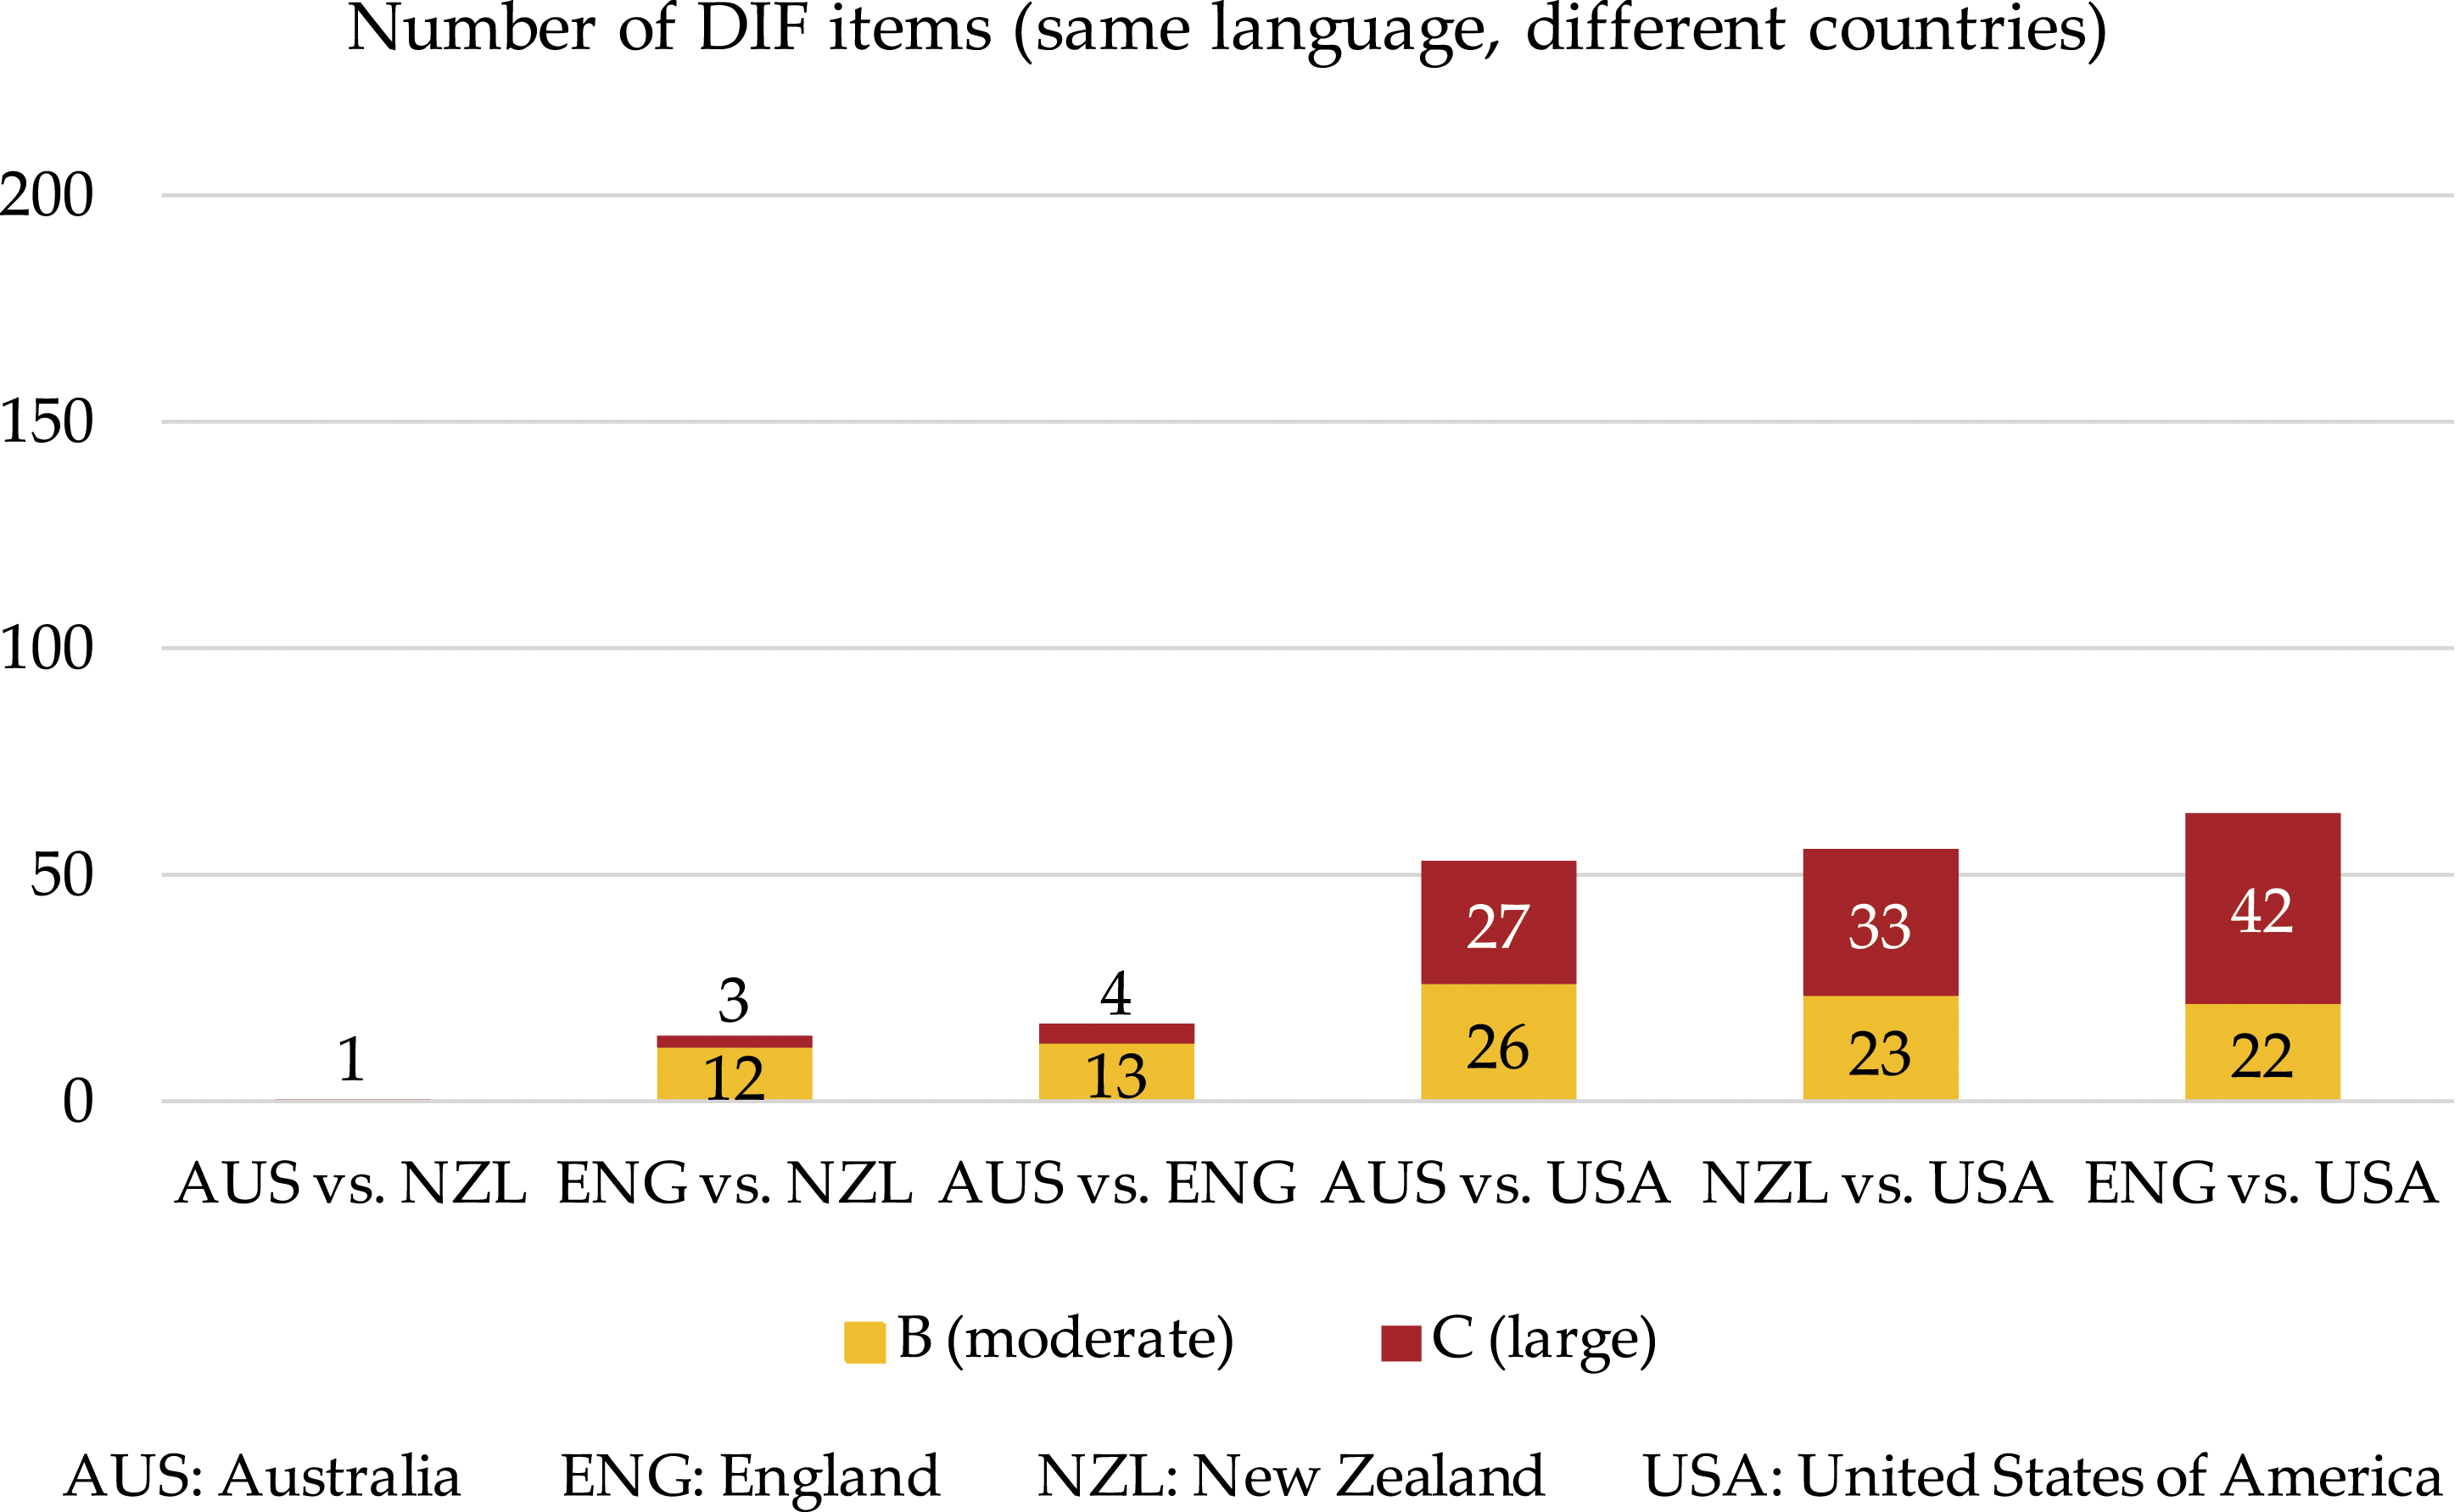
In the “same language, different countries” comparison, the language of the test was controlled by comparing the countries administering the same English version of the tests. There was considerable variation across the paired comparisons. As is seen in Figure 1, there is only one item flagged as DIF in the Australia and New Zealand comparison, whereas the number of C level DIF items in England and USA comparison was 64. Even when the language of the test was held constant, there are considerable numbers of DIF items in some of the paired comparisons, but not in others, suggesting culture or curricular differences play a role in affecting item functioning. It is interesting that the comparisons involving the United States exhibited the most DIF, suggesting “USA English” may be more culturally different than English used in the other three countries, or that the curriculum in the United States is more different from the other English-speaking countries than the curricula in the other countries are from one another.
In Figure 2, we present the number of DIF items for the “same country, different languages” group. As shown in Figure 2, almost one-fourth of the items were flagged for DIF across the different languages. However, in English versus Arabic comparison there are relatively more items flagged as DIF, compared to English versus French comparison. Number of differential item functioning items in “same country, different languages” comparison.
In Figure 3, we present the DIF results for the “different countries and languages” comparison. The results illustrate that as the languages and countries get more different, more items are flagged for DIF. For instance, in the Spanish and Italian comparison, 38 items were flagged for C level DIF (19%), but for the Arabic and Japanese comparison,112 items were flagged for C level DIF (55%). The three comparisons with the highest number of DIF items were Arabic versus Korean, Arabic versus Chinese, and Arabic versus Japanese. Number of differential item functioning items in “different languages, different countries” comparison.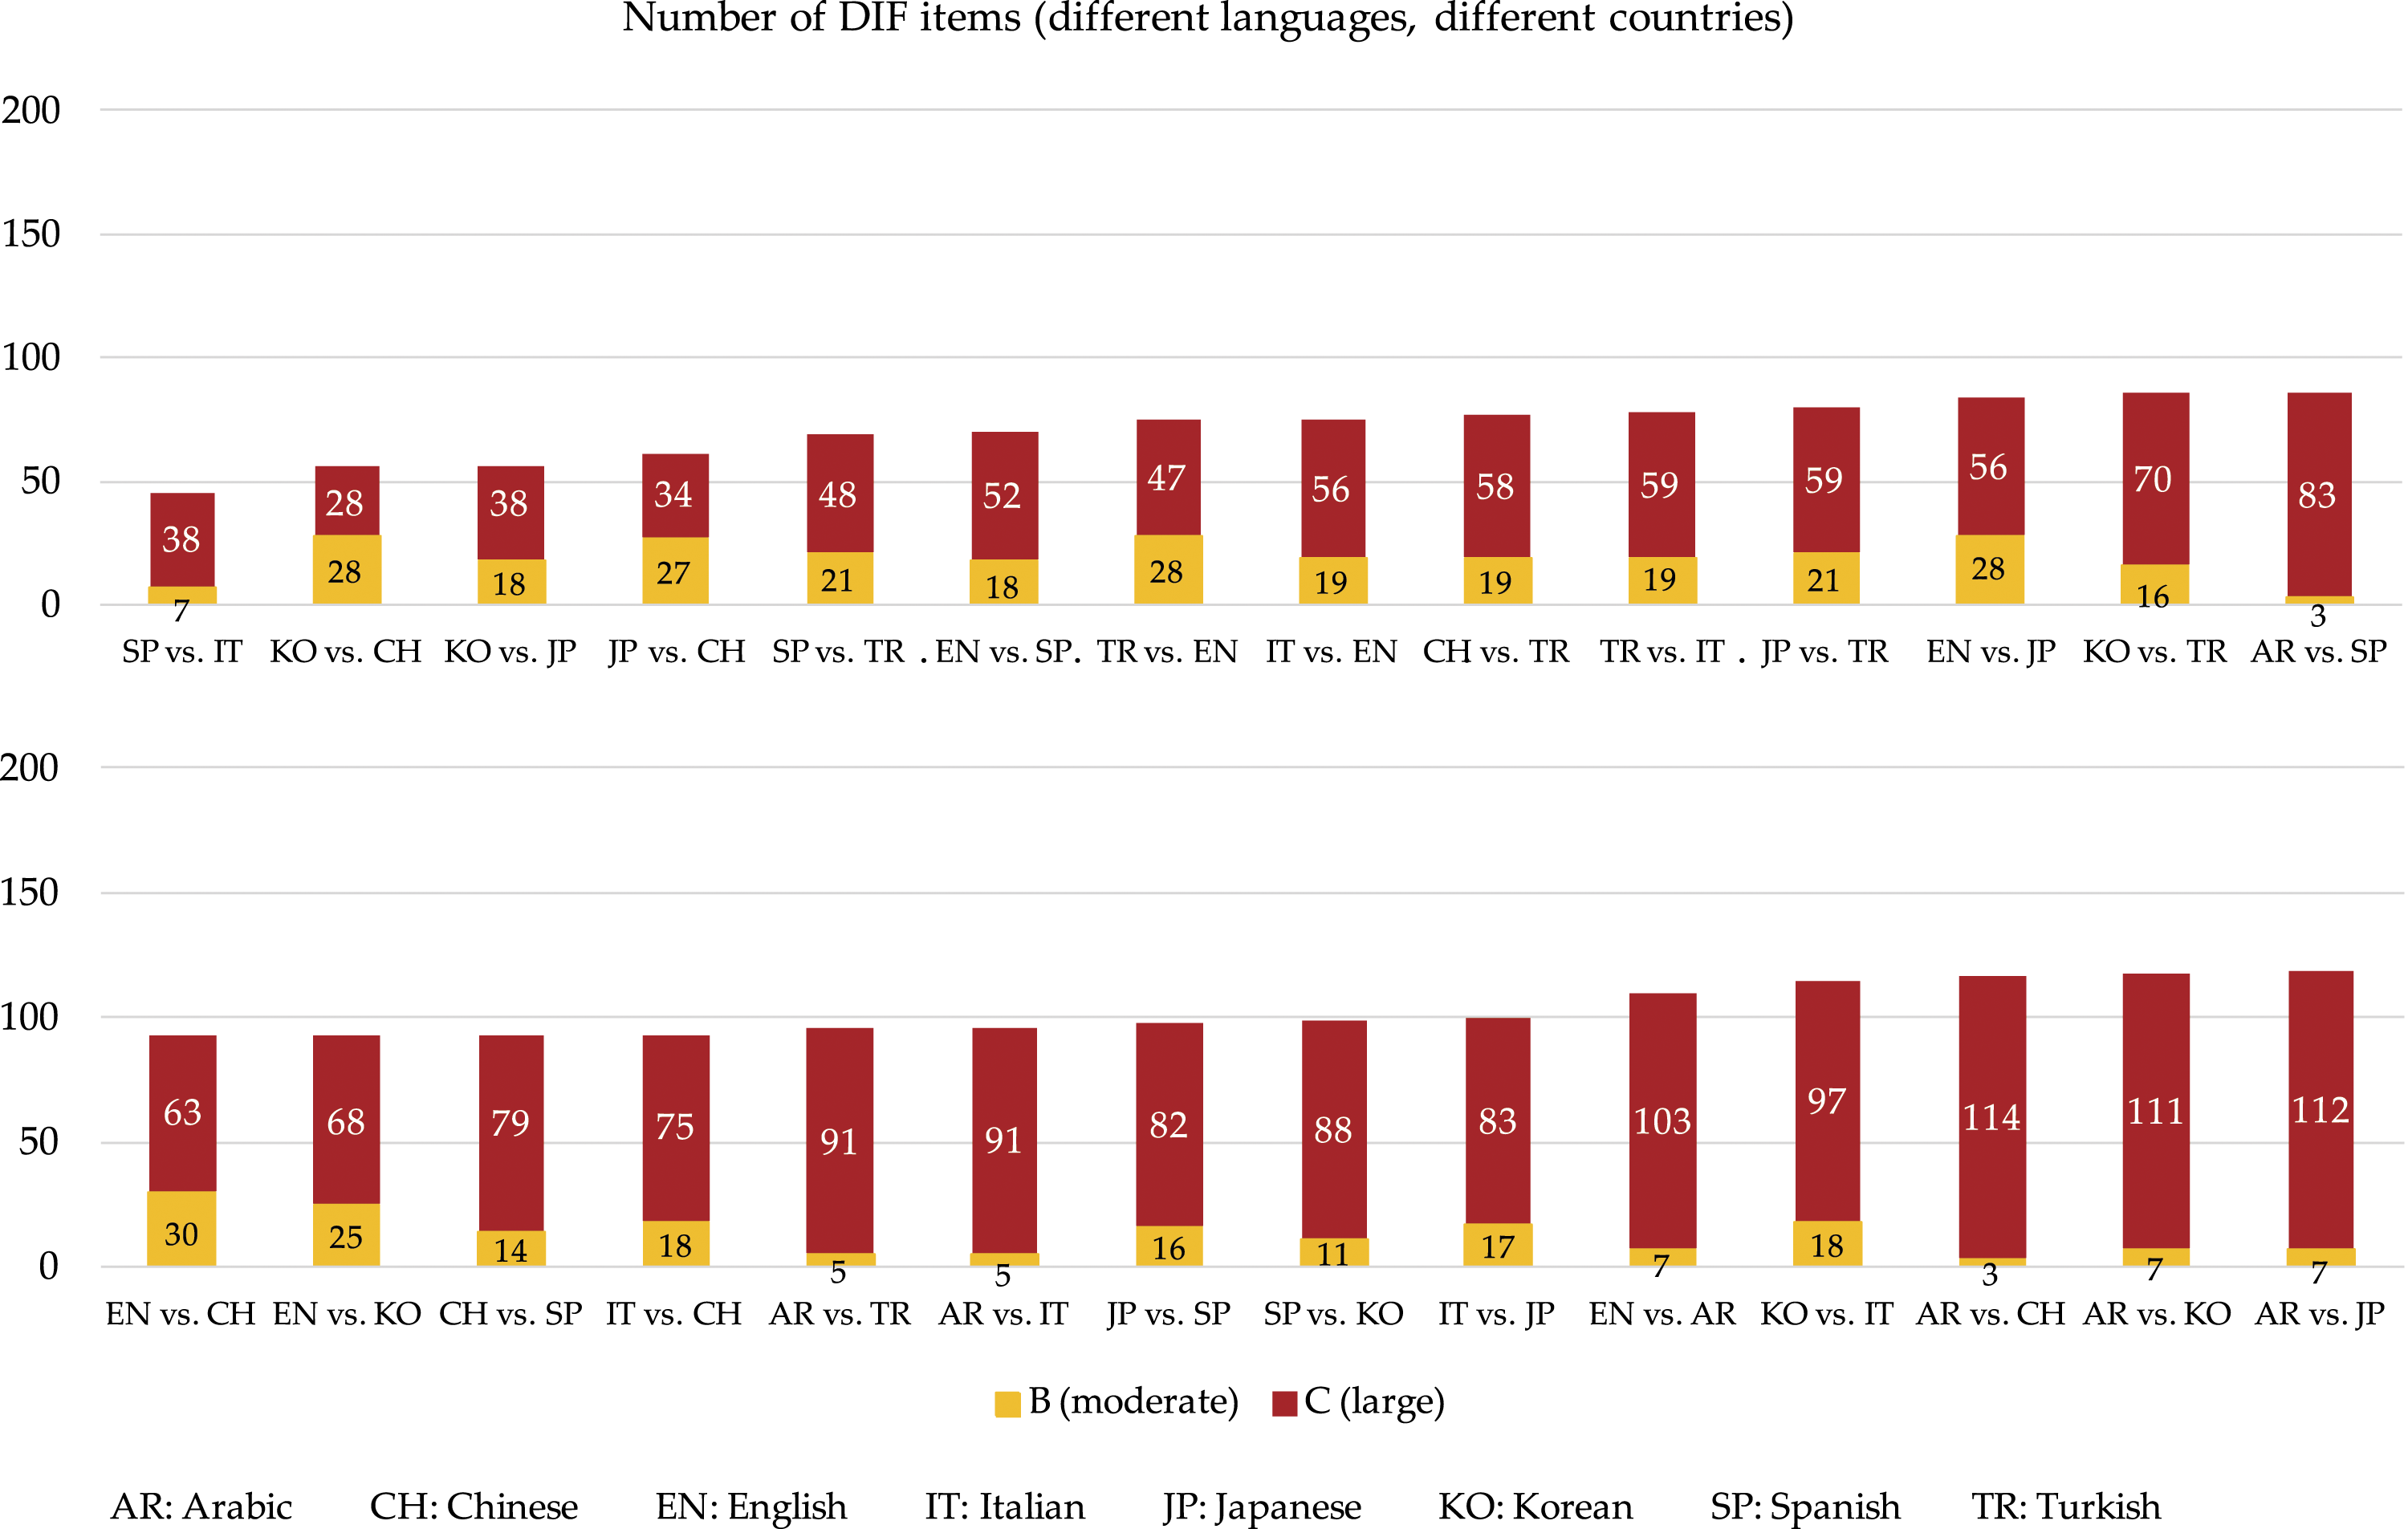
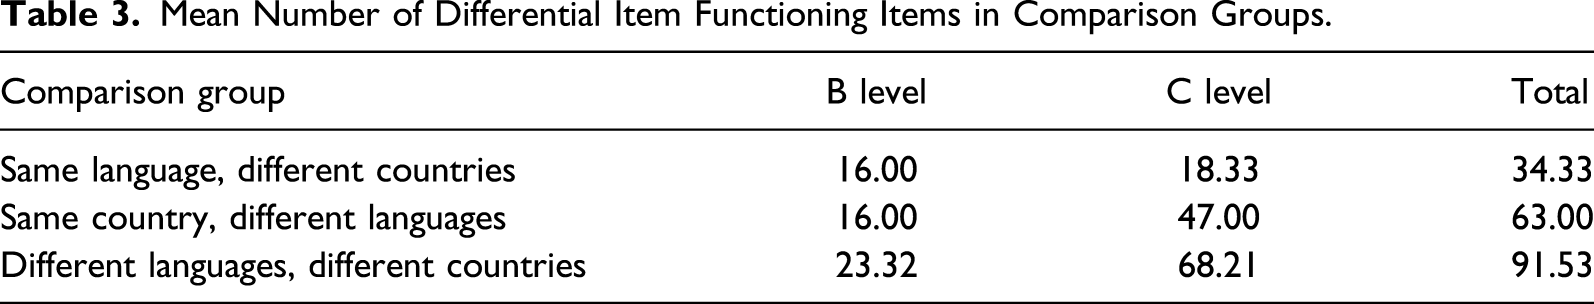
Mean Number of Differential Item Functioning Items in Comparison Groups.
Direction of DIF
In this section, we analyzed the amount of DIF favoring each paired comparison. Figure 4 indicates the percentages of items favoring the countries for each paired comparison for the “same language, different countries” comparison. If an item favors a country, it means that students in this country have greater probability of correct response on the item than students in the same ability level from the comparison country. The percentages in Figure 4 present the ratio of items favoring the students in the particular country. Direction of differential item functioning in the “same language, different countries” comparison.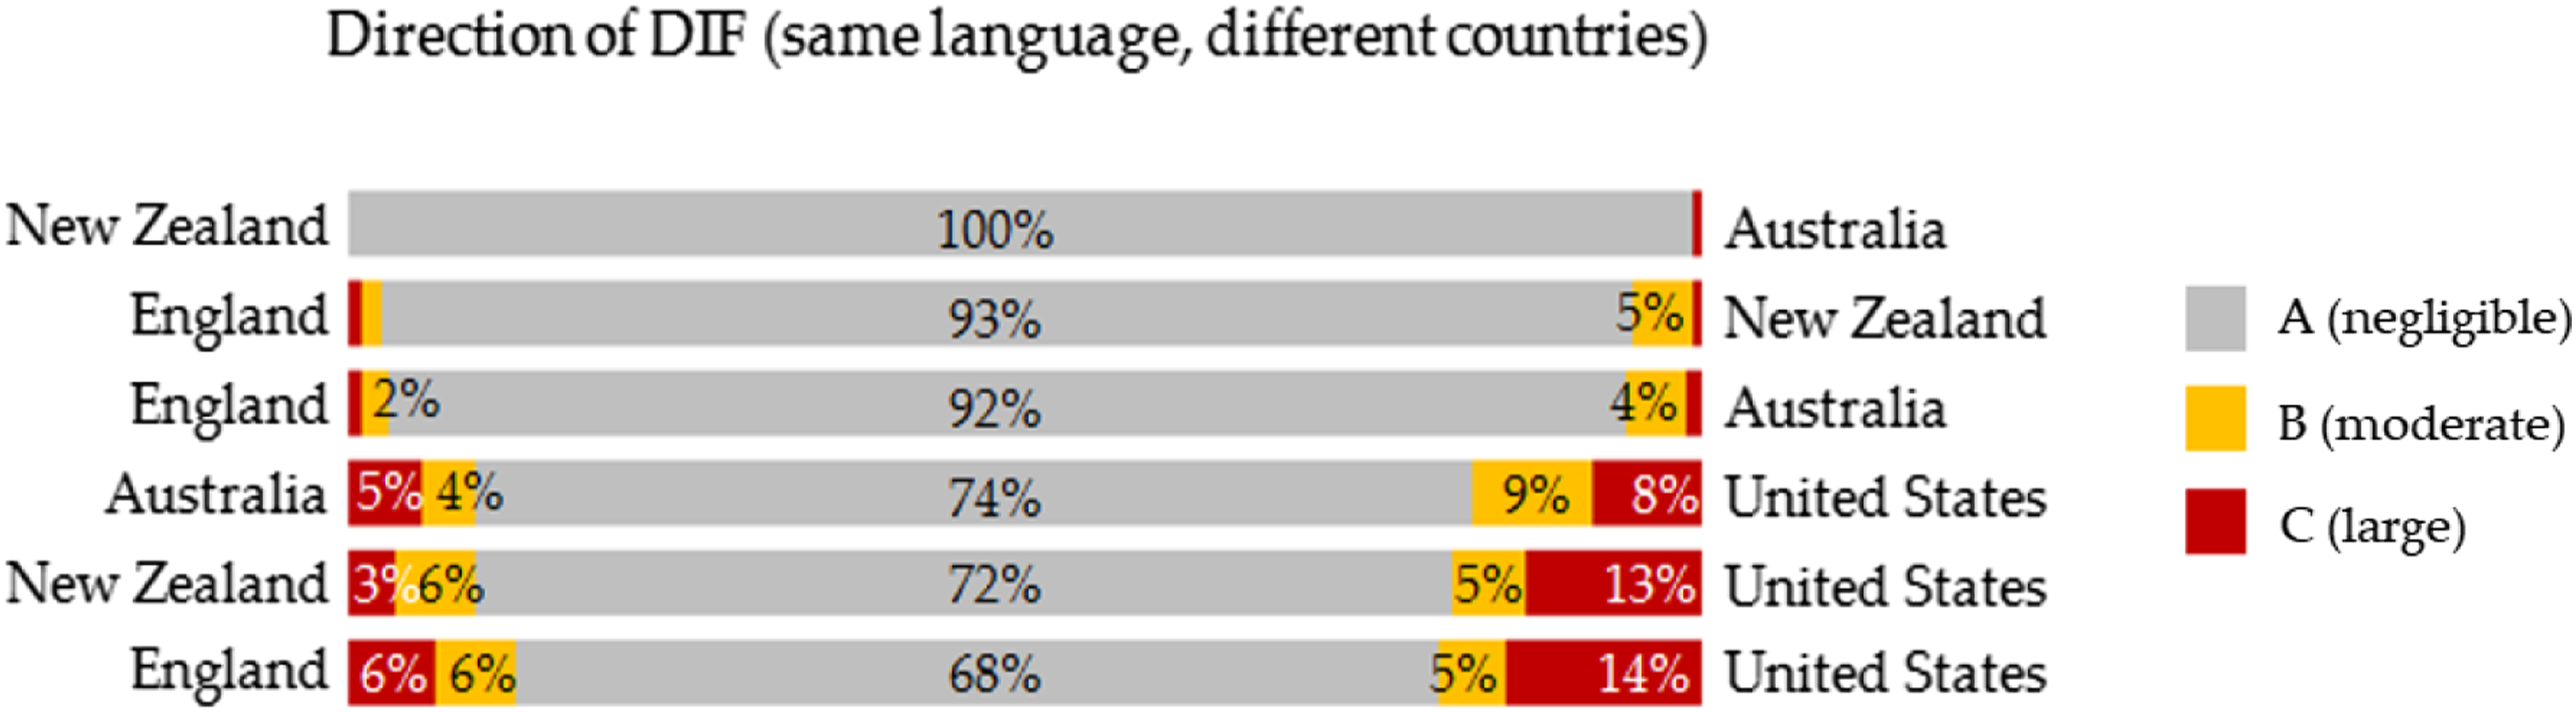
The length of the bars representing the B- and C-level DIF can be used to evaluate the “imbalance” of DIF across countries. Figure 4 indicates the imbalance in the percentages of items favoring the countries. When C-level DIF is considered, the greatest imbalance is observed for the USA versus New Zealand comparison with fewer items favoring students in New Zealand.
Figure 5 indicates the percentages of items favoring the countries for each paired comparison for the “same country, different languages” comparison. The percentages next to each country represent the percentages of items flagged for DIF that favored the students in that country. As seen in Figure 5, the imbalance is noted in the English versus French comparison (English favored more) and in the Arabic versus English comparison (Arabic favored more). Direction of differential item functioning in the “same country, different languages” comparison.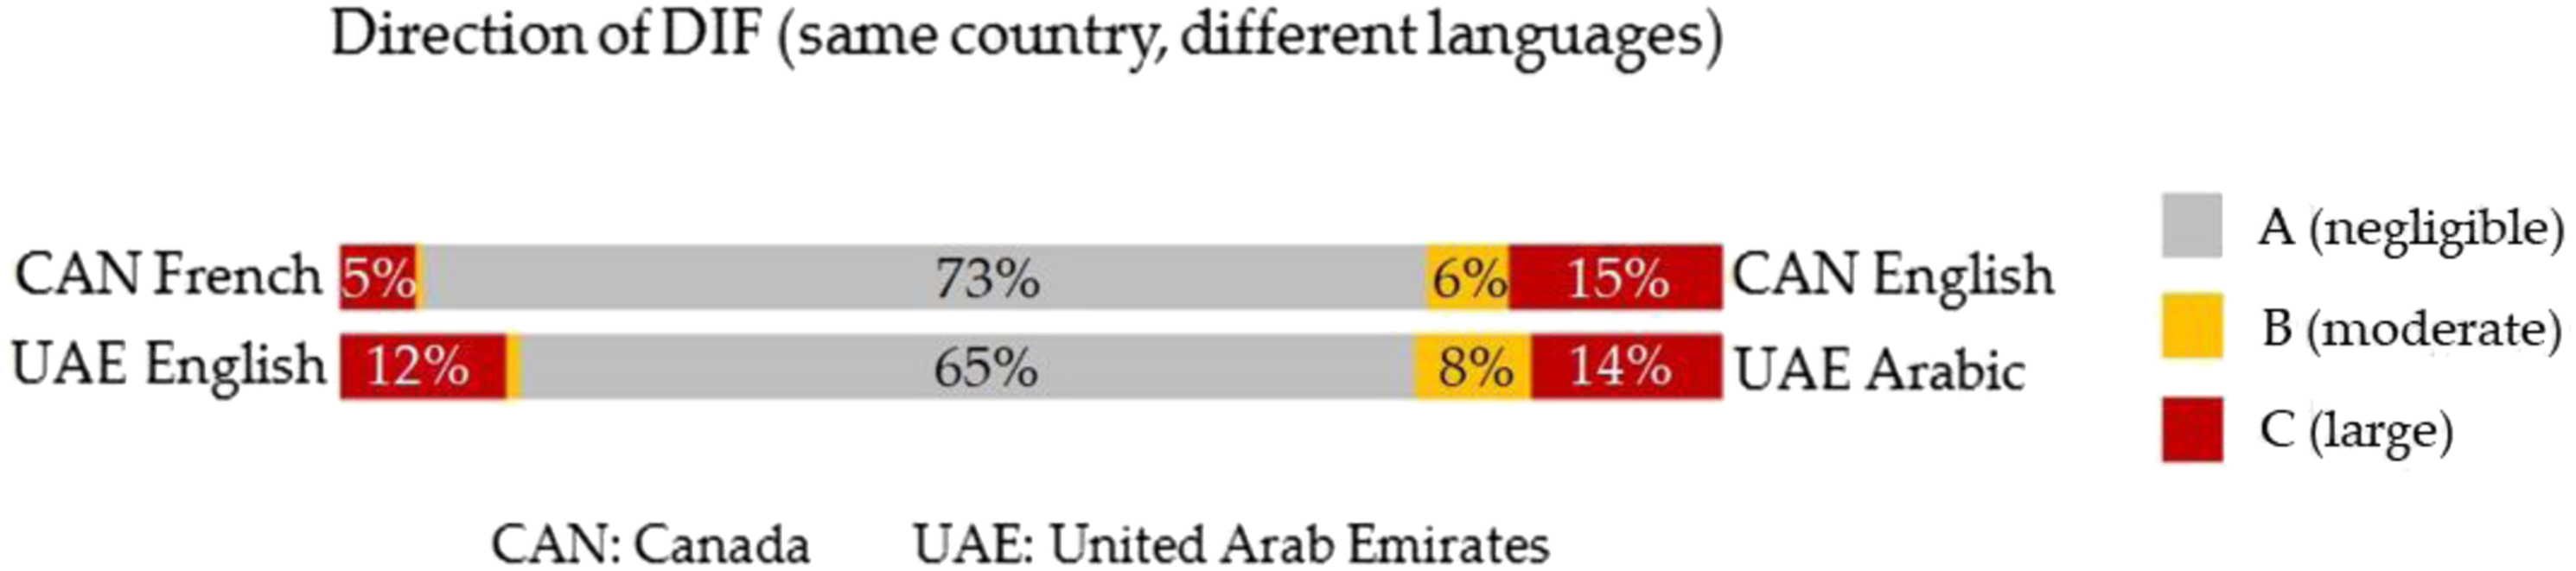
Figure 6 illustrates the percentages of items favoring the countries for each paired comparison for “different languages, different countries” comparison. In this figure, the countries listed on the right side have a larger magnitude of DIF (favoring that country) than the countries on the left side. The greatest imbalance is observed in the Turkish and Arabic versions. The percentage of C-level DIF ranges from 13% to 27% among Indo-European languages, and from 24% to 48% across Indo-European and non–Indo-European languages. This difference is consistent with our hypothesis that more DIF will be observed across different language families relative to languages within the same language family. Interestingly, in some cross-language family comparisons (i.e., Japanese vs. Chinese, Turkish vs. English, and Korean vs. Italian), although the magnitude of DIF is large, it is relatively balanced across groups (i.e., there are equal numbers of C-level DIF items favoring each group). Direction of differential item functioning in “different languages and different countries” comparison.
Number of DIF items
The number of DIF items and their directions are important for evaluating the language and country differences interfering with students’ responses, but at the same time, the magnitudes of the chi-square values can provide further clues about the effect of diversity of language and country on the item-level performance of the students. Thus, in addition to evaluating the magnitude with respect to the A, B, and C effect size criteria, we also compared the means of Lord’s chi-square indexes across the three conditions using repeated-measures ANOVA. The means of Lord’s chi-square values for three conditions were 8.3, 13.0, and 25.2, across the same language/different country, same country/different language, and different language/different country comparisons, respectively. This pattern of differences is consistent with our hypothesis that as language and country differ together, more DIF will be observed. The results of the repeated-measures ANOVA indicated a significant overall difference across the three conditions, and the effect size for the difference was large [Wilks’ Lambda = .532, F (2,200) = 91.350, and p < .001]. The partial eta square, that is, a measure of effect size, was calculated as .48 indicating that this significant difference has some practical value. The post hoc analyses between the conditions also provided significant results between the same language, different countries versus different languages, different countries [F (1,201) = 180.560, p < .001] and same country, different languages versus different languages, different countries [F (1,201) = 76.652, p < .001] with .48 and .28 partial eta square values, respectively.
Comparisons of TCCs
To determine whether there is any effect of DIF on the total scores across all items (i.e., an imbalance of DIF favoring one group overall), the TCCs were created and compared for the countries considered under each condition. For three conditions analyzed, these results are presented in Figures 7–9. Given the overlap among the TCCs, at the bottom of each figure, we graph the magnitude of the difference between the two most different TCCs. Test characteristic curves of “same language, different countries" comparison. Test characteristic curves of “same country, different languages” comparison. Test characteristic curves of “different languages, different countries” comparison.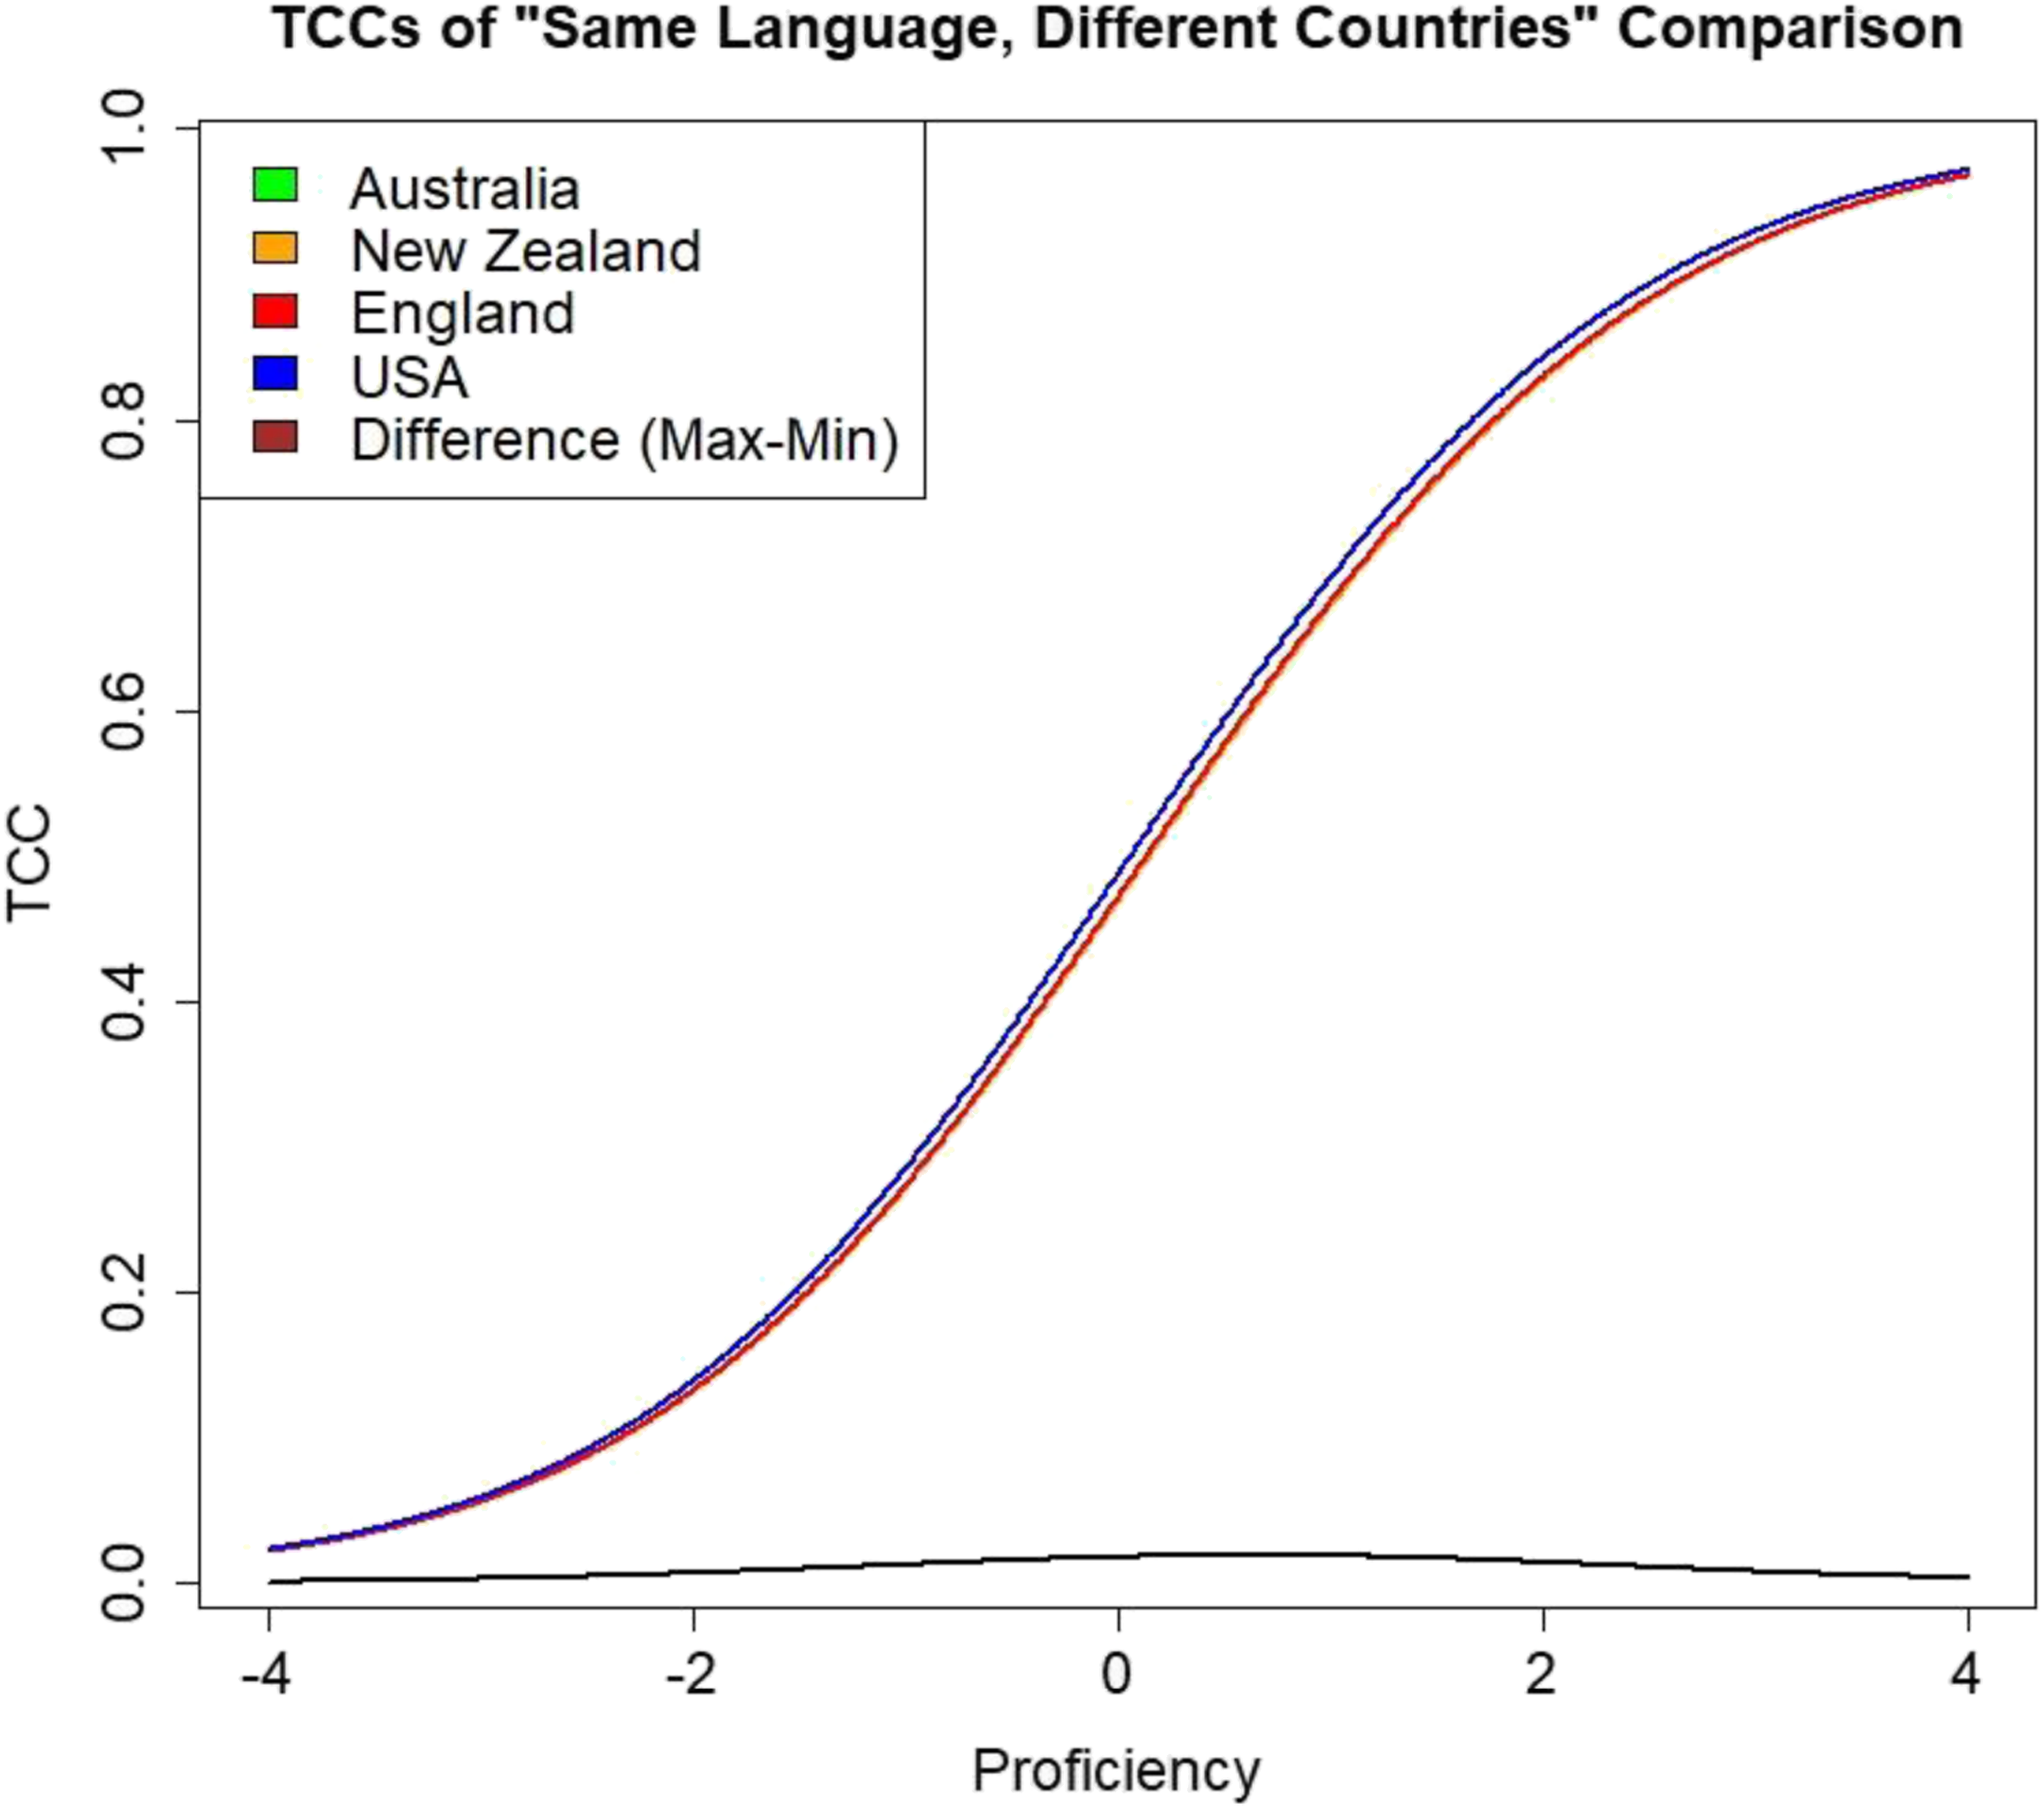

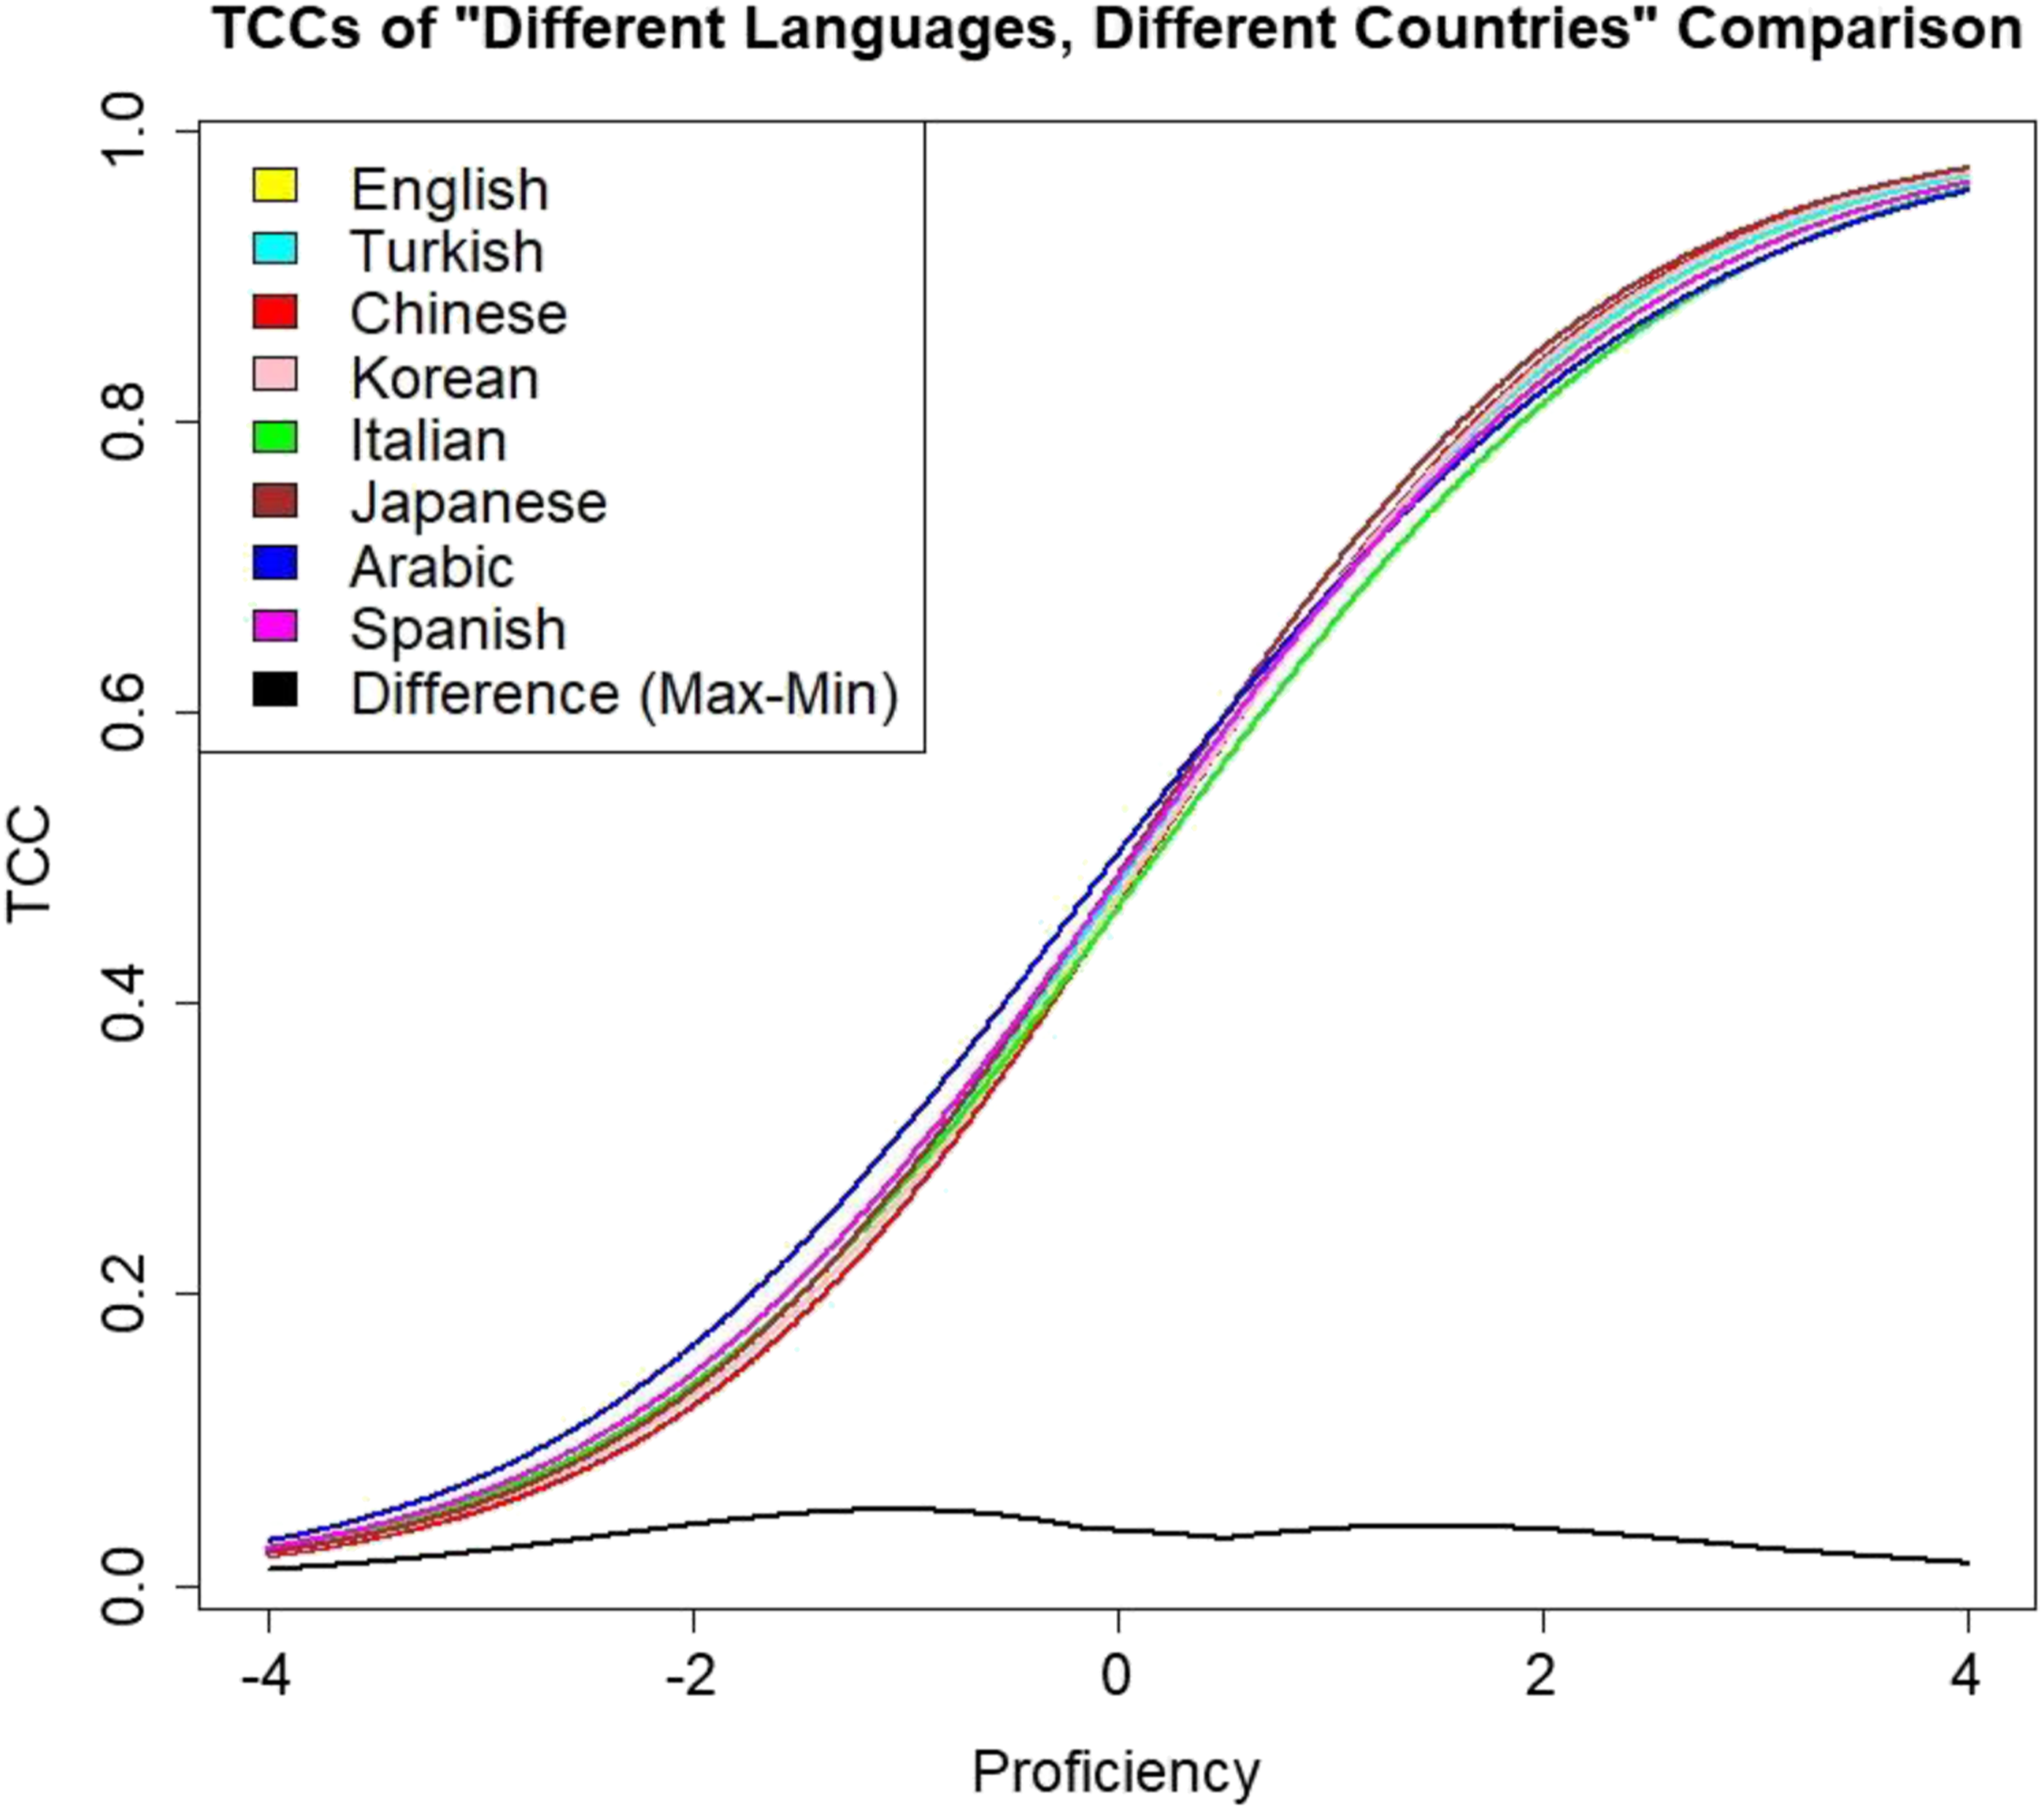
In Figure 7, (TCCs for the countries in the same language/different country comparison) the TCCs for the four countries are largely coincident although some separation of the TCCs is noted around the middle to upper range of the proficiency scale. The largest difference observed for this comparison is between England and the United States, which has a maximum value of .02 at around +.50 on the proficiency scale. In this comparison, items favor students from USA. In Figure 8, the TCCs are also largely coincident, with the UAE Arabic group exhibiting the most distance from the other groups at the upper end of the proficiency scale (maximum separation of .03 between the TCCs for Canada-French and UAE-English around proficiency = +2.00). In Figure 9, the separation among the TCCs is more conspicuous. The differences among the TCCs are most pronounced in the proficiency level from about −1.00 and about +1.50, with the maximum difference of about .05 around the −1.00 proficiency level. At proficiency level +1.50, the maximum difference is about .04. The greatest difference for the lower proficiency level was observed between Arabic and Chinese languages. For the higher proficiency level, the greatest difference is in between Italian and Japanese languages. The items are functioning in favor of students from lower proficiency levels in the Arabic version and in favor of students from higher proficiency levels in the Japanese version.
Discussion
In this study, we evaluated whether the presence and magnitude of DIF on the 2015 TIMSS eighth-grade mathematics assessment was related to language and country. We hypothesized that as comparisons moved from (a) countries administering TIMSS in the same language, to (b) comparisons of different languages from the same language family, to (c) comparisons different language families in different countries; the presence and magnitude of DIF would increase. The results were generally consistent with these hypotheses. In this section, we review our results and their implications.
Like previous research (e.g., Arim & Ercikan, 2014; Ercikan & Koh, 2005), we found a large number of DIF items in most of the language and country comparisons. However, there were differences in the presence and magnitude of DIF across our three comparison conditions. In considering items flagged for nonnegligible DIF (i.e., B- and C-level DIF), there were an average of 34 items flagged for DIF in the same language/different country condition, and this average almost doubled (to 63 items) in the same country/different language condition (Table 3). These results suggest translation (i.e., language version of the item) is more likely to be associated with DIF than country differences, which likely reflect differences in curriculum, culture, and other factors. As expected, when analyses compared groups of students that differed both by language of test administration and country, the mean number of items flagged for DIF was largest. The mean of 91 items flagged in these comparisons is almost triple that of the mean for the same language/different country condition (34 items, see Table 3). These findings are also evident in Figure 3.
The amount of DIF noted in the lower-level same language/different country comparison cannot be ignored (see Figure 1). Clearly, this DIF is not due to translation and so such DIF might stem from other factors such as curricular, cultural, or resource differences among countries.
Although the “same country, different languages” comparison was limited to only two countries, the increased magnitude of DIF for the Arabic versus English comparison in the UAE relative to the English versus French versions in Canada is notable. This difference might be the result of having Sematic versus Indo-European languages Arabic and English belong to. In fact, the complete structure difference between Arabic and English, compared to English and French, may make it less likely that the specific knowledge and skills tested will remain invariant after translation. The effect of the differences among the language families is also more evident in the different languages and different countries comparison where the highest number of DIF items were observed when countries with different language families were compared (Table 3).
When Figure 3 is closely evaluated, it can be seen that there are more C-level DIF items reported as the language families differ. Furthermore, in Figure 6, the range of the percentages of C-level DIF is in between 13% to 27% among Indo-European languages, but this range increases to 24%–48% between Indo-European and non–Indo-European languages. This finding is consistent with the findings reported by Grisay et al. (2009).
Considering DIF aggregation
Although many items exhibited DIF for different countries in this assessment, the direction of the DIF is also important to consider. In the “same language, different countries” comparison, there is some imbalance in the number of items favoring the students in different countries even though the language of the tests is the same. For instance, more items favored the students in the United States than Australia, England, and New Zealand. Clearly, such imbalance cannot be traced to a translation effect, given that all items were administered in English. Typically, an imbalance in the direction of DIF may indicate a lack of comparability of test scores. However, the TCC analysis (Figure 7) suggests the imbalance may not be consequential at the total test score level.
In the “same country, different languages” condition, DIF imbalance is also present. For example, more items favored English than French in Canada, and Arabic than English in UAE. Based on the analyses, it cannot be determined whether these reflect translation or cultural or curricular differences. Nevertheless, like the same language/different country comparison, the TCC analysis suggests the overall effect at the total score level may be minor (Figure 8).
As for the “different languages, different countries” comparison, the imbalance across comparisons varied widely (e.g., larger for Arabic vs. Turkish and smaller for Japanese vs. Chinese comparisons). Although the TCCs were again similar, differences across groups could be seen, with cross-language families being most distant from one another (i.e., Arabic and Chinese at the lower end of the proficiency continuum, and Italian Japanese, at the upper end). Thus, the TCC analysis illustrates that the impact of DIF is not consistent across the entire range of proficiency. This finding should be borne in mind when interpreting TIMSS scores across countries.
Limitations and suggestions for future research
Pulling off a large-scale assessment across 57 countries, which necessitates translation of assessment materials into 43 languages, is a heroic feat. Clearly, there will be some measurement error due to translation, country-specific, and cultural differences. Evaluating this error also requires a monumental effort. In this study, we used DIF methodology to assess specific sources of invariance at the item level that may or may not be due to translation.
The choices we made in conducting the analyses point out several limitations in our study. First, we only investigated the dichotomously scored items and ignored the polytomous items. In future research, it will be interesting to see if there is more or less DIF on those items and if their inclusion will affect similarities noted in the TCCs. Another limitation is we focused on a subset of countries rather than all countries. This limitation stemmed from our desire to have sufficient sample sizes for our analyses. That said, our analyses did involve the data from 14 different countries. A third limitation is that we used a 1PL IRT model, which only investigated differences in the difficulty of the item across groups. Future research may consider investigating whether item discriminations, or pseudo-guessing parameters, are also invariant across groups defined by language and country. Future research should also consider additional statistical checks such as family-wise correction of statistically significant findings (in addition to the effect size criterion we employed), as well as DIF purification (Sireci & Rios, 2013).
Another limitation of our study is that the presence of DIF on international assessments could be due to cultural differences, which do not overlap with culture. That is, at some level, we were using country as a proxy for culture. Thus, future research may want to look at cultural differences across examinees, when investigating the invariance of item parameters (e.g., Hauger & Sireci, 2008). A major limitation of the study is that we did not have access to the items themselves (the items are secure and unreleased), and so we could not evaluate linguistic or cultural complexity as a source of DIF. Finally, in this study we only looked at one subject area (math) and one grade level (eighth grade). The degree to which these findings generalize to other grades and subjects remains an area for future research.
Conclusions and Contributions
The results of our study were consistent with our expectations. As language families differed, DIF would increase, and it would increase even further when language differences were investigated across different countries. The limitations noted above aside, our study illustrates some important methodological choices we consider important. First, in investigating DIF, it is important to consider effect sizes in addition to merely statistical significance. Second, noting the direction of the DIF is also important. Finally, considering the impact of DIF aggregation (or cancelation) on the total score is also important (Wainer et al., 1991). At first blush, the sheer number of items flagged for DIF suggests an invariance problem, but when all items are considered together, the TCCs suggest DIF may not have a consequential effect on total scores as it seems.
Another important point to emphasize is the analysis of DIF magnitude relative to not only language, but to language family. Although we are not translators, we imagine it is more difficult to retain the intended meaning of an item across a translation that involves different language families, than it is to retain the meaning across items translated within a language family. The results of the present study, and some previous research in this area (e.g., Grisay, et al., 2009), suggest this is the case. Thus, when comparing TIMSS results across countries, comparisons across countries that involve assessments administered in different language families, may warrant more caution than tests administered in the same language family, or in the same language.
The preceding caution suggests that in addition to error bars that caution against overinterpreting small mean differences across countries, perhaps an index of “translation distance” or “curriculum difference” could be added to the reports of the results of international assessments. Aggregates of DIF statistics, such as those investigated in the present study (e.g., Table 3), could be further investigated to see if they could be used as criteria for flagging inappropriate comparisons across countries. Translation and curricula differences could be further investigated to understand the sources of the lack of equivalence.
In conclusion, the results of this study illustrate differences between languages and countries and the language families may all interact with students’ performance on the test items. Thus, when interpreting country differences, one should consider the degree to which language and cultural diversity, in addition to the proficiency measured, may be reflected in the test scores. The degree to which these interactions affect the interpretations of TIMSS results, such as the ranking of countries based on overall TIMSS scale score, deserves further study. Thus, qualifications in interpreting TIMSS results, and further work on accounting for these differences in TIMSS scaling, are warranted.
Footnotes
Authors’ Note
An earlier version of this study was presented at 11th Conference of the International Test Commission (ITC) held at Montreal, Canada, on July 2–5, 2018.
Declaration of Conflicting Interests
The author(s) declared no potential conflicts of interest with respect to the research, authorship, and/or publication of this article.
Funding
The author(s) received no financial support for the research, authorship, and/or publication of this article.