
Abstract
This study evaluated the longitudinal psychometric properties of the Authoritative School Climate Survey (ASCS) using a statewide sample of middle and high schools across 8 years. Multilevel confirmatory factor analyses were conducted to test the longitudinal measurement invariance of three scales on the ASCS: disciplinary structure, teacher respect for students, and students’ willingness to seek help. These scales demonstrated strong factorial invariance across all time points for both middle and high schools. Results support the use of these scales in evaluating longitudinal change in school climate.
Measurement Structure Temporal Stability of the Authoritative School Climate Survey
School climate (SC) continues to be recognized as an important indicator of school crime and safety (Wang et al., 2020). It is associated with a variety of important student outcomes in student achievement and social development (Thapa et al., 2013). School climate is a multidimensional construct that has been broadly defined as “the quality and character of school life” (Cohen et al., 2009, p. 182). The U.S. Department of Education (2013, p. 2) maintains an inclusive conceptualization of SC as “the extent to which a school community creates and maintains a safe school campus, a supportive academic, disciplinary and physical environment, and respectful, trusting, and caring relationships throughout the school community.”
The authoritative school climate (ASC) model (Gill et al., 2004; Gregory & Cornell, 2009) provides a theoretical- and research-based grounding to the conceptualization of SC. This model of SC is an outgrowth of parenting research that has found parents to be most effective when they are both demanding and supportive (Baumrind, 1968; Larzelere et al., 2013). In a similar way, the ASC model characterizes positive school climates as those that hold high disciplinary expectations for their students (i.e., structure) and have supportive adult–student relationships characterized by respect and student willingness to seek help (WTSH).
The Authoritative School Climate Survey (ASCS; Cornell et al., 2013) operationalizes this model through a disciplinary structure scale and two student support scales: Respect for students and willingness to seek help. Additional measures that capture other student- and school-level characteristics (e.g., student engagement and prevalence of teasing and bullying) are also included in the survey. Previous research on the psychometric properties of the ASCS shows that it has good structural and predictive validity in middle and high school samples (Konold et al., 2014; Konold & Cornell, 2015). Beginning in 2013, these scales were administered statewide to middle and high school students in Virginia as part of the state’s annual school safety audit assessment. Over this 8-year period, there have been over 25 peer-reviewed studies that have used the ASCS to evaluate relationships between SC and a variety of outcomes. Examples of these include positive SC associations with academic engagement, grades, and educational aspirations (Cornell et al., 2016); suspension rates (Heilbrun et al., 2018); student risk behaviors (Cornell & Huang, 2016); dropout rates (Jia et al., 2016); student threat assessment (Nekvasil & Cornell, 2015); and middle school grade configuration (Malone et al., 2017). In these cross-sectional studies, SC was measured at a single time.
In recent years, a number of longitudinal studies have assessed student- and school-level changes in SC over time (e.g., Camacho et al., 2018; Coelho et al., 2020; Daily et al., 2020; Luengo Kanacri et al., 2017; Wang & Dishion, 2012). A key assumption of these longitudinal studies is measurement invariance of scale scores across waves of data collection. Meaningful comparisons of scores over time require that the item measures the same construct on the same metric at each measurement occasion. However, few studies to date have considered longitudinal measurement invariance within the context of SC survey research. The current study focuses on the measurement invariance of the primary ASCS scales of disciplinary structure, respect for students, and WTSH in terms of whether the items underlying these scales measure these constructs with the same degree of accuracy over repeated administrations.
Measurement Invariance
In the social sciences, focus is often on the measurement of constructs that are not directly observable but are indicated by the aggregation of manifest variables presumed to be representatives or aspects of the target construct. The construct of SC, for example, cannot be directly measured but can be inferred from responses to survey items constructed to tap into various aspects of the construct. These latent variable measurement models can be evaluated to empirically gauge the number of constructs being measured by a set of items, the degree to which each item relates to its respective construct, and the extent to which a set of items are related to a given construct (Kline, 2011).
Measurement invariance is concerned with evaluating the extent to which a set of items are measuring the same number of constructs with the same degree of accuracy across different conditions. In concurrent evaluations of invariance, these conditions generally take the form of membership in different groups such as biological sex, race, ethnicity, SES, or age (Richardson et al., 2007; Whitehouse et al., 2020). Here, invariance refers to the degree to which various estimates from a latent variable psychometric model are similar across different groups. When measurement invariance is achieved, evidence favors the latent variable measurement model as being similar (i.e., invariant) across groups. The conditions under which measurement invariance is examined can also be extended to include time in longitudinal designs (Widaman et al., 2010). Here, the focus is on whether a set of items are measuring the same construct(s) with the same degree of accuracy at different time points.
Measurement invariance is a necessary first condition to evaluate mean differences between the contrasting conditions (Putnick & Bornstein, 2016). When measurement invariance is not present, it is unclear whether mean differences over time on the construct are the result of true underlying differences on what is being measured, or whether those differences are simply a reflection of the indicators measuring different constructs across conditions. It is also possible that substantively interpreted mean construct differences are the result of changes in indicator scaling that have occurred over time. For example, Miles et al. (2015) found both these elements of longitudinal measurement non-invariance to be present in their analysis of a neighborhood socioeconomic status (NSES) construct. Of the nine indicators used to measure NSES, several items related to housing were found to have changing relationships with the NSES construct over the 1990–2000 period of the study. They speculated that these changes were the result of several disruptions in the real estate market that included the housing bubble and eventual collapse that may have resulted in these indicators being “too volatile or inadequately discriminating of NSES” p. 227. They also found that the scaling of indicators related to education changed over time in the context of other NSES indicators. These differences were attributed to increasing levels of educational attainment over this time that were not matched by increasing levels on other NSES indicators.
Measurement invariance is evaluated through tests of increasing restrictiveness on the measurement portion of the psychometric model when evaluated in a structural equation modeling framework (Putnick & Bornstein, 2016; Vandenberg & Lance, 2000; Widaman & Reise, 1997). This is assessed by imposing constraints of increasing restrictiveness on different aspects of the measurement model, and evaluating how much worse the restricted model fits relative to a less restricted model in which fewer restrictions are in place. These hierarchically increasing restrictions are typically grouped in a way to allow for evaluations of configural, metric, scalar, and strict invariance (Putnick & Bornstein, 2016).
To illustrate, the top of Figure 1 shows the measurement of a single SC factor that was measured at the school level (denoted by circles) across four time points (T1 to T4). The double-headed arrows connecting them illustrate that their associations were freely estimated over time. These school-level factors were measured with multiple student informants within each school through a set of K common items (denoted by rectangles) across time points. These items were subjected to a latent decomposition (denoted by ovals) to isolate the orthogonal within- (student) and between- (school) level components of the observed items. In contrast to observed variable decomposition in multilevel models (Raudenbush & Bryk, 2002), latent variable decomposition of these observed items into student- and school-level components takes into account both measurement error and sampling error when informants within an organization (e.g., schools) are sampled from the population of students that exist within schools (Muthén, 1991). Because SC is typically believed to be a school-level construct that characterizes the school as a whole (Marsh et al., 2012; Stapleton et al., 2016), Figure 1 depicts this school-level focus through the modeling of a school climate construct at the school level. This latent construct is presumed to influence school aggregated student responses to survey items and is depicted through single-headed arrows linking the school-level factor to school-level item indicators, at each time point. The direction of these arrows depicts that the climate that exists in the school influences the way respondents within that school respond to items intended to measure the construct. Otherwise stated, these school-level items serve as indicators of the school-level construct. The student level portion of the model is fully saturated at each time point. General path diagram of measurement invariance constraints of school-level school climate constructs across four time points.
The first step in evaluating measurement invariance involves a test of configural invariance to determine whether the school-level indicators are measuring the same number of factors over time. This is the least restrictive test and involves specifying the same number of free and fixed loadings across conditions. This is illustrated at the top of Figure 1 by allowing a common set of items to freely estimate a single SC construct (denoted by the presence of arrows) at each of the four conditions of time. The specification implies that the same items are measuring a single SC factor at each time point. This can be expanded to include situations in which a set of items are presumed to be measuring more than one construct at each time point.
Metric invariance is concerned with whether the SC factor indicators are measuring their respective factors with the same strength over time. Failure to support metric invariance would suggest that the closeness of item-to-construct alignment is different across measurement occasions, and that some items are better indicators at some time points than at others. This is tested by imposing equality constraints on factor loadings (λ) linking each of the K common items to their construct at each time point

These additional restrictions would be expected to have an adverse effect on model fit. Contrasts of fit between this model and the less restrictive configural invariance condition are used to determine whether the decline in fit is within tolerable levels. These methods are described below.
Scaler invariance focuses on whether the SC factor indicators have the same measurement scale with a common zero point over time (Schweig & Yuan, 2019). It also reflects the extent to which common indicator mean differences vary beyond that which can be explained by factor mean differences (Putnick & Bornstein, 2016). For example, if students at one measurement occasion report that their teachers care about all students more than they do at another time point, but these differences are not captured in the latent variables at those time points, scaler invariance may be indicated. Scaler invariance is tested by imposing additional equality constraints on the common item indicator intercepts (τ) over time

Assuming that both configural and metric invariance hold, scaler invariance is tested through contrasts of model fit with metric invariance.
Residual invariance (r) is typically the final evaluation in this sequence for establishing complete measurement invariance (Meredith, 1993), although others (Vandenberg & Lance, 2000) do not view this step as a necessary precondition to group comparisons on the latent variable. In latent variable psychometric models, the latent variable extracts shared sources of variance across the set of indicators ascribed to it. That which is unexplained by the factor is the residual portion of the indicator. Consequently, residual invariance is concerned with whether the unexplained portion of the indicator is equal across measurement occasions

In this doubly latent multilevel model, residual variance is a combination of measurement error, variance specific to the indicator, and sampling error (Muthén, 1991). Although the sequence of model testing steps above assumed that invariance was obtained across all indicators at each step (i.e., full invariance), tests of partial invariance are also possible (Byrne, 2001). Partial invariance allows for some items to be invariant over time and others to be non-invariant.
The Present Study
The present study investigated whether items on the ASCS measure the same constructs (i.e., disciplinary structure, respect for students, and WTSH) with the same degree of accuracy across a statewide sample of middle and high schools over an 8-year period. Accuracy in the context of a repeated samples assessment of SC, within a multilevel structural equation modeling framework, is concerned with whether we are measuring the same number of constructs at each time point with a given set of items (i.e., configural invariance), and whether the model estimates are similar across occasions with respect to the metric, scalar, and residual properties. This is important because ASC theory has been so widely used in research on SC (e.g., Huang et al., 2020; Konold et al., 2018). A finding of measurement invariance would support comparisons across different studies using those constructs. Furthermore, measurement invariance would support the use of these ASC scales in longitudinal designs that investigate temporal changes in SC such as the impact of school-level interventions. From both policy and practice perspectives, as assessments of SC become more and more frequently used as a high-stakes indicator of school quality, it becomes especially important to show that SC scales can be trusted to measure the same constructs year after year (Jordan & Hamilton, 2020).
Methods
Participants
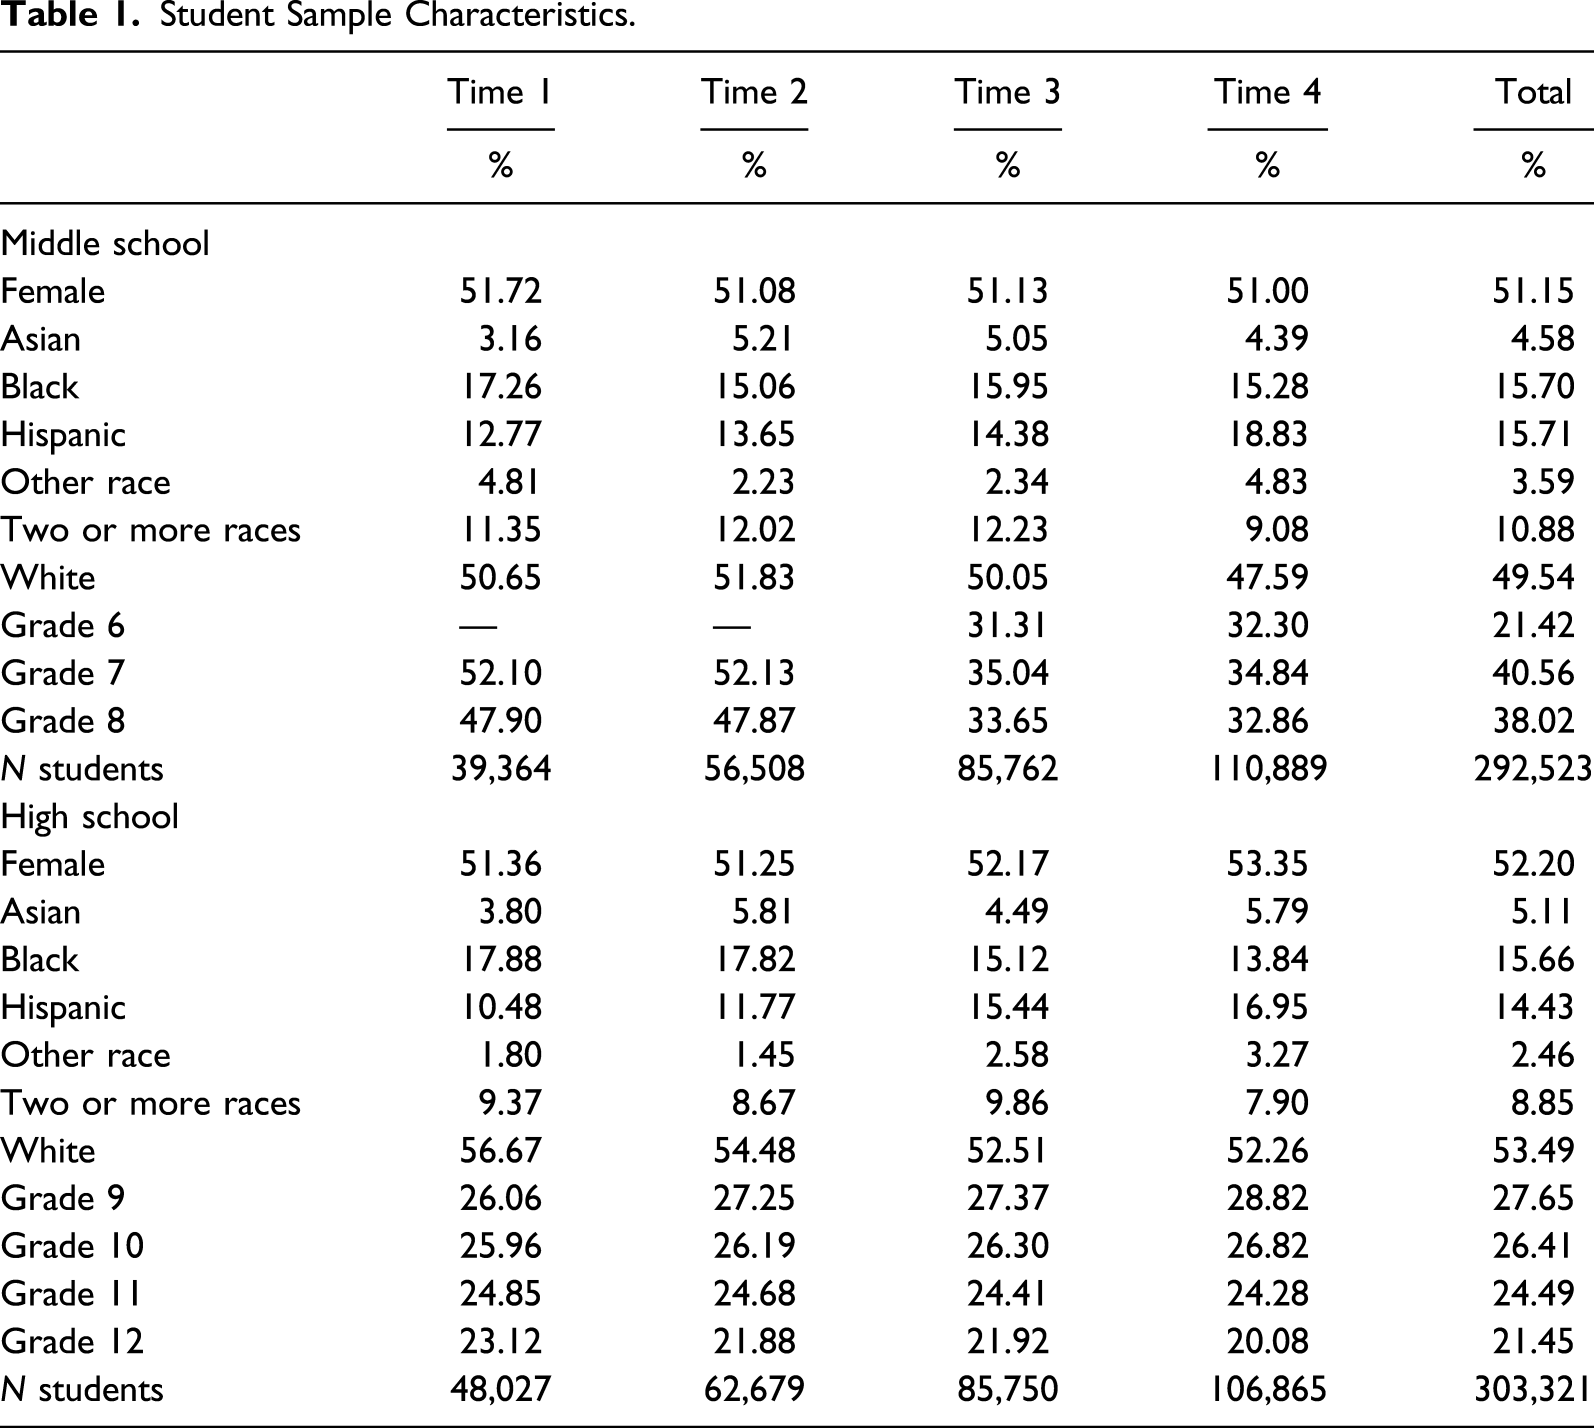
Student Sample Characteristics.
School Sample Characteristics.

The school-level constructs examined in this study were measured through reports obtained by students. Schools were given two options for sampling students: (1) invite all students to take the survey, with a goal of surveying at least 70% of all eligible students (whole grade option); (2) use a random number list to select at least 25 students from each grade level to take the survey (random sample option). Schools choosing the random sample option were provided with a random number list along with instructions for selecting students. Principals were advised to invite up to 50 students in each grade to take the survey in order to have a pool of alternates in the event that any of the first 25 selected students were unable or unwilling to participate. Student participation rate was defined as the total number of students across all schools who participated in the survey divided by the total number invited to take the survey. Across the 8 years, student participation rates ranged from 80.0% to 84.8% for middle schools and 71.6%–88.7% for high schools.
Measures
Surveys were administered online to students in classrooms under teacher or school staff supervision using a standardized set of instructions. The survey was anonymous, such that data from individual students could not be linked over measurement occasions. The complete online survey consisted of 100 items, including the scales examined in the present study. Student response options for the scales below were “strongly disagree,” “disagree,” “agree,” and “strongly agree.” Additional items asked students to provide demographic information, such as their grade level, race and ethnicity, and gender.
Disciplinary structure scale
Completely Standardized School-Level Estimates from the Fully Constrained Measurement Models.
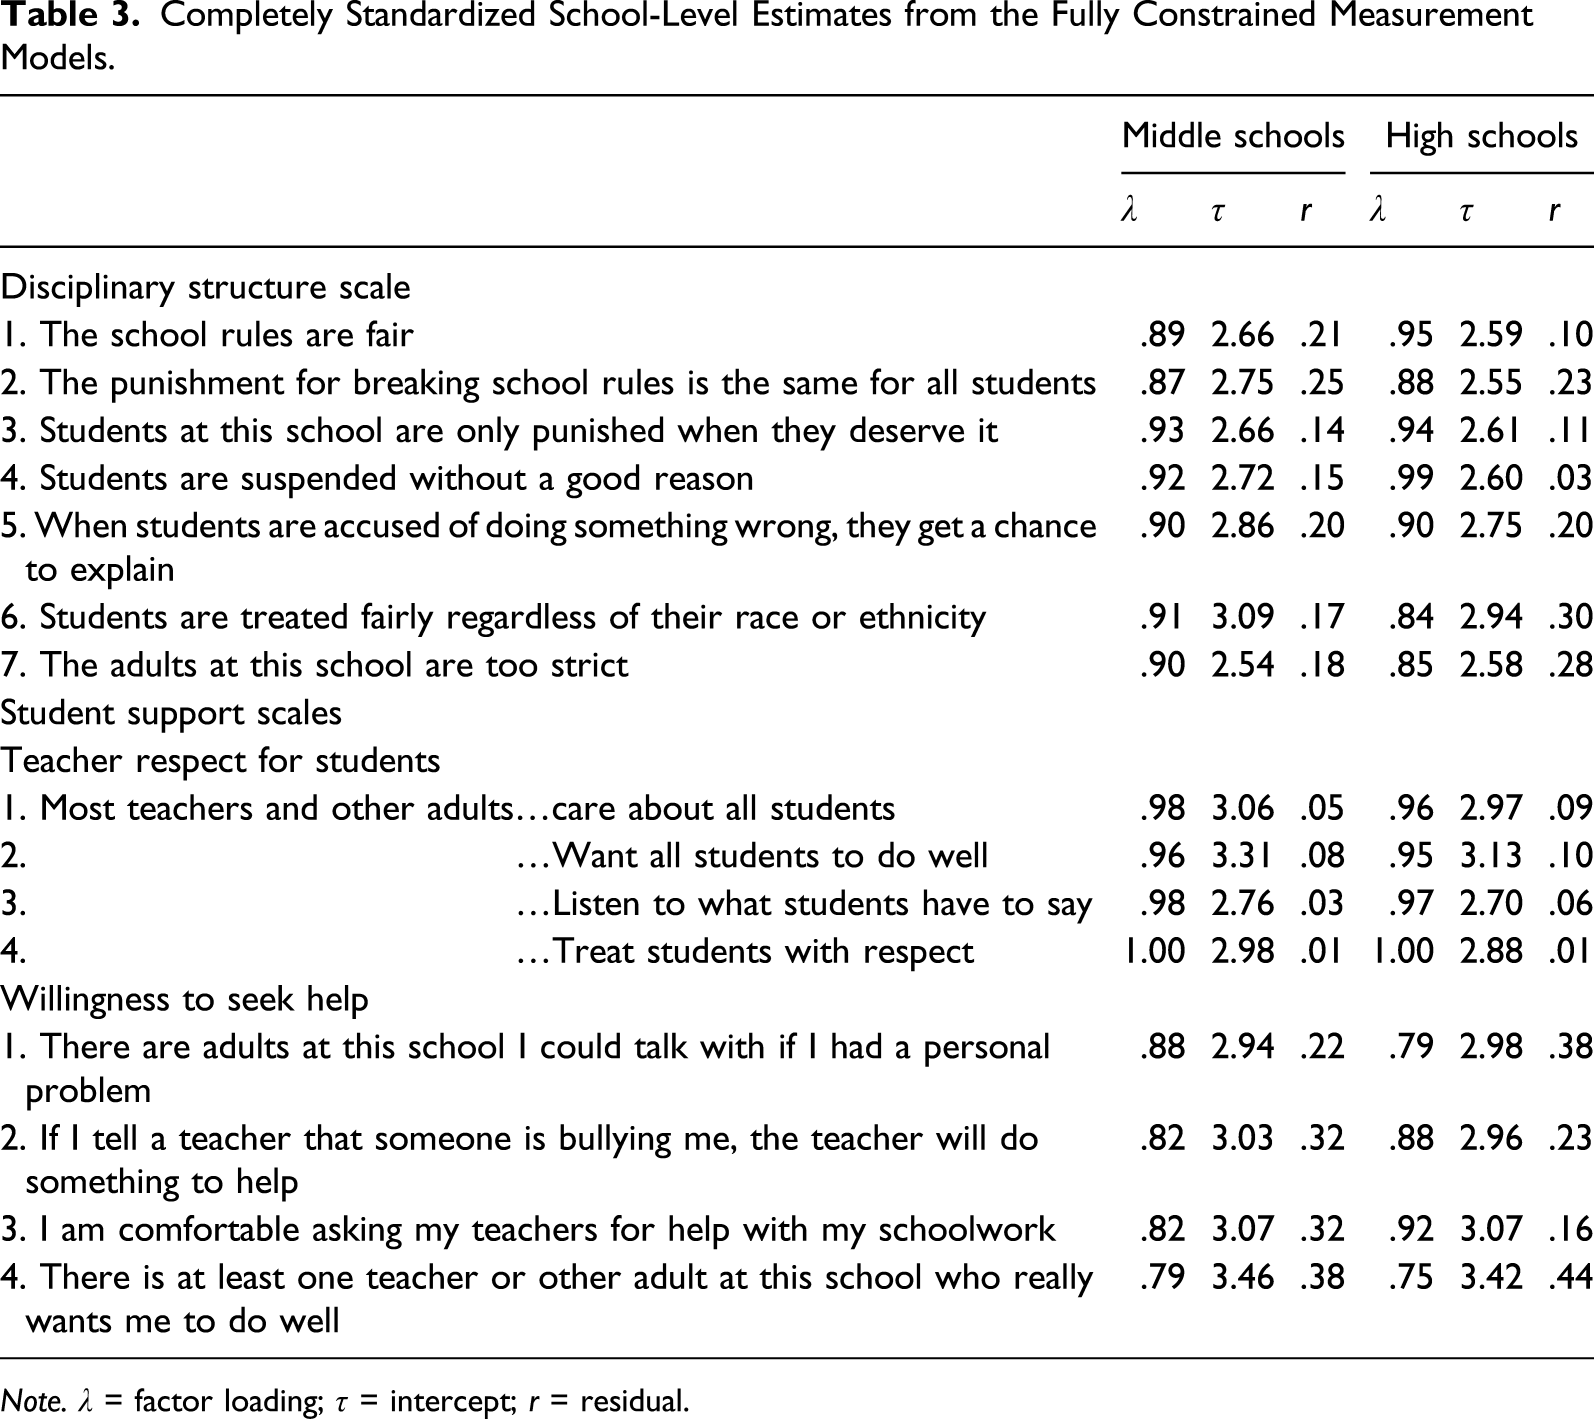
Note. λ = factor loading; τ = intercept; r = residual.
Student support scales
Student support measured the perception that teachers and other school staff members are supportive through scales labeled respect for students and willingness to seek help. Each scale consists of four items. Prior research employing these items revealed that schools characterized by higher levels of support had less bullying and peer victimization as reported by ninth grade students and their teachers (Gregory et al., 2010). In addition, previous multilevel CFA of these items revealed school-level standardized pattern coefficients that ranged from .67 to .99 in middle school samples (Konold et al., 2014) and .67 to 1.0 in high school samples (Konold & Cornell, 2015). School-level reliability estimates were .72 and .61 for the respect for students and WTSH scales in middle school samples and .90 and .80 in high school samples. Items comprising these scales are shown in Table 3.
Analytic Plan
The three scales (i.e., disciplinary structure, respect for students, and WTSH) central to the ASC theory were examined for measurement invariance across four time points. These evaluations were conducted separately for middle schools and high schools that were administered the surveys in alternating years. In each instance, configural, metric, scalar, and strict invariance were examined, as described above.
Three measures of fit were considered in evaluating model quality for the less restricted configural models: the Tucker–Lewis index (TLI), comparative fit index (CFI), and the root mean square error of approximation (RMSEA; Browne & Cudeck, 1993; Hu & Bentler, 1995). All three generally produce values that range between 0 and 1.0. The CFI and TLI provide estimates of model fit by comparing a given hypothesized model to a null model that assumes no relationship among the observed variables (Kline, 2011). Larger values are reflective of better fitting models, with estimates at or above .95 indicating good fit (Hu & Bentler, 1999). By contrast, smaller RMSEA values indicate better fit, with good fit typically associated with estimates of .05 or less (Kline, 2005). We also report the popular χ2 statistic for all models, but place little emphasis on this measure for evaluating model quality as it is well known to reject reasonably specified models when estimated on large samples (Cheung & Rensvold, 2002; Gerbing & Anderson, 1992; Hu & Bentler, 1995; Keith, 1997; Schumacker & Lomax, 2010) and has been challenged for its reliance on null hypothesis testing as a means of evaluating equivalence (Yuan & Chan, 2016). Although measures of model fit can be dominated by the larger level-1 (L1) sample sizes in multilevel applications, this was mitigated by saturating the L1 portion of the model (Ryu, 2014). That is, by not imposing a L1 structure and allowing all L1 item correlations to be freely estimated, the level-2 (L2) portion of the model was more specifically targeted by these estimates of fit.
Evaluations of longitudinal invariance involve contrasts among several nested models. One model is said to be nested in another model if it can be obtained by placing additional constraints on the original model. For example, the first (configural) model evaluates whether the general form of the one factor model held across all four time points. The second model places restrictions on this model by constraining that factor loadings of the same items be equal across measurement occasions. This second (metric) model is nested within the first. Because of these added restrictions, nested models typically result in poorer fit than models with fewer restrictions. A nonmaterial change in model fit can be taken to indicate that the added restrictions are reasonable, that cross-time equality constraints are acceptable, and that the constrained portion of the measurement model is operating in the same way over time. We gauge the degree of model misfit in relation to changes in CFI (ΔCFI) and RMSEA (ΔRMSEA) estimates, where support for the more restricted (i.e., nested) models is obtained when CFI values decrease by .01 or less (ΔCFI ≤ .01) and RMSEA increase by .015 or more (ΔRMSEA ≥ −.015; Chen, 2007). Notably, ΔCFI has been found to be independent of sample size, fit of the baseline model, and number of estimated parameters (Cheung & Rensvold, 2002). Maximum likelihood model estimates were obtained using Mplus 8.4.
Results
Longitudinal Tests of Invariance across Four Survey Administrations.
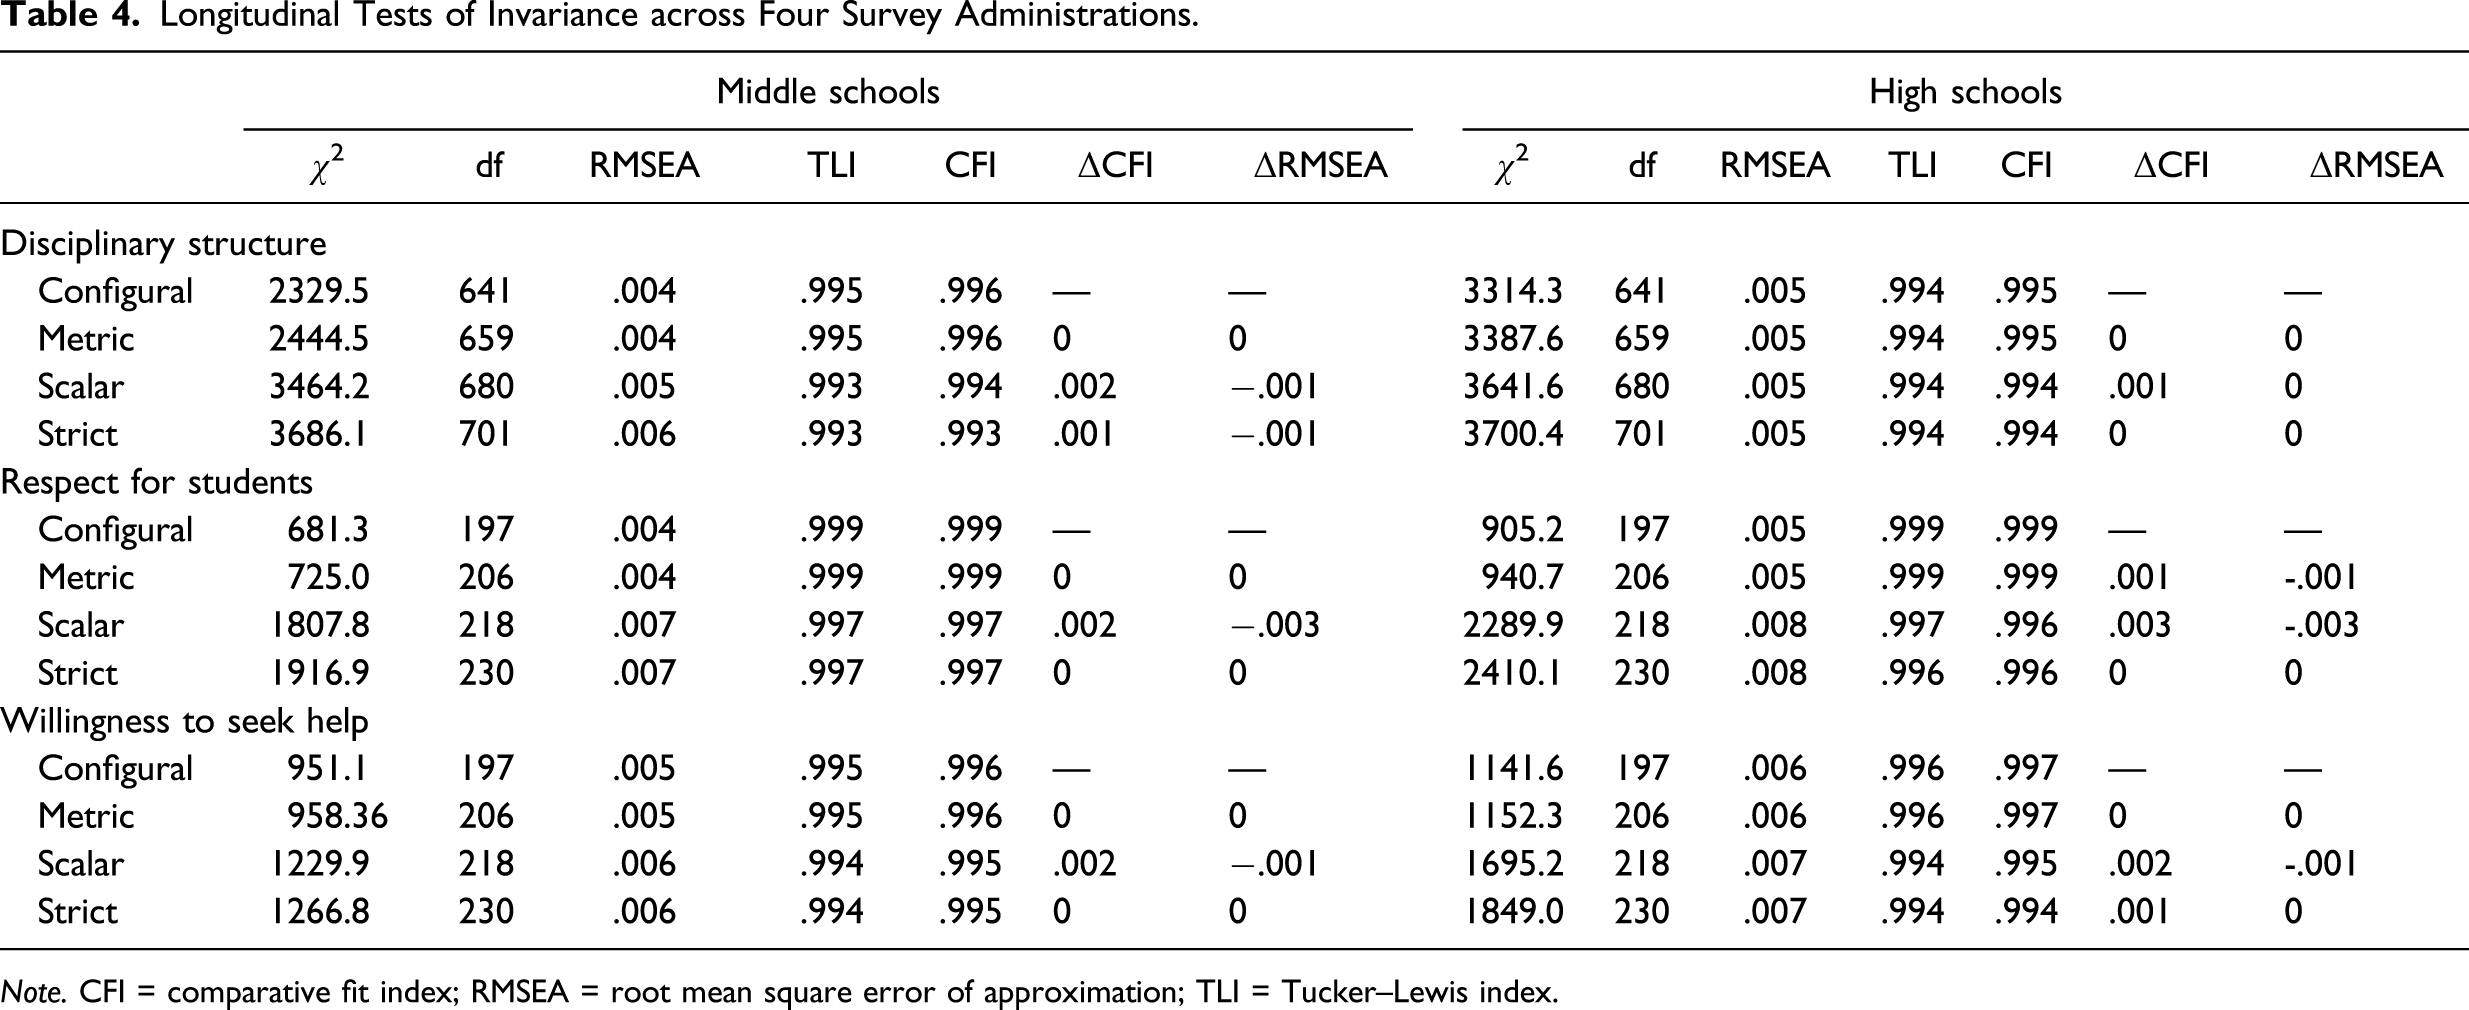
Note. CFI = comparative fit index; RMSEA = root mean square error of approximation; TLI = Tucker–Lewis index.
Discussion
The purpose of the current study was to investigate the longitudinal measurement invariance of the ASCS using a statewide sample of middle schools and high schools across 8 years. In order to understand how SC changes over time, it is necessary to have psychometrically sound measures of SC that estimated equivalent constructs for use in longitudinal designs. Although there are a growing number of longitudinal studies that evaluate changes in SC, few of these studies systematically test the assumption of temporal invariance. This research gap is problematic because if longitudinal measurement invariance does not hold, then any observed differences across time may be the result of changes in the psychometric properties of the instrument, and not changes in the underlying construct (Shadish et al., 2002). As a result, inferences made about changes in climate would be questionable in the absence of measurement invariance. The current study fills this gap in the SC literature by establishing evidence of strong longitudinal invariance for the three ASCS measures of disciplinary structure, respect for students, and WTSH. These findings demonstrate that the scales can be used to evaluate change in longitudinal assessments of SC, and any observed changes in scale scores over time can be interpreted as actual changes on the constructs they are intended to measure.
The present study adds to a growing body of research that supports the psychometric properties of the student version of ASCS. Prior work has examined the factor structure and construct validity of the ASCS in cross-sectional samples of middle schools (Konold et al., 2014) and high schools (Konold & Cornell, 2015). This study replicated previous findings that provide evidence to support the use of the disciplinary structure, respect for students, and WTSH scales to measure climate in middle and high school samples. Factor loadings of all scale items were high, supporting the construct validity of the ASCS. Moreover, model fit indices indicated that the models provided adequate fit to the data, thus supporting the dimensionality of the scales.
This study also extends previous psychometric work on the ASCS. Since its development in 2013, the ASCS has been annually administered statewide to students in Virginia public schools, with middle and high schools surveyed in alternate years. Survey data collected across this time frame have been used in numerous cross-sectional studies, and educators report using survey results to inform school planning and decision-making (Debnam et al., 2021). Results of the current investigation help these efforts by reassuring policy makers that these measures of SC are measured in a consistent way over time. This study provides the first comprehensive assessment of the longitudinal measurement invariance of the ASCS. The results of this study suggest that although the individual student raters within schools may change over time, the survey scales tap into the same school-level constructs at each measurement occasion. This finding lays the groundwork for future research into evaluating change in SC constructs over time, given appropriate interventions.
It should be noted that the scales examined in this study do not necessarily represent all dimensions of SC. Rather, these scales represent two core domains of SC under the ASC model, namely structure and support. Other SC surveys tap into similar themes, albeit with different terminology. For example, the Education Department School Climate Survey (EDSCLS)—a freely available survey developed by the U.S. Department of Education—includes strong student–teacher relationships and fair disciplinary policy in its framework of SC (U.S. Department of Education, 2018). Although they did not explicitly use an authoritative conceptual framework, Wang and Eccles (2013) found that “school structure support” (clarity and consistency of teacher expectations) and “teacher emotional support” (care and support from teachers) were associated with greater student engagement across behavioral, emotional, and cognitive indices.
Although the current study is limited to one model of SC, the findings contribute to the broader understanding of SC measurement. Further work is required to establish the validity of other SC measures for use in longitudinal designs. Furthermore, the sample used in the present study consisted of middle and high schools in one state, and may not generalize to other regions. Future research should consider other geographically diverse samples of students and schools.
Overall, the results of this study present implications for educational policy. School climate survey data are increasingly being used for school planning and improvement purposes. Under the 2015 Every Student Succeeds Act (ESSA), states must include nonacademic indicators of school quality and student success in their accountability plans. At least 13 states administer an annual SC survey to students as part of their accountability systems (Jordan & Hamilton, 2020; Kostyo et al., 2018). Given the growing interest in SC as a metric of school quality, it is imperative that these surveys are valid longitudinal assessments, such that data collected from students can be meaningfully compared from 1 year to the next. Yet, longitudinal measurement invariance has been a neglected issue in research on SC. The present study contributes to the measurement of SC and can help guide practitioners looking to choose a survey instrument for longitudinal purposes.
Footnotes
Declaration of Conflicting Interests
The author(s) declared no potential conflicts of interest with respect to the research, authorship, and/or publication of this article.
Funding
The author(s) disclosed receipt of the following financial support for the research, authorship, and/or publication of this article: We thank the Virginia Department of Criminal Justice Services for their support of the Virginia Secondary School Climate Study. This project was supported by Grant #2017-CK-BX-0007 awarded by the National Institute of Justice, U.S. Department of Justice. The opinions, findings, and conclusions or recommendations expressed in this publication are those of the authors and do not necessarily reflect those of the Department of Justice or the Virginia Department of Criminal Justice Services.