
Abstract
The Assessment of Culturally and Contextually Relevant Supports (ACCReS) was developed in response to the need for well-constructed instruments to measure teachers’ cultural responsiveness and guide decision-making related to professional development needs. The current study sought to evaluate the presence of differential item functioning (DIF) in ACCReS items and the magnitude of DIF, if detected. With a national sample of 999 grade K-12 teachers in the United States, we examined measurement invariance of ACCReS items in relation to responses from (a) racially and ethnically minoritized (REM) youth and white teachers (teacher race), (b) teachers in schools with 0–50% and 51–100% REM youth (student race), and (c) teachers with <1–5 years of teaching experience and teachers with >5 years of experience. Findings suggested that ACCReS items exhibited negligible levels of DIF. The lack of DIF found provides additional evidence for the validity of scores from the ACCReS to assess teachers’ cultural responsiveness. Furthermore, descriptive analyses revealed that teachers were more likely to agree with items pertaining to their own classroom practice than items related to access to adequate training and support. Results inform implications for future educational and measurement research.
Assessing Differential Item Functioning in a Teacher Self-assessment of Cultural Responsiveness
Over the past two decades, the population of US public school students has become increasingly racially and ethnically heterogeneous, yet teachers have remained primarily white (US Department of Education, 2019). Indeed, there has been a decrease in the number of Black teachers in the field, and Hispanic/Latinx teachers make up only about 9% of the teaching force (National Center for Education Statistics, 2016). For racially and ethnically minoritized (REM) youth (e.g., Black/African American, Hispanic/Latinx, and American Indian/Alaskan Native; Malone & Ishmail, 2020), instruction from REM teachers is connected to a host of positive outcomes including better academic performance and social emotional wellness, as well as an increased likelihood to attend a college or university (Bates & Glick, 2013; Yarnell & Bohrnstedt, 2017). These findings imply the possibility of a disconnection between white teachers and REM students.
This disconnect (or “mismatch”; La Salle et al., 2020) aligns with teacher perceptions of being underprepared to engage in culturally responsive practices (e.g., Bergeron, 2008), especially teachers who are new to the field (e.g., within their first five years of teaching; Lee et al., 2012). Without targeted training and support, teachers may engage in actions that disadvantage REM youth. Specifically, there is extensive evidence to suggest that exclusionary disciplinary techniques (e.g., office discipline referrals, suspensions, and expulsions) are disproportionately applied to Black/African American, Hispanic/Latinx, and American Indian/Alaskan Native students (Girvan et al., 2017). Similarly, there has long been evidence of differences in achievement metrics between REM and white students (Hung et al., 2020). The “discipline and achievement gap” (Gregory et al., 2010), better understood as opportunity gaps (Miretzky et al., 2016), evidence the need for educators to confront systemic racism in schools (Kohli et al., 2017) informed by comprehensive, ongoing training to establish more equitable and effective learning environments (García et al., 2010).
Assessment of teachers’ cultural responsiveness may be an appropriate place to start in the process of identifying specific areas of need for staff intervention (such as training and professional development [PD]). Cultural responsiveness refers to the extent to which educators value students’ individual differences (e.g., language, heritage, and experiences) and align what and how they teach to students’ cultures (Gay, 2018). Currently, few teacher self-assessments of cultural responsiveness exist. Of existing measures, some focus primarily on teachers’ instruction, such as the Culturally Responsive Teaching Self-Efficacy Scale (α = .95; Siwatu, 2007) and the Multicultural Efficacy Scale (α = .80; Guyton & Wesche, 2005). Other scales focus on behavioral supports, such as the Culturally Responsive Classroom Management Self-Efficacy Scale (α = .97; Siwatu et al., 2017) and Double Check Self-Reflection Tool (α = .65; Hershfeldt et al., 2009).
The Assessment of Culturally and Contextually Relevant Supports (ACCReS) includes items pertaining to both culturally responsive teaching and behavior supports, as well as teachers’ action to engage with students’ culture (e.g., collaboration with families), and access to information and systems of support (e.g., relevant data, PD). It was created to be a comprehensive instrument targeting cultural responsiveness aligned with multi-tiered systems of support (MTSS; Sugai, O’Keeffe, & Fallon, 2012) and has undergone several initial validation procedures (Fallon et al., 2021). Assessment of Culturally and Contextually Relevant Supports items and subscales were constructed to reveal teachers’ perceptions (represented by scores) of their implementation of empirically supported culturally relevant practices. Results are intended to be used by teachers, support staff, and/or school leaders to determine areas of relative strengths and weakness, and identify areas for growth to target with teacher professional development, coaching, and intervention efforts.
Initial Validation of the ACCReS
Assessment of Culturally and Contextually Relevant Supports items were originally derived from a systematic review of the literature related to culturally relevant classroom practice (Fallon, O’Keeffe, & Sugai, 2012) and grounded in Vincent et al.’s (2011) model of cultural responsiveness applied to a MTSS framework. Fallon et al. (2021) outline a multi-step process of content validation, and exploratory and confirmatory factor analyses with unique large teacher samples. Analyses resulted in a 35-item instrument assessing teachers’ perceptions of their (a) use of equitable classroom practices (ECP; ω = .87), (b) consideration of culture and context (CCC; ω = .77) in the classroom, and (c) access to information and support (AIS; ω = .86) (Fallon et al., 2021). The study also found significant correlations between teachers’ responses on the ACCReS and their responses on the Culturally Responsive Teaching Self-Efficacy Scale (Siwatu, 2007) and Culturally Responsive Classroom Management Self-Efficacy Scale (Siwatu et al., 2017), providing initial evidence for the content validity of ACCReS scores.
Purpose of Study
Results of research have identified a mismatch between teacher and student identity, as well as new teachers reporting a lack of preparedness to provide culturally responsive supports; the purpose of this study was to conduct differential item functioning (DIF) analyses of ACCReS items. Specifically, DIF was conducted to determine if teachers’ ratings on the ACCReS were invariant in relation to binary (a) racial/ethnic teacher identity (REM, white), (b) percentage of REM students in participants’ schools (≤50% or >50% REM students), and (c) years of teaching experience (<1–5 years or 5 years of teaching experience). Detecting DIF might indicate compromised validity of the ACCReS uses. Additionally, the absence of evidence for DIF might indicate that scores can be compared across variables of interest including teacher race/ethnicity, percentage of REM students in the school, and years of teaching experience in future research without underlying limitations to the instrument accounting for between-group differences (if detected). To date, no known study has assessed the presence of DIF on teachers’ responses to a measure of cultural responsiveness in educational contexts. Therefore, we investigated the following three research questions: Are ACCReS items invariant (i.e., do they function similarly) across teachers who identify as Black/African American, Hispanic/Latinx, American Indian/Alaska Native, Asian, Hawaiian Native/Pacific Islander, or other compared to teachers who identify solely as white? Are ACCReS items invariant across teachers in schools with 0–50% REM students compared to those in schools with 51–100% REM students? Are ACCReS items invariant across teachers with <1–5 years of teaching experience compared to teachers with >5 years of teaching experience?
We were interested in results from DIF as well as analyzing descriptive statistics (e.g., means and standard deviations (SDs)) for items and subscales to inform implications for future research and practice.
Method
Participants and Setting
The study presents a secondary analysis with an aggregate sample (N = 999) of teachers from three previous participant pools (n = 400, 500, and 100 teachers; Fallon et al., 2021). One teacher’s responses were removed as six items were left unanswered. No other instances of missingness were observed. The three samples were recruited in the same calendar year (2018) using identical procedures. Specifically, Qualtrics Panel Management Services distributed study invitations to eligible teacher participants who had previously registered as panelists with Qualtrics. To participate, respondents had to be employed as an elementary, middle, or high school teacher and were offered a $10 gift card for taking part in the study. Use of a paneling service for recruitment ensured data efficiency and quality in recruitment (e.g., national sample). All samples were unique. Participants were only recruited once.
Respondent Characteristics.
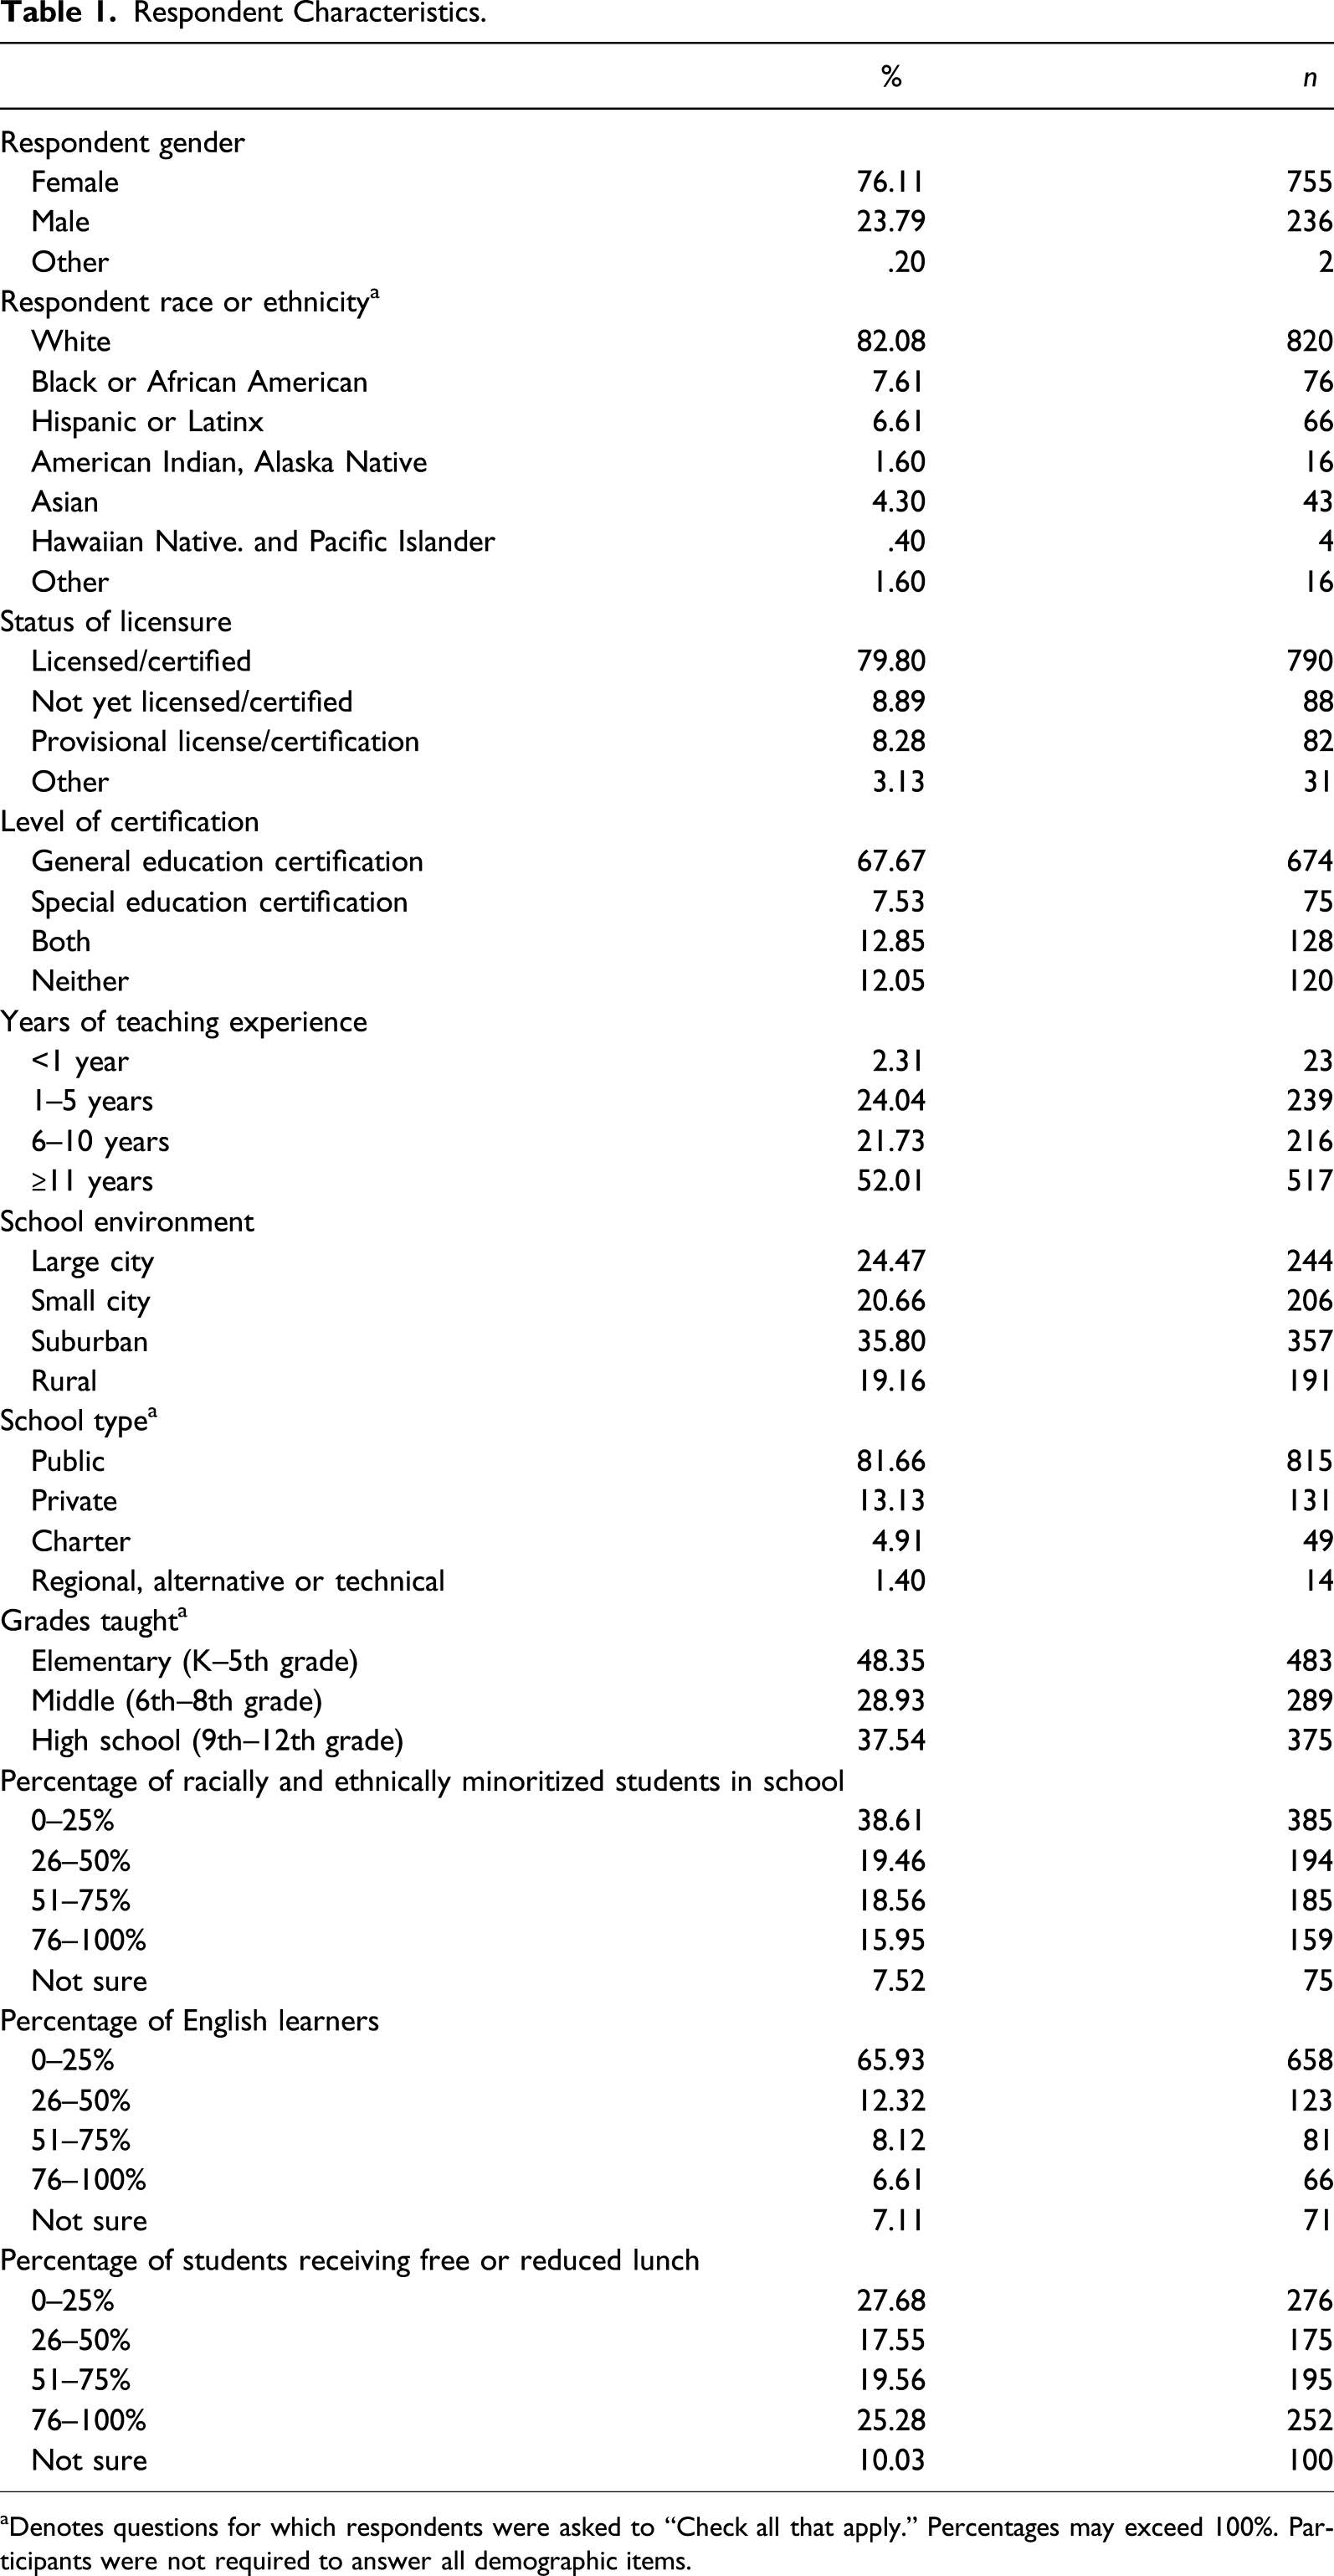
aDenotes questions for which respondents were asked to “Check all that apply.” Percentages may exceed 100%. Participants were not required to answer all demographic items.
Instrumentation
Item Mean, Standard Deviation (SD), Skew, Kurtosis, and Subscale Internal Consistency (ωh).
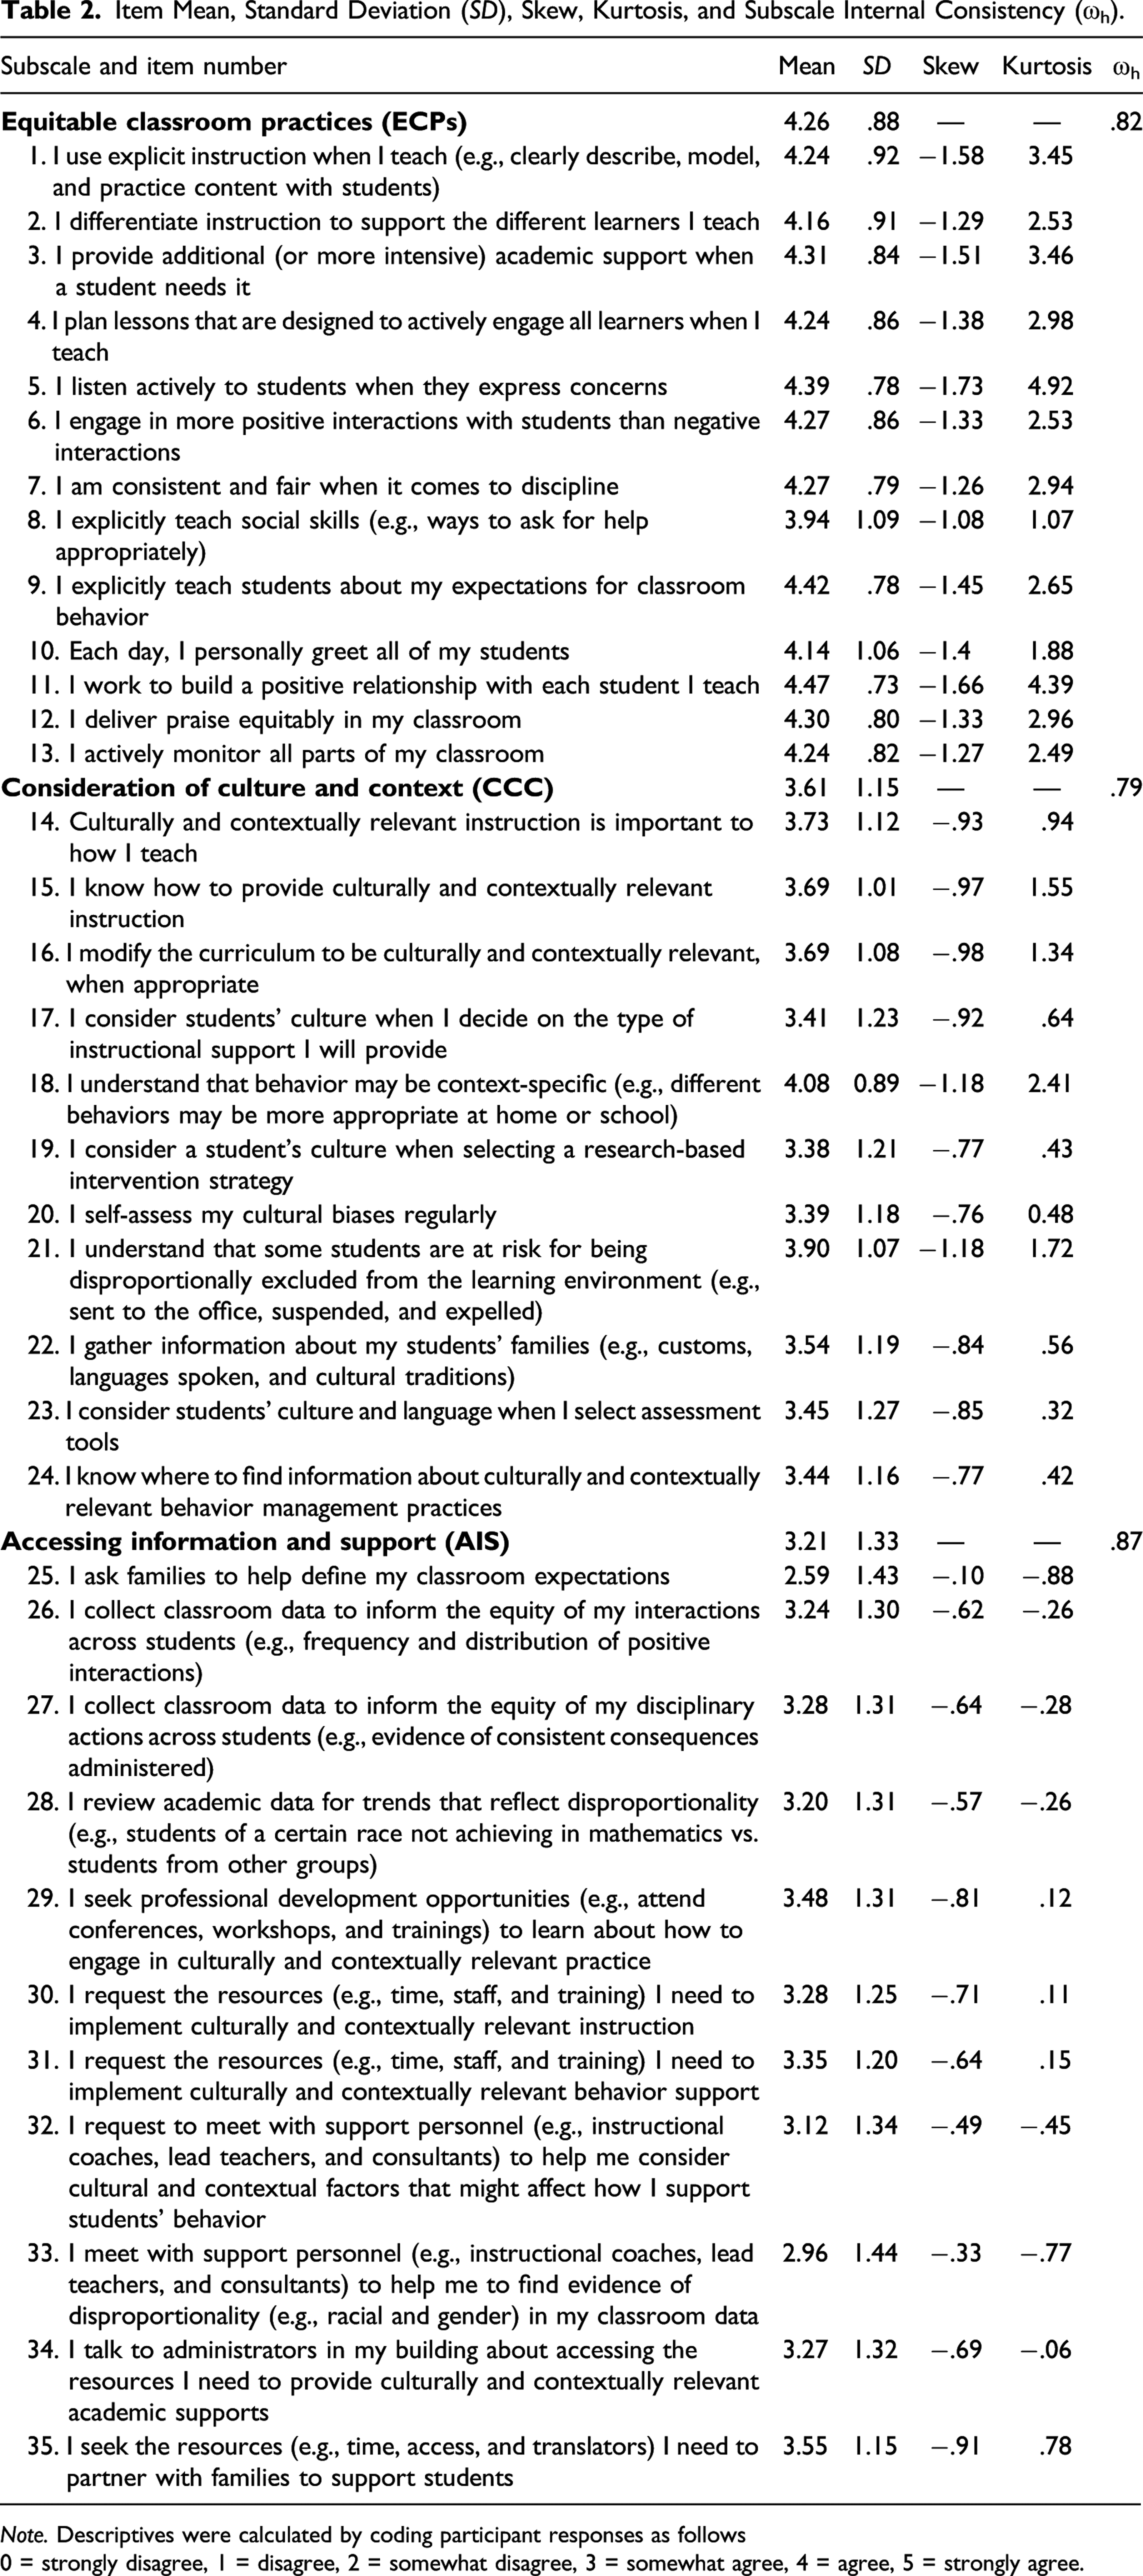
Note. Descriptives were calculated by coding participant responses as follows
0 = strongly disagree, 1 = disagree, 2 = somewhat disagree, 3 = somewhat agree, 4 = agree, 5 = strongly agree.
Analysis
We examined descriptive statistics including item-level frequencies, means, SDs, and ranges. Reliability was assessed using McDonald’s omega hierarchical due to its superiority to Cronbach’s alpha in estimating internal consistency (Trizano-Hermosilla & Alvarado, 2016). To assess DIF, we used an iterative hybrid of ordinal logistic regression and item response theory (IRT; Choi et al., 2011) and included lordif software, similar to the procedure used in other studies of instruments producing polytomous data (e.g., the PROMIS scale; Paz et al., 2017; Reeve et al., 2007). Item response theory can be used to explain the relationship between latent constructs and their manifestations. Some advantages to IRT in scale development include control for confounding influences of sample characteristics, precision, and output that is easily graphed (Osterlind & Everson, 2009). Using an IRT framework to explore DIF allows for a more theoretically and procedurally rigorous examination of patterns than application of other approaches (e.g., classical test theory; Osterlind & Everson, 2009). The probability of a particular outcome, such as a score corresponding with an item on a questionnaire, should occur on a continuum according to the magnitude of the presence of a latent construct and not a separate characteristic (e.g., teacher race and student race). Applying an IRT framework makes this possible to evaluate. Item response graphs reflecting trait levels, inflection points, and other facets of respondent interactions with items can be examined when DIF is identified to assess level of impact on the instrument as a whole.
Evaluative procedures in the current study included the use of likelihood test ratio, an approach that looks at the likelihood of a response pattern when reference and focal group responses are constrained to be invariant versus when they are permitted to vary organically (Osterlind & Everson, 2009). Although assessment of DIF according to an IRT framework assumes unidimensionality, there are some circumstances in which instruments with multiple subscales are sufficiently unidimensional for IRT modeling. Reise et al. (2013) suggest that higher percentage of uncontaminated correlation (PUC) values can indicate fitness for IRT modeling, and when lower than .80, “researchers may consider explained common variance (ECV) values greater than .60 and [McDonald’s omega hierarchical] values greater than .70 as tentative benchmarks” (p. 22). In the absence of major violations to IRT assumptions, there are a variety of benefits to using an IRT framework for evaluation of DIF. Below, we describe how we evaluated IRT assumptions and parameters, and identified the presence of DIF. All statistical procedures were completed using R (version 1.1.423).
IRT Assumptions
The extent to which ACCReS response patterns satisfied IRT assumptions was evaluated across the areas of dimensionality, local independence, and monotonicity. Dimensionality refers to the presence of discrete constructs represented in a scale. In contrast to one underlying construct, the ACCReS is made up of three subscales, and assessment of dimensionality should theoretically align with the three-factor model proposed in Fallon et al. (2021). However, the underlying construct reflected by ACCReS items, teacher cultural responsiveness, was expected to make the instrument sufficiently unidimensional for assessment using an IRT framework. Local independence refers to the uniqueness of each individual item once controlling for a unifying, underlying trait. To investigate local independence, residual correlations (preferably <.20) were examined through organization of a three-factor model using the lavaan (version .6–6; Rosseel, 2012) and psych (version 1.9.12; Revelle, 2019) packages in R to produce standardized residuals. Monotonicity refers to the connection between the presence of an underlying trait in relation to endorsement of an item (Sijtsma & Molenaar, 2002). The mokken package (version 3.0.2; Andries van der Ark, 2012) was used to evaluate assumptions of monotonicity.
Detecting the Presence of DIF
As described above, DIF was evaluated in relation to two demographic binaries: teacher indicated race/ethnicity (REM teacher vs. white teacher) and student racial/ethnic composition (<50% vs. 51–100% REM students in school building). Although we would have preferred to analyze DIF across more than two categories, the sample size for certain racial and ethnic groups (e.g., Black/African American, n = 76; Hispanic/Latinx, n = 66; and Asian, n = 43) informed the decision to treat race/ethnicity as binary. It has been suggested that a minimum of 200 responses per variable of interest is needed when applying ordinal logistic regression (Scott et al., 2009). Therefore, responses from teachers indicating races or ethnicities other than white were aggregated (n = 214; 21.42%) and teachers who only identified as white (n = 785; 78.59%) were compared. The distribution of teachers working in schools with 0–50% and 51–100% REM students (58.07% and 34.51%, respectively) informed the decision to treat this variable as binary, as well.
To examine DIF, we used the lordif package (version .3–3; Choi et al., 2016) due to its strength with handling polytomous data which results from Likert-type response scales. Lordif integrates ordinal logistic regression with IRT-based trait scores, differing from the Rasch model. Lordif applies iterative purification of matching criterion by using group-specific IRT item parameter estimates for items for which DIF has been detected (Choi et al., 2011), identifies anchor items, then uses both to generate trait estimates. Lordif produces three logistic models across all items in an instrument. Model 1 includes the intercept plus an estimate of the trait. Model 2 includes Model 1 plus a group variable. Model 3 includes Model 2 plus the interaction of trait and the group variable (Paz et al., 2017). According to Choi et al. (2011), this algorithm introduced by Crane et al. (2006) presents a favorable alternative to traditional purification methods because it reduces the occurrence of false positive identifications of DIF and can be more precise. Lordif integrates Samejima’s graded response model (GRM; Samejima, 1969) to calibrate data to IRT assumptions. To identify the presence of DIF, the three models generated are compared according to the χ2 likelihood-ratio test. Significance (pseudo R2 value ≥.02; see Choi et al., 2011) in relationships with log likelihood values between Models 1 and 2 indicates uniform DIF, Models one and 3 indicates overall DIF, and Models 2 and 3 indicates nonuniform DIF. Within a logistic regression framework, identification of uniform DIF would represent DIF in which the effect was constant, whereas nonuniform DIF would be detected if effect varied according to trait level. Potential for the examination of uniform, nonuniform, and overall DIF is among the advantages to the application of lordif’s hybrid model with elements of IRT and ordinal logistic regression, particularly helpful for clarifying the impact and magnitude of DIF when identified. There are various available strategies for interpreting output. The current analysis used McFadden’s pseudo R2 (see Lambert et al., 2018; Paz et al., 2017) to cross-compare each of the three models across items to indicate DIF (Menard, 2000).
Results
Assessment of IRT Assumptions
In a previous study (Fallon et al., 2021), dimensionality was explored using exploratory factor analysis (including review of parallel analysis and factor loadings). Results from a national sample of teachers (n = 500) yielded the three factors described above. A confirmatory factor analysis conducted with a separate national sample of teachers (n = 400) produced acceptable internal consistency but mixed results with regard to adequacy of model fit (see Fallon et al., 2021). A PUC value of .68 (<.80) necessitated review of ECV (.58) and McDonald’s omega hierarchical (.71), both indicating the absence of severe violations to IRT assumptions according to one tentative framework evaluating sufficiency for IRT modeling (Reise et al., 2013). Of note, four items were flagged for potential uncontrolled local dependence. Results revealed that the largest absolute residual correlation was >.20 for the following pairs of items: Items 2 and 18 (.22), Items 3 and 18 (.21), Items 4 and 18 (.24), and Items 8 and 35 (.22). These items were included, nonetheless, because correlations were close to .20 and were considered to have minimal potential impact on results. Nonsignificant violations of manifest monotonicity were detected in 19 ACCReS items. Significant violations were identified corresponding with one item (Item 21); however, this item was retained based on its potential clinical utility toward the overall purpose of the instrument.
Identification of DIF and Assessment of Impact
Differential Item Functioning (DIF) Results for Racially and Ethnically Minoritized Teachers and white Teachers.

Note. Pseudo R2p value ≥0.02 indicates statistically significant DIF.
aModel 1 (intercept + rating) versus Model 3 (Model 2 + rating * group).
bModel 1 (intercept + ability) versus Model 2 (Model 1 + group).
cModel 2 (Model 1 + group) versus Model 3 (Model 2 + rating * group).
Differential Item Functioning (DIF) Results for Teachers in Schools with 0–50% REM Students and Teachers in Schools with 51–100% REM Students.
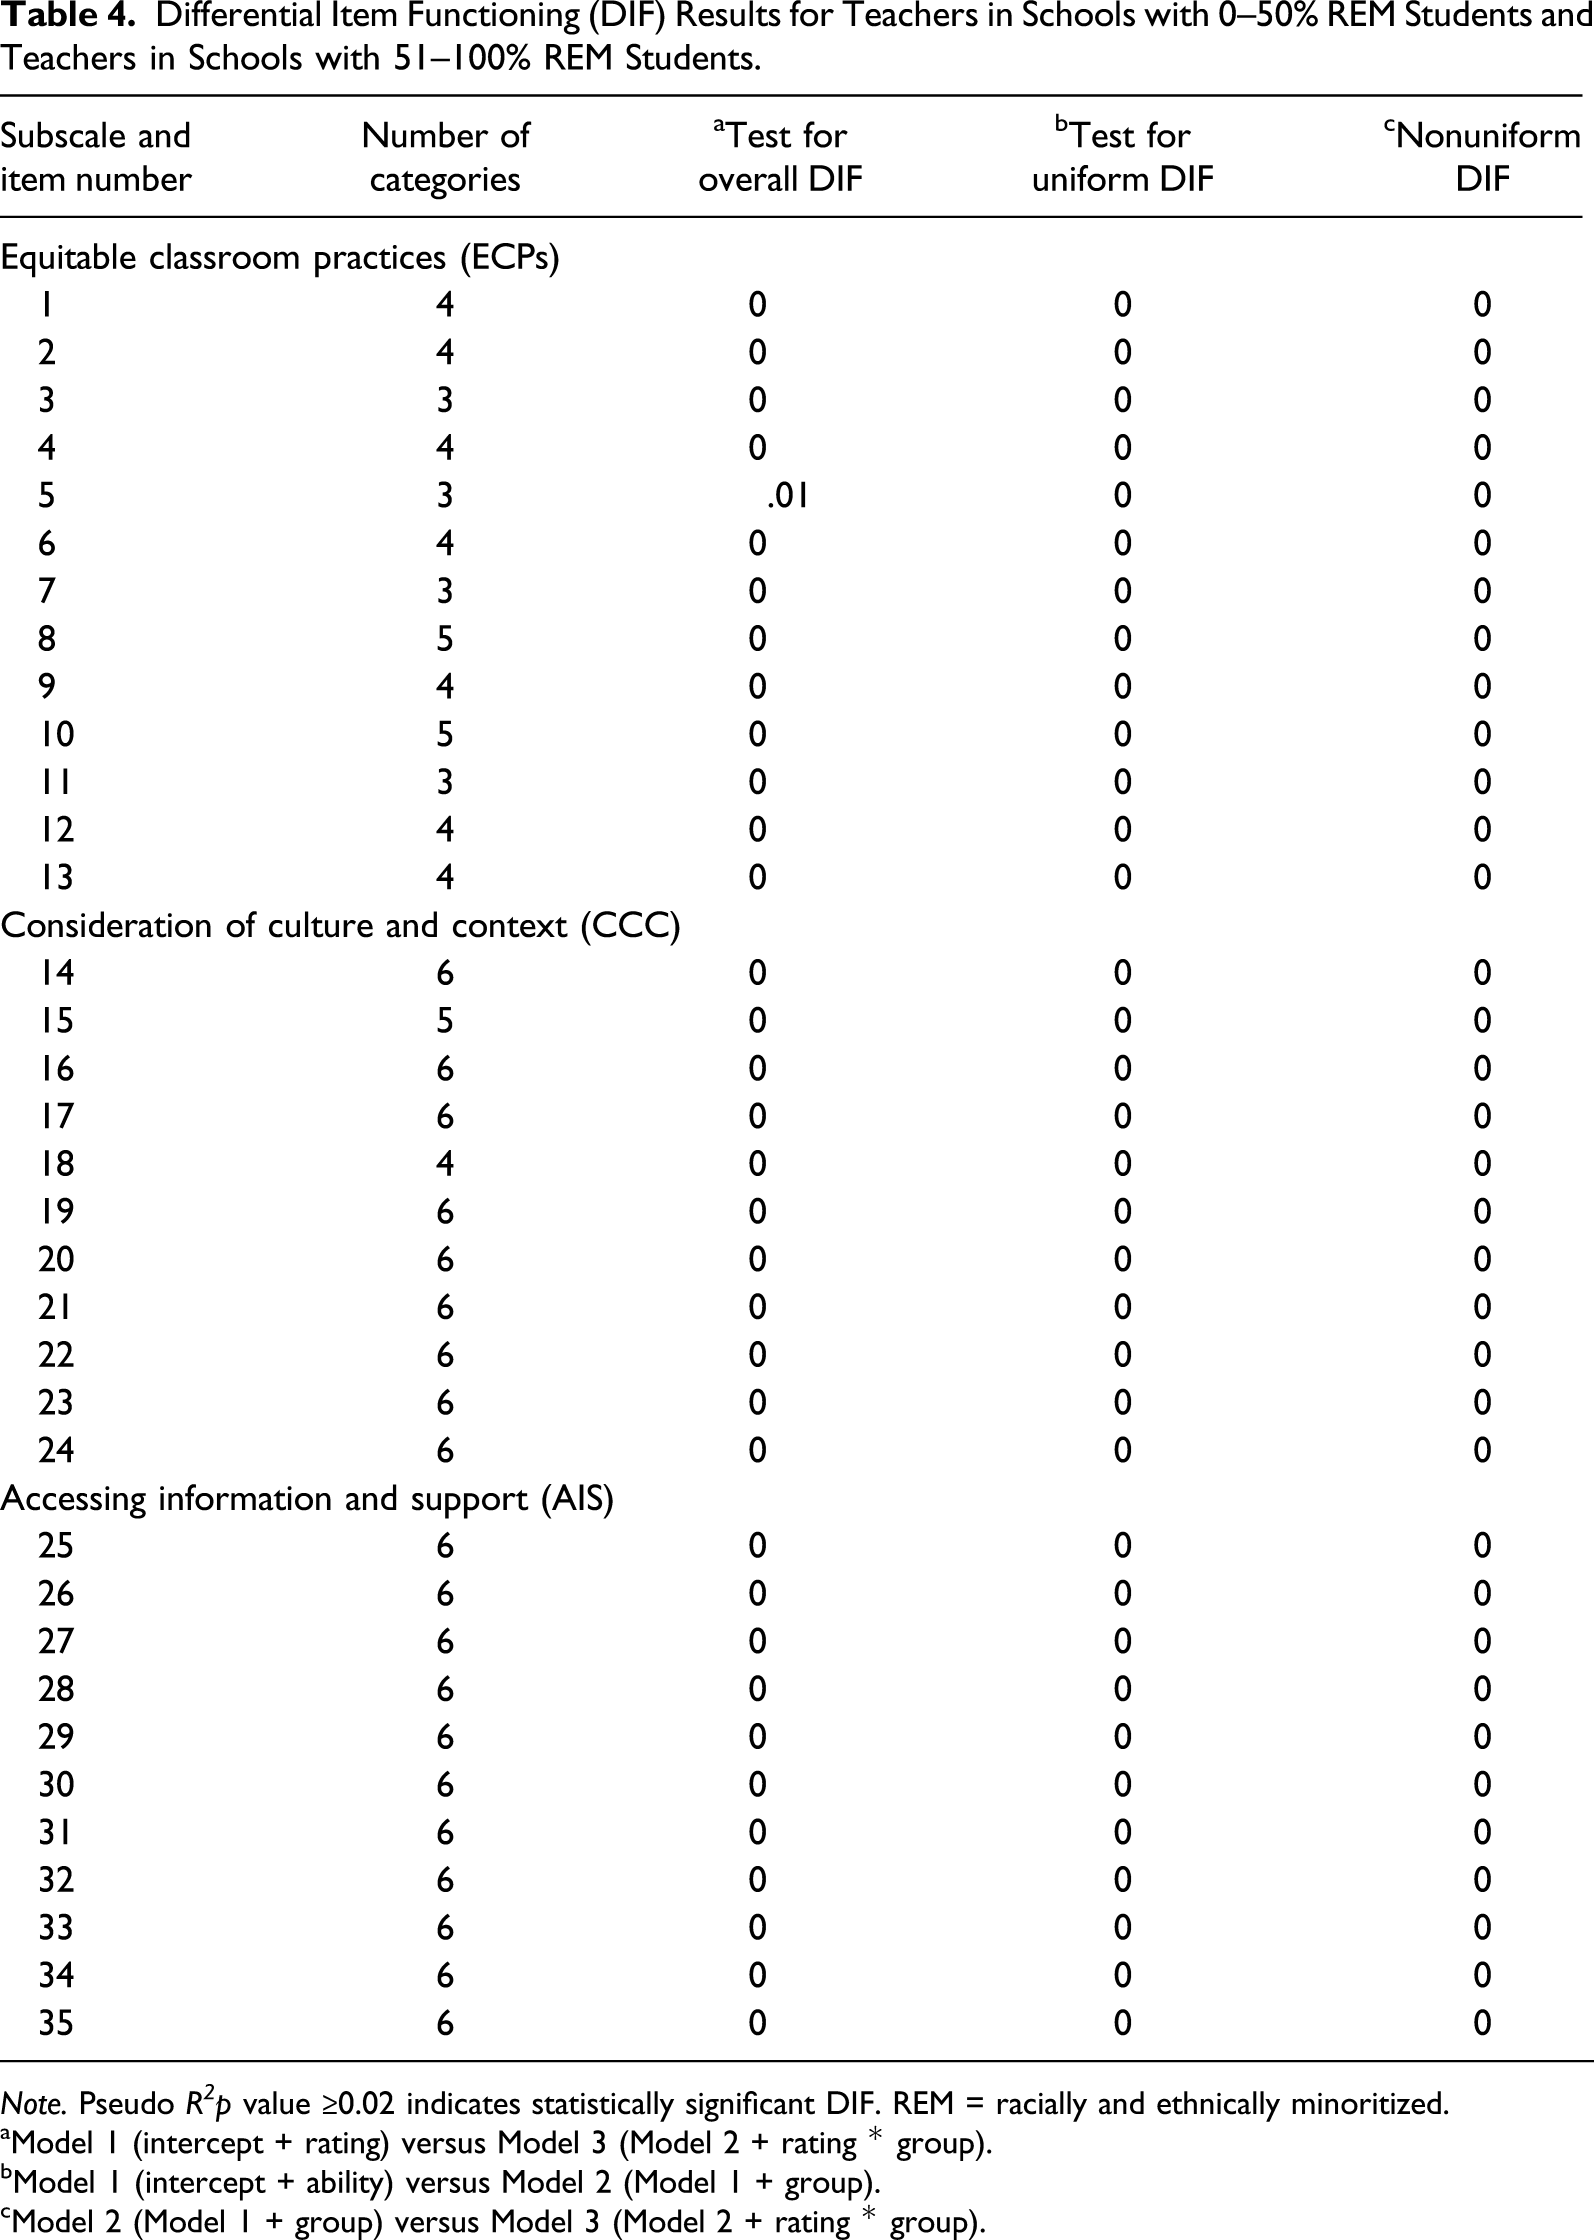
Note. Pseudo R 2 p value ≥0.02 indicates statistically significant DIF. REM = racially and ethnically minoritized.
aModel 1 (intercept + rating) versus Model 3 (Model 2 + rating * group).
bModel 1 (intercept + ability) versus Model 2 (Model 1 + group).
cModel 2 (Model 1 + group) versus Model 3 (Model 2 + rating * group).
Differential Item Functioning (DIF) Results for Teachers with <1–5 Years of Teaching Experience and Teachers with >5 Years of Teaching Experience.
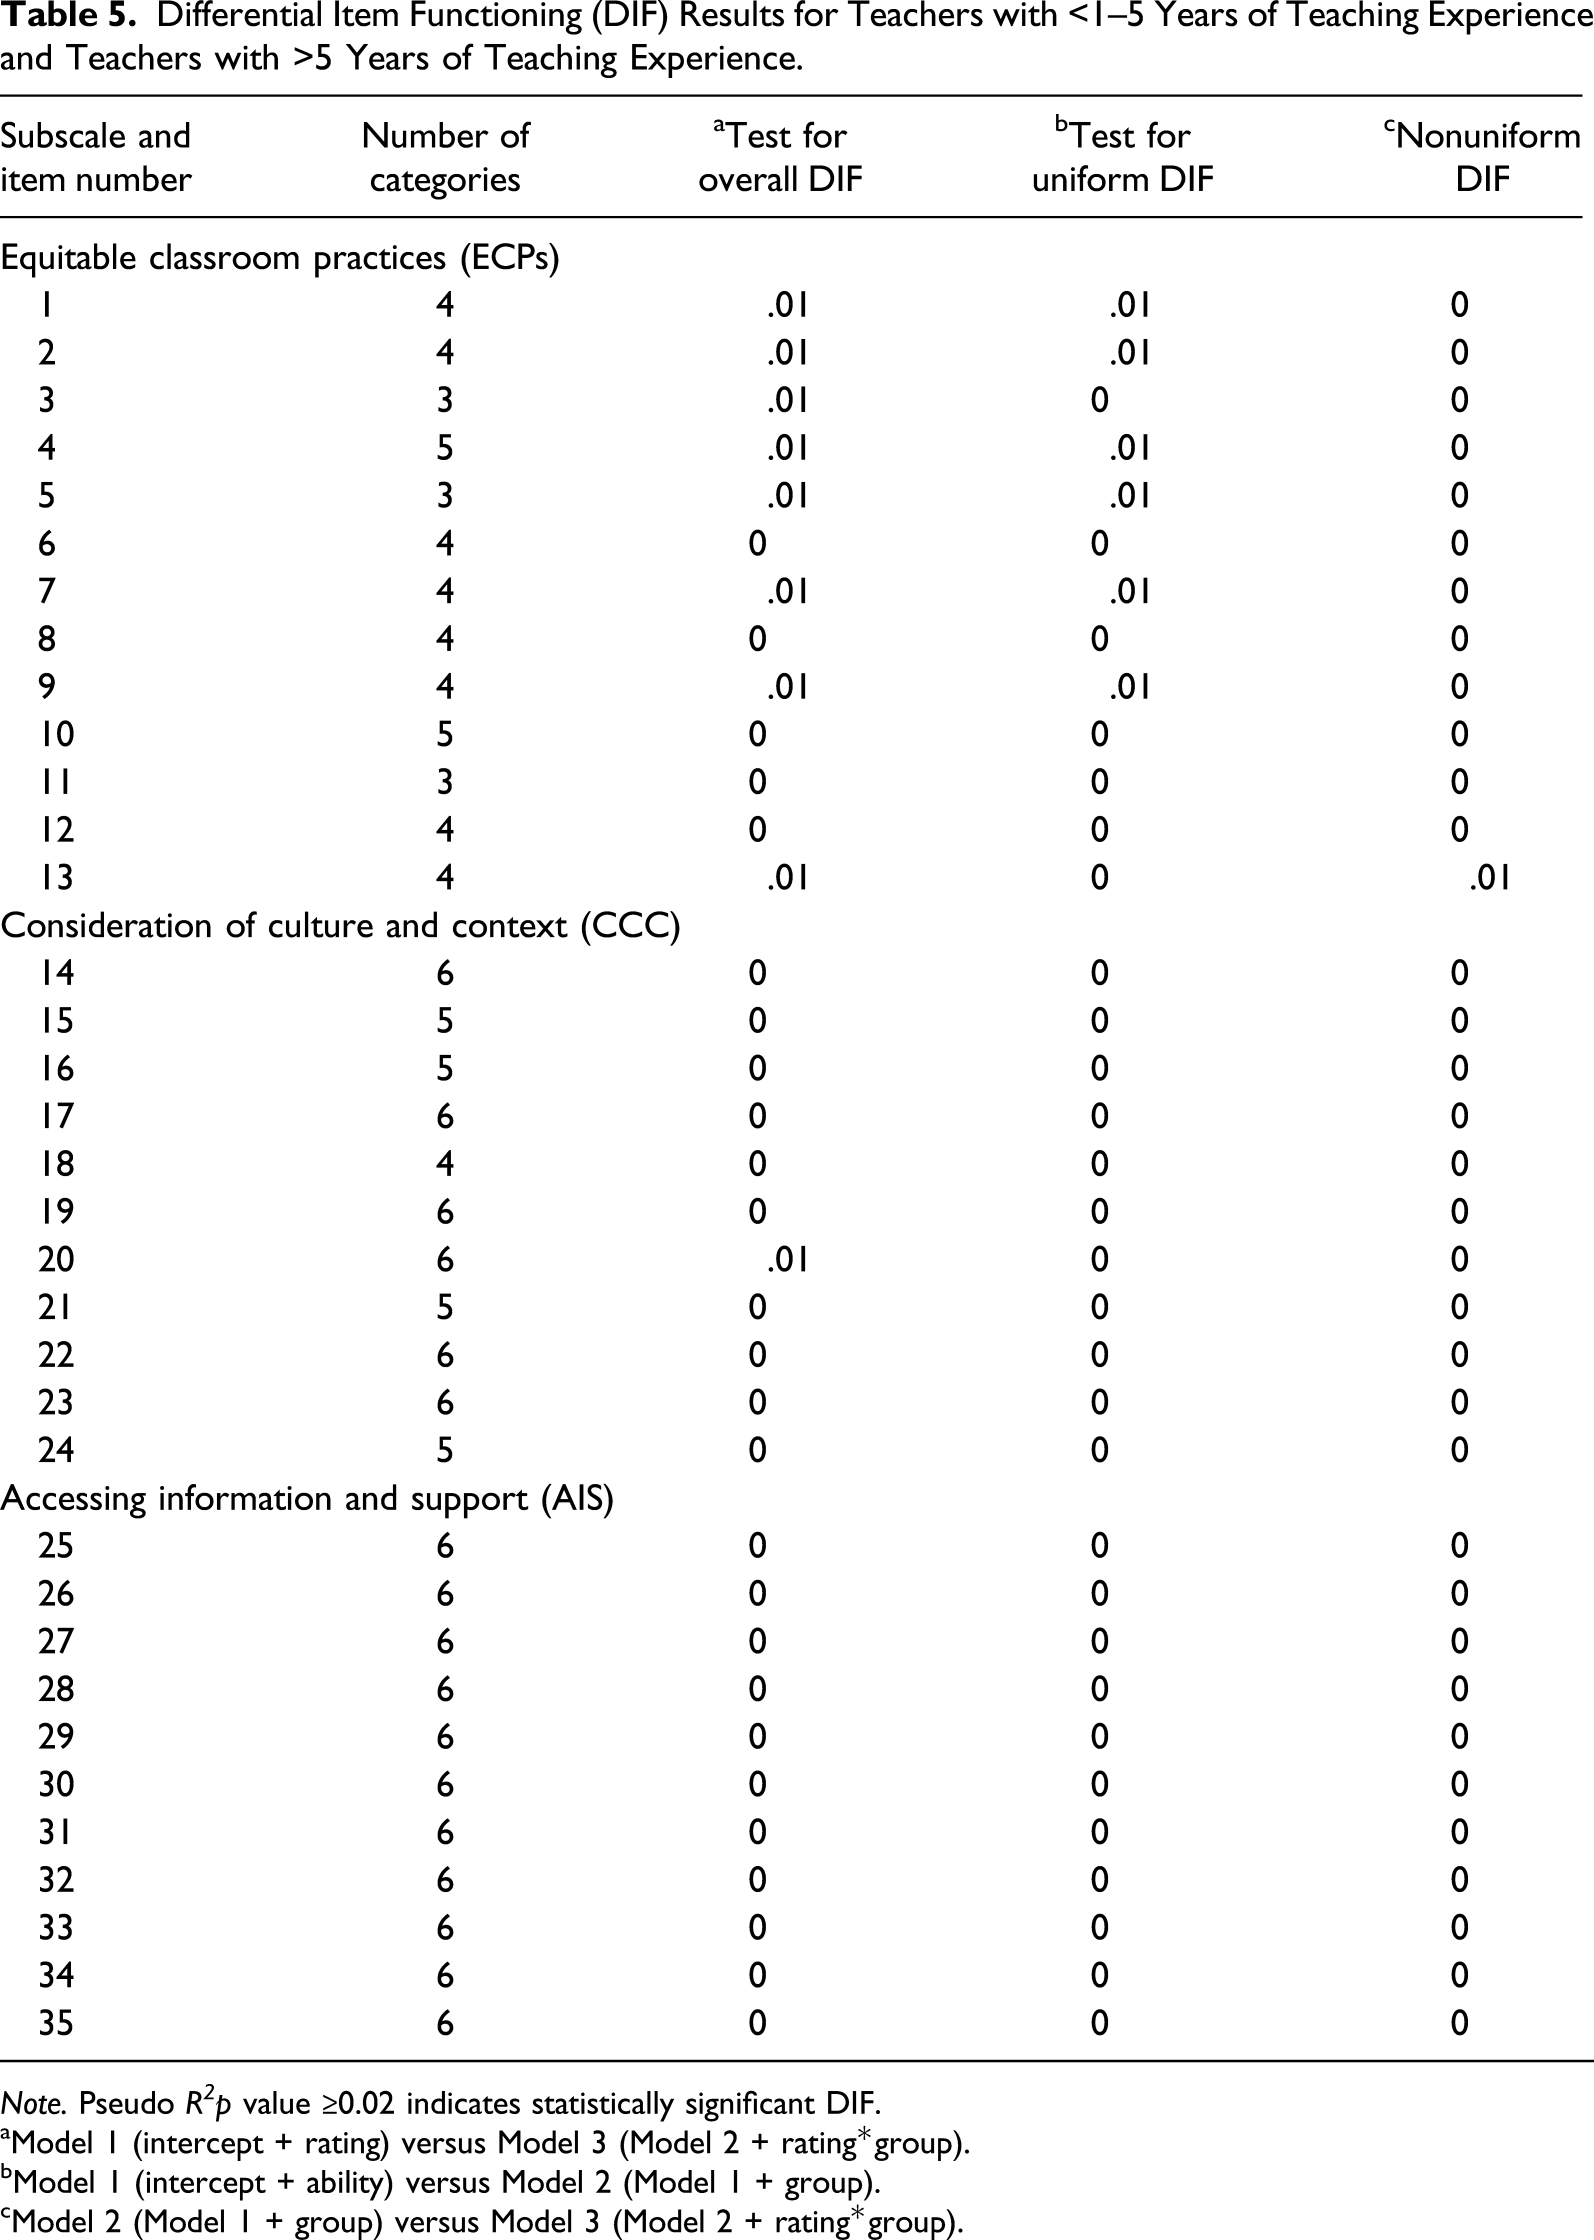
Note. Pseudo R 2 p value ≥0.02 indicates statistically significant DIF.
aModel 1 (intercept + rating) versus Model 3 (Model 2 + rating*group).
bModel 1 (intercept + ability) versus Model 2 (Model 1 + group).
cModel 2 (Model 1 + group) versus Model 3 (Model 2 + rating*group).
Descriptive Statistics
The mean response category across all ACCReS items was somewhat agree (M = 3.73). Response patterns across all ACCReS items were negatively skewed—such that teachers tended to favor response categories consistent with better-supported practices, and responses inconsistent with favorable practices (growth areas) represented outliers. Respondents agreed the most with items associated with the ECP factor (mean range 3.94–4.47) and least with items associated with the AIS factor (mean range 2.59–3.55). With the exception of items described previously, respondents interacted with the full range of ACCReS response options. Findings reflected acceptable to good internal consistency; McDonald’s omega hierarchical coefficients for the ACCReS subscales were .82 (ECP), .79 (CCC), and .87 (AIS), and .71 for the complete instrument. This indicates that items comprising each subscale are sufficiently related to one another and provide evidence that the ACCReS items in each subscale reflect a single unifying construct (cultural responsiveness). This is important for its use as a measure of teachers’ perception of their culturally responsive practice in the classroom for use in decision-making about professional development needs.
Discussion
The aim of this study was to determine whether items on the ACCReS demonstrated measurement invariance across participants. Overall, findings indicated that items did not demonstrate significant DIF when comparing responses from (a) REM teachers and white teachers, (b) teachers in schools with 0–50% and 51–100% REM students, as well as (c) teachers with <1–5 and >5 years of teaching experience. These findings also provide additional evidence toward the technical adequacy of the ACCReS as a teacher self-report measure of cultural responsiveness. The absence of evidence for DIF provides preliminary evidence that scores can be compared across variables of interest including teacher race/ethnicity, percentage of REM students in the school, and years of teaching experience in future research without underlying limitations to the instrument. In practice, the current analysis suggests there should not be systematic differences in scores based on the teacher and student demographic variables investigated in this study.
On average, items on the ECP subscale were rated higher than items on the CCC and AIS scales in the sample of 999 educators (see Table 2). This may be because items on the ECP primarily target foundational behavior management and instructional practices, whereas items on the CCC and AIS ask about explicit consideration for students’ culture, and access to external data, support and training, respectively. Teachers may perceive items on the CCC and AIS scales as containing areas in which additional training or support might be beneficial. For instance, the item “I meet with support personnel (e.g., instructional coaches, lead teachers, and consultants) to help me to find evidence of disproportionality (e.g., racial and gender) in my classroom data” had a lower average rating than other items on the ACCReS and AIS subscale in particular, indicating this may be an area of need for educators.
Limitations and Future Research
Findings should be interpreted with consideration of the study’s limitations. First, the sample is comprised of participants from three prior studies, all of whom were educators preregistered as potential panelists with Qualtrics (Fallon et al., 2021). Although this may introduce sampling bias, the large national sample of participants was representative of US teacher demographic trends (US Department of Education, 2016), taught in a variety of school settings (urban and rural), and instructed youth across grade levels (elementary and secondary). Although the sample was sufficient for analyses, many participants identified as white and it was not possible to examine DIF beyond a binary operationalization of teacher race/ethnicity. There are significant disadvantages to bifurcating race in analyses. Ideally, the sample size for specific race and ethnicity categories would have allowed for a more comprehensive analysis. In future research, this limitation should be addressed. The potential for inflation of Type I error rates in DIF analyses with unequal reference and focal groups (Herrera & Gómez, 2007) could also be better accounted for in additional, detailed analysis of DIF in relation to teacher race and ethnicity. The use of an IRT framework with a multidimensional instrument may be considered a limitation. However, this decision was carefully reasoned, aligned with the analyses of similarly structured instruments (Paz et al., 2017; Reeve et al., 2007). Further, the significant violation of monotonicity identified in one item is also a potential limitation. However, this item was considered critical to educators’ understanding of underlying issues pertaining to the use of the ACCReS. Due to the purpose of the instrument (i.e., to help identify targets for teacher professional development and support), it was retained.
Additional research might also target DIF analyses with teachers of students from specific racial/ethnic groups, specifically those from groups disproportionately represented in disciplinary data (e.g., Black/African American, and Hispanic/Latinx). It may also be important to conduct the analysis with more than the two groups reflecting percentage of REM students and teachers’ years of experience as treating both variables as binary may have compromised the quality of these data in our analyses. Finally, future research might address comparing teachers’ ratings on the ACCReS and their actual classroom practice, or distal outcomes that may result from a culturally responsive approach (e.g., more time engaged in learning and less exclusionary disciplinary). This would provide evidence of concurrent and predictive validity, respectively.
Conclusion
Findings from the current study indicate ACCReS items were invariant across REM and white teachers, as well as educators in buildings with 0–50% and 51–100% REM students, and teachers with <1–5 years and >5 years of teaching experience. These results support its continued validation for use in research- and classroom-based practice. Teachers’ assessment of their culturally responsiveness is a small piece of confronting systemic racism in schools to establish more equitable and effective learning environments.
Footnotes
Declaration of Conflicting Interests
The author(s) declared no potential conflicts of interest with respect to the research, authorship, and/or publication of this article.
Funding
The author(s) disclosed receipt of the following financial support for the research, authorship, and/or publication of this article: The US Department of Education’s Institute of Education Sciences supported this research through Grant R324B170010 to the University of Massachusetts Boston. The opinions expressed are those of the authors and do not represent views of the Institute or the US Department of Education.