



Abstract
In this article, we report on the development of two latent soft skills progress variables using the Berkeley Evaluation and Assessment Research (BEAR) Assessment System (BAS). The Social Evaluative Reasoning in the Workplace (SER-W) instrument uses comic strip scenarios to depict interactions between employees and customers in entry-level workplace settings. We designed items to elicit evidence of student ability to: (a) identify salient customer social cues, which we term the social cue detection (SPU) variable, and, (b) justify an evaluation on the outcome of the situation depicted in the scenarios. We refer to this as the evaluative inference (EI) variable. Research from the field of autism spectrum disorder was used to develop a theory for building social complexity into the SER-W comic strip scenarios, by manipulating the type, frequency, and co-occurrence of the social cues presented in the scenarios. A unidimensional and multidimensional extension of the Rasch partial credit model were fit to the data. Model comparisons provide empirical support for our hypothesized two-dimensional structure, in which the SPU and EI variables are modeled as separate dimensions. These results are considered in terms of the evidence for the validity of the internal structure of the SER-W dimensions they provide. The article concludes with examples of the practical implications that progress variable research can have on soft skills curriculum development and assessment in the field of special education.
Soft skills refer to a cluster of workplace-specific skills and personal capabilities used by employees to understand and manage the interpersonal demands of their jobs. Although there are many examples of soft skills (e.g., 21st century skills, 2014), common categories include: (a) communication, (b) enthusiasm and attitude, (c) teamwork, (d) networking, (e) problem solving, (f) critical thinking, and (g) professionalism (U.S. Department of Labor, nd). By contrast, hard skills refer to the employee’s ability to perform different types of job-specific tasks such as stocking shelves or operating machinery (Devedzic et al., 2018).
In special education, student individualized education plans (IEPs) beginning at age 16 must provide needed instruction, services, or community experiences that support the transition from high school into adulthood. A common focus for students during the transition period is on vocational development. Cognitive-developmental models as they are applied in this area suggest that people develop through qualitatively distinct stages of behavior over the course of career maturation (Neimeyer et al., 1985). Gained work experiences and other professional development activities, according to these models, influence the development of more nuanced schemata for understanding workplace behavior and making more cohesive and comprehensive interpretations of it (Tiedman & O’Hara, 1963). For many secondary students with disabilities, the transition period in secondary school is the initial stage in this maturational process.
Research into school factors that are associated with positive post-school outcomes for students with disabilities has identified soft skills instruction and assessment of soft skill as two examples (Rowe et al., 2015). These services are common for students with autism spectrum disorder (ASD) who may experience difficulty with the soft skill demands of workplaces due to challenges with social communication and social interaction. In the workplace, these challenges manifest as difficulty: (a) reading between the lines (i.e., grasping meaning in social situations); (b) understanding the social requirements of jobs; (c) with social interactions and understanding conventional ways to act in the neurotypical world; (d) reading facial expressions and tone of voice; and (e) understanding figurative language such as sarcasm, metaphor, and irony (e.g. Happe, 1995; Hendricks & Wehman, 2009; Hurlbutt & Chalmers, 2004; Muller et al., 2003). In this study, we use research from the field of ASD as a reference point to develop a general model of the factors that contribute to social complexity in the workplace that is applicable to a wider range of secondary students and adults, both with and without disabilities.
Common approaches to soft skills assessment include self-report measures and observation. Jardim et al. (2020) use self-report in the Soft Skills Inventory (SSI) which was designed to assess six categories of soft skill behavior that college students need for academic and professional success. The authors used exploratory factor analysis and a graded response model to investigate and refine the dimensional structure of the SSI and confirmatory factor analysis to validate the proposed six-factor data structure. The utility of the SSI is that it can be used to better prepare students with the skills they need to meet personal, social, and work-related challenges while attending college. The grading soft skills (GRASS) approach is an example that uses observation. The GRASS includes a set of principles to operationalize skill-specific performance indicators of a person’s soft skills (e.g., the observable indicators of effective communication). These skills are then assessed using teacher-developed rating scales (Devedzic et al., 2018). A strength of the GRASS approach is that it emphasizes the importance of defining low-inference indicators which are an improvement over other metrics for defining student soft skills which are often vague and implicit.
Currently, there is a lack of research on the development and psychometric properties of instruments that might be useful for measuring the soft skill competencies of secondary students in special education. A partial explanation for this is that principled measurement frameworks that use latent variable modeling approaches have yet to be widely applied in the soft skills domain. An example of this kind of framework is the BEAR Assessment System (BAS; Wilson, 2005; Wilson & Sloane, 2000). Four elements, commonly referred to as “building blocks,” are central to assessment design in the BAS.
The first building block is to define and elaborate the latent constructs to be measured by an assessment. The structure of a construct is research-based and represented with a construct map. Construct maps include descriptions of each construct level and general descriptions of the relevant qualities of student responses/performances at each level. In applications of the BAS, constructs can be represented with progress variables (Wilson & Sloane, 2000). The notion of a construct map is consonant with what the National Research Council (2011) identifies as one of the valid components of an assessment system, viz., a model of student cognition. A model of student cognition is defined as a research-based theory about how students develop from low- to high-proficiency in a particular subject area or performance domain. Construct maps are an effective tool for outlining what this development might look like, recognizing that there may need to be multiple construct maps for complex cognitions.
The second building block is to use the construct definitions to guide the items design process. The objective at this stage is to produce a set of items that targets each of the levels of the construct map. Building block three is to develop a system for coding student responses by assigning them to categories, and then scoring them to be indicators of different construct levels (Wilson, 2005). Building block four is to select and apply a measurement model. The purpose of the measurement model is to relate the scored outcomes from the items design and outcome space back to the construct map (Wilson, 2005).
Science education has been a productive area of research for the development of progress variables using the BAS. Kennedy et al. (2005) used the approach to develop and validate a reasoning progress variable which was used to align assessment activities to pre-existing science curriculum. The reasoning progress variable includes four-levels. The lowest level on the construct is when students provide inadequate explanations in which they do not provide a justification for their answers. At the experiential level, the student is able to justify an answer by appealing to prior experience (i.e., the student has already observed or been taught what will happen). At the relational level, the student uses a relationship of the form “because X is Y”, which applies specifically to object X. At the highest level of the reasoning progress variable, students use abstract principles that apply to objects in general (Kennedy et al., 2005).
In principle, there is no reason why the BAS framework cannot be applied in soft skills assessment design for secondary students and adults with disabilities—the idea of a progress variable is right at home in special education, where the final aim of all IEPs is to help students make progress. Toward this end, we describe the development of the Social Evaluative Reasoning in the Workplace (SER-W) instrument to illustrate how the BAS can be used to develop progress variables in the soft skills domain. SER-W is defined as the ability to evaluate the appropriateness of employee behavior as it occurs in response to a customer’s verbal and nonverbal social cues in entry-level workplaces that are heavy in soft skill demand. The intended use of the SER-W instrument is as a formative tool for identifying students who, whether for disability-specific reasons or for lack of relevant experience, may be at risk of experiencing negative employment outcomes due to challenges with understanding and negotiating the soft skills demands of entry-level workplaces. We focus exclusively on the workplace context because “appropriate” workplace behavior is often dictated by context-specific situational and social discourse rules that are unlike other social contexts such as school and community settings (Trower, 1984).
The results of an empirical study of the psychometric properties of the SER-W instrument are presented, with an emphasis on the extent to which the results provide validity evidence based on the internal structure of the SER-W constructs. The Standards for Educational and Psychological Testing (American Educational Research Association, et al., 2014) define this category of validity as “the degree to which the relationships among test items and test components conform to the construct on which the proposed test score interpretations are based” (p. 13.) we emphasize this strand of validity evidence in order to lay the foundation for the definitional validity of the SER-W constructs (Krause, 2012).
Our hypothesis is that SER-W proficiency can be successfully modeled with two component constructs. The social cue detection (SPU) construct targets the student’s ability to identify and interpret different types of basic and complex emotional cues in workplace scenarios. The structure of the SPU construct is derived from research into the nature of challenges experienced by people with ASD, in the recognition of nonverbal social cues. Baron Cohen et al. (2001) found that adults with ASD were significantly less successful at identifying complex emotions, such as annoyance, confusion, and impatience, but equally successful at identifying basic emotions such as happiness, sadness, anger, disgust, and surprise when presented with an emotional recognition task. According to the authors, basic emotions are recognizable purely as emotions, without the need to attribute a belief to an individual (Baron-Cohen et al., 2001). Complex emotions, in contrast, involve the attribution of a belief or intention to an individual. This is a more complex process that involves perceiving and integrating different pieces of contextual information. For students with ASD, the idea of context blindness has been theorized as difficulty using multiple sources of social and environmental context when constructing meaning in social situations (Pierce et al., 1997; Vermeulen, 2015). Figure 1 shows our hypothesized SPU construct map. Social cue (SPU) detection construct map.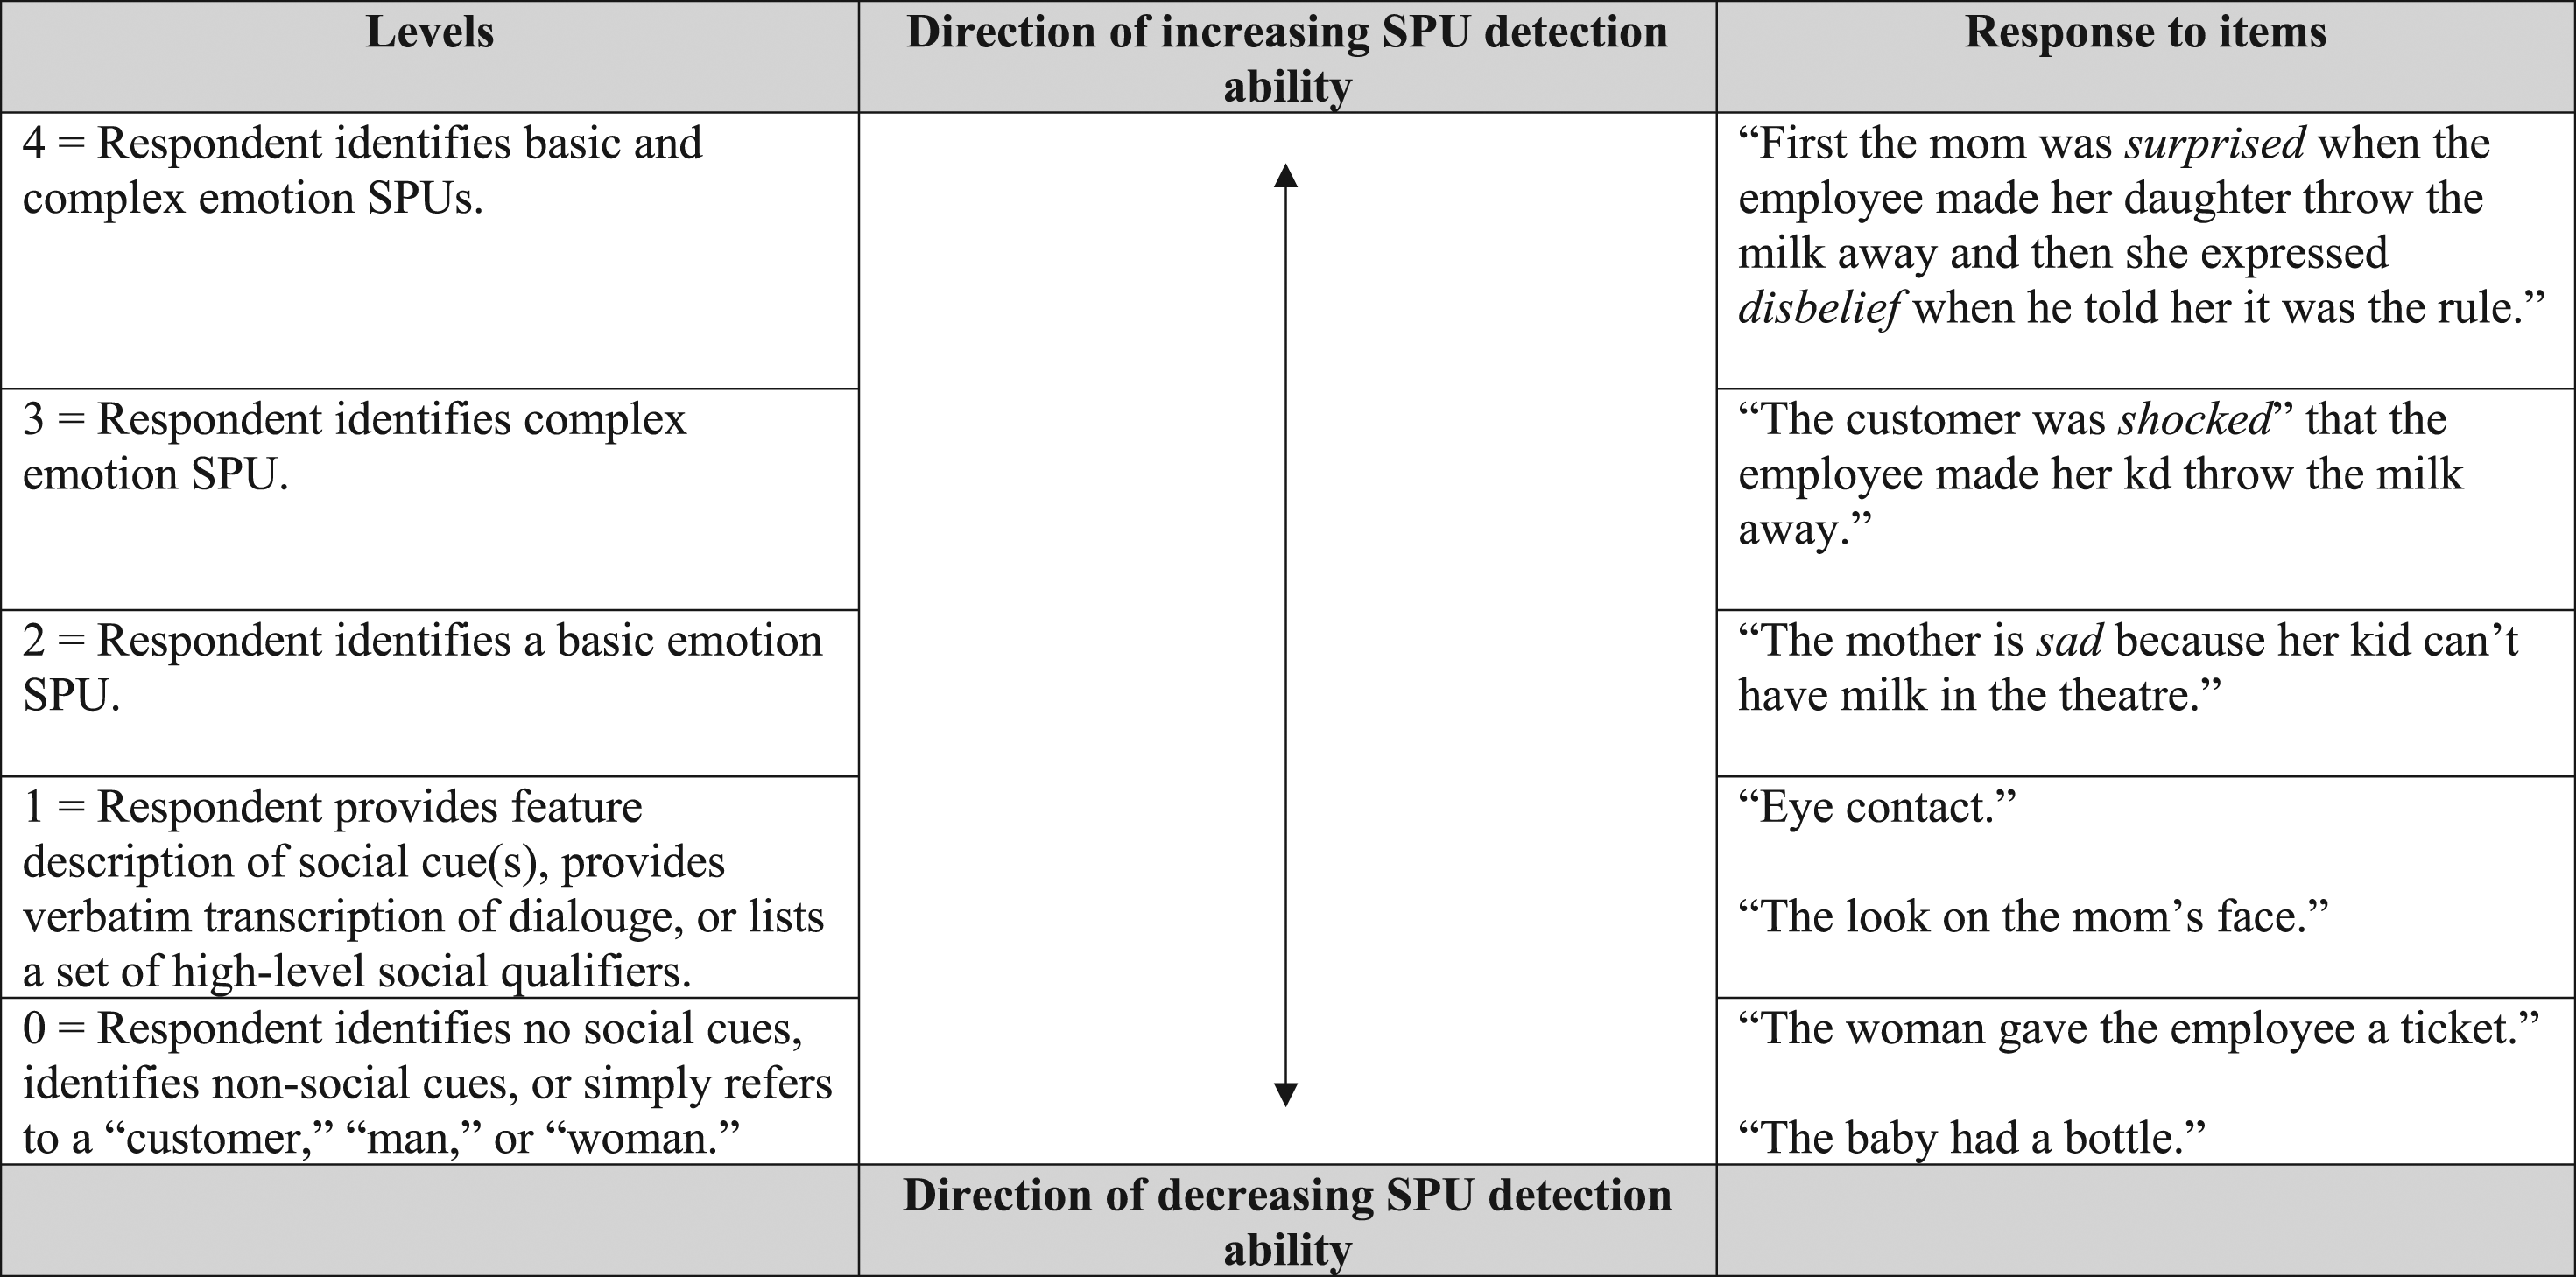
The evaluative inference (EI) construct targets the student’s ability to evaluate if an employee’s behavior was appropriate for the situations depicted in the workplace scenarios.
The structure of the EI construct is not informed by a specific field of research. It is essentially based on Pearson's (1978) distinction in the field of reading comprehension, between the idea of textually implicit and scriptially implicit questions. Textually implicit questions can be answered using information that is explicitly present in a text. To answer scriptially implicit questions it requires using information that is not explicitly presented in a text, such as prior learning and relevant background knowledge—which is seen as being encapsulated for the reader in terms of “scripts.” Students at level 2 of the EI construct include evidence of prior learning and relevant background knowledge (i.e., the “scripts” they know about). Students at level 1 rely on information that is explicitly present in the scenarios to inform their evaluations. Students at level 0 make incorrect evaluations or fail to support them. See Figure 2 for the hypothesized EI construct map. Evaluative inference construct map.
Importantly, teaching strategies to detect and understand social cues and how to evaluate employee behavior in workplace scenarios are common to cognitive processing approaches to teaching workplace social skills, which have proven successful for young adults with disabilities (e.g., Collet-Klingenberg & Chadsey-Rusch, 1991; Park & Gaylord-Ross, 1989).
Methods
Materials
The SER-W Instrument
The SER-W instrument includes sixteen, three-panel comic strip scenarios that depict workplace social interactions between a target employee and customer (see Figure 3 for an example. See Supplemental Figures S1-S16 in electronic supplements for the full set of scenarios). The comic strips were developed using Storyboard That (2018) online comic strip development software. The first author used his experiences as a job coach working with young adults with ASD and other disabilities in competitive and supported employment settings to inform the content of the workplace scenarios, in addition to some of the anecdotal accounts of challenging situations reported by participants in the program and the research on workplace challenges for employees with ASD reported above. Baby bottle: Incorrect resolution (Mi).
The SER-W scenarios were reviewed by doctoral students in a quantitative methods and evaluation in education program, a special education teacher, and a transition specialist. Additionally, six high school students who received speech language therapy for social pragmatic challenges, and their speech language pathologist (SLP), participated in a group cognitive lab interview. The general consensus of the group was that using comic strips to present the workplace scenarios was the next-best medium for presentation compared to video. For example, the SLP indicated “therapeutically, the visual format makes so much sense...it will lead to data that is much more ‘realistic’ in terms of how well students would be able to handle these kinds of workplace situations in real life” (personal communication, October 18, 2017).
The SER-W instrument uses constructed response items to elicit responses at the various levels of the SPU and EI constructs. Students respond to the same two items after each comic strip: (1) List all of the social cues that were available to the employee in this scenario (SPU item); and (2) Overall, did the employee do the right thing in this scenario? Why? (EI Item).
Scenarios were populated with characters from each of the racial groups represented in the Storyboard That (2018) character bank and included a roughly equal distribution of males and females. No characters with visible disabilities were included. Additionally, we used a variety of common, entry-level employment settings in the comic strips (e.g., retail, restaurant, and grocery store settings).
We applied Embretson's (1998) Cognitive Design Systems Approach (CDSA) in the effort to manipulate the social complexity of the SER-W comic strip scenarios. In the CDSA, research findings are used to generate hypotheses about the item stimulus properties that should impact the difficulty of correctly answering assessment items. In this application, we operationalized our model of social complexity in the comic strip scenarios by manipulating the presentation of three item stimulus properties: (1) Emotion—the frequency and co-occurrence of Basic and Complex emotional cues; (2) Language—the frequency and co-occurrence of Literal and Figurative language cues; and (3) Resolution—whether or not the target employee resolved the scenario Incorrectly or Correctly. Each comic strip scenario included two variants: one in which the employee resolved the scenario correctly and one in which the employee resolved the scenario incorrectly. Within these scenario pairs, presentation of the remaining properties was held constant. Additionally, the comic strip scenarios varied in terms of the frequency and co-occurrence of the emotion and language cues presented in them. Consistent with the research discussed above, we hypothesized that complex emotions and figurative language cues would be more difficult to detect than basic emotions and that scenarios that included multiple types of SPUs would be more difficult to evaluate correctly than scenarios that included fewer examples. Regarding the impact of the incorrect versus correct property on the difficulty of evaluating the scenarios correctly, we did not have a specific hypothesis.
Item design Q-matrix.
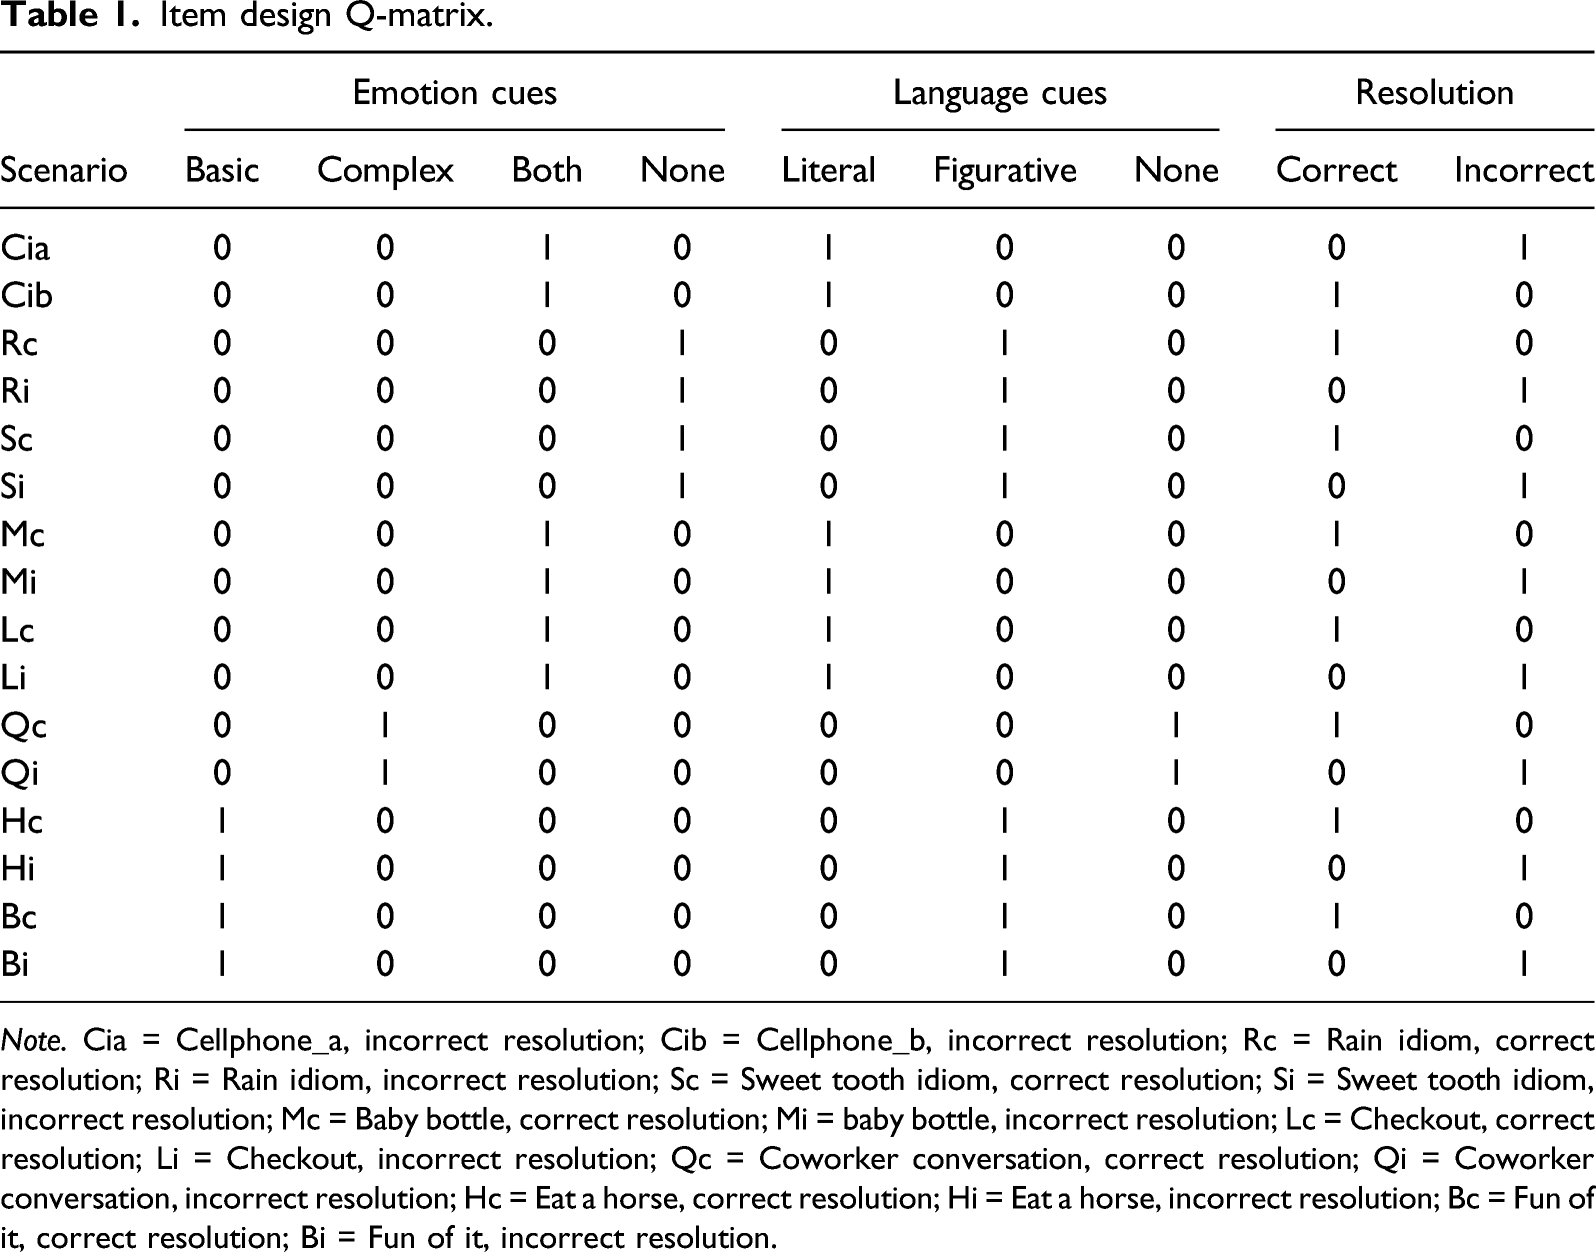
Note. Cia = Cellphone_a, incorrect resolution; Cib = Cellphone_b, incorrect resolution; Rc = Rain idiom, correct resolution; Ri = Rain idiom, incorrect resolution; Sc = Sweet tooth idiom, correct resolution; Si = Sweet tooth idiom, incorrect resolution; Mc = Baby bottle, correct resolution; Mi = baby bottle, incorrect resolution; Lc = Checkout, correct resolution; Li = Checkout, incorrect resolution; Qc = Coworker conversation, correct resolution; Qi = Coworker conversation, incorrect resolution; Hc = Eat a horse, correct resolution; Hi = Eat a horse, incorrect resolution; Bc = Fun of it, correct resolution; Bi = Fun of it, incorrect resolution.
Procedures
Scoring
Scoring guides were developed for each scenario that included examples of prototypical student responses at each of the levels of the SPU and EI constructs. The construct maps in Figure 1 and Figure 2 are examples of the scoring guides used to score the scenario shown in Figure 3 (Scenario Mi = Baby Bottle, incorrect resolution). These examples can be used to illustrate how student responses were scored into the different levels of each construct.
On the SPU construct, responses at level 0 fail to identify any salient SPUs. At level 1, the student describes the observable features of a SPU, but does not define it. Students at level 2 identify and define basic emotion cues and students at level 3 identify and define complex emotion cues. At level 4, students identify both basic and complex emotions. Students were assigned one score per response. A student’s score, then, is based on the highest-category of SUP identified by the student.
On the EI construct, students at level 0 provide an incorrect evaluation of the scenario outcome, or fail to justify a correct evaluation. Students at level 1 cite evidence that is explicitly presented in the scenario for their justification. Students at level 2 draw on their prior store of knowledge regarding workplace behavior (i.e., they cite evidence that is not explicitly present in the scenario).
Data Collection
Each student was randomly assigned to one of three form conditions. Forms A and B contained eight unique comic strips each. Form C was a linking form that contained four comic strips from Form A and four comic strips from Form B. It was used to calibrate the item parameters from all 18 unique comic strips onto a common measurement scale. This linking approach is referred to as a common-item nonequivalent-populations design (Kolen & Brennan, 1987). In total, each student was presented with eight comic strip scenarios and answered the same two items following each scenario, for a total 16 constructed responses per student (i.e., eight SPU items and eight EI items). Prior to participation, the first researcher reviewed an instructional sheet with the students which included instructions on how to read comic strips and an operational definition, and examples, of a social cue (see electronic Supplemental Figure S17). During each period of data collection, the first researcher and at least one classroom teacher were present to provide supports and accommodations required by students.
Data Analysis
Unidimensional and multidimensional partial credit Rasch models were selected for analysis because of the polytomous structure of the SPU and EI construct data. Rasch measurement models are used to measure cognition by statistically modeling it as a latent variable that contributes to a student’s item response pattern on an assessment (Wilson, 2005; Borsboom, 2008). A strength of Rasch measurement models is that they are based on specific, testable assumptions about the structure of item response data (Hambelton & Swaminathan, 1985). This makes it is possible to empirically test hypotheses about the structure of progress variables using different Rasch models.
The unidimensional partial credit model (uPCM) (Masters, 1982) places students and items onto a common logit scale (denoted by the person
We selected the uPCM for this analysis over other examples of models for polytomous item response data such as the graded response model (GRM; Samejima, 1969) because the uPCM freely estimates the unique, parametric scale structures for each of the items in an assessment. This flexibility is particularly useful for examining the differential impact on the difficulty of moving up the EI construct, given the particular combination of basic and complex emotion cues present in a scenario. The GRM, on the other hand, is an extension of the two-parameter logistic model, which includes a discrimination parameter. We elected not to complicate our analysis by including a discrimination parameter into our model that could confound the interpretation of our variables (i.e., Masters & Wright, 1997). We tested the assumption of equal discrimination parameters across items by carrying out the weighted mean-square tests of fit for each item (see Results below).
The multidimensional partial credit model (mPCM) is a multidimensional extension of the uPCM that makes it possible to test more complex test structures in which two or more constructs are assumed to influence a student’s responses to items (Adams et al., 1997; Wetzel & Hell, 2014). In this model, a scoring matrix is used to specify a priori, individual item scores in the proposed latent dimensions based on theoretical or practical reasons. For our analysis, we selected a between-item multidimensional model in which the SPU items and the EI items loaded onto separate latent dimensions, so that each dimension contained different items. Importantly, by constraining the inter-dimensional correlations of the mPCM to 1.0 the uPCM is obtained. Therefore, high inter-dimensional correlations imply that a single construct is influencing item responses (i.e., a unidimensional model of cognition) while lower inter-dimensional correlations imply that multiple constructs are influencing item responses.
ACER ConQuest 4.0, item response modeling software was used for data calibration (Adams et al., 2015). A Gaussian population distribution was assumed and a Monte Carlo approach with 4000 nodes was used for integration—Newton-Raphson iterations were terminated when maximum parameter or deviance change was less than 0.0001. Person ability parameters were estimated using the weighted likelihood estimation (WLE) method while item difficulty parameters are marginal maximum likelihood (MML) estimates. A constraint was placed on the mean of the participant ability locations to allow for the free estimation of item difficulty locations.
Participants
80 students in special education (21 females, 59 males,
Results
Reliability of each of the forms was examined by performing three, consecutive uPCM calibrations of the data. Forms A and B were closely matched on mean item difficulty (0.27 and 0.33 logits, respectively) and variance estimates (0.07 and 0.09 logits, respectively). Form C was more difficult (0.52 logits) and generated nearly twice the amount of variance (0.14 logits). Although each of the forms varied in difficulty, these differences were accounted for by concurrently calibrating all data onto the same measurement scale. The range of EAP reliability estimates for each form were high (0.83–0.84), meaning that the set of items in each form was sensitive to sample variation in SPU detection and EI ability. Last, the range of coefficient alphas for the forms were acceptable (
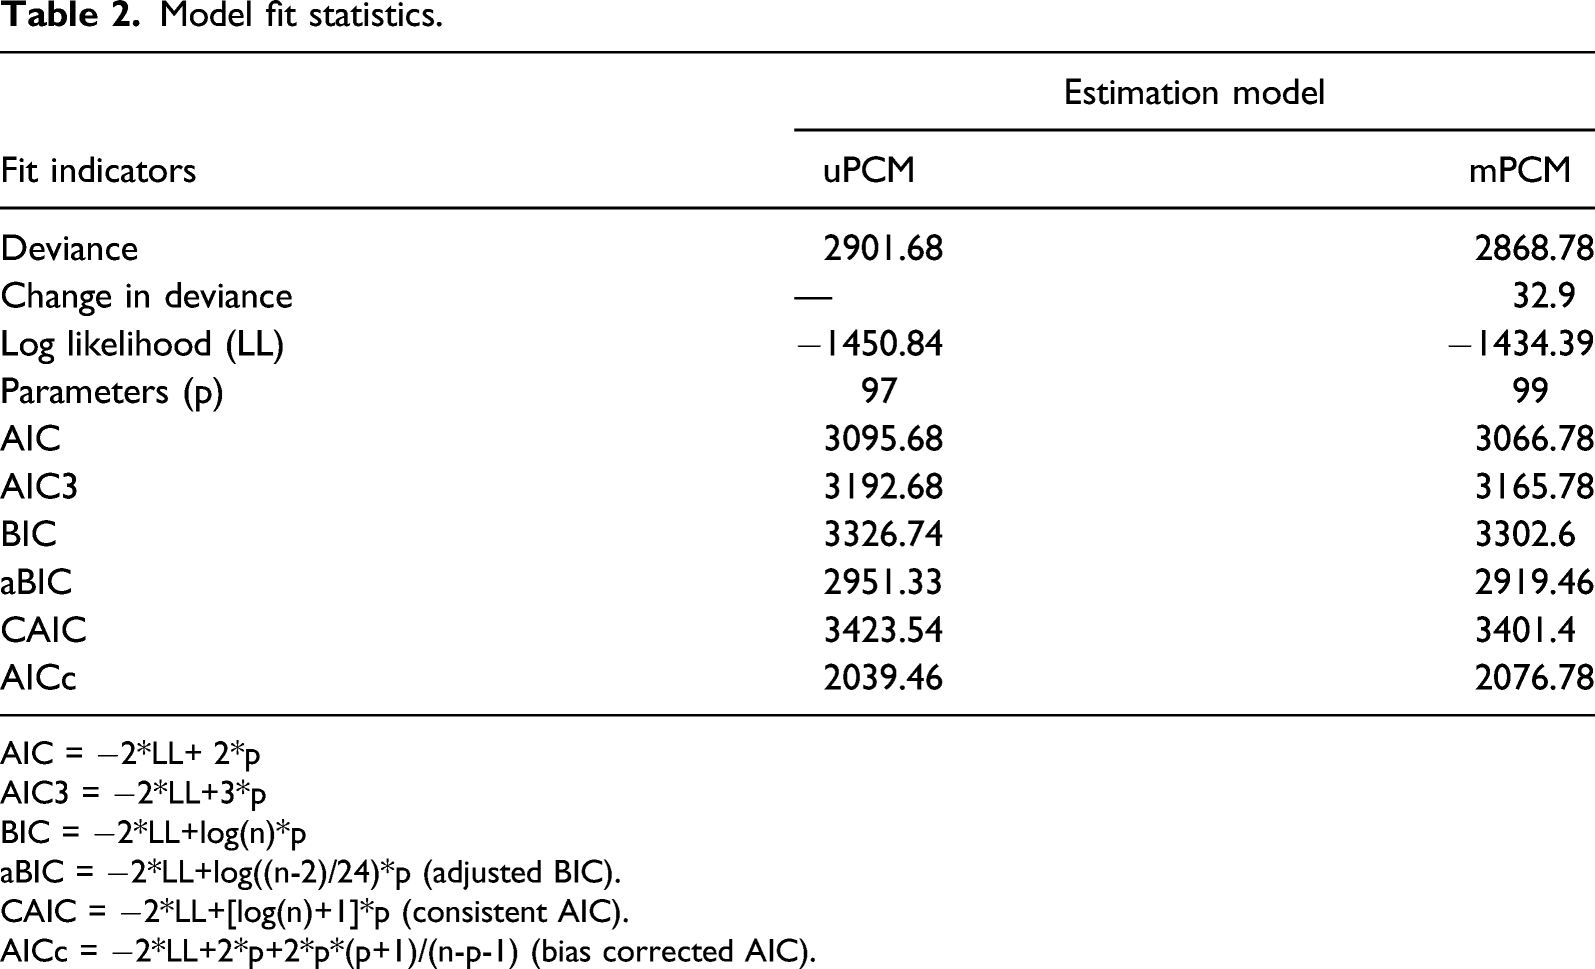
Model fit statistics.
AIC = −2*LL+ 2*p
AIC3 = −2*LL+3*p
BIC = −2*LL+log(n)*p
aBIC = −2*LL+log((n-2)/24)*p (adjusted BIC).
CAIC = −2*LL+[log(n)+1]*p (consistent AIC).
AICc = −2*LL+2*p+2*p*(p+1)/(n-p-1) (bias corrected AIC).
We fit a Rasch testlet model (Wang & Author, 2005) to the data in order to test for the possibility of the data having a “nested” structure, which could suggest a violation of the assumption of local independence, since each pair of SPU and EI items in the SER-W instrument share a single comic strip prompt (each of these comic-strip-and-two-item-bundles is referred to as a testlet). The testlet model estimates effects as separate dimensions for each testlet (in this case, 16), in addition to one general factor that underlays all of the testlets. The general factor is consonant with a unidimensional representation of the SER-W constructs. The magnitude of local dependence is estimated by comparing the variance estimates for each testlet against the variance of the general ability factor. Our investigation of the fit of the mPCM and rasch testlet models showed that the mPCM model fit the data better according to AIC and BIC fit statistics. Hence, the testlet model did not improve the estimation of the general effect.
Weighted mean-square fit statistics (WMNSQs) are used to describe the fit of individual items to a measurement model; specifically they focus on variations in the item discrimination parameter. WMNSQs are approximately chi-square distributed and have an expected value of one. Fit statistics greater than one indicate greater unmodeled noise, or some other source of variance in the data. Fit statistics less than one indicate that that there may be local dependence among the items, which can lead to inflated reliability estimates (Wilson, 2005). Conventionally, the lower and upper bounds for acceptable WMNSQs are set at 0.75 and 1.33 (Wu & Adams, 2014). In the SPU dimension, three items fell just above the upper bound (i.e., Cellphone_a, incorrect resolution (Cia) = 1.39; Fun of it, correct resolution (Bc) = 1.4, and Checkout, correct resolution (Lc) = 1.5). We found no issues in an examination of the scored responses to the items and no obvious issues with the content of the scenarios, and so elected to keep these items for this analysis. All items in the EI dimension were within the acceptable range (0.75–1.33).
The mPCM estimates a latent inter-dimensional correlation between the two latent variables that is corrected for attenuation caused by measurement error. The correlation between the estimated person parameters for the SPU and EI dimensions is
Figure 4 and Figure 5 show Wright Maps for the SPU detection ability and EI ability dimensions, respectively. Note that the EI Ability Wright map is separated into two sections: “Incorrect Resolution” and “Correct Resolution.” These refer to comic strips in which the target employee incorrectly resolved the scenario and comic strips in which the target employee correctly resolved the scenario, respectively. The “X” symbols in each figure represent the distribution of students: those lower on the Wright map have less SPU or EI ability than students higher on the Wright map. The right panel of each figure represents the locations of the SPU and EI items’ Thurstonian thresholds. For each item, the thresholds mark critical transition points along the measurement scale. Thresholds located higher on the Wright map indicate items for which it was relatively more difficult to achieve higher levels of the construct than thresholds lower on the map. The number of thresholds for each item is equal to the number of construct map levels, minus one. For example, the SPU items have four critical transition points: • Threshold .4: The point at which level 4 becomes more likely than levels 0, 1, 2, and 3. • Threshold .3: The point at which levels 3, 4, together, become more likely than levels 0,1, and 2. • Threshold .2: The point at which levels 2 ,3, 4, together, become more likely than levels 0 and 1 • Threshold .1: The point at which levels 1, 2, 3, and 4, together, become more likely than level 0. SPU detection ability Wright map. Evaluative inference ability Wright map.
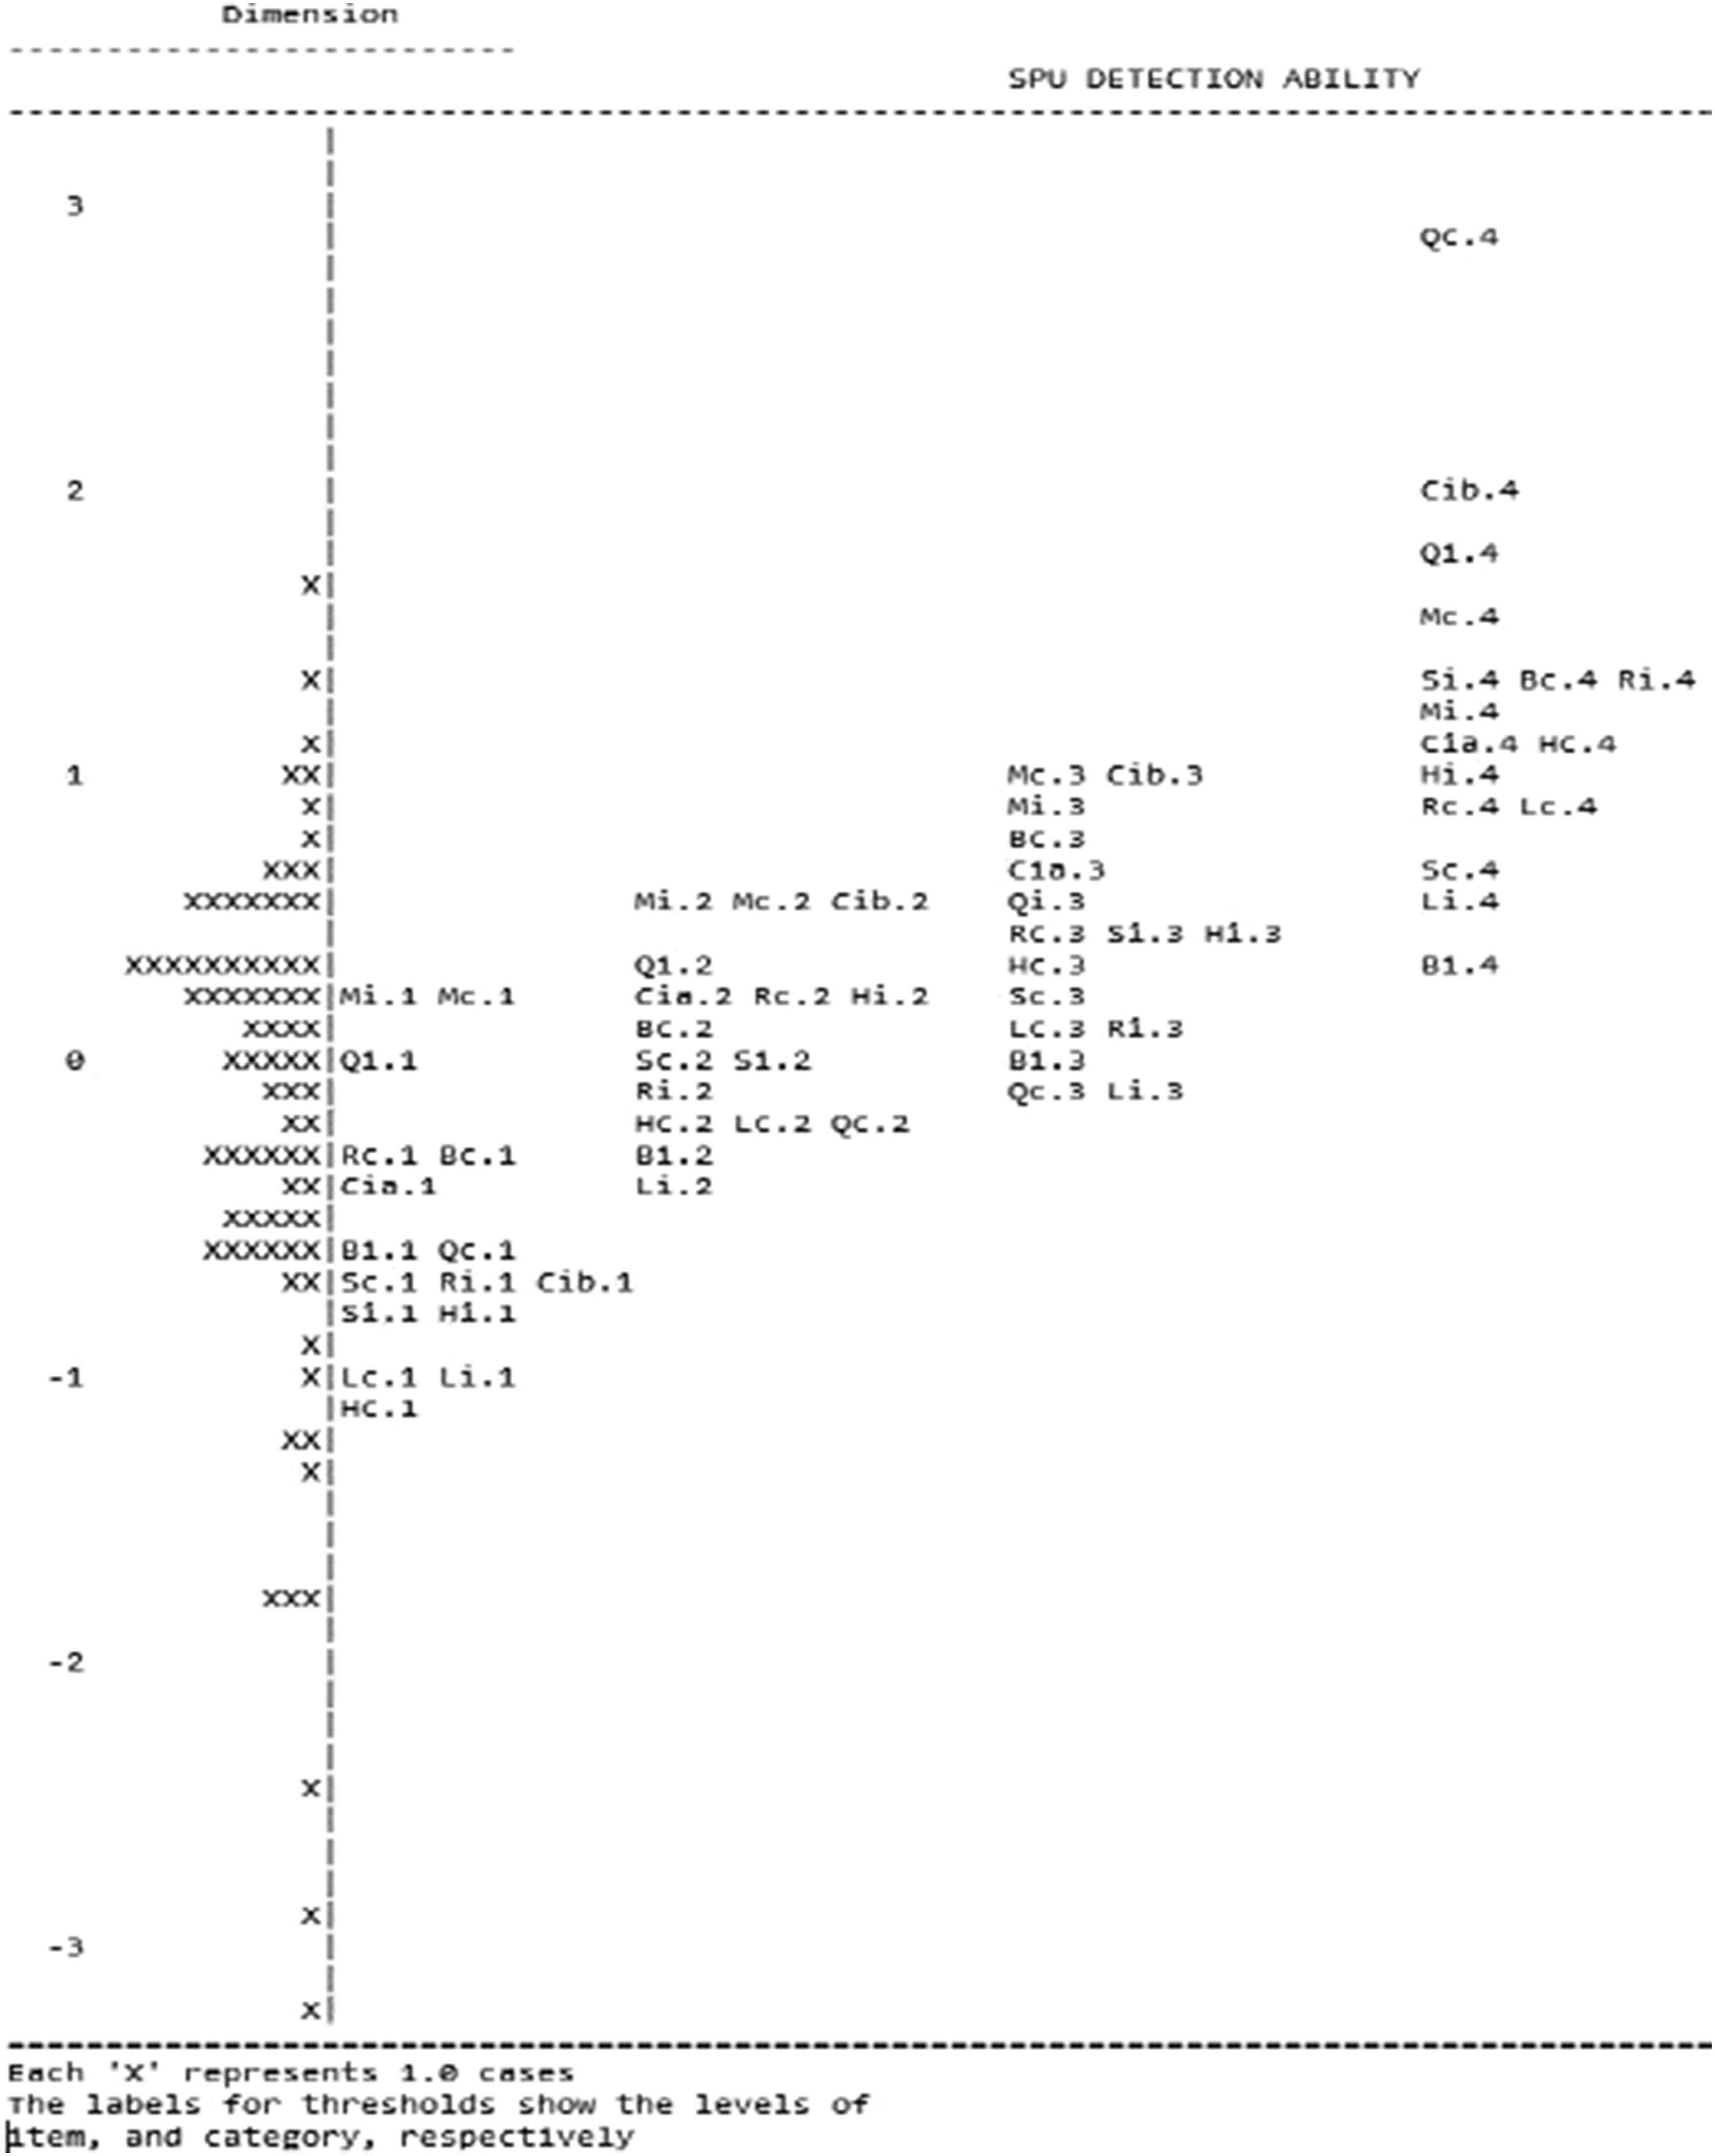
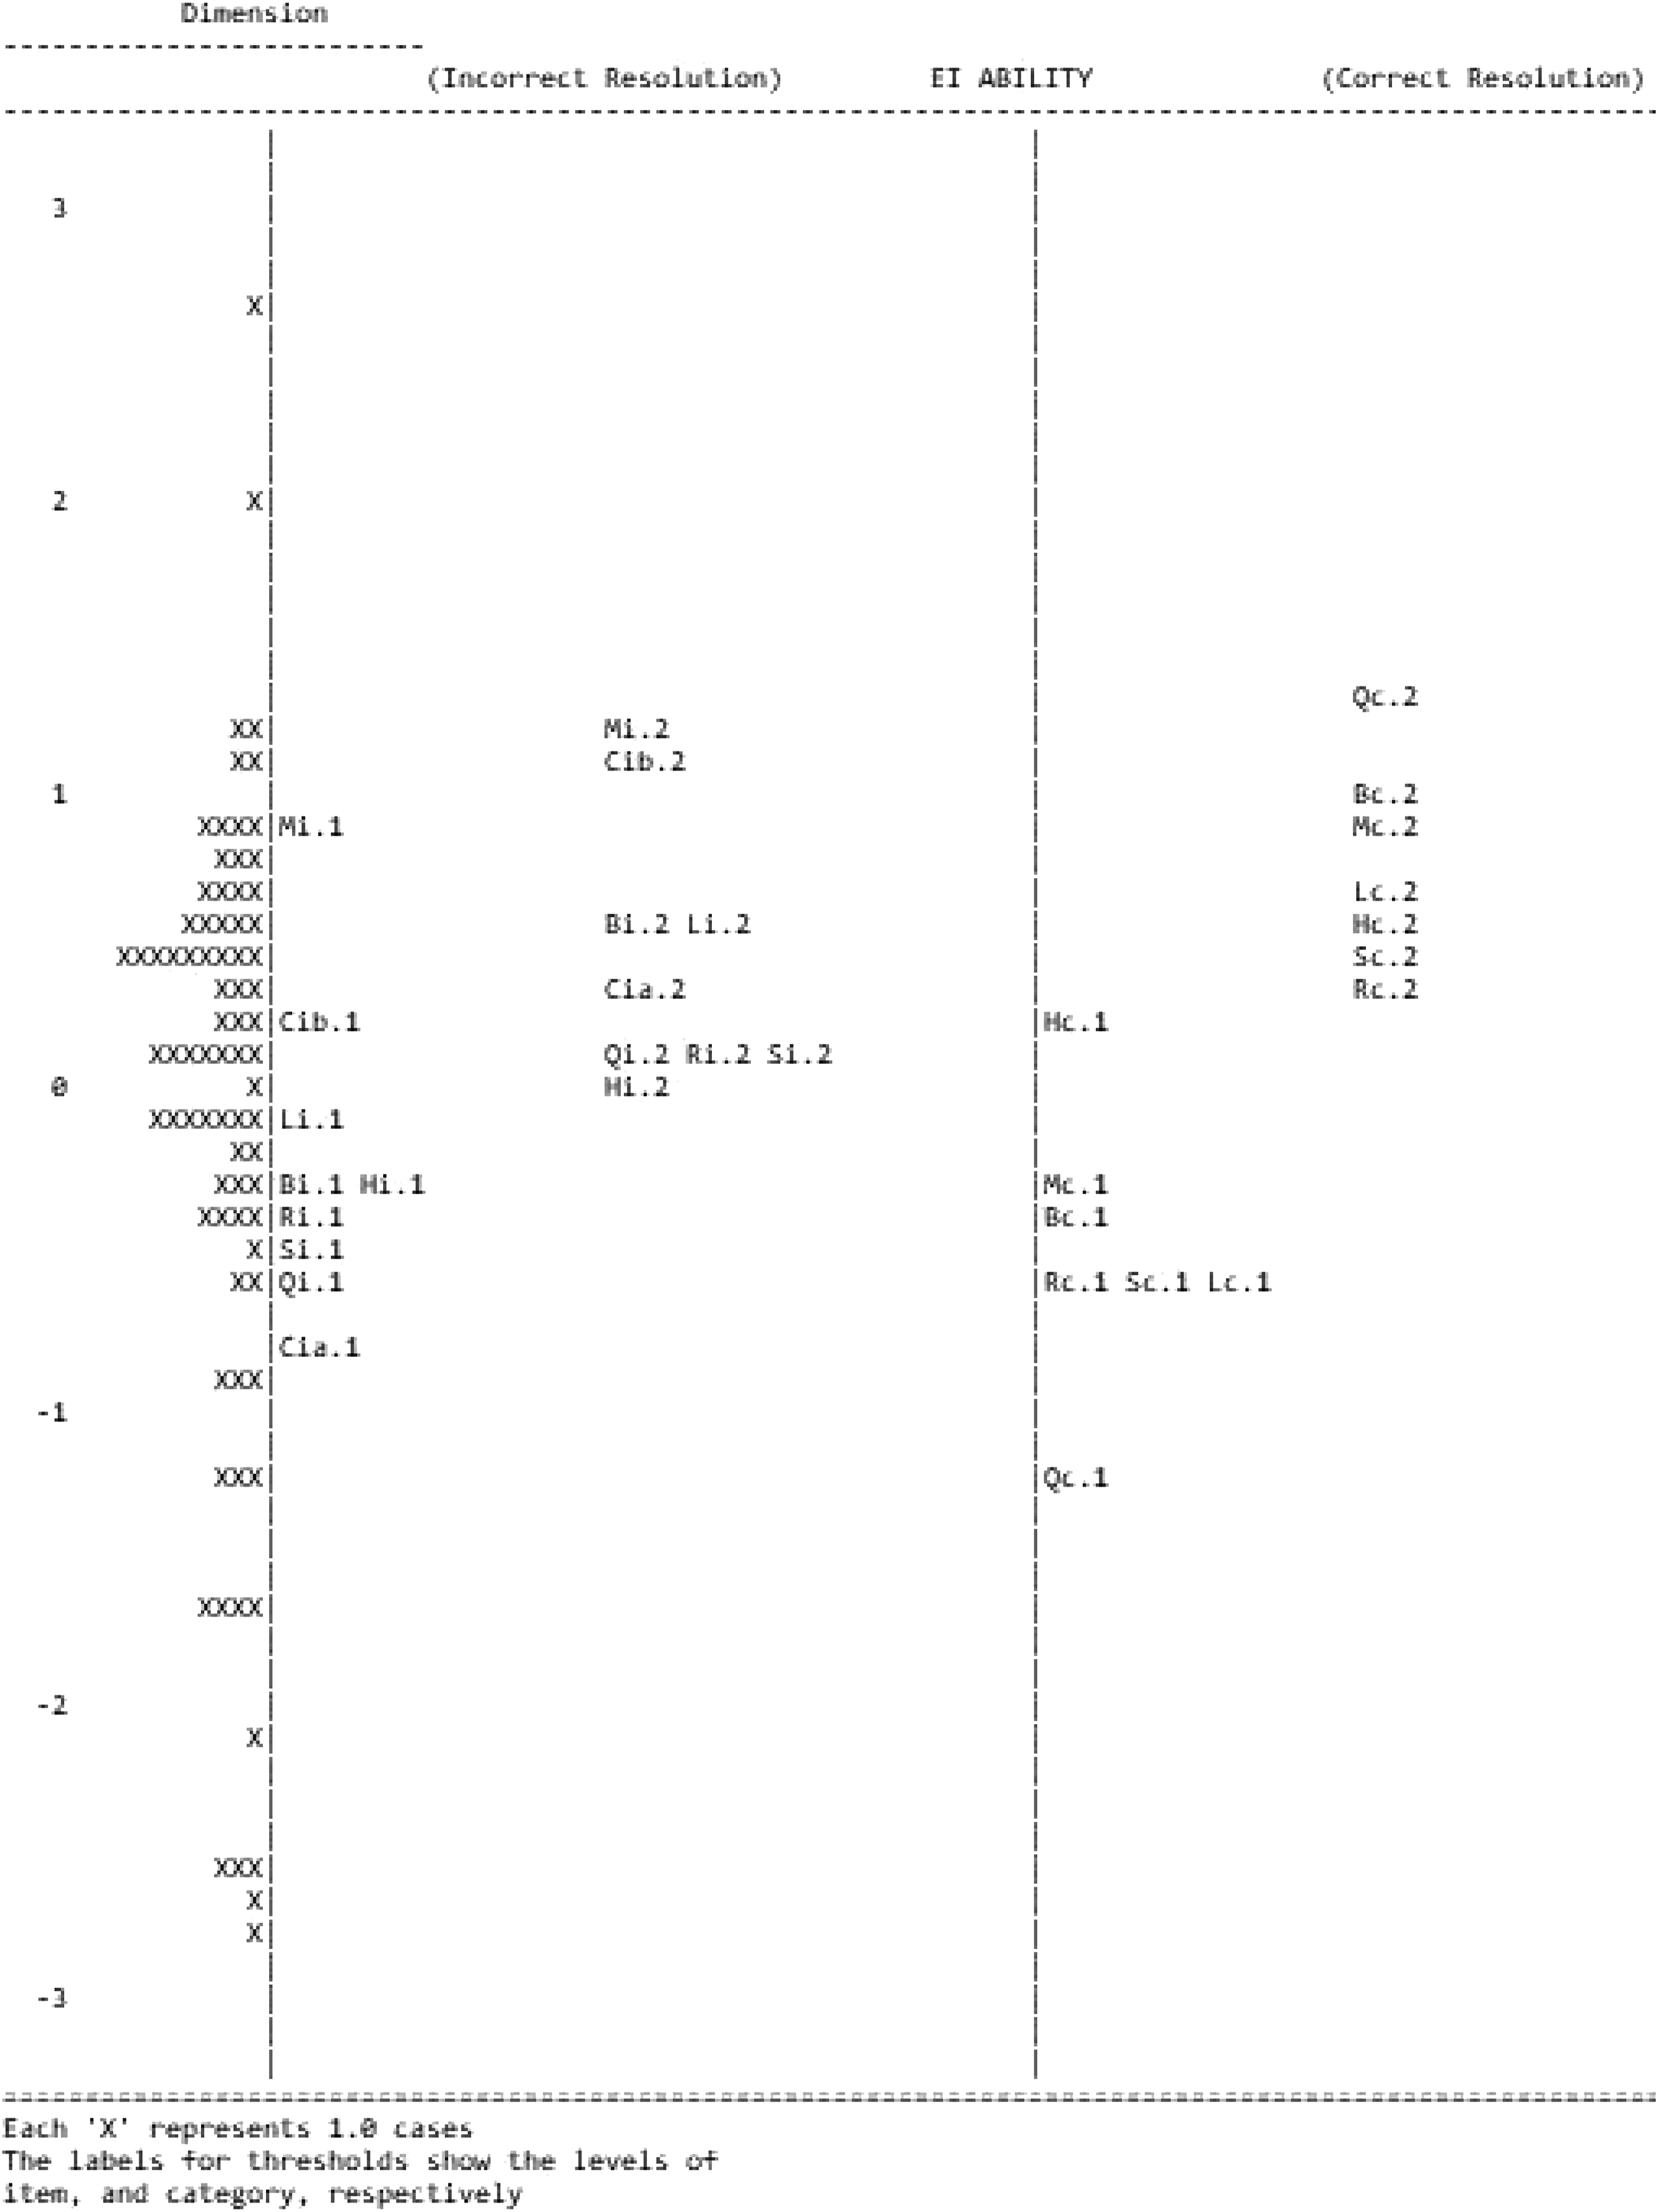
The vertical distances between the threshold locations and locations within the student ability distribution determine the probability of making one type of response to an item vs. another, based on any position within the student ability distribution.
In each Wright map, it can be observed that the locations of successively higher sets of thresholds tend to move up the logit scale as we would expect, given the theory used to define and structure the constructs. However, there is some considerable overlap between some of the distributions of threshold estimates in the SPU dimension. Additionally, the sets of item threshold locations for some items in each dimension are consistently higher on the Wright map, which indicates an overall higher degree of difficulty to reach higher levels of the construct map for these items. This is observed for the comic strip displayed in Figure 3 above (i.e., thresholds Mi.1—Mi.4 in Figure 4 and thresholds Mi.1—Mi.2 in Figure 5 are at the top of each column). Finally, other sets of item threshold locations are consistently lower, indicating that less of the SPU and EI constructs is required to achieve higher levels on those items. The relative differences between the different locations of these thresholds may be associated with a greater difficulty of (a) social context of the comic strips, or (b) a greater difficulty of the component of SPU/EI involved, or (c) both.
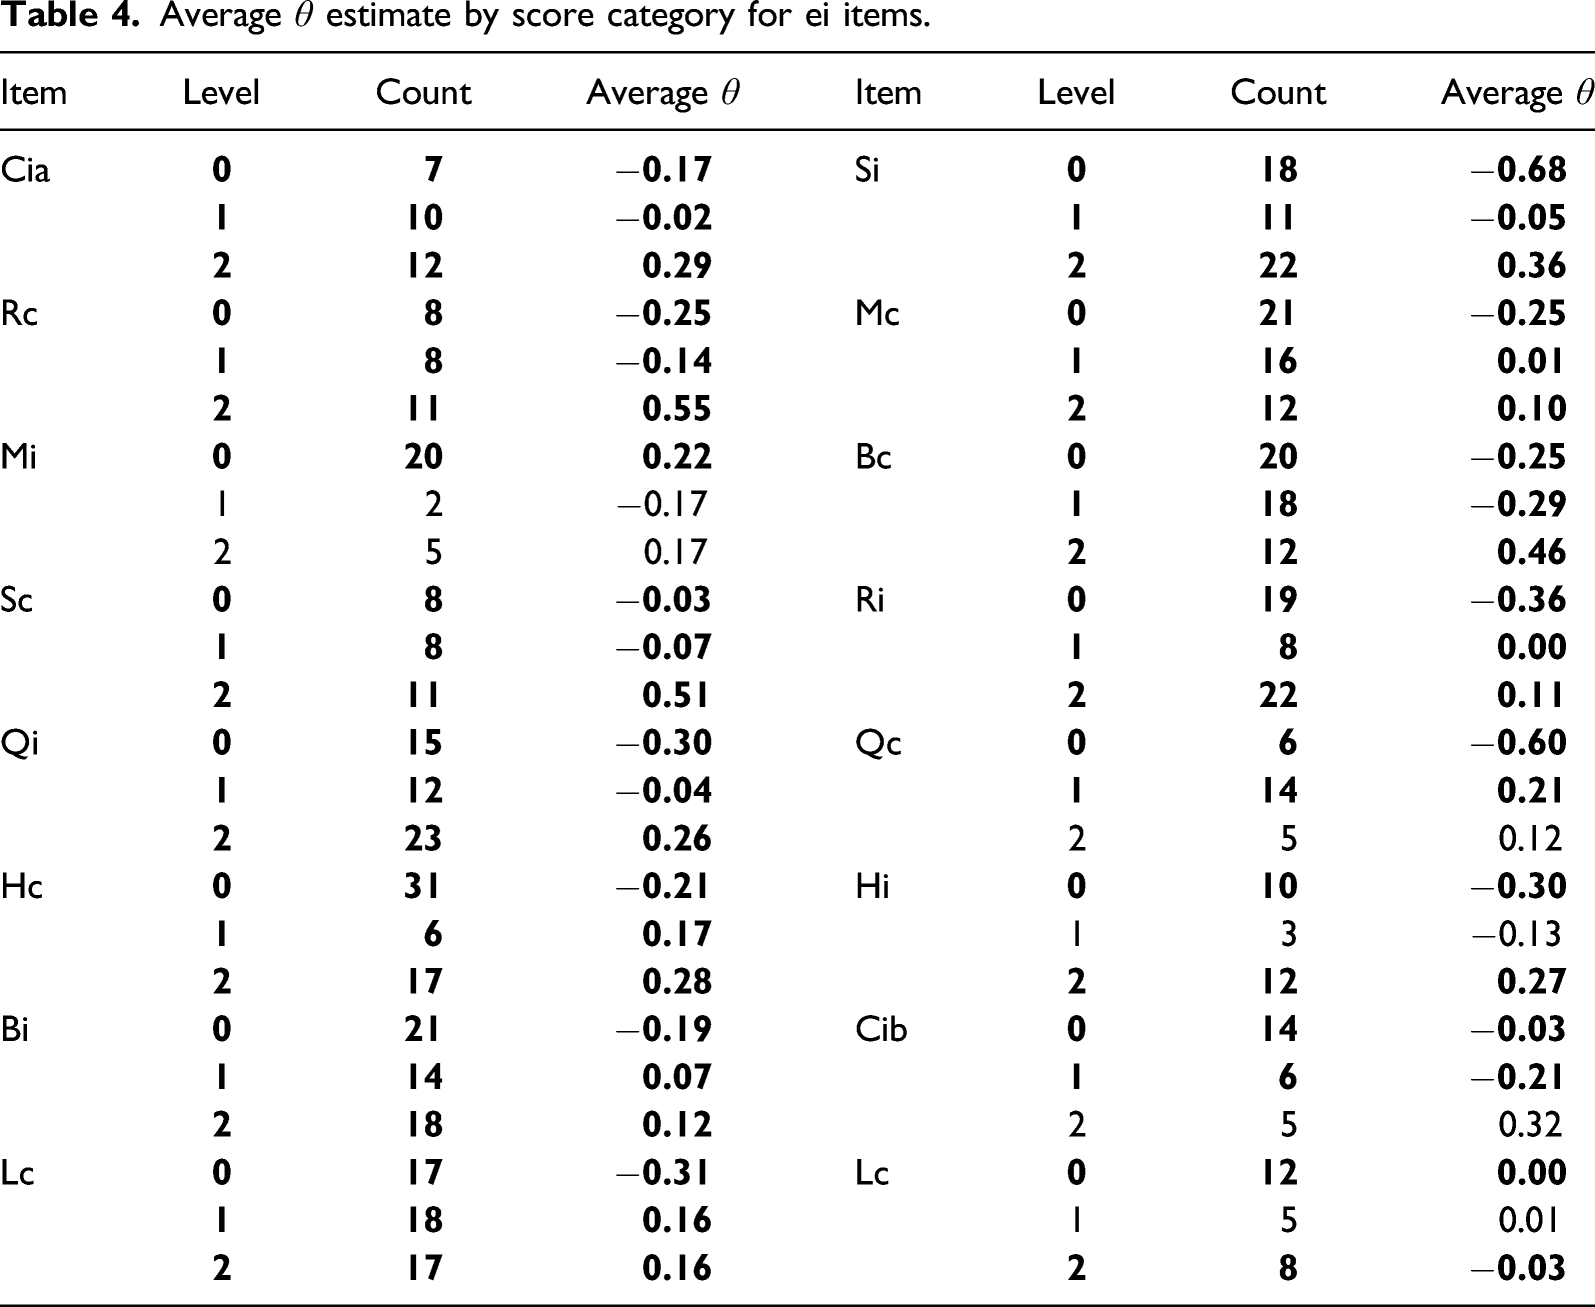
Average

Average
Discussion
In this study, we used the BAS to develop and empirically test hypotheses about the structure of two latent soft skills progress variables. We compiled a modest amount of empirical evidence for the validity of the internal structure of the SER-W instrument and, by extension, laid the foundation for establishing the definitional validity of the SPU and EI constructs. This research is a departure from more traditional methods for assessing soft skills that rely on self-rating (e.g., Jardim et al., 2020) and observational (Devedzic et al., 2018) approaches that do not define a central measurement construct.
The superior fit of the mPCM compared to the uPCM provides empirical support for the hypothesis that the SPU and EI items measure distinct, yet interrelated latent progress variables. Although the inter-dimensional correlation suggests the two models are psychometrically similar, it is our position that they are educationally interesting, in different ways. Within each dimension, the extent to which (a) successive sets of item thresholds achieve separation from the item threshold locations lower on the Wright map and (b) the observation of mean
We focused on validity evidence for the internal structure of the SER-W progress variables in order to lay the foundation for the definitional validity of the SER-W constructs (Krause, 2012). Definitional validity is a logically prior step to establishing, for example, the convergent, divergent, or predictive validity of a measure. This is because the definitional validity of a psychological dimension determines the validity of the measurements that are relied upon to establish convergent, divergent, and predictive validity (Boorsboom, 2005; Maraun, 1998). Considering the definitional validity of the SER-W constructs, then, is an appropriate place to start given the novelty of measuring latent progress variables in the field of soft skills assessment.
Limitations
It was not possible to obtain student diagnosis information for 58% of the sample or to collect data about student race/ethnicity. Without this data, it is not possible to make strong claims about the generalizability of our findings. Additionally, we note that the small sample size in this study contributes to instability in the parameters estimated by the model. Generally speaking, sample size requirements for more complex Rasch models range from 200–500, particularly if the model estimates are to be used in high-stakes applications. However, for preliminary evaluations of the psychometric properties of assessments, considerably smaller samples can be adequate.
We did not conduct any cognitive lab interviews with culturally and linguistically diverse participants. Therefore, it is possible that the interactions depicted in some of the scenarios are biased against people from the nondominant culture. Furthermore, the ecological validity of the SER-W instrument should be considered low, since real workplace social interactions are dynamic in nature, while the comic strip scenarios are static depictions. Finally, the range of the types of social cues and interactions portrayed in the comic strips is greatly limited.
Conclusion
Soft skills instruction and assessment of soft skill development are two practices associated with positive post-school outcomes for individuals with disabilities (Rowe et al., 2015). Therefore, it makes sense that special education practitioners who work with this population to develop soft skill proficiency should have an understanding about how students’ progress from lower to higher levels of soft skills competency. The constructs we present in this paper represent an important preliminary step in this direction. For example, the better fitting two-dimensional model in which the higher order SER-W construct is decomposed into social cue detection (SPU) and evaluative inference (EI) progress variables supports the instructional decision to address these two skills as separate, but related competencies in the context of a vocational development curriculum. More specifically, students will need instruction on how to identify and understand a variety of types of social cues before they are tasked with recognizing what kind of behavioral responses to these social cues are acceptable in a workplace context. In practice, then, a student’s SER-W performance should be considered in terms of subscale scores.
Furthermore, empirical support for the internal structure of the EI dimension suggests a logical sequence for lesson delivery, in which students are systematically exposed to workplace scenarios of increasing social complexity. For example, scenario baby bottle, incorrect resolution (Mi) (see Figure 3) is the most difficult item on which to achieve full credit on the EI construct since it requires a nuanced understanding of an unwritten rule of the workplace: that it is generally acceptable for a toddler to be in violation of some customer-applicable rules. Scenario coworker conversation, incorrect resolution (Qi) (see Figure S12 in electronic supplements), on the other hand, is a relatively easier item on which to achieve full credit on the EI construct since the employee’s workplace violation is relatively more straightforward: she sees a customer who is visibly confused and in need of assistance but chooses to continue a non-work-related conversation with her co-worker.
Future Research
We recognize that modeling dimensions in the way we have described is only useful to the extent that the results are helpful to teachers and students—there will never be an objectively “true” definition of a latent progress variable. Although the two constructs in this study were selected and defined based on theoretical underpinnings and enjoyed empirical support, further refinement of the SER-W assessment stimuli and additional waves of data collection are required before it will be possible to establish the validity of the SER-W instrument.
To begin, it will be necessary to evaluate the validity of SER-W scores for different formative and summative uses. For example, investigating relationships between SER-W subscale scores and scores on other, established measures of social skill or social cognitive ability may provide support for the validity of the SER-W instrument as a workplace needs assessment. Additionally, if the SER-W instrument is used for summative purposes in the context of a vocational education curriculum, what is the relationship between performance on it and future employment outcomes?
Finally, additional workplace comic strip scenarios should be developed to increase the representation of different types and combinations of social cues. For example, Table 1 shows that none of the comic strips used in this study included a basic emotion as the only target social cue. Being systematic in future scenario development will make it possible to use explanatory item response models (e.g., Author & De Boeck, 2004) to empirically model differences in the difficulty between different scenarios in terms of the effects that item properties have on the probability of achieving higher levels of the SPU and EI constructs.
Supplemental Material
sj-pdf-1-jpa-10.1177_07342829211057641 ‐ Supplemental Material for Developing a Theory of Two Latent Soft Skills Progress Variables using the BEAR Assessment System: Validity Evidence for the Internal Structure of the Social Evaluative in the Workplace Instrument
Supplemental Material, sj-pdf-1-jpa-10.1177_07342829211057641 for Developing a Theory of Two Latent Soft Skills Progress Variables using the BEAR Assessment System: Validity Evidence for the Internal Structure of the Social Evaluative in the Workplace Instrument by Jerred Jolin and Mark Wilson in Journal of Psychoeducational Assessment
Footnotes
Declaration of conflicting interests
The author(s) declared no potential conflicts of interest with respect to the research, authorship, and/or publication of this article.
Funding
The author(s) received no financial support for the research, authorship, and/or publication of this article.

Supplemental Material
Supplemental material for this article is available online.
References
Supplementary Material
Please find the following supplemental material available below.
For Open Access articles published under a Creative Commons License, all supplemental material carries the same license as the article it is associated with.
For non-Open Access articles published, all supplemental material carries a non-exclusive license, and permission requests for re-use of supplemental material or any part of supplemental material shall be sent directly to the copyright owner as specified in the copyright notice associated with the article.
