



Abstract
The Difficulties in Emotion Regulation Scale (DERS) is a widely used measure of emotion dysregulation. However, limited research has examined its factor structure and measurement invariance in cross-national samples. The present study tested competing measurement models and the measurement invariance of the DERS in university student samples from the United States (n = 324) and Taiwan (n = 399). Results indicated that the bifactor model with the Awareness subscale items removed demonstrated the best fit. The results of model-based indices provided evidence for the general emotion dysregulation factor of the DERS. Cross-national measurement invariance testing found partial strong invariance. These findings indicate that DERS would best be used as a measure of general emotion dysregulation among college students in the United States and Taiwan. These findings emphasize that future work is needed to examine cross-national differences in the construct and assessment of emotion dysregulation.
Keywords
In recent years, emotion regulation has sparked much interests in the field of psychology (see, e.g., Beauchaine, 2015). Emotion regulation can be viewed as the internal and external processes that individuals use to modify their emotional reactions in order to achieve their goals (Gross, 1998). Emotion regulation has been identified as a central feature underlying various forms of psychopathology (Aldao et al., 2016) and difficulties with emotion regulation have been demonstrated to be associated with various psychopathologies (e.g., Gratz et al., 2006; Nordgren et al., 2020). Given the significant role of emotion regulation and dysregulation in psychopathological development, a reliable and valid assessment of difficulties with emotion regulation is a pivotal task.
Examples of Items on the Difficulties of Emotion Regulation Scale by Subscale.

Note. Gratz & Roemer (2004).
Although a large amount of research has tested the psychometric properties of the DERS, existing research has yielded mixed results regarding its factor structures. Indeed, most studies examining the original six-factor structure proposed by Gratz and Roemer (2004) can only find acceptable fit after making modifications to the models (e.g., Kokonyei et al., 2014; Neumann et al., 2010). Several studies also examined the second-order factor model with six first-order factors, and the results were mixed. For instance, Bardeen et al. (2012) found that the second-order factor model with six first-order factors exhibited adequate fit in a sample of American college students. However, Lee et al. (2016) found that the second-order factor model with six first-order factors did not result in adequate fit across three independent samples from the United States. One major reason lies in problems with the Awareness subscale, including it showing lower correlations with the other DERS factors (Neumann et al., 2010). These findings revealed potential problems with the Awareness subscale of the DERS. Bardeen et al. (2012) speculated that method effects (i.e., the tendency to respond in a way that is not related to item content) might exist since the Awareness subscale is the only subscale in which all items are reverse-scored.
To address problems with the Awareness subscale of the DERS, several studies explored a reduced version of the DERS in which the Awareness subscale items were removed. Two models have been tested: the five-factor model and the five-factor higher-order model. Several studies supported the five-factor model of a reduced version of the DERS (e.g., Bardeen et al., 2012; Lee et al., 2016). With respect to the five-factor higher-order model of a reduced version of the DERS, the results were not consistent however. For instance, Bardeen et al. (2012) found support for the five-factor higher-order model while Fowler et al. (2014) did not. Additionally, Lee et al. (2016) examined the four-factor model initially hypothesized by Gratz & Roemer (2004), but it has not received support.
Despite the inconsistent findings on the factor structures of the DERS, three recent studies examined the DERS with variations on the handling of the Awareness subscale. The results provided evidence for the bifactor model. Specifically, in a clinical sample in the United States, Osborne et al. (2017) found support for a bifactor model that excluded the Awareness subscale items from loading on the general factor. Nordgren et al. (2020) found evidence for a modified bifactor model in which the Awareness subscale was permitted to correlate with the Clarity subscale in a clinical sample in Sweden. Hallion et al. (2018) found support for a bifactor model with Awareness subscale items removed in a clinical sample in the United States. These three studies provided evidence for the bifactor model consisting of one general factor and five or six specific factors. However, whether the bifactor model can be applied to nonclinical populations or cross-national samples has not been evaluated.
Taken together, while numerous studies have examined the factor structures of the full measure of the DERS and the reduced version of the DERS, there is still a lack of consensus on its latent structure. Moreover, most of the research on the factor structures of the DERS has been conducted with European or European American samples (e.g., Bardeen et al., 2012; Lee et al., 2016). As pointed out by Henrich et al. (2010), research using predominantly WEIRD (Western, educated, industrialized, rich, and democratic) samples may not generalize to individuals from countries around the world. Thus, an examination of the factor structures of the DERS in cross-national samples is much needed in order to advance this line of research on the measurement of difficulties with emotion regulation.
Furthermore, scant research has tested the measurement invariance of the DERS across nations. This is problematic given that cultural variations regarding emotion regulation has been discussed extensively in theoretical and empirical literature. Specifically, the focus of Asian cultures tends to emphasize group harmony and promote cultural beliefs like subdued emotionality (Ruby et al., 2012) while the focus of Western cultures tends to be independence and encouraging open emotional expression (Markus & Kitayama, 1991). Cross-cultural research has demonstrated that expressive suppression, a particular form of emotion regulation, is higher in countries that emphasizes interdependence, compared to countries that emphasize independence (Matsumoto et al., 2008). Thus, given the fact that the DERS was developed to measure difficulties with emotion regulation, the important next step is to examine the measurement invariance of the DERS across nations.
Measurement invariance is often tested with multiple-group confirmatory factor analysis (CFA) and the fit of all four invariance models (configural, metric, scalar and strict invariance) allows for a full cross-national comparison (Chen, 2008). Since individuals from different nations or cultures may vary in how they manage their emotions (Matsumoto et al., 2008), these variations may further affect how they respond to the items designed to measure emotion dysregulation. Thus, if there is a lack of information on the measurement invariance of the DERS, whether the DERS measures the same construct across nations is called into question. To date, only one study has directly tested the measurement invariance of the DERS across nations (India and the United States). Snow et al. (2013) examined the five-factor model of a reduced version of the DERS in which the Awareness subscale items were removed, and no evidence of configural invariance was found. Such findings suggest that the DERS may contain different meaning and interpretations across nations and underscore the importance of further evaluating measurement equivalence of the DERS.
The Present Study
To our knowledge, no studies have examined the factor structures of the DERS in cross-national samples like the United States and Taiwan. To address this gap in the literature, the first aim of the current study was to examine the dimensionality of the DERS across the two countries. After choosing a theoretically plausible and psychometrically sound factor structure, the second goal of the present study was to test the measurement invariance of the DERS across these two countries in order to determine whether the DERS provides an equivalent and meaningful measurement across these groups.
Method
Participants and Procedure
Participants consisted of two samples from the United States and Taiwan. The American sample included 324 college students. Ages ranged from 18 to 35 (81.7% female; mean age = 20.08; standard deviation = 2.30). The ethnicity reported by the U.S. participants were Latino American (41.04%), European American (35.49%), Multiracial (7.71%), Asian American (7.09%), African American (4.32%), other (3.08%), and Native American (1.23%). The Taiwanese sample included 399 college students. Ages ranged from 18 to 25 (75.7% female; mean age = 20.35; standard deviation = 1.26).
For the American sample, data were collected from the psychology research pool via an online survey in English and, in exchange, students received credit for their psychology classes. For the Taiwanese sample, data were also collected online from the psychology research pool and other undergraduate classes with the permission of professors. Participants received extra credit for participation. The participants completed the survey in traditional Mandarin Chinese. The respective university’s Institutional Review Board approved the research.
Measures
The Difficulties in Emotion Regulation Scale (DERS; Gratz & Roemer, 2004) is a 36-item measure. Each item is measured on a 5-point Likert-type scale from 1 (almost never) to 5 (almost always) and higher scores indicate a higher level of emotion dysregulation. The DERS scores have been found to demonstrate strong reliability and adequate construct validity (Gratz & Roemer, 2004). The Chinese version of the DERS was previously translated from English into Mandarin and was pilot tested with 79 high school students (Lu, 2007). The Chinese version of the DERS was evaluated by two experts to be a suitable instrument for the participants in Taiwan. The two experts were psychology professors, and were fluent in Mandarin and English (see Supplementary Table S1 for the Chinese and English versions of the DERS items). The Chinese version of the DERS scores exhibited sound reliability and validity (Hsu, 2014; Lu, 2007).
Data Analysis
The data from the Taiwanese participants were complete (no missing values) and the data from the American participants were not complete (only one missing value). Given that the data had less than 1% missing cases (0.00,003%;), we used listwise deletion in the analyses.
In order to examine the measurement models of the DERS, confirmatory factor analysis (CFA) was conducted with R (R Core Team, 2020) using the Lavaan package. We chose CFA rather than exploratory factor analysis (EFA) because the factor structures of the DERS has been examined extensively in the empirical literature and CFA has more advantages (such as its ability to produce an unstandardized solution or to add constraints on the solution) than EFA (see Brown, 2015 for more discussions). Thus, we tested measurement models that were identified through literature review. We tested measurement models in two separate samples first and then tested measurement models in the whole sample. Through this analysis, we identified a best-fitting model.
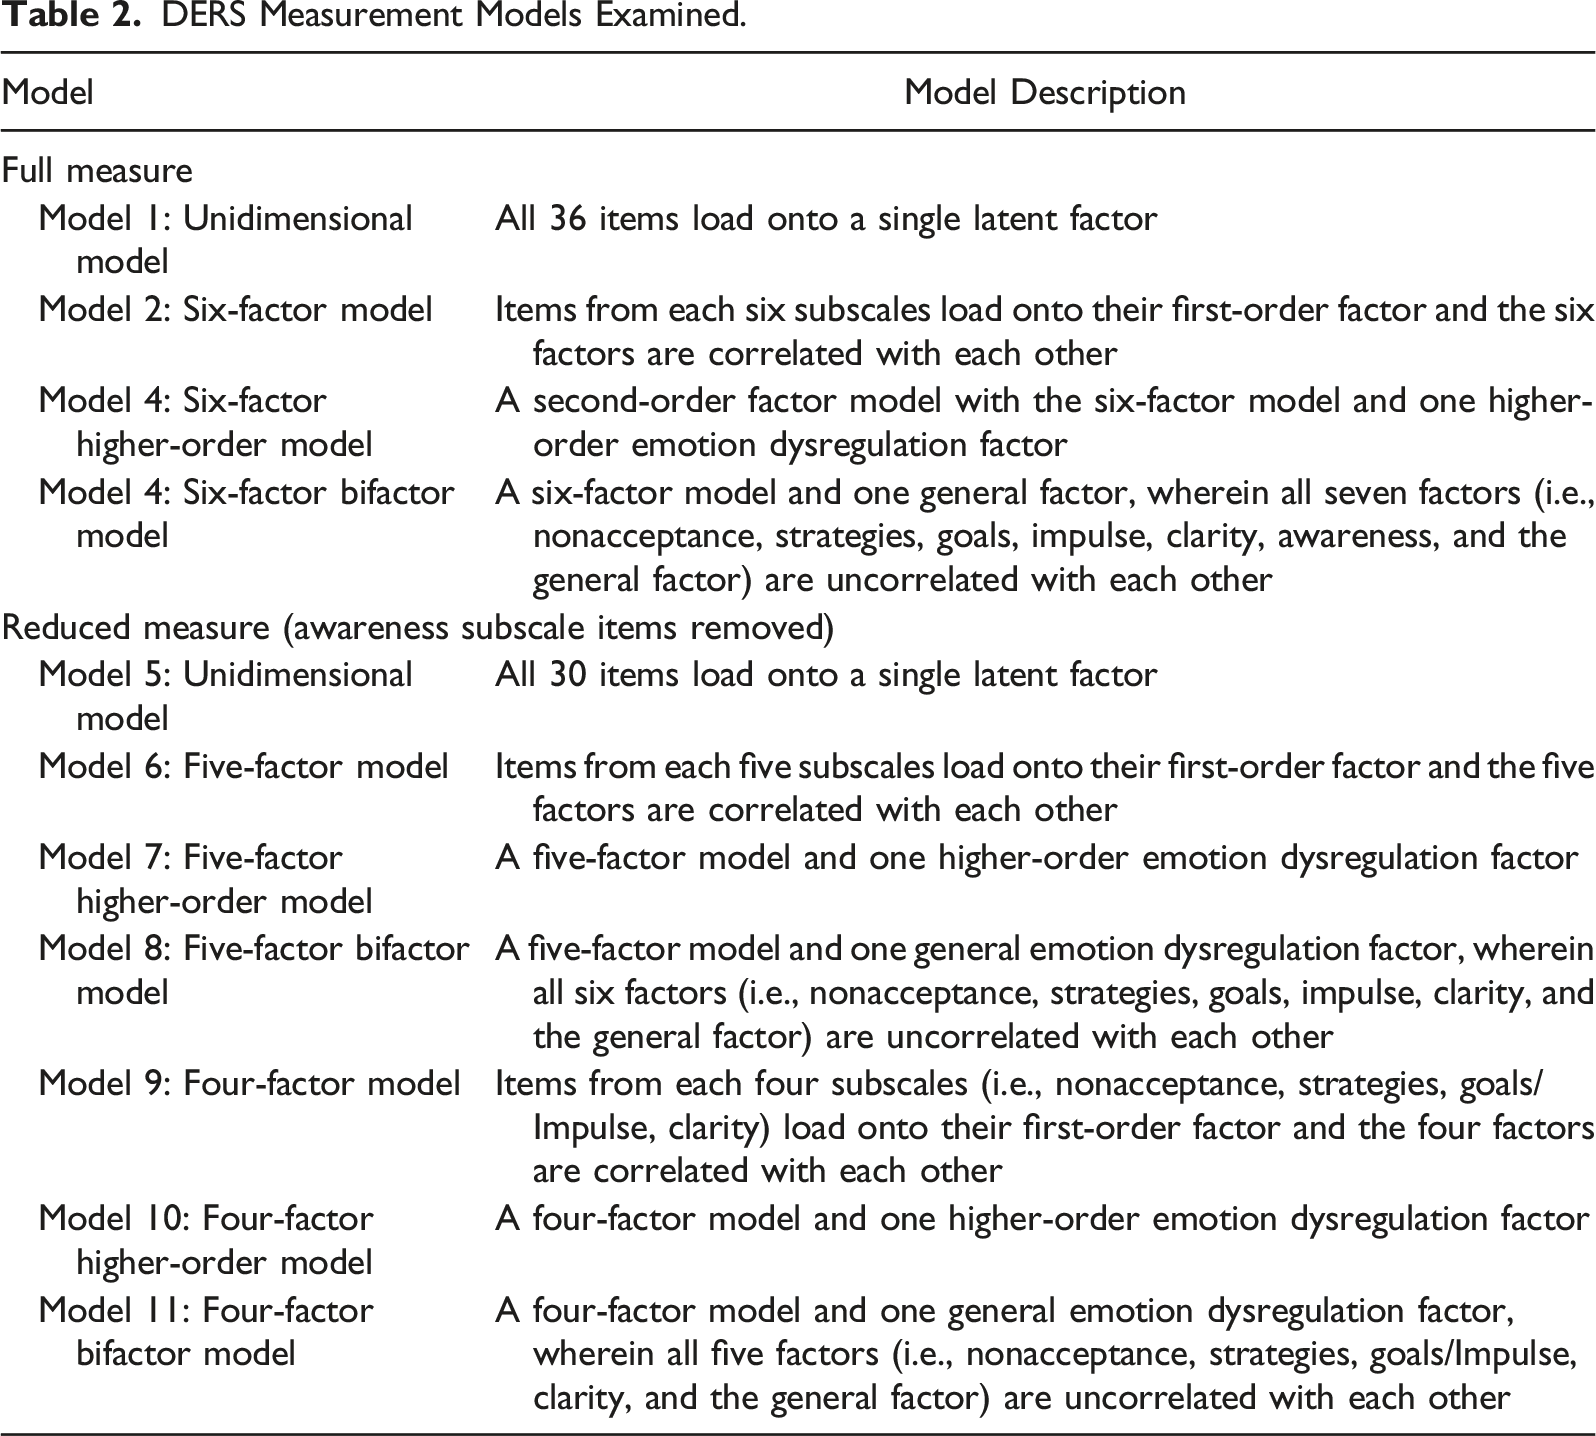
DERS Measurement Models Examined.
Model fit was assessed using the following fit indices: the root-mean square error of approximation (RMSEA), the comparative fit index (CFI), and the standardized root-mean square residual (SRMR).
For the best-fitting model, measurement invariance across nations was tested using multi-group CFAs, with robust maximum-likelihood estimation. Measurement invariance was examined using a series of increasingly restrictive model comparisons. First, a multi-group CFA with no equality constraints was tested across two groups (a configural invariance). Second, the restriction of equal factor loadings (weak invariance) was tested. Third, the restriction of equal item intercepts (strong invariance) was assessed. Finally, the restriction of equal residual variances (strict invariance) was evaluated.
Adding equality constraints on models tend to cause decreases in fit. Typically, the chi-square test is utilized to assess whether the decrease in fit is significant. However, as mentioned earlier, the use of the chi-square test has been criticized (Meade et al., 2008). Thus, the differences in model fit between the restricted model and the less restricted model were assessed as follows: measurement invariance should be rejected when change in CFI (ΔCFI) is less than −.01 (ΔCFI ≤ −.010) and change in RMSEA (ΔRMSEA) exceeds .015 (Cheung & Rensvold, 2002). In addition, the AIC and the BIC were used to compare competing models, with smaller values indicating better fit.
In instances where models assuming full weak or strong invariance were not supported, partial invariance was examined by identifying parameters that caused large modification indices. If strong invariance or partial strong invariance was supported, latent means between the U.S. and Taiwanese samples were compared (Byrne et al., 1989; Steenkamp & Baumgartner, 1998). Specifically, comparisons of factor means were examined by setting the factor mean of a group to zero, freely estimating the factor mean of the other group and testing for significant differences. If the bifactor model provided the best fit, model-based indices of reliability based on bifactor modeling were calculated, including coefficient omega, omega hierarchical, and omega hierarchical subscale (Rodriguez et al., 2016). These values were computed using the Bifactor Indices Calculator package (Dueber, 2017) in R. The minimum benchmark values of .50 recommended by Reise et al. (2013) were utilized to evaluate the OmegaH. In addition, the explained common variance (ECV) was calculated. A greater ECV value indicates that most of the explained variance is accounted for by the general factor and reflects the unidimensionality.
Results
Descriptive Statistics
Item mean (and standard deviation) values ranged from 1.78 to 3.63 (.79 – 1.34). Skewness values ranged between −.63 and 1.52; kurtosis values ranged between −1.16 and 1.48. Even though this is an ordinal data, skewness and kurtosis values were reported for reference.
Factor Structure of the DERS
The goodness-of-fit indices for the 11 measurement models of the DERS in the total sample are displayed in Supplementary Table S2 (the fit indices for the 11 measurement models of the DERS in the American and Taiwanese samples are displayed in Supplementary Table S3 and Table S4, respectively). The first set of models (Model 1–Model 4) was focused on the full 36-item DERS. None of the four measurement models evaluated with CFA showed good fit. The second set of models (Model 5–Model 11) was focused on the reduced version of the 30-item DERS. The unidimensional model (Model 5) showed poor fit. The five-factor (Model 6), five-factor higher-order (Model 7), four-factor (Model 9), four-factor higher-order (Model 10), and four-factor bifactor models (Model 11) showed slightly better fit than the unidimensional model (Model 5), though the CFIs of these five models fell below accepted thresholds. The five-factor bifactor model (Model 8; see Supplementary Figure S1) with one general factor and five orthogonal factors offered the best fit according to CFI, RMSEA, and SRMR (
Model-based Reliability and Dimensionality
Reliability results for the five-factor bifactor model (Model 8) are illustrated in Supplementary Table S5. The coefficient alpha and omega reliability estimates of the total and the subscales were high. The OmegaH for the total scale was high (.88) and the OmegaH results for all subscales were low, suggesting a strong general factor dimension. With respect to dimensionality, the ECV of the general factor was .66, which indicates that the general factor accounted for 66% of the common variance extracted. Thus, the DERS bifactor model provided evidence of a general factor.
Measurement Invariance of the DERS
Four levels of invariance for the 30-item and five-factor bifactor model (Model 8) were tested (the results are displayed in Supplementary Table S6). Configural invariance showed adequate model fit statistics. These findings provided support for a five-factor bifactor model across two nations. Weak invariance was then tested, and results indicated that the Δ
Latent Mean Comparisons
Given the evidence of partial strong invariance of the DERS, we conducted latent mean comparisons to test whether the latent mean of the DERS general factor was invariant across nations. Results indicated that the Taiwanese sample reported significantly higher mean levels of the general factor on the DERS scores than the American sample (ΔM = −2.859, SE = .535, t = 5.346, p < .001). The effect size was measured by the standardized mean difference (i.e., Cohen’s d) and was 3.52, where the standardized mean difference was derived from the difference between estimated latent means with the latent variances fixed to one in both groups. However, the effect size should be interpreted with caution given that only partial strong invariance was established.
Discussion
The current study examined the factor structure and measurement invariance of the DERS across nations (the United States and Taiwan). The primary findings are that the bifactor model with the Awareness subscale items removed demonstrated better fit and that measurement invariance testing indicated that factor structures were equivalent across college students in the United States and Taiwan. Partial weak invariance and partial strong invariance were established across nations. Taiwanese students reported significantly higher emotion dysregulation than American students.
The present study extended existing research by cross-culturally testing whether the factor structure of the DERS was consistent with what has been found in other, predominantly European or European American samples. 11 CFA models were tested and evaluated. The results are consistent with Hallion et al.’s (2018) study, which indicated that the bifactor model with the Awareness subscale items removed demonstrated better fit. Our findings also add support for the clinical and measurement utility of the bifactor model of the DERS across the United States and Taiwan for college students.
The model-based reliability and dimensionality of the DERS based on the bifactor model were examined. The results are consistent with the study by Nordgren et al. (2020) and suggested that the general factor accounted for most of the explained variance in comparison to the specific factors. With respect to the subscales of the DERS, the OmegaH values varied and the results provided some support for the use of the Clarity subscale. The findings indicated that interpretations of the subscales of Goals, Impulse, Nonacceptance, and Strategies need to be made with caution in cross-national samples, give that most of the reliable variance was accounted for by the general factor than by these specific factors.
One of the controversies about the DERS pertains to the problems with the Awareness subscale. In line with previous studies (e.g., Bardeen et al., 2012; Osborne et al., 2017), our results provided evidence for the problems with the Awareness subscale in a cross-national sample. Thus, consistent with the recommendations made by previous studies (e.g., Hallion et al., 2018), the results of the present study suggested that the Awareness subscale be excluded when using the DERS in future studies. To address concerns with reverse-coded problems of the Awareness subscale, Bardeen et al. (2016) developed a modified version of the DERS (M-DERS) in which all of the reverse-coded items of the DERS were rephrased in a straightforward manner. The CFA results supported the factor structures of the M-DERS (Bardeen et al., 2016). Future research may consider using the M-DERS with culturally diverse samples. Another possible way to handle problems with the Awareness subscale is to use the DERS-16 (i.e., a 16-item brief version of the DERS proposed by Bjureberg et al., 2016) since the DERS-16 has excluded the Awareness subscale and exhibited sound reliability and validity (Bjureberg et al., 2016; Hallion et al., 2018). Given recent discussions on potential benefits of using shortened versions of the DERS (Skutch et al., 2019), it is suggested that future research use DERS-16 or other shortened versions of the DERS (e.g., DERS-SF developed by Kaufman et al., 2016 and the DERS-18 proposed by Victor & Klonsky, 2016) with culturally diverse samples and test the measurement invariance of the shortened versions of the DERS in cross-cultural samples.
Cross-national measurement invariance testing indicated that configural invariance was supported, revealing that the factor structures of the DERS are the same across the U.S. and Taiwanese samples. Partial weak invariance of the DERS was established. The following six-factor loadings were variant across samples: Item 33 on a specific factor (Goals), Item 29 on the general factor, Item 25 on the general factor, Item 3 on the general factor, Item 12 on a specific factor (Nonacceptance), and Item 29 on a specific factor (Nonacceptance). Variances of these six loadings across nations suggest that there are variations of how well these items can measure the latent construct of the DERS. Differences in loadings may be explained by reasons such as translation issues and cultural differences (Chen, 2008). Regarding translation issues, variant loadings may be the result of some items having different meanings in other languages. For instance, the direct translation of “out of control” in Item 3 (“I experience my emotions as overwhelming and out of control”) may make the Taiwanese participants to be less willing to report the frequency of this item than Americans since “out of control” in Chinese can be interpreted as an extreme expression of losing control. As pointed out by Geisinger (1994), using forward translation or back translation may not be enough in cross-cultural assessments. Thus, even though the Chinese version the DERS used in the present study followed the basic steps of translation (including translation and pilot tests), the translation procedures did not meet all of the requirements of the ITC Guidelines for Translating and Adapting Test (International Test Commission, 2018) and may affect the results of the study. It will be helpful to follow the ITC Guidelines for Translating and Adapting Test for cross-cultural assessments of the DERS for future research such as using reconciliation procedures by a group of experts and incorporating qualitative interviews after pilot tests of the instrument.
In terms of cultural differences, lack of loading equivalence may arise from the different meanings of emotions in different cultures. As pointed out by Markus and Kitayama (1991), how various emotions are experienced may depend on cultural values and can be broadly classified as ego-focused emotions versus other-focused emotions. Ego-focused emotions, such as anger, tend to use an individual’s self as the reference framework. In contrast, other-focused emotions, such as shame, tend to use another person as the referring source. This implicit distinction has important implications for individuals from different cultures. Specifically, individuals from individualistic cultures can be more skilled at experiencing these ego-focused emotions while individuals from interdependent cultures can be more skilled at experiencing other-focused emotions. Thus, for Americans, items that are connected to ego-focused emotions may be experienced more strongly, such as Item 29 (“When I’m upset, I become irritated with myself for feeling that way”). For Taiwanese students, however, items that are connected to other-focused emotions may be experienced more strongly, such as Item 25 (“When I’m upset, I feel guilty for feeling that way”) and Item 12 (“When I’m upset, I become embarrassed for feeling that way”). These six items may have different meanings across cultures, and differences at an item level can be referred to as item bias or differential item functioning (DIF) (e.g., Holland & Thayer, 1988). For these items, it should be noted that the response patterns caused by DIF may not be consistent with the raw scores. The raw scores are also affected by differences in item performance across groups, and this can be referred to as impact (e.g., Ackerman, 1992). Conceptually, raw scores can be a function of DIF and impact, and thus raw scores may be different from response patterns (Wu et al., 2017). For instance, Taiwanese students reported higher raw scores on Item 29 (Mean = 3.63) than American students (Mean = 2.43) though American students may be more likely to experience ego-focused emotions than Taiwanese students, and this discrepancy can be explained in the latent mean comparison in which Taiwanese participants reported higher factor means of the emotion dysregulation general factor than American participants.
Partial strong measurement invariance of the DERS was established. The following five intercepts showed noninvariance: Item 23 (“When I’m upset, I feel like I am weak”), Item 9 (“I am confused about how I feel”), Item 5 (“I have difficulty making sense out of my feelings”), Item 30 (“When I’m upset, I start to feel very bad about myself”), and Item 36 (“When I’m upset, my emotions feel overwhelming”). Specifically, American college students had a higher probability of agreeing with these items than Taiwanese college students. It should be noted that Taiwanese students reported higher raw scores than American students on Item 5 (Mean for Taiwanese = 2.43; Mean for American = 2.41) and Item 23 (Mean for Taiwanese = 3.20; Mean for American = 2.60). As mentioned earlier, the higher factor means of the emotion dysregulation reported by Taiwanese participants than American participants may account for this discrepancy. The lack of intercept invariance on these items can be attributed to a variety of factors. For instance, Taiwanese students may be less likely to endorse these items since agreeing with them may reflect vulnerability and may imply “losing face” (i.e., losing social standing due to being evaluated by others in a negative manner). Similarly, expressive suppression, a particular form of emotion regulation, is higher in countries that emphasizes collectivism (Matsumoto et al., 2008) and may further preclude Taiwanese students from agreeing with these items.
Since partial strong invariance was established, we were able to compare factor means. The latent mean comparison revealed that Taiwanese students reported a significantly higher latent mean on the emotion dysregulation general factor than American students, indicating that Taiwanese college students may be less capable of regulating their emotions. These findings seem to align with past research that suggested that there are cultural differences in emotion regulation (Matsumoto et al., 2008). One of the primary factors that contribute to cultural differences in emotion regulation is related to the distinctive cultural context, such as individualism and collectivism. For instance, in a collectivist culture like Taiwan, emotional control is emphasized. If conceptualizations of difficulties of emotion regulation involve emotional control, the findings that Taiwanese college students reported more emotion dysregulation is not surprising. However, since the DERS only exhibited partial strong invariance, some intercepts of the scale might still be different from one culture into another and have not been identified. Thus, latent mean differences of the DERS could be biased due to this inequality and interpretations need to be made with caution.
It should be noted that our results were not in line with previous research that examined measurement invariance of the DERS across nations (Snow et al., 2013). Specifically, Snow et al. (2013) did not find evidence to support the configural invariance across nations among college students from India and the United States. Despite the fact that different findings might be sample-specific, two reasons may account for these results. First, the measurement models that were used to test configural invariance were not the same. Snow et al. (2013) examined four measurement models and used the five-factor model of a reduced version of the DERS (excluding the Awareness subscale) as a baseline model, while the present study examined 11 models and used the bifactor model as a baseline model. Second, such differences might have arisen due to cultural differences between India and Taiwan. While Asian countries tend to be viewed as generally collectivist, the distinctive sociopolitical experiences of India and Taiwan may lead to different manifestations of collectivism.
The present findings should also be considered in light of study limitations. First, the data were only obtained from college students from the United States and Taiwan. More research is needed to examine the psychometric properties of the DERS in other countries that vary in the levels of individualism and collectivism. Moreover, the majority of the participants in both samples are female college students from a university in Taiwan and a university in the United States and may thus limit the generalizability of the findings. Indeed, the U.S. sample for this study was quite heterogenous and may not be representative of the typical ethnic distribution in the U.S. Second, while the current study provided support for the bifactor model of the DERS, controversies about bifactor models should be taken into consideration. As pointed out by Bonifay et al. (2017), bifactor models tend to exhibit better fit than other competing models due to problems such as overfitting rather than the appropriateness of the structure of the measured construct. Moreover, even though the bifactor model offered an adequate fit and was chosen as the final model, one of the fit indices was at the borderline cutoff value (CFI = .907) and the possibility of model mis-specification cannot be ruled out. Thus, without more research, it is difficult to know whether this is a valid representation of the factor structure in this population and the results need to be interpreted with caution. Third, although the 5-point scale used in this study is considered sufficient to be treated as continuous, it would be preferable if it could be specified as a categorical/ordinal scale (e.g., Li, 2016). Indeed, in the multi-group analysis, robust WLS estimators (e.g., DWLS estimator) have been applied to model estimation, but encountered convergence problems. Given the relatively larger model employed in the study, it is suggested that future research can obtain larger sample sizes and employ the estimator that is more suitable to ordinal data (e.g., DWLS) to validate the study (e.g., DiStefano & Morgan, 2014; Moshagen & Musch, 2014; Yang-Wallentin, Joreskog & Luo, 2010Yang-Wallentin et al., 2010). Fourth, the reasons for non-equivalence are not known. Different sources of bias such as construct bias (e.g., cultural differences in appropriate behaviors that are connected to the construct) and method bias (e.g., social desirability) may affect the results in cross-cultural studies (Van de Vijver & Tanzaer, 2004). More research will be needed in examining potential biases in the DERS in cross-cultural studies.
In conclusion, the current study examined the factor structure of the DERS in a cross-national sample. The results suggested that the bifactor model with the Awareness subscale items removed provided the best fit. Model-based indices suggested that the use of a general emotion dysregulation factor of the DERS is recommended with cross-national samples. The present study is also the first to test the measurement invariance across the United States and Taiwan. Results indicate that college students from the United States and Taiwan conceptualize the latent construct of emotion dysregulation measured by DERS similarly. The present study highlights the need for more research attending to the cultural factors in the dimensionality and measurement invariance of the construct of emotion dysregulation and DERS so that inaccurate conclusions in cross-cultural research can be avoided.
Supplemental Material
Supplemental Material—Examining the Factor Structure and Measurement Invariance of the Difficulties in Emotion Regulation Scale Across Taiwanese and American University Students
Supplemental Material for Examining the Factor Structure and Measurement Invariance of the Difficulties in Emotion Regulation Scale Across Taiwanese and American University Students by Yun-Jy Yeh, Jyun-Hong Chen, William Tsai, and Sasha Kimel in Journal of Psychoeducational Assessment
Footnotes
Declaration of Conflicting Interests
The author(s) declared no potential conflicts of interest with respect to the research, authorship, and/or publication of this article.
Funding
The author(s) disclosed receipt of the following financial support for the research, authorship, and/or publication of this article: This research was supported in part by the Ministry of Science and Technology in Taiwan (Grant No. MOST 108-2410-H-031-004).

Supplemental Material
Supplemental material for this article is available online.
References
Supplementary Material
Please find the following supplemental material available below.
For Open Access articles published under a Creative Commons License, all supplemental material carries the same license as the article it is associated with.
For non-Open Access articles published, all supplemental material carries a non-exclusive license, and permission requests for re-use of supplemental material or any part of supplemental material shall be sent directly to the copyright owner as specified in the copyright notice associated with the article.
