
Abstract
Understanding the dimensionality of social-emotional learning is critical for valid assessment in youth. This study examined the psychometric properties of the Social-Emotional Learning Scale (SELS), and its associations with subjective well-being in a sample of 711 Portuguese students (50.6% girls; M age = 11.01, sd = .81). Structural equation modeling indicated that a bifactor structure (one general and two specific factors: Peer Relationships and Self-regulation) provided the best fit (CFI robust = .966, RMSEA robust = .031, SRMR = .032). The bifactor indices supported unidimensionality (ECV = .896, PUC = 0.78, Omega G = 0.88), but not the interpretation of subscale scores. Metric and scalar invariance across gender was supported. An Item Response Theory analysis indicated the SELS is most informative at lower levels of the latent trait. Higher SEL was related to greater positive affect, lower negative affect, and greater life satisfaction. Our findings support unidimensionality and the usefulness of the SELS for identifying youth with lower social-emotional competence.
Introduction
The educational system is responsible for cultivating aspects of human experience that promote holistic and harmonious development. In recent decades, researchers have made strides in showing that emotional and social maturation is as important as cognitive development (Ashdown & Bernard, 2012; Coryn et al., 2009; Durlak et al., 2010; Elias et al., 1997; Gardner, 1983; Moreira, Inman, et al., 2021; Salovey & Mayer, 1990; Schmeck et al., 2001; Taylor et al., 2017; Zimmerman et al., 1992). A balanced educational paradigm must, therefore, include social-emotional learning (SEL) and not simply logical-propositional dimensions (Costa et al., 2022; Moreira & Garcia, 2019). SEL can be defined as the process through which people acquire and apply the competencies necessary to “recognize and manage emotions, develop caring and concern for others, establish positive relationships, make responsible decisions, and handle challenging situations constructively” (Collaborative for Academic, Social, and Emotional Learning [CASEL], 2008, p. 1). In this way, SEL skills are conceptualized as capabilities an individual has that can be applied to specific contexts (Soto et al., 2024).
Over the past few years, a consensus has emerged within the literature, deeming the CASEL social-emotional skills framework as the most comprehensive (Martinez-Yarza et al., 2023). This is because, for the most part, all components proposed by different models fall within CASEL’s five interrelated skills: self-awareness, self-management, social awareness, relationship skills, and responsible decision-making. Self-awareness reflects the capacity to assess our strengths and weaknesses and the ability to successfully recognize what we are feeling, thinking, and valuing and how these relate to our actions. Self-management is the ability to regulate emotions, thoughts, and behaviors according to the situation and the desired goal. Social awareness is the ability to empathize with others and behave and interact properly within communities and society at large, in accordance with social and ethical norms. Relationship skills refer to the ability to develop and cultivate positive and meaningful relationships, communicate, listen, and cooperate with others. Lastly, responsible decision-making is the ability to evaluate the possible consequences of our actions and make choices that can have a positive outcome on us and those around us, simultaneously promoting individual and collective well-being.
Because of its wide coverage, CASEL’s framework has been widely adopted, with hundreds of school-based intervention programs significantly improving students’ academic outcomes (Durlak et al., 2011). CASEL’s popularity has highlighted the need to develop psychological instruments capable of assessing students’ levels of SEL. While many instruments measuring socio-emotional components exist (Bru-Luna et al., 2021), most measure narrow aspects of SEL. While useful in specific contexts, these are lacking in generalizability. To surpass these limitations, Coryn et al. (2009) developed the Social-Emotional Learning Scale (SELS), a 20-item inventory, designed to be in line with CASEL’s framework.
The Current Study
The first psychometric investigation of the SELS (Coryn et al., 2009) indicated that three interrelated factors could be extracted: task articulation, peer relationships, and self-regulation. Task articulation captures CASEL’s responsible decision-making; the peer relationships dimension captures social awareness and relationship skills; and self-regulation captures self-awareness and self-management. The three-factor solution showed acceptable fit in a U.S. sample (χ2 = 520.58, CFI = .908; RMSEA = .058; Coryn et al., 2009) and good fit in a Turkish sample (χ2 = 264.67; RMSEA = .049, CFI = .980; Arslan & Akın, 2013). More recently, however, Thomas et al. (2022) found evidence for a unidimensional structure, reflecting what the authors tentatively label “emotional self-efficacy.” Emotional self-efficacy reflects an individual’s belief in their capacity to successfully employ social-emotional competences to attain desired outcomes. Despite the need for psychological instruments capable of assessing students’ levels of SEL, the dimensionality of the SELS is unclear, and therefore its usage can be questioned. Using an SEM approach, our first objective was to test the psychometric properties of the SELS in Portuguese children.
Beyond testing its factorial structure, we also sought to test construct validity by analyzing associations between the SELS and the three components of subjective well-being (SWB; positive affect, negative affect, and life satisfaction) (Diener, 1984). Evidence suggests that children and adolescents with higher social-emotional functioning are more likely to experience increased well-being and various positive outcomes (Ashdown & Bernard, 2012; Chernyshenko et al., 2018). Multiple meta-analyses (e.g., Corcoran et al., 2018; Durlak et al., 2010; Durlak et al., 2011; Murano et al., 2020) have indicated a reduction in conduct problems and higher academic achievement and school engagement. In addition to engagement, a study by Salmela-Aro and Upadyaya (2022) found that students high on SEL tended to be less stressed and burned out. Taylor et al. (2017) found that SEL interventions improved positive attitudes, prosocial behavior, safe sexual behaviors, and worked as a protective factor against conduct problems, emotional distress, and drug use.
Method
Participants
Children enrolled in schools from the North of Portugal participated in this study. After excluding six duplicate cases (using the SPSS function: Identify Duplicate Cases), and participants with >25% missing data across all measures, this study analyzes data from 711 (50.6% girls, 49.4% boys) students, mostly aged between 10 (1st quartile) and 12 (3rd quartile) (M = 11.01, sd = .81).
Missing Data Treatment
After exclusions, participants with missing data were distributed as follows across the instruments used: SELS = 0.5%; ETS-Y = 0.9%; BMSLSS = 0.1%. Little’s MCAR test, to determine the mechanism of missing data indicated data was not missing completely at random (MCAR) for the SELS (χ2 = 571.425, df = 480, p < .001) and ETS-Y (χ2 = 531.956, df = 344, p < .0001). However, given the very low proportion of missing data across instruments, the impact of non-MCAR missingness is likely minimal. On the other hand, Little’s MCAR test was not significant for the BMSLSS (χ2 = 8.470, df = 15, p > .05) indicating that the data is MCAR. Given these results, we used predictive mean matching (PMM) imputation, an approach to replace missing values that performs well under MAR (Lee & Shi, 2021; Lim & Cheung, 2022). While full information maximum likelihood (FIML) is commonly used in SEM, as it integrates missing data handling directly within model estimation, we chose PMM since it is robust to potential distributional non-normality and allows us to preserve observed data distributions. Importantly, because the proportion of missing data was very low (<1% across all instruments), the choice of imputation method most likely did not influence parameter estimates or standard errors.
Ethics and Procedures
Ethical approval was granted by the Ethics Committee of Lusíada University, Porto, Portugal, ensuring full adherence to the Helsinki Declaration. Personal informed consent and written consent from a parent/legal guardian was a requirement for participation in the study.
Measures
Social-Emotional Learning
The SELS was used to measure the extent to which children have the knowledge and skills for adaptive social-emotional functioning. The instrument was developed to be in line with CASEL categories, and items were chosen by an advisory group including educators, human service professionals, parents, students, and researchers. SELS item content taps into task articulation (e.g., “Keep track of my progress toward a goal”), peer relationships (e.g., “Work positively in groups with people who are different from me”), and self-regulation (e.g., “Understand that I am responsible for my own actions”). All 20 items of this scale are rated on a five-point Likert scale from 1 (strongly disagree) to 5 (strongly agree). As will be shown, the SELS is a unidimensional measure; thus, we averaged together responses to the 20 items. Higher scores reflect greater social-emotional competence, consistent with the CASEL framework of adaptive social-emotional functioning.
Cultural Adaptation and Translation
Following standard translation and back-translation procedures (Mallinckrodt & Wang, 2004), the original English items of the SELS were translated into European Portuguese by two Portuguese researchers, and then back-translated into English by a third native English speaker (proficient in Portuguese). The back-translated items were then examined and compared to the originals, thus ensuring accuracy and cultural sensitivity.
Positive and Negative Affect
The Emotional Tonality Scale-Youth (ETS-Y) was used to measure children’s affective experience. The ETS-Y is an adaptation of the Positive and Negative Affect scale (Watson et al., 1988) which incorporates emotions and feelings with varying degrees of arousal/activation (Russell, 1980). The scale comprises eight positive (e.g., “happy”) and eight negative (e.g., “depressed”) adjectives. Participants are asked to report how much they have experienced these emotions in the past weeks from 1 (very slightly or not at all) to 5 (extremely). In this sample, using Exploratory Structural Equation Modelling [following the procedure illustrated by Tóth-Király et al. (2017) and Asparouhov and Muthén (2009)], a two-factor model showed good fit (χ2 = 287.129, df = 117; CFI = 0.927, RMSEA = 0.065 [0.057, 0.073], SRMR = 0.055). Latent factor correlations revealed a negative relationship between the two factors (r = -0.33). We averaged participants’ positive emotions (higher scores reflect higher levels of positive affect) and negative emotions (higher scores reflect higher levels of negative affect). Additionally, we subtracted mean negative from mean positive to create an affective well-being composite. Although prior research (e.g., Cloninger & Zohar, 2011; Costa et al., 2022; Costa et al., 2025; Moreira et al., 2015; Moreira, Pedras, et al., 2021) supports difference scores as an index of affective balance, it should be noted that in isolation they may introduce interpretational limitations and obscure the unique contributions of positive and negative affect.
Satisfaction With Life
We used the Portuguese version (Costa et al., 2022) of the Brief Multidimensional Student’s Life Satisfaction Scale (BMSLSS; Huebner et al., 2006). The BMSLSS measures the degree of satisfaction across five domains of life (e.g., “I would describe my satisfaction with my family life as…”) and satisfaction in general. These items are rated on a seven-point scale from 0 (terrible) to 6 (fantastic). Previous research (e.g., Abubakar et al., 2016; Costa et al., 2022; Fang et al., 2021; Hashim & Areepattamannil, 2017; Huebner et al., 2006; Siyez & Kaya, 2008) indicates that the BMSLSS is a unidimensional measure. In this sample, the one-factor model had an excellent fit (χ2 = 17.842, df = 9; CFI = .982, RMSEA = .055 [.000, .095], SRMR = .030); thus, we averaged together responses to the six items. This composite reflects a global evaluation of life satisfaction, with higher scores reflecting greater satisfaction with life.
Statistical Analysis
All statistical analyses were performed using the statistical software R (R Core Team, 2025) with the following exceptions: Bifactor indices were estimated using Dueber’s (2017) Bifactor Indices Calculator; Dynamic Model Fit Indices were implemented through Wolf and McNeish (2020) app (https://dynamicfit.app/connect/#/welcome).
Factor Analysis
Based on prior research, we started by testing one- and three-factor structures. Hierarchical and bifactor (two models, the first with a general factor and three specific factors, and a second with a general factor and two specific factors) structures were also tested. The robust maximum likelihood estimator (MLR) method, through the CFA function of the lavaan package (Rosseel, 2012) was used, as it provides corrected standard errors and fit indices that are robust to non-normality (Li, 2016; Yuan & Bentler, 2000). To compare the competing models in terms of likelihood of replication (smaller values indicate better fit), two predictive fit indices were selected, namely, the Akaike Information Criteria (AIC) and the sample-size adjusted Bayesian Information Criterion (saBIC) (Kline, 2011; Vrieze, 2012). We assessed the goodness of fit by referring to the commonly accepted approximate fit indices, namely, SRMR <0.05, and the new robust versions (Savalei, 2018) of CFI ≥.95 and RMSEA <.08, and (Browne & Cudeck, 1992; Cangur & Ercan, 2015; Hu & Bentler, 1999). To complement these commonly accepted rules-of-thumb, we use the simulation-based Dynamic Fit Index (DFI) framework, which produces model- and data-specific CFI and RMSEA cutoffs.
Measurement Invariance
We tested whether the SELS is invariant between boys and girls using a multigroup CFA (MGCFA) approach. This entails testing configural, metric (equivalence of item loadings), and scalar (equivalence of item loadings and intercepts) models. If CFI ≥0.010 and changes in RMSEA ≥0.015 and SRMR ≥0.030 (metric model) and ≥0.015 (scalar model), the scale is non-invariant (Chen, 2007).
Item Response Theory (IRT)
The Multidimensional Item Response Theory (MIRT) package (Chalmers, 2012) allowed us to use a Graded Response Model to test two item properties of the SELS: discriminability (α) which is an item’s ability to distinguish between individuals that vary on the latent trait—α between 0.01 and 0.34 (very low), 0.34–0.64 (low), 0.65–1.34 (moderate), 1.35–1.69 (high), and >1.7 (very high) (Baker, 2001); and difficulty (β) which pertains to the level of the latent construct at which the next response category has 50% chance of being endorsed. Items should neither be too hard nor too easy (mean beta >|1.5|) (Rauthmann, 2013).
Construct Validity
Associations between SELS and theoretically related (convergent validity) and unrelated constructs (divergent validity) were assessed. An SEM approach, to reduce measurement error, was used to evaluate latent factor correlations. Specifically, correlated-traits models were estimated and associations between SEL and positive affect, negative affect, and life satisfaction were examined. These three components are widely recognized as the core elements of SWB (Diener, 1984). Importantly, research suggests positive affect, negative affect, and life satisfaction are dependent on distinct organizations of psychobiological systems (Moreira et al., 2023) associated with developmentally and functionally dissociable brain networks (Zwir et al., 2021). Because of this, it is important to examine them independently. Simultaneously, various authors have also found evidence of an underlying general SWB factor that captures shared variance (e.g., Al Nima et al., 2020; Kaufman et al., 2022). Based on this, we adopted a dual analytical strategy, by first examining correlations with each SWB component separately and then by evaluating theoretically grounded composite indices, consistent with prior research (Cloninger & Zohar, 2011; Costa et al., 2022, 2025; Josefsson et al., 2011; Moreira et al., 2015). SEM models were therefore estimated in which SEL was related to well-being composites specified as observed variables. An affective well-being index was computed as the difference between mean positive affect and mean negative affect. This operationalization is consistent with both classic (Bradburn, 1969; Diener, 1984) and more contemporary models (Diener, Oishi, & Tay, 2018) that conceptualize affective well-being as the preponderance of positive over negative affect. An SWB index was then computed by combining affective well-being and cognitive well-being (global life satisfaction). SWB is commonly conceptualized as the person’s perceived quality of life, integrating cognitive evaluations and affective experiences (Busseri & Sadava, 2011; Davern et al., 2007; Diener, 1984; Diener, Lucas, et al., 2018; Luhmann et al., 2012; Schimmack et al., 2008).
Results
Descriptive Statistics, Reliability, and Correlations
Descriptives, internal consistency, and correlations amongst study variables
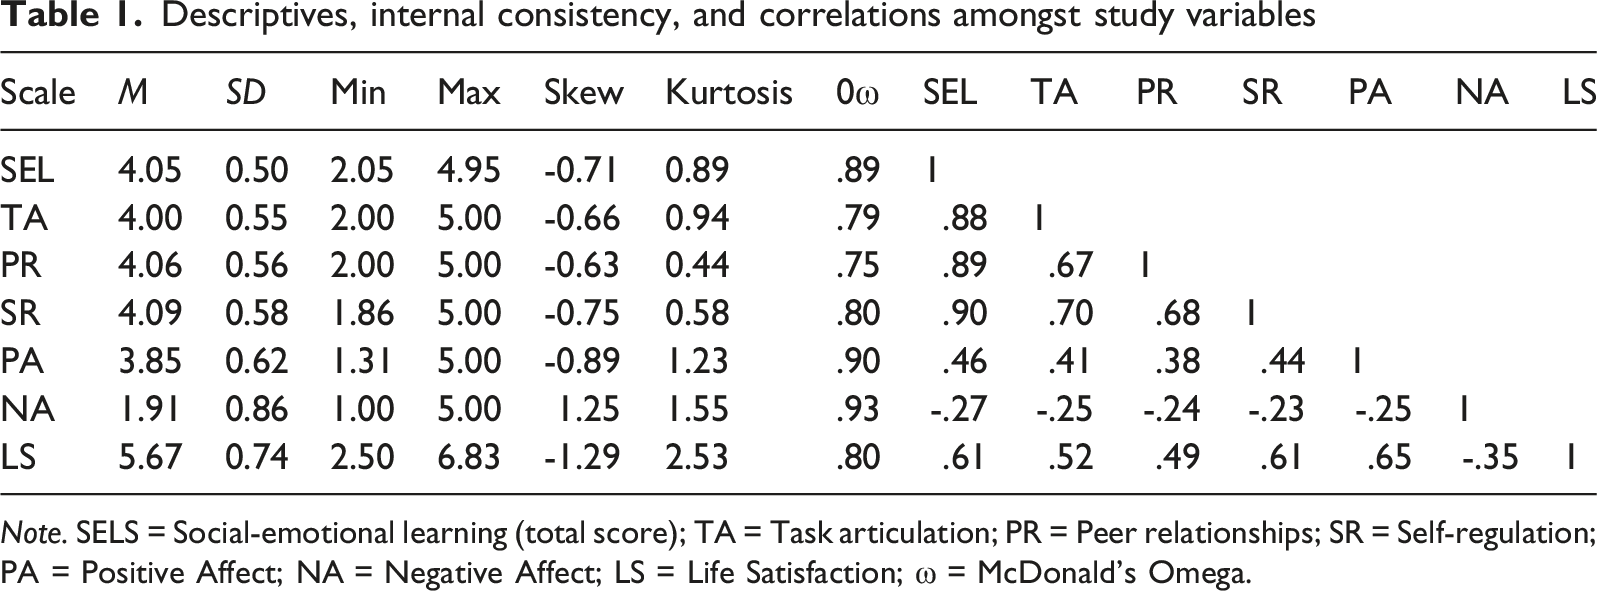
Note. SELS = Social-emotional learning (total score); TA = Task articulation; PR = Peer relationships; SR = Self-regulation; PA = Positive Affect; NA = Negative Affect; LS = Life Satisfaction; ω = McDonald’s Omega.
Assessment of Multivariate Normality
Multivariate normality of the SELS was assessed using Mardia’s tests. Both skewness (4750.06) and kurtosis (58.08) were high (p < .001), with univariate Anderson-Darling tests confirming non-normality across all 20 items. Item 15 showed the highest deviations (skew = −1.745, kurtosis = 6.277), likely due to ceiling effects (M = 4.54, median = 5). Given these results, we opt to use MLR for the proceeding SEM Models, as this method is robust to non-normality.
Confirmatory Factor Analysis
Model fit indices for the SELS factor structures tested via Confirmatory Factor Analysis
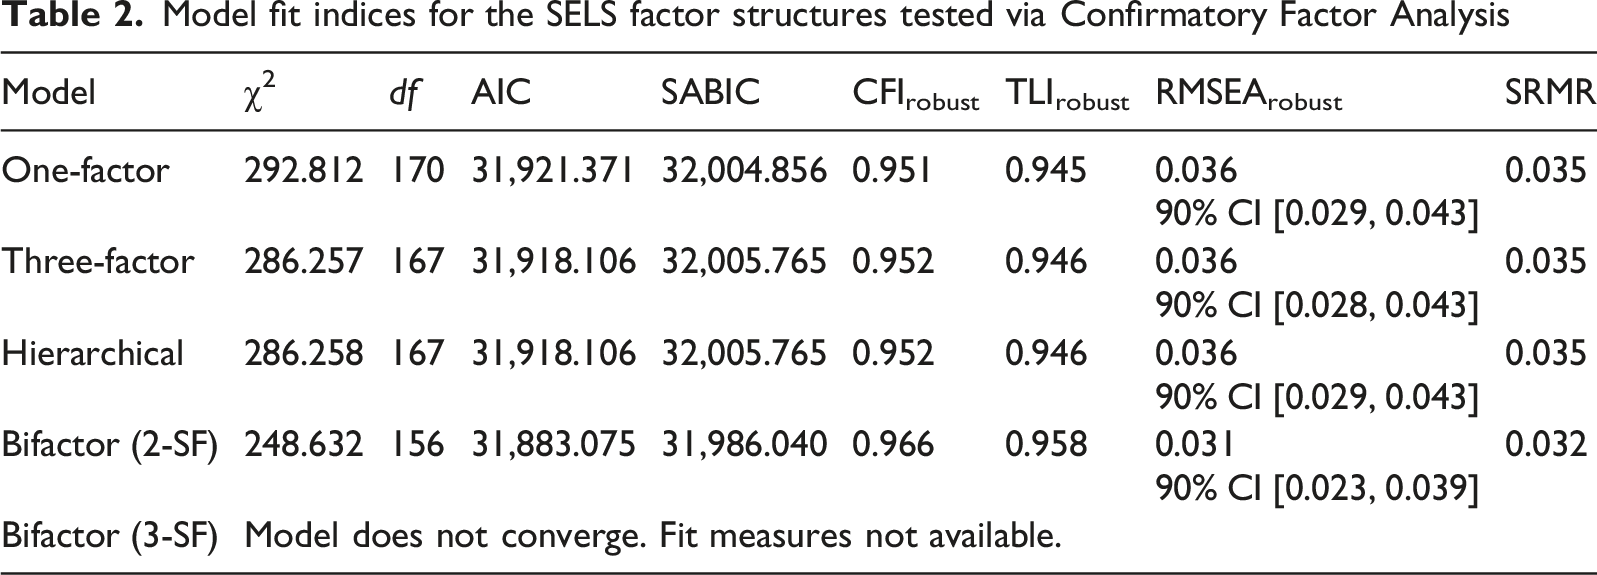
These results are further supported by the Dynamic Fit Index framework with equivalence testing, with the bifactor edging out other competing models. Indeed, the T-size RMSEA indicated “Close” fit for the one-factor/hierarchical/three-factor (.038) and bifactor models (.036). Additionally, T-size CFI for the one-factor (.917), hierarchical/three-factor (.918), and bifactor models (.933) fell in the “Fair” category.
Assessment of Unidimensionality: Analysis of Bifactor Indices
Standardized factor loadings and IECV for the SELS bifactor model
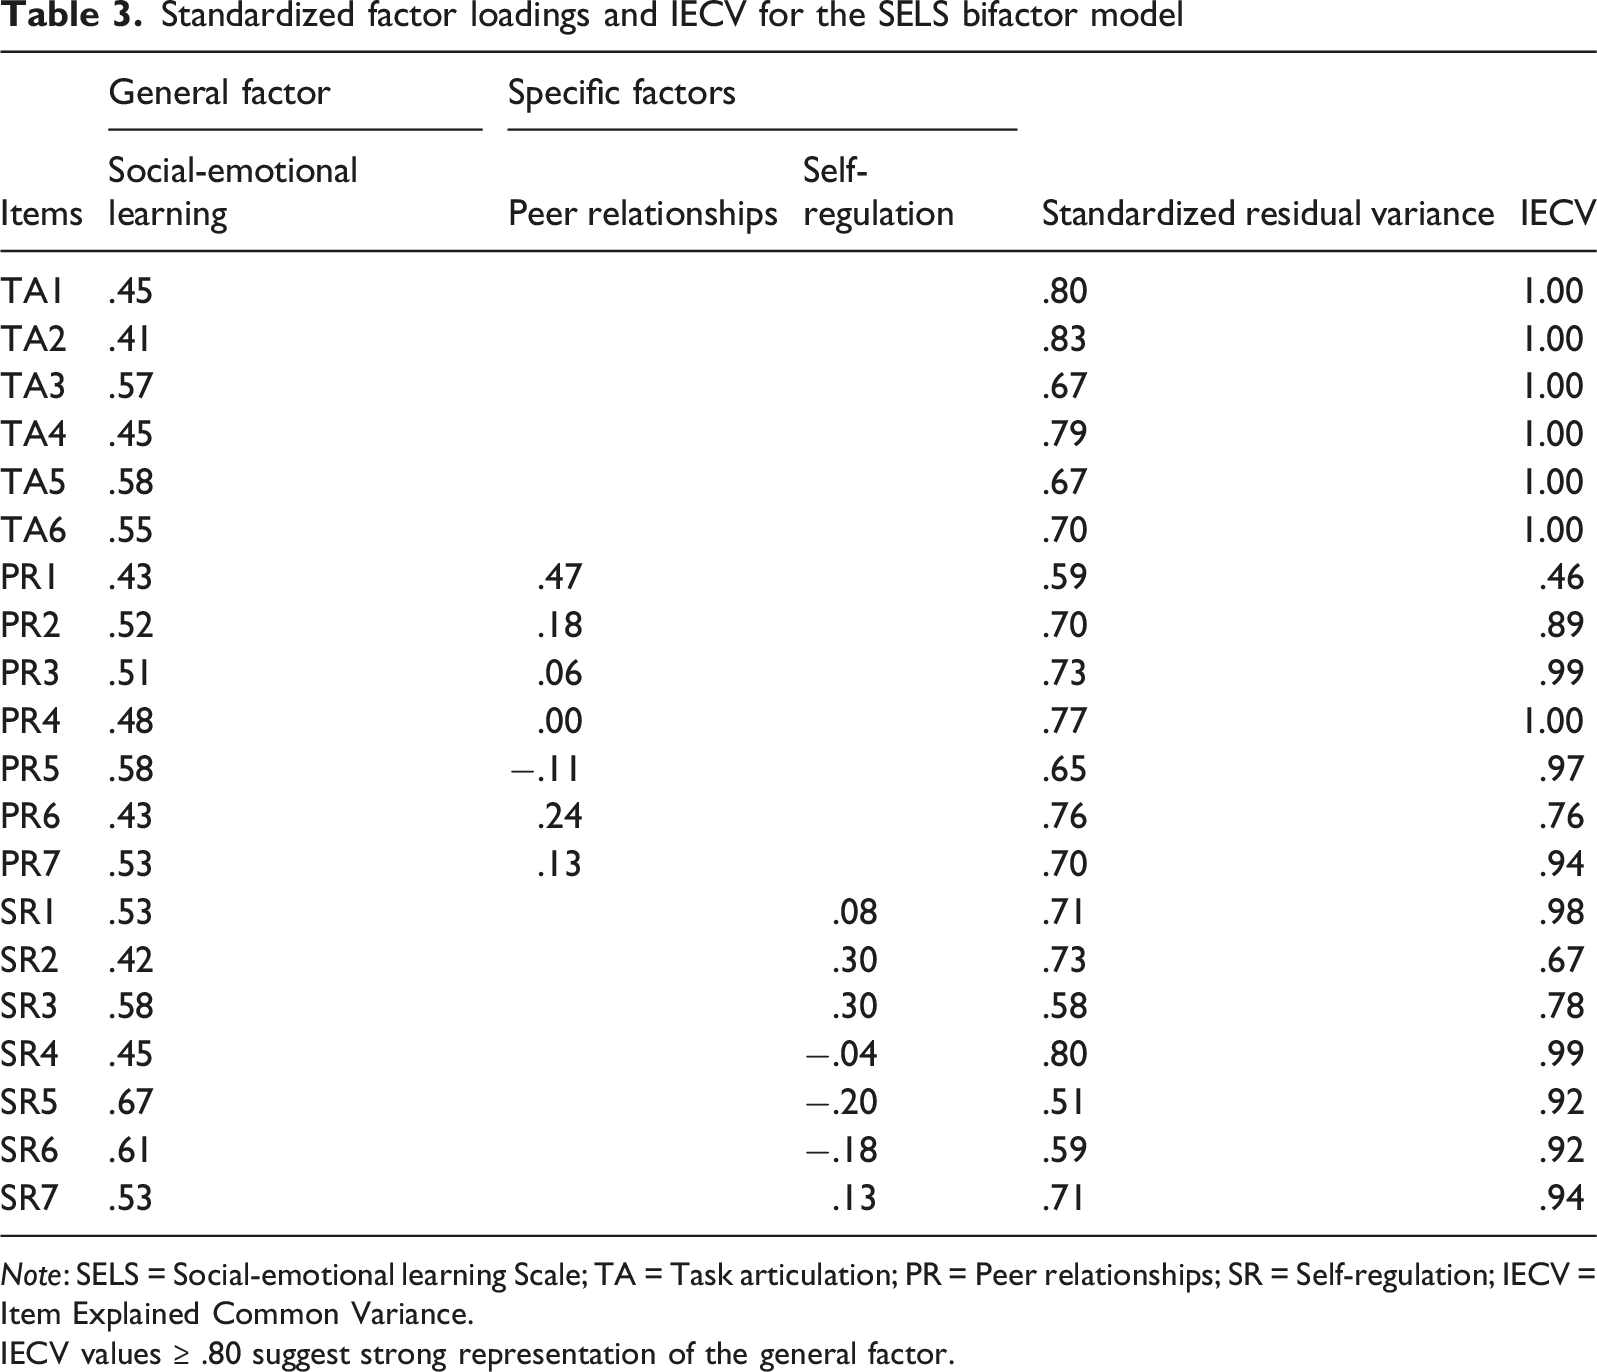
Note: SELS = Social-emotional learning Scale; TA = Task articulation; PR = Peer relationships; SR = Self-regulation; IECV = Item Explained Common Variance.
IECV values ≥ .80 suggest strong representation of the general factor.
Item Response Theory
Item Parameter Estimates from Graded Response Model (GRM) for SELS Items
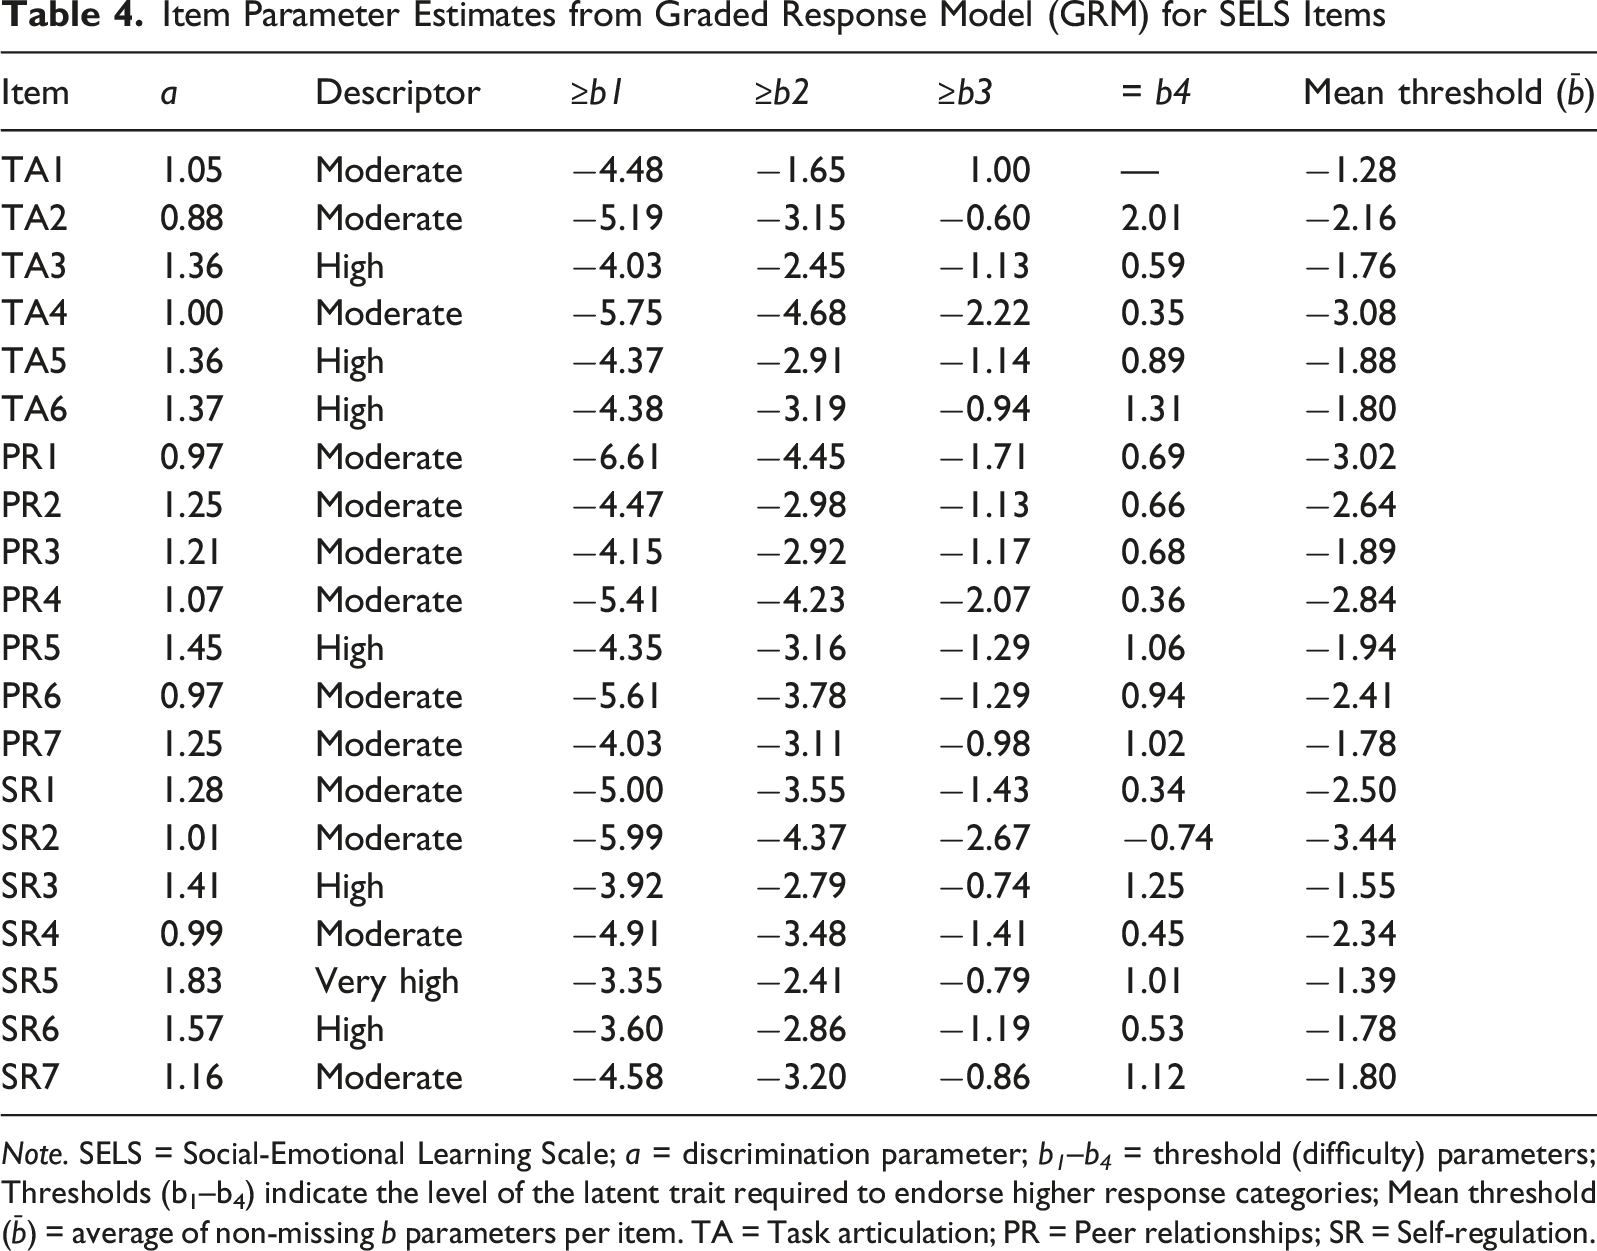
Note. SELS = Social-Emotional Learning Scale; a = discrimination parameter; b 1 –b 4 = threshold (difficulty) parameters; Thresholds (b1–b4) indicate the level of the latent trait required to endorse higher response categories; Mean threshold (b̄) = average of non-missing b parameters per item. TA = Task articulation; PR = Peer relationships; SR = Self-regulation.
In terms of item discrimination, the parameters indicated 11 items were moderate, eight were highly, and one was very highly discriminative. Regarding item difficulty, we found that only two items (items 1 and 18) had a mean beta value that fell within the recommended 0 and |1.5|. The test-information curve (see in Figure 1) shows the SEL scale is most informative between theta levels of around −4 to 2. Test-information curve and Standardized Errors for the Social-emotional Learning Scale items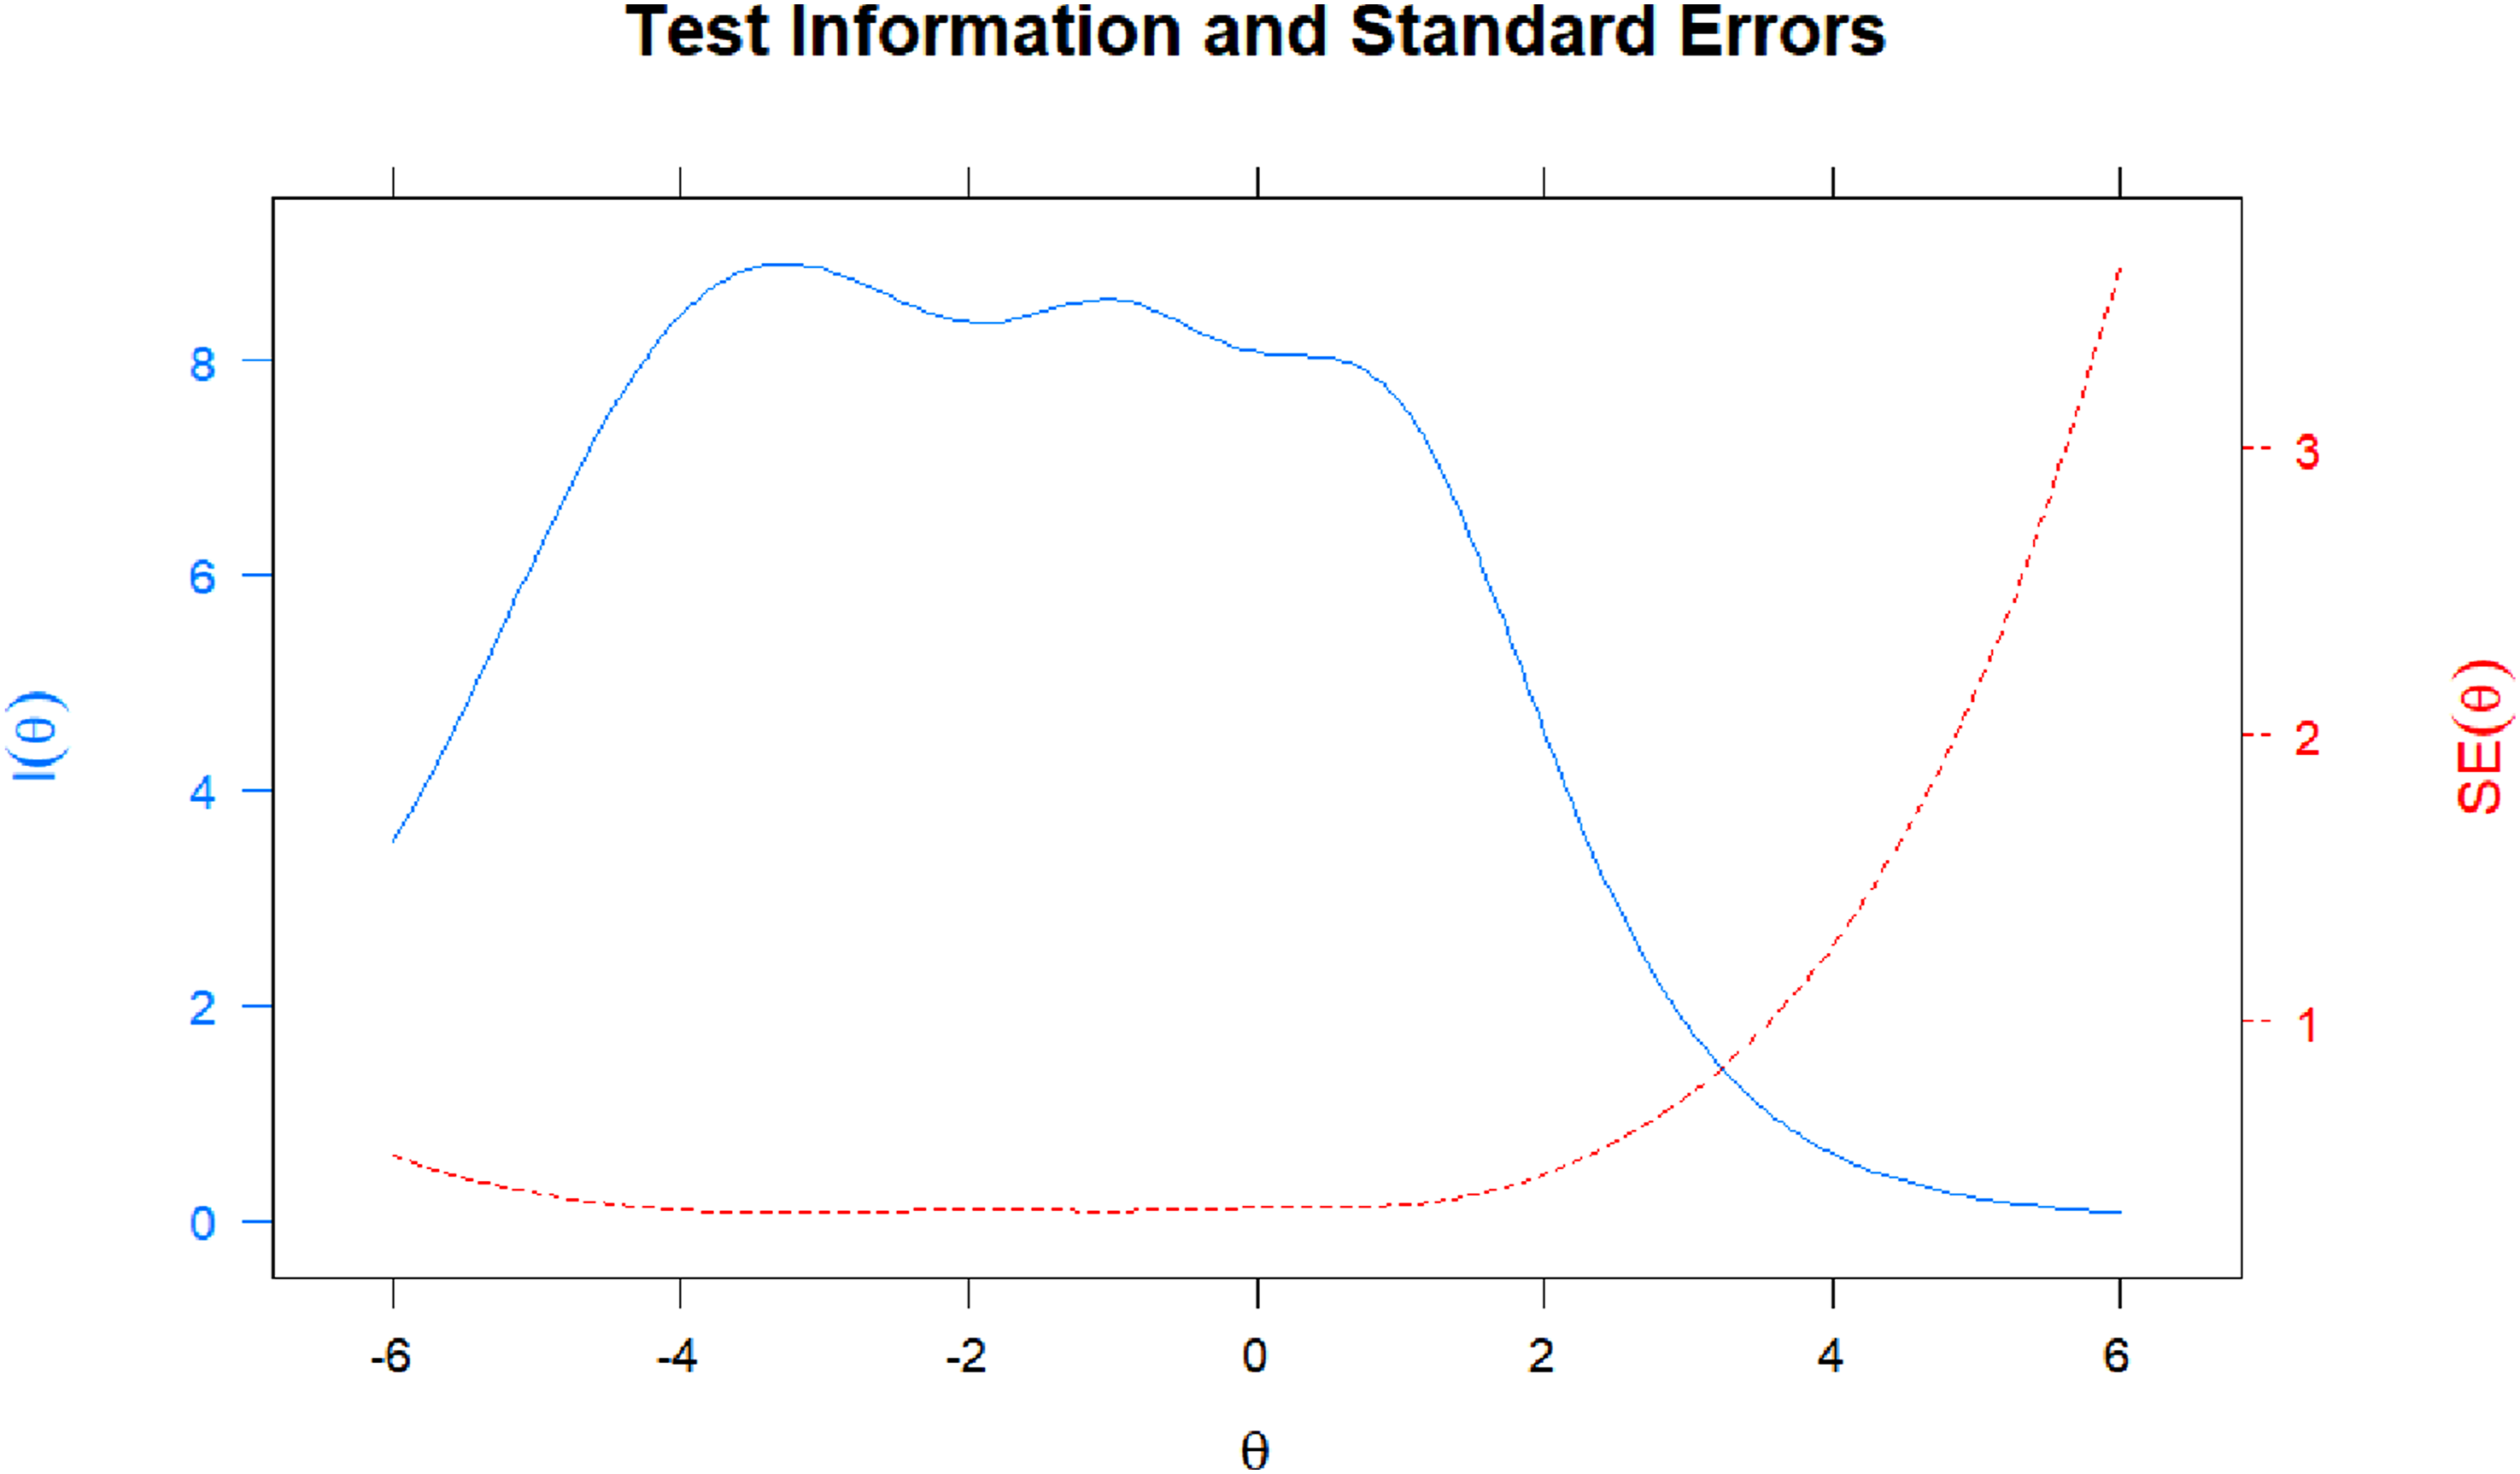
Measurement Invariance
Gender invariance for the SELS unidimensional factor structure
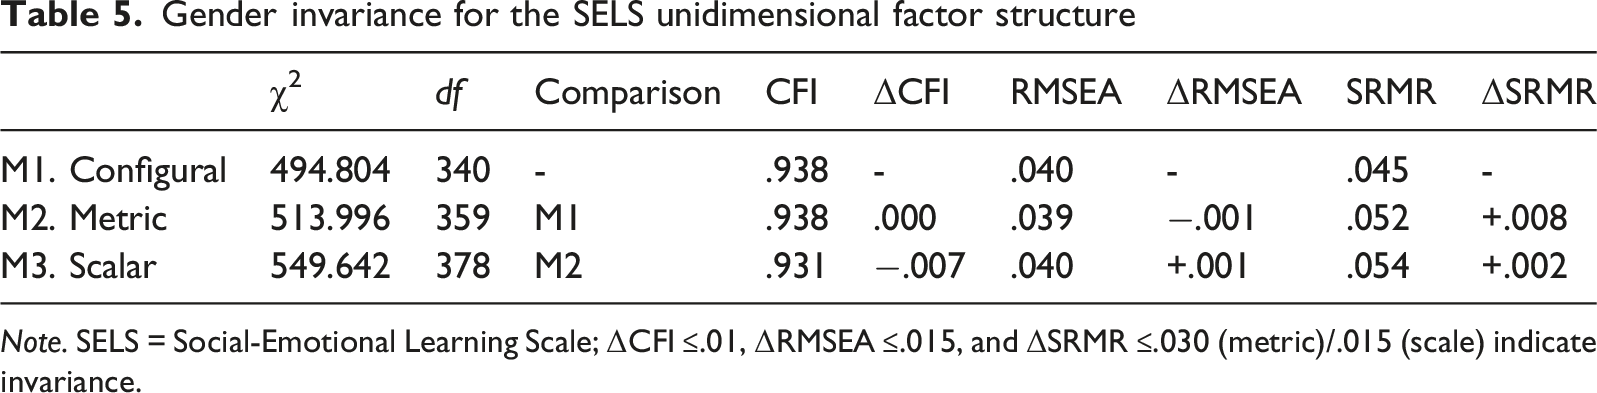
Note. SELS = Social-Emotional Learning Scale; ΔCFI ≤.01, ΔRMSEA ≤.015, and ΔSRMR ≤.030 (metric)/.015 (scale) indicate invariance.
Construct Validity With SWB
Latent factor correlations revealed a pattern of associations between SEL and SWB that supported convergent validity. SELS was positively associated with positive affect (r = .52), negatively with negative affect (r = -.31) and positively associated with affective well-being (r = .46). SELS is also associated with satisfaction with life (r = .62), and every domain of life satisfaction: “myself” (r = .47), “school” (r = .44), “in general” (r = .43), “friends” (r = .41), “family” (r = .38), “where I live” (r = .29). Lastly, higher levels of SEL are associated with higher levels of SWB (r = .59).
Discussion
A consensus has emerged over the last decades about the importance of emotional and social maturation in children and adolescents’ lives, in addition to cognitive development. The educational paradigm is shifting, and SEL is becoming increasingly prominent, driven by the efforts of educators, researchers, and parents pushing for the implementation of SEL programs in schools. One crucial aspect of intervention is the assessment process, which relies on psychological instruments capable of adequately capturing the constructs of interest. As the implementation of SEL programs increases, so does the significance of reliable measurement tools.
Using CASEL’s well established framework, Coryn et al. (2009) developed the SELS, an instrument designed to capture individual differences in five interrelated socio-emotional skills: self-awareness, self-management, social awareness, relationship skills, and responsible decision-making. The dimensionality of the SELS has, however, been put into question, as there is evidence for both a three-factor structure (task articulation, peer relationships, and self-regulation) and a one-factor structure reflecting a broader construct of emotional self-efficacy.
Given the conflicting evidence regarding the structure of the SELS, our first objective was to test the psychometric properties of the SELS in a sample of Portuguese children. Using an SEM approach, we tested various theoretically driven competing structures, including the one-factor model, three-factor, and hierarchical models. Although all models demonstrated acceptable absolute fit, predictive fit indices, latent factor correlations, and discriminant validity diagnostics revealed important differences in model adequacy. Specifically, within the three-factor model, we found extremely high latent factor correlations, low average variance extracted, and very high Heterotrait-Monotrait ratio values, clearly indicating a clear lack of discriminant validity among the three factors. As for the hierarchical, very strong loadings on the higher-order factor indicated very limited unique variance attributable to the lower-order factors. This suggested that the vast majority of variance is most likely explained by a general factor.
To further investigate the dimensionality of the SELS, we tested bifactor structures, starting with a general factor and three specific factors (Task Articulation, Peer relationships, and Self-regulation). The model indicated that all variance within the Task Articulation specific factor was accounted for by the general factor. Thus, a modified bifactor model, excluding Task Articulation as a specific factor, was tested. While this model had a superior fit relative to other competing models, a subsequent examination of bifactor indices indicated that the general factor accounted for the vast majority of shared variance among items. The specific factors, namely, peer relationships and self-regulation, were poorly defined and captured minimal reliable variance beyond the general factor. At both the factor and item levels, indices consistently supported the conclusion that the SELS is essentially unidimensional, and as such, while total scores are reliable, the interpretation of subscale scores are not supported.
Our findings are consistent with previous work, including Thomas et al. (2022), who championed the one-factor model, and tentatively argued that the dimension captured by SELS is “emotional self-efficacy.” Interestingly, other instruments attempting to capture SEL competences have also either failed to replicate the five-factor model (Walton et al., 2023) or also found evidence for a higher-order factor (Ross & Tolan, 2018). Evidence for factor convergence is also common, as indicated by very high correlations between factors (e.g., Fernández-Martín et al., 2022).
Next, a test of measurement invariance across gender fully supported the metric and scalar invariance of the one-factor model. Based on the CFA, bifactor indices, and measurement invariance evidence for unidimensionality, we felt it appropriate to use IRT to test two item properties, discriminability and difficulty. It was generally too “difficult” for respondents to pick the lowest responses, as this implied a particularly low level of social and emotional functioning. Important practical implications can be surmised, as it seems the SELS is better suited for the detection of children with lower levels of social-emotional competences that may benefit from intervention.
Our second objective was to examine the association between the SELS and multiple components of SWB, including positive affect, negative affect, and life satisfaction. The results suggest that children with higher levels of SEL tend to experience fewer negative emotions, and more positive emotions. In addition, there is a preponderance of positive over negative affective experiences (affective well-being) for individuals with higher SEL. At the level of cognitive well-being, perceived socio-emotional competence is very highly associated with perceptions of higher quality of life. Interestingly, while perceived socio-emotional competence is associated with satisfaction in all domains of life tested, the highest effect was for the “myself” domain. The overwhelming majority of students in our study were in the late stage of childhood, on the cusp of reaching adolescence. Erikson (1963) identifies this period as being part of the Industry vs. Inferiority stage of ego development. The child has incorporated certain aspects of the world, as the self-environment interactions - particularly the experiences with attachment figures - have provided a basis for the development of internal working models (Bowlby, 1982; Bretherton & Munholland, 2008). The increase in cognitive abilities, the desire for learning, and the desire for agency, together with an expansion of the social circle, now incorporating both peers as well as non-kin “respected” figures (e.g., teachers), creates an opportunity for growth (Costa et al., 2022, 2025; Inman et al., 2023). School can be seen as a “practice” stage where models of the work-world can be acted out (at a smaller but nonetheless complex scale) and incorporated (Erikson, 1982). Because of this, Erikson et al. (1986) identified “Competence” as the ego strength or virtue that could be gained with the successful resolution of the Industry vs. Inferiority stage. Having acquired a sense of Industry, the child realizes that perseverance and hard-work payoff, that being successful at valued tasks is possible, and that merit is rewarded both at a social (recognition) and a personal level (feelings of “competence”) (Marcia, 2014). Our work supports these assumptions, as perceived social-emotional competence was highly associated with satisfaction with the social elements (friends and family), as well as the “self.” In conclusion, we build upon previous research that has identified perceived social-emotional competence as an important tool facilitating adaptive and positive outcomes in children and adolescents.
Footnotes
Authors Contribution
Pedro Costa: Writing—review and editing, Writing—original draft, Formal analysis, Visualization, and Data curation. Richard Inman: Writing—review and editing, Formal analysis, and Data curation. Paulo Moreira: Conceptualization, Writing—review and editing, Investigation, Funding acquisition, and Supervision.
Funding
The authors disclosed receipt of the following financial support for the research, authorship, and/or publication of this article: This work was supported by Portuguese Funds from the Fundação para a Ciência e Tecnologia (FCT) (Grant No.: PTDC/CED-EDG/31615/2017).
Declaration of Conflicting Interests
The authors declared no potential conflicts of interest with respect to the research, authorship, and/or publication of this article.
Data Availability Statement
The data that support the findings of this study are available on request from the corresponding author, P.A.S.M.
Use of Artificial Intelligence
No generative AI was used in the present paper.