
Abstract
Personalized learning technologies such as automated reading tutors have been proposed as a way to help struggling readers acquire needed skills while simultaneously encouraging engaged, sustained reading of entire books. This article investigates a key step in the development of such technologies: translating an entire novel into a sequence of nonoverlapping reading passages, so that valid feedback about students’ performances can be generated at the end of each tutoring session. A critical reliability issue that may be introduced at this step is identified, an approach for addressing that issue is proposed, and an evaluation conducted with respect to three popular middle-grade novels is presented. The findings suggest that our new approach provides more reliable evidence about students’ abilities and thus may be more appropriate for use when building automated reading tutors.
Educators have long agreed that struggling readers may benefit from daily reading practice accompanied by individualized support (National Institute of Child Health and Development, 2000). Personalized learning technologies such as automated reading tutors (ARTs) have been proposed as a cost-effective method for addressing this need (Kantor et al., 2012; Li, Deng, Ju, & Acero, 2008; Mostow, Nelson-Taylor, & Beck, 2013; Proenca et al., 2017). Instruction that encourages engaged, sustained reading of entire books has also been identified as a critical component of a successful reading intervention. Recently, Beigman Klebanov, Loukina, Sabatini, and O’Reilly (2017) proposed an ART designed to address each of these goals simultaneously. This new application is structured such that students and an automated companion take turns reading the successive passages of a novel aloud, and a module powered by an automated speech recognition engine provides feedback about students’ performances at the completion of each tutoring session.
A key engineering challenge presented by this new type of ART involves determining how best to slice an entire novel into a sequence of nonoverlapping chunks so that each resulting chunk permits a valid and reliable assessment of readers’ strengths and weaknesses. Two approaches for addressing this challenge have been proposed.
The first approach is implemented by first specifying a target passage length in words, and then combining successive paragraphs, as needed, until the difference between the actual and targeted numbers of words in each resulting passage is as small as possible (Beigman Klebanov et al., 2017; Loukina, Beigman Klebanov, Sabatini, & O’Reilly, 2017). Three characteristics of this algorithm are that (a) all passages include approximately the same number of words, (b) paragraph breaks are preserved, and (c) each word in the novel appears in exactly one passage.
A modified version of the Beigman Klebanov slicing algorithm has also been proposed (Loukina, Liceralde, & Beigman Klebanov, 2018). This revised algorithm is similar to the original algorithm in one key respect: All passages include approximately the same number of words. But an important difference is also present: Since the algorithm seeks to preserve both paragraph breaks and chapter breaks, some end-of-chapter paragraphs are not included in any passage (p. 2146).
The comprehension challenges presented within passages selected for use on different types of reading assessments are routinely evaluated using one or both of two approaches: (a) generating passage difficulty estimates by applying a readability metric and (b) generating passage difficulty estimates by examining reading rates collected from a sample of readers. Since more difficult passages tend to yield higher readability scores and slower reading rates, estimates generated by these two approaches are typically negatively correlated.
Both Beigman Klebanov et al. (2017) and Loukina et al. (2018) applied each of these two approaches to passages created by their respective slicing algorithms. Contrary to expectation, however, the resulting pairs of comprehension difficulty estimates were not negatively correlated. Further, while both groups of researchers noted that their findings were strongly at odds with expectation, an investigation of possible explanatory factors was not included in either study. This article addresses that gap.
Our decision to take a second look at the unexpected findings reported in recent research was influenced by an argument that is frequently made by reading researchers: The claim that a clear understanding of the sources of comprehension difficulty in a passage is a crucial first step in the development of valid and reliable evidence about readers’ strengths and weaknesses (Gorin, 2007; Sheehan, 1997; Sheehan & Ginther, 2001). Consistent with this view, we present an investigation of possible explanatory factors so that future research can benefit from a clearer understanding of the comprehension challenges that readers may encounter when attempting to understand passages created by automated slicing algorithms.
Our investigation of possible explanatory factors is implemented in three steps, with each step focused on a distinct research question. First, we consider whether passages created by the currently proposed slicing algorithms differ systematically from the types of passages typically selected by human experts when assembling high-stakes reading assessments. Second, if systematic differences are detected, we consider whether those differences are sufficient to explain the unexpected patterns of variation reported in recent research. Third, we introduce a modified slicing algorithm and consider whether passages created by that new algorithm are more appropriately structured for use when collecting evidence about readers’ abilities. Additional information about these three investigations and about the findings obtained at each stage of the analysis is presented later, after a review of relevant prior research.
Literature Review
Approaches for Generating Valid Feedback About Students’ Abilities
The evidence-centered design framework is frequently employed when developing new educational applications (Mislevy, Almong, & Lukas, 2003). This framework holds that each new educational task is best viewed as a vehicle for collecting evidence about students’ abilities relative to the proficiency construct of interest. When applications are designed to measure students’ reading abilities and the successive sections of a novel are employed as assessment stimuli, the evidence-centered design framework suggests that each successive passage should be structured to permit a reliable estimate of comprehension difficulty, so that evidence about students’ abilities can be properly interpreted.
Two types of evidence are frequently considered when assessing the comprehension challenges presented within a passage: (a) evidence developed from the observable features of text, as summarized within a readability metric and (b) evidence developed from reading rates collected from a sample of readers. Research focused on each approach is summarized here.
Evidence From Readability Metrics
Readability metrics are increasingly being used by teachers, textbook publishers, assessment developers, and product designers when selecting texts for use in instruction and assessment. Recent policy initiatives such as the adoption of the Common Core State Standards (Common Core State Standards Initiative, 2010) in many U.S. states have been cited as contributing to this increase (Fisher, Fry, & Lapp, 2012; Hiebert & Mesmer, 2013; Nelson, Perfetti, Liben, & Liben, 2012). These new standards require that students read increasingly complex texts as they progress through school so that all students have the time and opportunity to develop the advanced reading skills needed for success in college and careers.
Many current-day readability metrics measure multiple dimensions of comprehension difficulty (Deane, Sheehan, Sabatini, Futagi, & Kostin, 2006; Graesser, McNamara, & Kulikowich, 2011; Sheehan, Kostin, Napolitano, & Flor, 2014) using a combination of word-based (WB) features and sentence-based (SB) features. WB features are implemented by first assigning a score to each individual word in a passage, and then averaging over the resulting word-level scores to provide a passage-level score that represents the targeted dimension of variation in the text as a whole. Sample features implemented in this fashion include (a) measures of vocabulary difficulty such as average word length (Kincaid, Fishburne, Rogers, & Chissom, 1975), average word frequency (Stenner, Burdick, Sanford, & Burdick, 2006), average age of acquisition (Brysbaert & Biemiller, 2017), and the ratio of academic words to total words (Vajjala & Meurers, 2012); (b) measures of concreteness such as the ratings collected by Coltheart (1981); (c) measures of cohesion such as the frequency of causal, logical, and temporal connectives (Graesser et al., 2011); and (d) measures of narrativity such as the frequency of personal pronouns (Biber et al., 2004) and the proportion of words enclosed in quotes (Sheehan, Flor, & Napolitano, 2013).
By contrast, features designed to assess levels of syntactic complexity are most frequently implemented via a SB strategy. In this alternative approach, a complexity score is assigned to each sentence in a text, and resulting sentence-level scores are then averaged to obtain a passage-level score that represents the level of syntactic complexity in the text as a whole. Features implemented via this alternative approach include traditional measures such as the average number of words in a sentence, as well as more sophisticated measures such as the average number of verb phrases per sentence (Pitler & Nenkova, 2008), the average number of dependent clauses per sentence (Sheehan et al., 2014), and the average level of embedding (Yngve, 1960).
Standard approaches for assessing the degrees of freedom associated with resulting measures highlight an important difference: When comprehension difficulty is estimated from WB features, the degrees of freedom associated with each resulting estimate are determined from the number of words in a text, but when comprehension difficulty is estimated from SB features, the degrees of freedom associated with each resulting estimate are determined from the number of sentences in a text.
Despite these differences, the amount of text needed to generate a reliable estimate of comprehension difficulty is typically specified in terms of the number of words in a text. For example, one long-standing rule-of-thumb holds that readability measures may become unreliable whenever passages contain fewer than 100 words (Fry, 1990; Kidwell, Lebanon, & Collins-Thompson, 2010). WB rules with higher threshold values have also been specified. For example, the developers of the degrees of reading power (DRP) metric (Carver, 1995) proposed a slightly higher limit of 125 words, and the developers of the Coh-Metrix system (Graesser et al., 2011) proposed an even higher limit of 200 words (Nelson et al., 2012).
Evidence From Observed Reading Rates
Early research focused on the use of observed reading rates as indicators of passage difficulty is reported in Rasch (1960). This research demonstrated that students tend to slow down when reading more difficult passages and speed up when reading less difficult passages. Similar findings are reported in Compton, Appelton, and Hosp (2004) and in Denton et al. (2011).
Beigman Klebanov et al. (2017) examined reading rates collected from each of 30 students as they read each of three passages selected from a corpus created by slicing a single novel (J. K. Rowling’s Harry Potter and the Sorcerer’s Stone) into a sequence of nonoverlapping passages. The three passages were selected such that one had a low readability score (indicating a low level of comprehension difficulty), one had a moderate readability score (indicating a moderate level of comprehension difficulty), and one had a high readability score (indicating a high level of comprehension difficulty). As expected, the single passage with a high readability score was read most slowly.
Contrary to expectation, however, the single passage with a low readability score was not read most quickly. Rather, it yielded the second fastest reading rate, not the fastest. Beigman Klebanov and her colleagues argued that this one-text discrepancy constituted “a dramatic mis-alignment” (p. 27) and concluded that “substantial variation in reading rates may be unrelated to comprehension complexity of the texts” (p. 30).
Reading rates collected in the context of a single-novel ART are also examined in Loukina et al. (2018). In this follow-up study, reading rates were collected from each of two adult narrators as they read a sliced version of the same Harry Potter novel. The authors justified this approach as follows: “While we do not expect either of the narrators to experience any reading comprehension difficulties, one might reasonably assume that a skilled narrator would slow down on fragments which are harder for the listener to comprehend” (p. 2147). Contrary to expectation, however, both narrators tended to slow down when reading passages with lower readability scores (indicating less difficulty) and speed up when reading passages with higher readability scores (indicating more difficulty). No explanation for this unexpected finding was provided.
Data and Methodology
Corpora
Four corpora encompassing more than 1,000 reading passages were assembled. The first three corpora were generated by slicing each of three novels into sequences of nonoverlapping reading passages. The selected novels included two classics, Alice’s Adventures in Wonderland (AW) and The Adventures of Tom Sawyer (TS), and one more recent selection: J. K Rowlings’s Harry Potter and the Sorcerer’s Stone (HP). All three novels are typically read by students in middle to upper elementary grades.
Individual reading passages were either obtained or created as follows. First, we obtained a copy of the sliced version of the HP novel created by Beigman Klebanov et al. (2017). This version represents each word in the novel within a collection of 318 nonoverlapping passages created such that each passage includes approximately 250 words. Next, we developed a similar slicing algorithm and used it to translate the AW and TS novels into similar sequences of nonoverlapping reading passages.
A corpus of passages selected from high-stakes state reading assessments targeted at students in Grades 3 through 8 was also assembled. Two relevant characteristics of this additional corpus are that (a) each passage had been selected by a human expert to provide evidence about students’ performances relative to the reading skills specified in state standards and (b) analyses implemented with respect to item responses collected from thousands of students had confirmed that each passage provides useful evidence about students’ reading abilities.
Investigations
Three investigations were conducted, one focused on each of the three research questions listed earlier. First, difficulty-relevant characteristics of the passages in each of our four corpora are examined, and characteristics that distinguish passages created by automated WB slicing algorithms are identified. Next, two impacts of the identified distinguishing characteristics are examined: impacts on passage readability scores and impacts on students’ observed reading rates. Finally, a slicing algorithm designed to yield passages that provide more reliable evidence about readers’ abilities is proposed, and passages created by that algorithm are examined.
Results
Characteristics of Passages Created by WB Slicing Algorithms
Distribution of Passage Lengths in Each of Four Corpora.
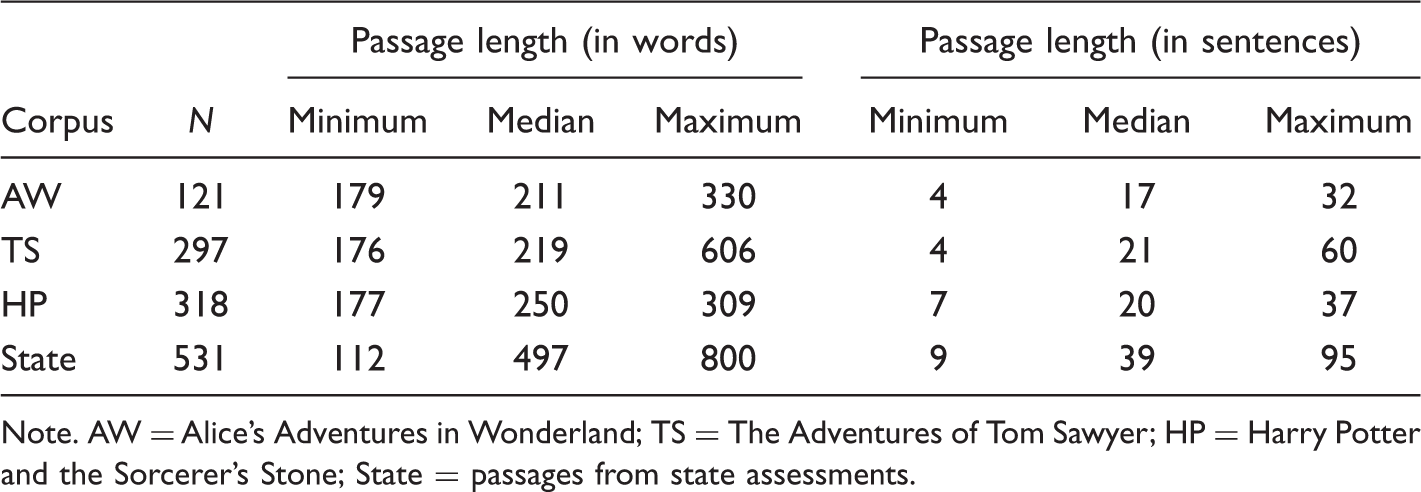
Note. AW = Alice’s Adventures in Wonderland; TS = The Adventures of Tom Sawyer; HP = Harry Potter and the Sorcerer’s Stone; State = passages from state assessments.
Figure 1 illustrates how the number of sentences in a passage varies as a function of average sentence length (ASL) within each of our four corpora. Two patterns are illustrated. The lower triangular pattern exhibited by the 531 passages in the State Corpus (see plot at upper left) reflects a restriction that is true for all texts: The number of sentences in a text is always less than the number of words. By contrast, the alternative patterns in the AW, TS, and HP corpora reflect a restriction that is only present when passages are constrained to include approximately equal numbers of words: Passages with shorter sentences necessarily include more sentences, and passages with longer sentences necessarily include fewer sentences.
Relationship between average sentence length (in words) and the number of sentences in a passage, when passages are selected by human experts (top left), and when passages are created by applying the Beigman Klebanov slicing algorithm to each of three different novels: Alice’s Adventures in Wonderland (top, right), the Adventures of Tom Sawyer (bottom, left), and Harry Potter and the Sorcerer’s Stone (bottom, right).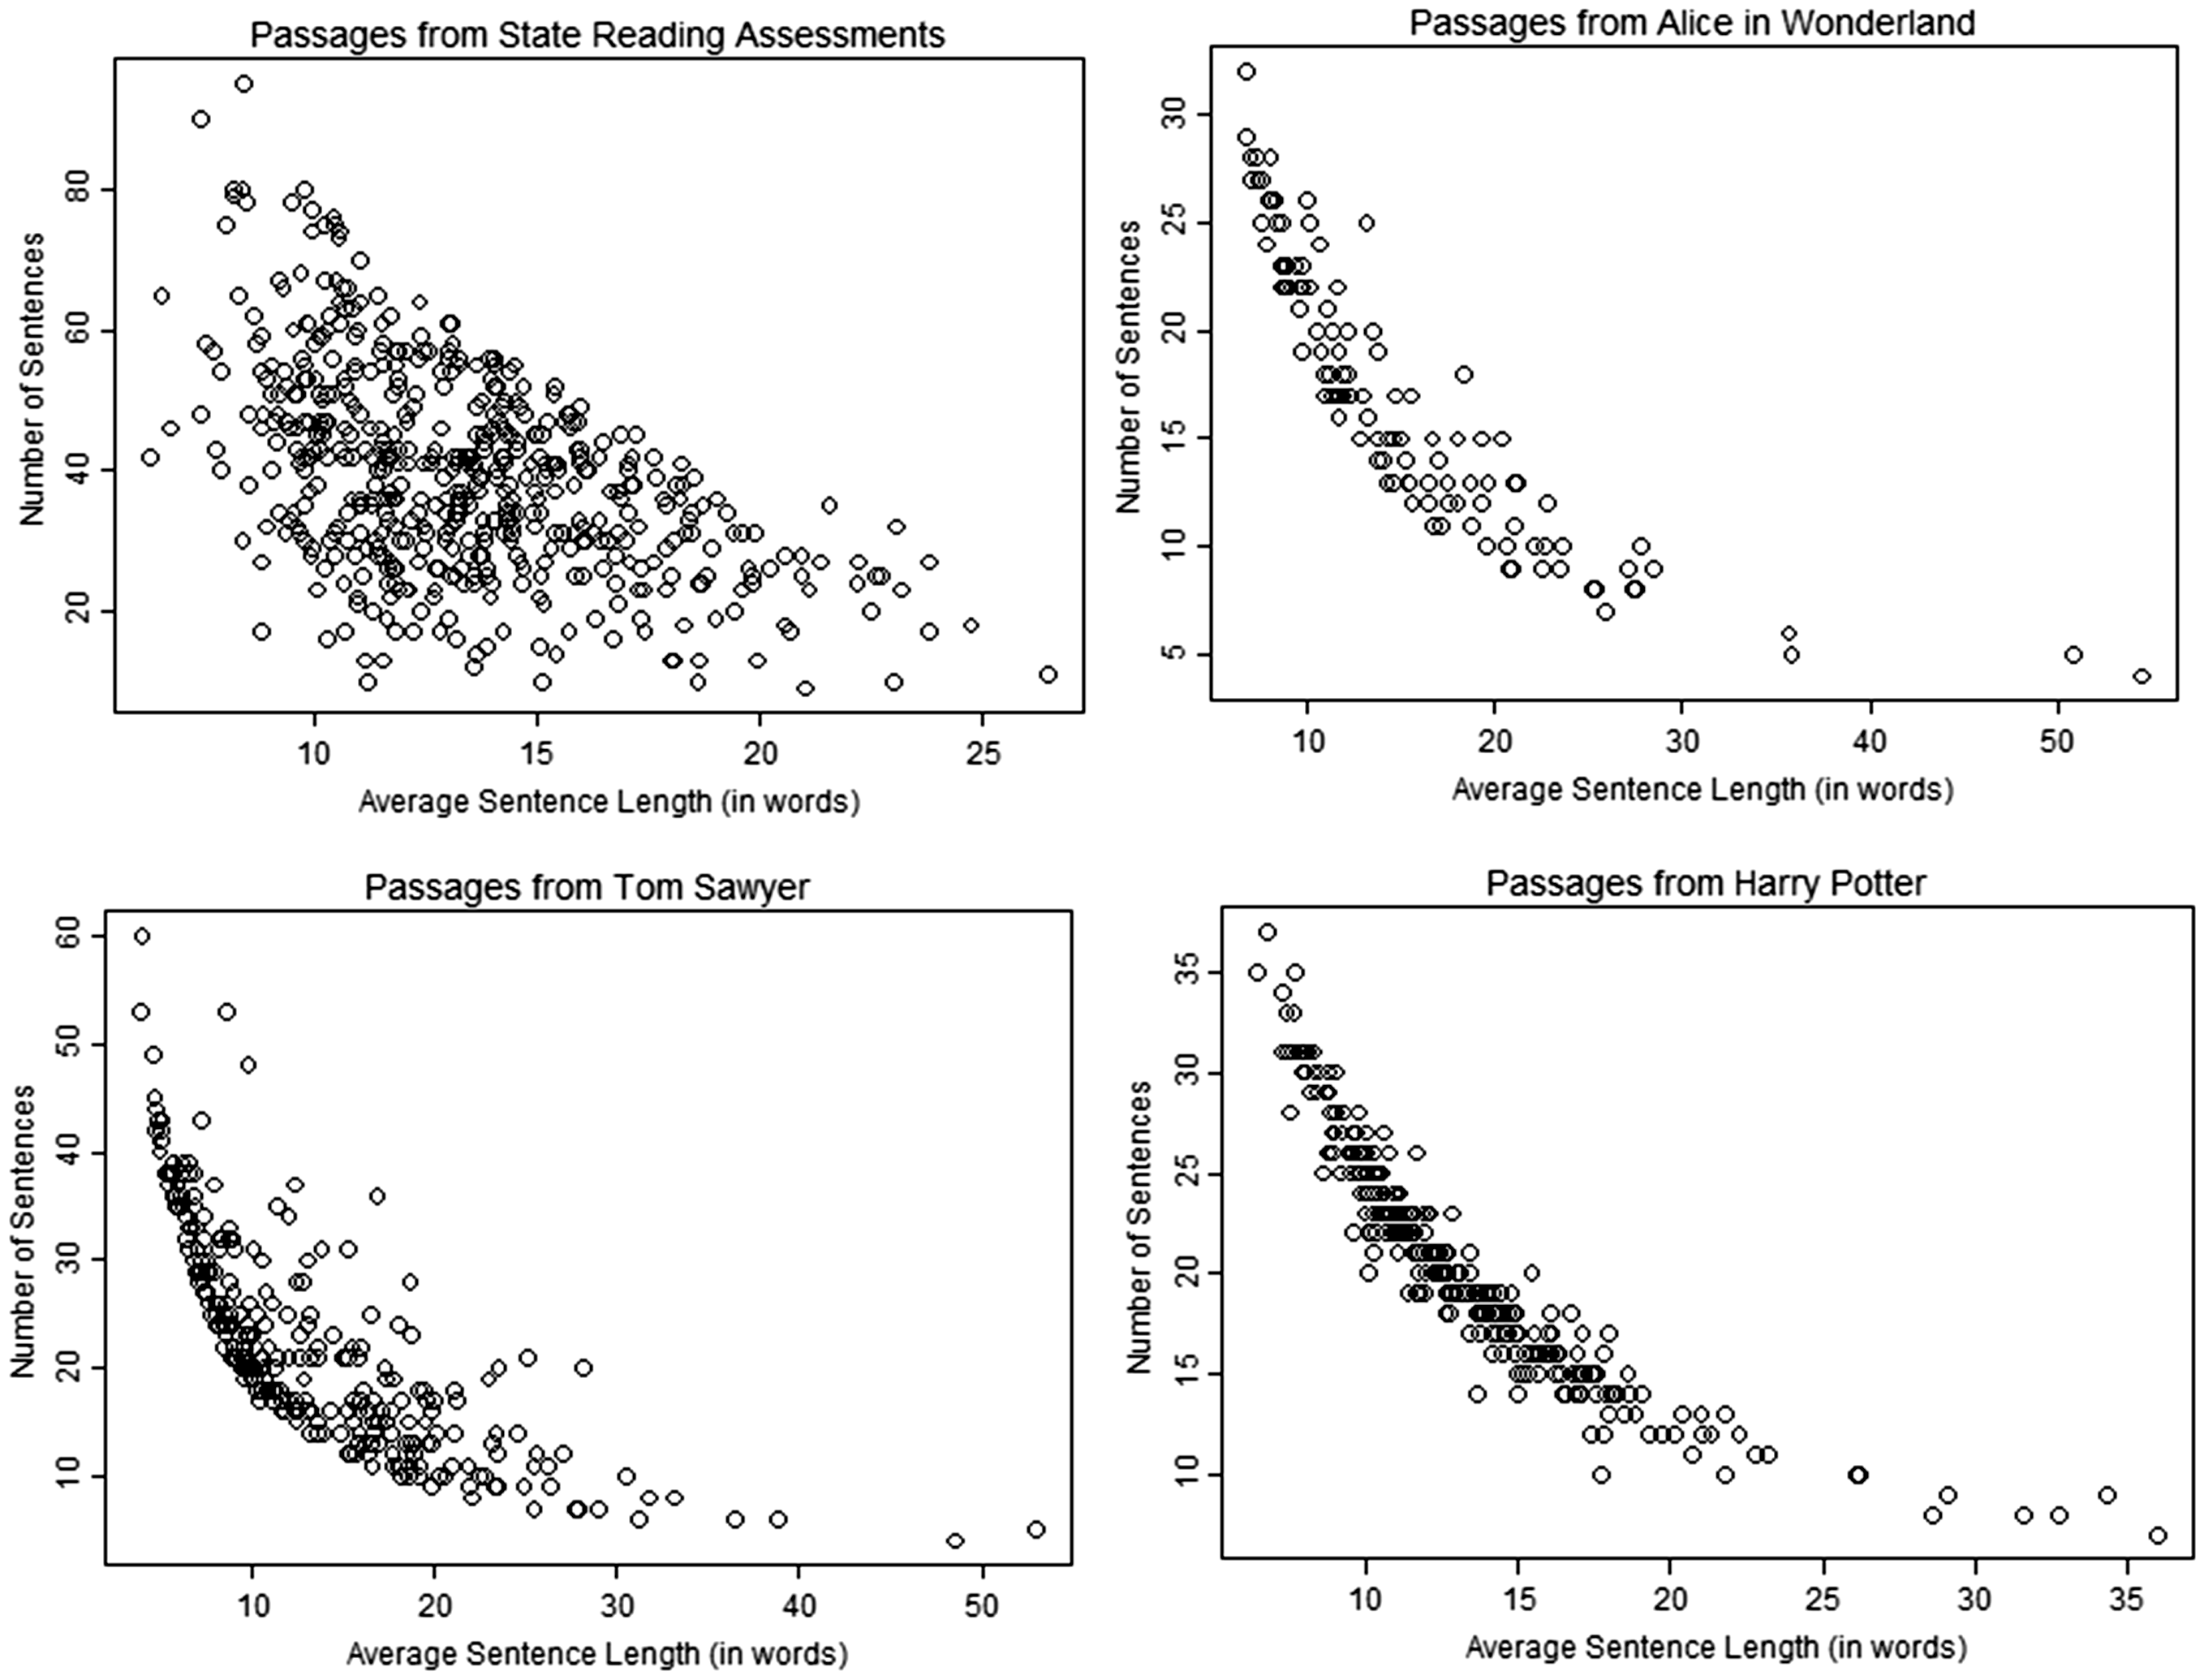
These patterns suggest that passages created by WB slicing algorithms tend to exhibit two unusual characteristics: (a) ASL scores that span an atypically wide range and (b) per passage sentence counts that also span an atypically wide range. Key consequences of these characteristics are highlighted in the following paragraphs.
Consequence 1: Readability Scores Are More Variable
Readability scores were generated for each of the passages in the AW, TS, and HP corpora using each of two well-known readability metrics: the Flesch–Kincaid metric (FK; Kincaid et al., 1975) and the TextEvaluator metric (TE; Napolitano, Sheehan, & Mundkowski, 2015; Sheehan et al., 2014). Both metrics are routinely used by professional assessment developers when selecting passages for use on high-stakes reading assessments (Nelson et al., 2012; Sheehan et al., 2014).
Findings are illustrated in Figure 2. The figure traces text complexity variation across the successive passages of each novel, as determined by the FK metric (left) and the TE metric (right). Both sets of scores are reported on a grade level (GL) scale. Note that, while both metrics yielded a number of outliers, outlying scores generated by the FK metric are more extreme compared with those generated by the TE metric. For example, the FK analysis of the passages in the HP corpus yielded a total of 7 scores that were more 6 GLs above the median. By contrast, the same passages analyzed using TE did not yield any scores that were more than 6 GLs above the median.
Text complexity variation across successive passages measured using FK (left) and TE (right) for passages from three different novels, where AW = Alice’s Adventures in Wonderland, TS = The Adventures of Tom Sawyer, and HP = Harry Potter and the Sorcerer’s Stone.
Differences in the number and type of outliers generated by the FK metric, compared with those generated by the TE metric, may be due to the larger weight assigned to the ASL feature within the FK model, where ASL is one of just two features, compared with the TE model, where ASL in 1 of nearly 50 features (Sheehan et al., 2014). This difference suggests that extreme values of the ASL feature can have a large impact on the validity of subsequent inferences, including inferences about passage difficulty and inferences about readers’ abilities.
Consequence 2: Students’ Reading Rates Are Subject to a New Source of Variation
Average Words Correct Per Minute Scores Collected for Three Passages Selected to Represent Passages With Low, Moderate, and High TextEvaluator Scores.
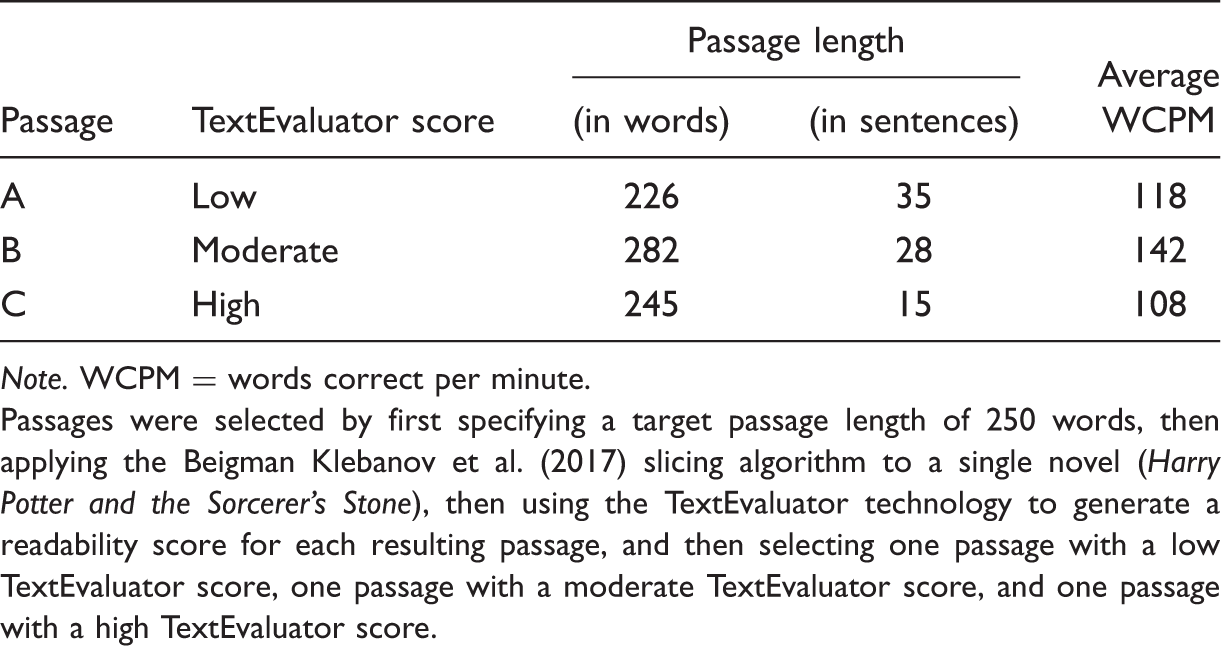
Note. WCPM = words correct per minute.
Passages were selected by first specifying a target passage length of 250 words, then applying the Beigman Klebanov et al. (2017) slicing algorithm to a single novel (Harry Potter and the Sorcerer’s Stone), then using the TextEvaluator technology to generate a readability score for each resulting passage, and then selecting one passage with a low TextEvaluator score, one passage with a moderate TextEvaluator score, and one passage with a high TextEvaluator score.
The data in Table 2 were then used to evaluate two predictions. First, since Passage C had the highest readability score (indicating a high level of comprehension difficulty), the authors predicted that it would yield the lowest WCPM score. As is shown in Table 2, the observed WCPM score for Passage C is consistent with this prediction.
Second, since Passage A had the lowest readability score (indicating the lowest level of comprehension difficulty), the authors predicted that it would be read most quickly, thereby yielding the largest WCPM score. As is shown in Table 2, however, the average WCPM score for Passage A was the second largest, not the largest as had been expected. Beigman Klebanov et al. (2017) cited this one text discrepancy as justification for their claim that “substantial variation in reading rates may be unrelated to comprehension complexity of the texts” (p. 30).
We present an alternative explanation for this finding. To understand this explanation, it is important to note that previous research focused on the relationship between students’ observed reading rates and comprehension difficulty considered passages selected from different source documents that, for the most part, included similar numbers of sentences, thereby allowing students’ observed reading rates to be studied without having to also account for a key nuisance variable: the required number of between-sentence pauses. As is indicated in Table 2, however, the three passages selected by Beigman Klebanov and her colleagues were not consistent with this practice. Rather, the selected passages included substantially different numbers of sentences, thereby requiring substantially different numbers of between-sentence pauses.
For example, the number of sentences in Passage A is more than twice the number in Passage C (35 vs. 15). Since each additional sentence requires an additional end-of-sentence pause, the fact that this particular nuisance variable was not controlled may explain why the WCPM score observed for Passage A was lower than expected. Note that this explanation leaves open the possibility that substantial variation in students’ observed reading rates is related to comprehension complexity of the texts.
When considering the data in Table 2, it is also important to remember that the unusual structure exhibited by Passage A is due, in part, to the method used to slice J. K. Rowling’s novel into a sequence of nonoverlapping reading passages. An alternative slicing algorithm designed to be more effective at addressing variation due to the number of sentences in a passage, and therefore, the required number of between-sentence pauses, is introduced later.
Consequence 3: Adults’ Reading Rates Are Subject to a New Source of Variation
Loukina et al. (2018) hypothesized that professional narrators would slow down when reading more complex passages (as determined by a readability metric) and speed up when reading less complex passages. Contrary to this hypothesis, however, reading rates collected from each of two professional narrators as they read a sliced version of the HP novel confirmed that both narrators tended to speed up when reading more complex passages and slow down when reading less complex passages (p. 2147).
While Loukina et al. (2018) offered no explanation for this unexpected finding, a plausible explanation is readily available: Because the slicing algorithm used to construct each passage targeted a specific number of words while ignoring large differences in numbers of sentences, the resulting passages were structured such that (a) the most complex passages (i.e., those with the longest sentences) necessarily included the least number of sentences, so required the fewest number of between-sentence pauses and (b) the least complex passages (i.e., those with the shortest sentences) necessarily included the most sentences, so required the largest number of between-sentence pauses. Consequently, the most complex passages were read most quickly, not least quickly, as had been expected.
Characteristics of Passages Created by a Sentence-Based Slicing Algorithm
The analyses summarized earlier highlighted two types of passages that may not provide reliable evidence about students’ abilities: (a) passages that include a nearly unbroken sequence of extremely short sentences and (b) passages that include a nearly unbroken sequence of extremely long sentences.
A slicing algorithm designed to reduce the probability of generating passages with these types of potentially problematic characteristics was developed as follows. First, a target number of sentences is specified. Next, a provisional passage comprised of a single paragraph is created, and successive paragraphs are added or subtracted, as needed, until discrepancies between the observed and targeted numbers of sentences are as small as possible.
Distribution of Critical Text Features for Passages Created by Each of Three Slicing Algorithms.
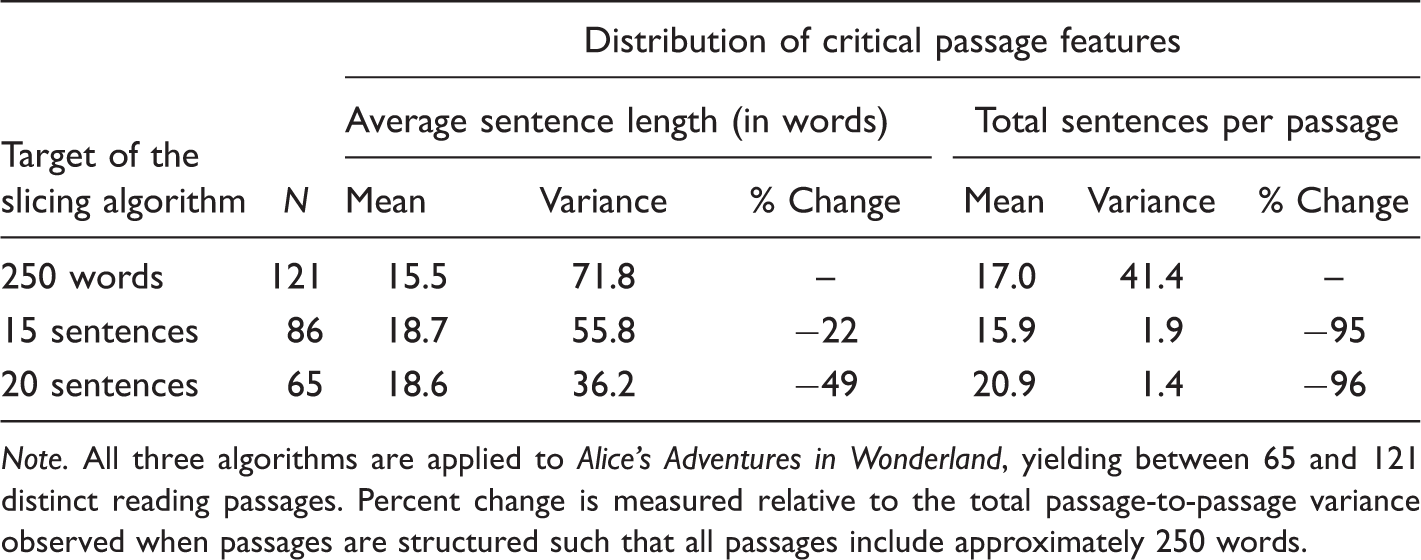
Note. All three algorithms are applied to Alice’s Adventures in Wonderland, yielding between 65 and 121 distinct reading passages. Percent change is measured relative to the total passage-to-passage variance observed when passages are structured such that all passages include approximately 250 words.
Conclusions
Over the years, researchers and assessment developers have developed an array of procedures for examining the sources of comprehension difficulty presented within reading passages selected for use on reading assessments. As has been indicated earlier, however, the applicability of these approaches in the special case of assessments created by WB slicing algorithms has been questioned. This study examined the underlying causes of the observed discrepancies so that subsequent impacts on measurement quality can be more clearly understood. Key conclusions are summarized below.
Limitations of WB Slicing Algorithms
Two approaches for slicing an entire novel into a sequence of nonoverlapping reading passages were examined: WB approaches, that is, approaches constructed such that all passages include approximately the same number of words and (b) SB approaches, that is, approaches constructed such that all passages include approximately the same number of sentences.
Findings highlighted a key limitation of WB slicing algorithms—the tendency to create two types of highly unusual passages: (a) passages that include a nearly unbroken sequence of extremely short sentences and (b) passages that include a nearly unbroken sequence of extremely long sentences.
Both types of passages may yield unreliable estimates of comprehension difficulty, but for different reasons. Passages that include a nearly unbroken sequence of extremely short sentences may yield comprehension difficulty estimates that are too high whenever predictor variables are based on students’ observed reading rates, and prediction equations have not been updated to account for the additional time needed to generate required between-sentence pauses.
By contrast, passages that include a nearly unbroken sequence of extremely long sentences may yield comprehension difficulty estimates that are too high whenever predictor variables are based on text complexity estimates generated by a readability metric since many existing metrics have been trained on reading passages that include a mixture of shorter and longer sentences, the pattern that occurs most frequently in well-written text.
Advantages of SB Slicing Algorithms
A slicing algorithm constructed such that all passages include approximately the same number of sentences was also evaluated. This new algorithm yielded fewer passages with extreme values of critical text features and, consequently, may be more appropriate for use when building new tutoring applications.
While the current findings suggest that algorithms that target a particular number of sentences, rather than a particular number of words, may be more appropriate for use when generating feedback about readers’ abilities, algorithms that simultaneously minimize deviations from a targeted number of sentences and deviations from a targeted number of words should also be investigated.
Passage Length Guidelines That Incorporate Multiple Aspects of Text Variation
Existing guidelines for the amount of text needed to generate a reliable estimate of comprehension difficulty are typically specified as a minimum passage length in words. This study has demonstrated, however, that passages comprised of a small number of extremely long sentences may yield unreliable evidence about comprehension difficulty even when WB reliability criteria have been satisfied. This suggests that reliability guidelines that specify a minimum number of sentences, in addition to a minimum number of words, may be more appropriate for use when building ARTs designed to provide valid and reliable feedback about readers’ abilities.
Discussion
Research findings that are strongly at odds with expectation are not unheard of in analyses of assessment data. Zwick (1991) investigated one highly publicized example: The dramatic decline in reading scores observed in the 1986 National Assessment of Educational Progress. Since it was unlikely that such a large decline in reading ability could have taken place in such a short amount of time, the suspect scores were not reported, and an analysis of alternative explanations was conducted. Findings confirmed that a significant proportion of the observed decline was not due to changes in students’ abilities. Rather, small changes in the assessment booklets, combined with small changes in the analysis procedures, were identified as the most likely cause of the observed decline.
This article followed a similar investigative arc. First, assessment results that were strongly at odds with expectation were observed (i.e., reading rates that failed to align with passage readability scores). Second, a dramatic change in the assessment procedure (i.e., the algorithm used to create individual reading passages) was identified as the most likely cause of the observed discrepancies. Subsequent analyses yielded new information about the text characteristics that should be considered when slicing an entire novel into a sequence of reading passages.
Our analysis of alternative slicing algorithms also yielded new information about a number of related measurement issues. These issues are discussed below.
Selecting Experimental Units That Are More Representative of Targeted Populations
Beigman Klebanov et al. (2017) concluded that “a state-of-the-art measure of comprehension complexity does not predict reading rates well” (p. 30) after analyzing reading rates collected for a total of three texts. While such small samples may occasionally yield useful evidence, the preceding analyses have confirmed that one of the sampled passages included an unusual arrangement of features, thereby reducing its utility as a representative of the targeted population of texts. Graphical displays such as those presented in Figure 1 may help researchers detect such sampling anomalies in future research.
Limiting the Impact of Unmeasured Variables
Coe (2009) demonstrated that unmeasured variables often play an important, yet unacknowledged role in analyses of educationally relevant relationships. Our findings suggest that the dramatic mis-alignment reported in Beigman Klebanov et al. (2017) is likely due to an important unmeasured variable: The number of between-sentence pauses that must be generated as each passage is read aloud. Our findings also suggest that algorithms that target a specific number of sentences, rather than a specific number of words are not subject to this limitation since each resulting passage then requires approximately the same number of between-sentence pauses. These findings may help researchers build ARTs that provide more precise measurement of readers’ abilities.
Improving Evaluation Techniques Through Comparisons of Human and Automated Slicing Outcomes
Automated approaches for accomplishing assessment-related tasks are commonly evaluated by considering the extent to which the performance of an automated algorithm agrees with that of a human expert. For example, automated essay graders are routinely evaluated by comparing scores generated by an automated scoring engine to corresponding scores assigned by trained human raters (Shermis & Burstein, 2013). Researchers have also evaluated the performance of automated passage finders (i.e., algorithms that search the web for passages deemed appropriate for use on high-stakes reading assessments) by comparing passage acceptability ratings assigned by an automated algorithm to corresponding ratings assigned by trained human raters (Sheehan, Kostin, & Futagi, 2007).
Analyses summarized earlier suggest that a similar approach may be of use when automated algorithms are trained to slice an entire novel into a sequence of nonoverlapping reading passages. In particular, a strategy of comparing text slices created by proposed algorithms to text slices created by trained human experts could lead to revised slicing algorithms that provide more precise measurement of readers’ abilities.
Footnotes
Acknowledgments
This research builds on earlier analyses completed while both authors were at the Educational Testing Service in Princeton, NJ. The authors are grateful to Beata Beigman Klebanov and Anastassia Loukina for sharing useful data and to three anonymous reviewers for providing helpful comments and suggestions.
Declaration of Conflicting Interests
The authors declared no potential conflicts of interest with respect to the research, authorship, and/or publication of this article.
Funding
The authors received no financial support for the research, authorship, and/or publication of this article.