
Abstract
The increasing presence of technologies at school has triggered a vivid debate on the way ICT influences students’ learning process. Using PISA 2018 data for 15-year-old students and hierarchical linear models, we find an inverted U-shaped relationship between ICT use at school and students’ performance in mathematics in 22 OECD countries. In all cases, the excessive use of technology is associated with a lower academic performance, although this penalty differs across countries, which points to the importance of addressing country-specific analyses. The differentiated profile of those very intensive users, who suffer from above-average bullying exposure, draws into question whether the effect can be deemed as causal. Based on Inverse Probability Weighting techniques, the findings indicate that the very intensive use of ICT at school causes an underperformance of students equivalent to around half an academic course in Estonia, Finland and Spain. The results highlight the need for policy makers and instructors to ensure that the frequent use of ICT at school does not interfere with students’ learning process.
The rapid process of digitalisation has permeated and transformed a number of aspects of citizens’ daily live, from social relationships to labour organisation. The last decade has particularly uncovered that adoption of digital skills is paramount in two key ways. Firstly, because it contributes to enhancing citizen participation due to increasing access to information (Polizzi, 2021). Secondly, because it facilitates the process of reskilling or upskilling in a context where demand for new digital skills has risen steadily. In consolidating the process of digital transformation, education and training play a central role. In this paper, we focus on the role of digital technologies to support the learning process of the youth, the engine behind the future of work.
The integration of digital technology to facilitate students’ learning, also known as educational technology, has the potential to create a powerful and engaging environment for collaborative and creative learning (European Commission, 2020; Rubach & Lazarides, 2021). However, in absence of a well-founded pedagogical strategy, the use of digital technology at school risks that individuals lag behind (Comi et al., 2017), a matter at the forefront of the debate during the closure of educational institutions with the advent of the COVID-19 pandemic (Talib et al., 2021). The past two decades have seen firm attempts by policymakers to reduce the so-called “digital gap” (Szeles, 2018), or the unequal access to Information and Communication Technologies (ICT). Over time, the reduction of this gap has been substantial, particularly in technologically and economically advanced societies (Vassilakopoulou & Hustad, 2021).
In this context, one of the key questions now is to what extent the use of ICT—rather than solely the access to them—ultimately impacts on students’ performance. This paper explores the non-linear association between ICT usage at school and student performance in a number of OECD countries and it assesses the causal impact of ICT overuse on student performance. Results from this study contribute to expanding policymakers and educators’ earlier knowledge on the way technology, widely present in the classrooms, influences student performance.
Literature Review and Contribution
Literature on the Linear Relationship between ICT Usage and Student Performance
The existing evidence on the linear effects of ICT usage on student performance fundamentally depends on the nature of the data. Results arising from experimental (or quasi-experimental) studies are mixed, while those based on international survey data, such as PISA, generally point to a negative association between ICT use and student performance (OECD, 2015). Focusing on PISA studies assessing the effects of ICT use at school, Hu et al. (2018) find that a one-score increment in the frequency of use is negatively associated with academic performance on mathematics, science and reading in the 44 countries examined with PISA 2015 data (between 10 and 13 points in the three fields of analysis, which is roughly equivalent to a fourth of a full academic year). These findings are consistent with previous studies which make use of a number of waves of PISA (Zhang & Liu, 2016 find a negative effect of nine points on mathematics and science using 2000–2012 PISA data) or which focus on a specific wave of PISA (Petko et al., 2017 find a negative association between educational use of ICT in the classroom and the PISA results using PISA 2012 data). Other authors (Skryabin et al., 2015) question whether this issue differs by grade, and find a negative impact for secondary school students (between 13 and 15 points for the three PISA areas), but a positive impact for primary school students (between five and seven points depending on the area).
Country-specific literature using PISA data mostly points to a negative association between the educational use of ICT and student performance. For Turkey, the use of computers for educational purposes is found to negatively affect students’ reading performance (Gumus & Atalmis, 2011). This negative association is also found for Spain (Gómez-Fernández & Mediavilla, 2021): using PISA 2015 data, the authors find a negative association between the educational use of ICT at school and at home and the performance in all three areas of assessment. With regard to the school effect, the authors suggest that the lack of preparation of teachers in terms of digital competences may explain part of the result. In a recent paper, Fernández-Gutiérrez et al. (2020) find, also for Spain, that the use of ICT at school in an Autonomous Community does not positively affect performance in mathematics and reading (although it does for science). For Italy, it is found that the usage of at least one digital device has a positive impact on students’ performance in mathematics (Ferraro, 2018) compared to the absence of usage of digital devices, yet the frequency of use is not captured in the model.
Literature on the Non-Linear Relationship Between ICT Use and Student Performance
Previous literature, hence, mostly focuses on analysing the relationship between technology and academic performance in a linear fashion, disregarding the possibility of non-linearity. This may, however, be paramount as the oftentimes found negative relationship might be capturing an average effect that might be overlooking potentially positive effects related to certain degrees of use. The OECD (2015) already suggested that a limited usage of computers in school may trigger better performance than no use at all, but a high use (above the OECD average) could lead to significantly worse academic results.
Some exceptions which have explored the potential existence of non-linearity are identified below. In particular, Woessman and Fuchs (2004), using data from PISA 2000, find an inverted U-shaped relationship between Internet connectivity at school and student mathematics and reading performance. For the specific case of the Netherlands, Gubbels et al. (2020) find an inverted U-shaped relationship between ICT use and reading performance using data from PISA 2015. Focusing on Hong Kong, a recent study (Zhu & Li, 2022) finds that the use of ICT at school is negatively associated with student performance in a linear fashion, while the usage for other purposes (e.g., for leisure or for off-school learning) follows a hill-shaped relationship with student performance. Relatedly, Hu and Yu (2021) assess the relation of ICT use at school for communication (chatting online with other students and using email at school)—among other variables—and student performance on digital reading by analysing whether the effect varies depending on the frequency of use. The results indicate that over the past decade, adolescents' frequent use of ICT-based social media at school, including chatting online and using email at school, have negative effects on digital reading performance compared to the peers who seldom do so. Lastly, Borgonovi and Pokropek (2021) identify an inverted U-shaped association between different forms of ICT use—including use at school—and reading achievement by using PISA data for 2009–2018 for OECD countries.
Literature on the Causal Impact of ICT Use on Student Performance
As outlined above, the literature using large-scale surveys usually establishes a correlation relationship, rather than a cause-effect analysis, given the difficulty to address non-observable features such as student motivation (Fernández-Gutiérrez et al., 2020; Fariña et al., 2015). In broad terms, (quasi-) experimental studies allow for a deeper understanding of a potential causal effect between ICT usage and student performance when compared to the usage of large-scale surveys, while the drawback is that these results are mostly not generalisable as they focus on a very particular context (Fernández-Gutiérrez et al., 2020). In fact, depending on the type of intervention and the context, the impact of ICT on student performance may vary remarkably.
Some interventions have been undertaken through randomized controlled trials (RCT), which are generally regarded as the strongest research design for quantitatively estimating average causal effects (Angrist & Pischke, 2008). A tablet intervention addressed to primary school students in Malawi was assessed by Pitchford (2015) through an RCT. The findings point to a positive impact on the mathematical achievement if the software is carefully designed in terms of content and ability to engage students in the learning process. More recently, Araya and Diaz (2020) carried out an RCT to evaluate the impact of an online math program in Chile and found that the platform had a positive impact on students’ performance, which amounted to almost double the results achieved by using the same exercises on a paper version for a whole year. Lastly, the evaluation of a math homework program in a state of the United States through an RCT yielded a positive impact on students’ mathematics scores compared to existing homework practices (Roschelle et al., 2016).
Because it is not always possible to conduct RCTs (e.g., as they may be financially costly), additional research designs for causal inference have been developed over the past few years, such as instrumental variables, difference in differences, regression discontinuity designs and propensity score designs, known broadly as quasi-experiments (Escueta et al., 2020). As an early example, Angrist and Lavy (2002) adopted an Instrumental Variables approach to assess a policy of installing computers into Israeli primary schools on a wide-spread basis, and they did not find evidence of any relevant effect on students’ test scores. Findings from two regression discontinuity designs (RDD) on subsidized computers for households in the Netherlands and Romania (Leuven et al., 2007; Malamud & Pop-Eleches, 2011, respectively) point to negative impacts on achievement outcomes, likely in part a result of the students spending more time playing games (Escueta et al., 2020).
Focusing on large-scale surveys, the literature measuring the causal impact of the frequency of ICT usage on student performance is scarce, although some other variables, such as ICT investment, have been analysed. For example, Cabras and Tena Horrillo (2016) study the impact of ICT investment on student performance in Spain using PISA 2012 data and applying Bayesian Additive Regression Trees (BART). Results suggest a moderate positive causal effect of ICT investment on student performance. Some additional techniques to overcome the potential endogeneity bias arising from ICT usage have been employed by authors. For example, Agasisti et al. (2020) resort to propensity score matching and Instrumental Variable techniques to examine the effect of ICT use at home and find a negative causal impact on student performance in almost all EU-15 countries.
In broader terms, meta-analyses over the last decade have pointed to moderate effects of technology integration on student achievement, with these effects varying significantly by educational technology type. For instance, Cheung and Slavin (2013) suggest that educational technology applications generally offer modest positive effects compared to traditional methods. Consistent with those findings, results from a meta-analysis and research synthesis in Sung et al. (2016) indicate that the application of mobile devices to education has a moderate mean effect size. A systematic review carried out in Crompton and Burke (2018) shows that, of 23 studies analysed, the use of mobile learning in higher education has a positive impact in 16 (70%) of them. Lastly, some other meta-analyses or systematic reviews highlight the existing variability in the magnitude of the impact across different contexts. For instance, the effect of ICT on student learning outcomes is found to vary across grades and subjects (Bayraktar, 2001; Torgerson & Zhu, 2003).
Rationale for the Present Study
The widespread presence of technology has triggered a vivid debate around its usefulness as a tool to enhance student performance. This debate further gained momentum with the outbreak of the COVID-19 pandemic which followed a forced transition to more technology-based education during the closure of educational institutions and triggered learning losses in a wide range of contexts (see Engzell et al., 2021, for the Netherlands; Maldonado & De Witte, 2022, for Belgium; or Aucejo et al., 2020, for the United States). 1
In general terms, while the evidence on the impact of technology on academic achievement is not conclusive, as shown in the literature section above, this paper attempts to shed light on two fundamental points related to the impact of the frequency of ICT use at school on student performance. First, it was not until recently that the possibility of a non-linear relationship was formally considered (Zhu & Li, 2022). This is, however, paramount to policy makers, as the establishment of a linear relationship might be capturing an average effect that might not be reflective of the actual relationship. This would happen when the positive or negative effect might vary depending on the degree of usage. If this were the case, instructors and policy makers would need to aim for the optimal frequency of usage, which requires to be combined with an appropriate implementation of digital devices at school (OECD, 2015). Earlier literature in this context has been either country-specific (e.g., based on the Netherlands or Hong Kong) or has provided average results for OECD countries in an aggregate manner, and this study aims to expand the geographical scope to test for the possibility of non-linearity in a wider sphere of OECD countries. This is tested in a non-parametric way, contrary to the vast majority of previous research, where non-linearity is gauged by means of quadratic models. Relatedly, we argue that the separate, country-specific analysis allows to gauge potential geographical divergences in the effects of ICT use on student performance, as found in Agasisti et al. (2020).
Second, most of the previous literature focused on examining the correlation between ICT use and student performance. This approach, while informative, risks offering a blurred picture of the real cause of the impact on account of confounding variables (Busenbark et al., 2021). For instance, if the frequency of use of technology were found to be negatively associated with student performance, then it could well be the case that this be caused by other non-observable variables that correlate with frequency of use (e.g., if more frequent users happened to lack motivation to excel academically, and this was the cause of their underperformance, then the estimate would not be reflective of the causal impact). Addressing causality is, hence, paramount in the development of well-founded public policy recommendations (Athey & Imbens, 2017). This study aims to explore the potential existence of a cause-effect relationship between frequency of ICT use at school and student performance. To our knowledge, this is the first time that the causal impact of frequency of ICT usage at school is analysed, especially in the framework of large-scale surveys. The ultimate goal is to contribute to the guidance of educational policy choices in a context where technology is playing an increasingly central role in the learning process of students.
Method
Research Context and Sample
The present study feeds from the PISA 2018 microdata, a programme led by the OECD that measures the ability of 15-year-old students to use their mathematics, science and reading skills to meet real-life challenges. The 2018 edition includes participation of 600,000 students from 79 countries, representing about 32 million students (OECD, 2020a). The assessment comprises a number of questionnaires, addressed to a wide range of stakeholders, namely students, teachers, parents and school managers. The key questionnaire for this study is the ICT familiarity questionnaire, which includes detailed information on students’ use of ICT and their attitude towards it.
The focus of this paper is particularly placed in Estonia (N = 4862), Finland (N = 4898) and Spain (N = 28319), though Appendix D, as shown later, will extend the empirical results to a number of additional countries in order to test for the robustness of the results. 2 We compare Spain, a relatively low-performing country (OECD, 2019) with limited integration of ICT at school despite its ample ICT infrastructure (Gil-Flores et al., 2017), with the opposite side of the coin: two traditionally top-players in the PISA context and where the education policy has made a firm commitment to integrating ICT into their education system. 3 This comparison aims to quantify whether the problems that may be identified are generalisable across countries or, conversely, whether these potential deficiencies do not apply in countries with advanced policies on ICT integration for educational purposes. In total, 22 countries are analysed—including Spain, Finland and Estonia—those for which the questions related to the key variable of interest (i.e., ICT usage in terms of frequency at school) do exist in the database. Those countries are Australia (N =10830), Belgium (N = 6891), Switzerland (N = 5164), Czech Republic (N = 6.181), Denmark (N = 5976), the United Kingdom (N = 6975), Greece (N = 5641), Hungary (N = 4717), Ireland (N = 5049), Island (N = 2675), Italy (N = 9484), Lithuania (N = 5840), Luxembourg (N = 4706), Latvia (N = 4630), Poland (N = 5087), Slovakia (N = 4997), Slovenia (N = 5447) and Sweden (N = 4617).
Variable Description
Dependent variable
As outlined above, PISA measures students’ skills to solve real-life problems in three main areas: mathematics, reading and science. In the present study, the descriptive analysis is presented for these three areas to test whether the observed patterns apply relatively homogeneously. In fact, after confirming that the functional form to relate ICT usage with student performance is comparable across all three knowledge areas, the empirical section specifically focuses on the mathematics field to simplify the analysis. The reason underpinning this choice is that mathematics fosters mental discipline, logical reasoning, mental rigor, and is a paramount element to understanding the content of other fields, such as science. Mathematics is also the engine to STEM-related careers, which are closely related to jobs that will only gain momentum in the future, such as those related to artificial intelligence, machine learning, automation or robotics (Wang & Siau, 2019).
In terms of measurement, the OECD quantifies students’ grades around an OECD average of 500 points and a standard deviation of 100 points.
Control variable of interest
Drawing on the ICT familiarity questionnaire, this study focuses on the module of the questionnaire tackling the frequency of use of ICT by students at school, rather than at home. This choice is central to the interpretation of the results, as there are arguments to consider it as more exogenous than usage in other contexts: there is an external factor (such as the teaching staff or the school’s policy concerning the use of ICT) which, in principle, determines the use of ICT made at school. This would contrast with the choice of the variable of educational use at home, which may suffer from greater selection bias because it could be determined by the student’s own initiative, their socio-economic background or the family environment. Another reason why the analysis focuses on the use of ICT at school is due to its impact on education policy, which is more straightforward to implement as compared to the use of ICT in the private domain.
In order to measure the frequency of use of ICT at school, the questionnaire includes 10 different questions. These reflect the extent to which students use a computer at school to do their schoolwork, use the school’s computers to do group work or communicate with other students, or surf the Internet in connection with class work. The remaining questions are specified in Appendix A. The possible answers that students can provide are the following: “never or hardly ever”, “once or twice a month”, “once or twice a week”, “almost every day”, or “every day”.
To synthesise the frequency of use of ICT at school, we create an index that allows to compare students’ frequency of use of ICT at school. This index is benchmarked at the country level. This intra-rather than inter-country comparison is most suitable in the context of the present study, especially since cross-country comparisons show a blurred relationship between average ICT use and the average score in mathematics, as described in Appendix B. More broadly, another argument to support this intra-country comparison relates to the fact that reported variables have intrinsic limitations that might hinder inter-country comparisons (for instance, certain cultural aspects of countries might lead students to overstate or understate some questions).
The index summarises the use of ICT at school for student
It is important to note that the OECD already offers an index to synthesise the use of ICT at school by students. The index is centered around an OECD mean of zero and a standard deviation of one, and its construction is based on the Item Response Theory (IRT) (see OECD, 2017 for further methodological details). While this index is useful for inter-country comparisons, it is not fully suitable for our analysis for the abovementioned reasons. To ensure that the index created here is, however, robust to the OECD’s index, we calculated the correlation between the two. In the case of Spain, for instance, the correlation between the ICT index created here and that of the OECD is 0.9406028.
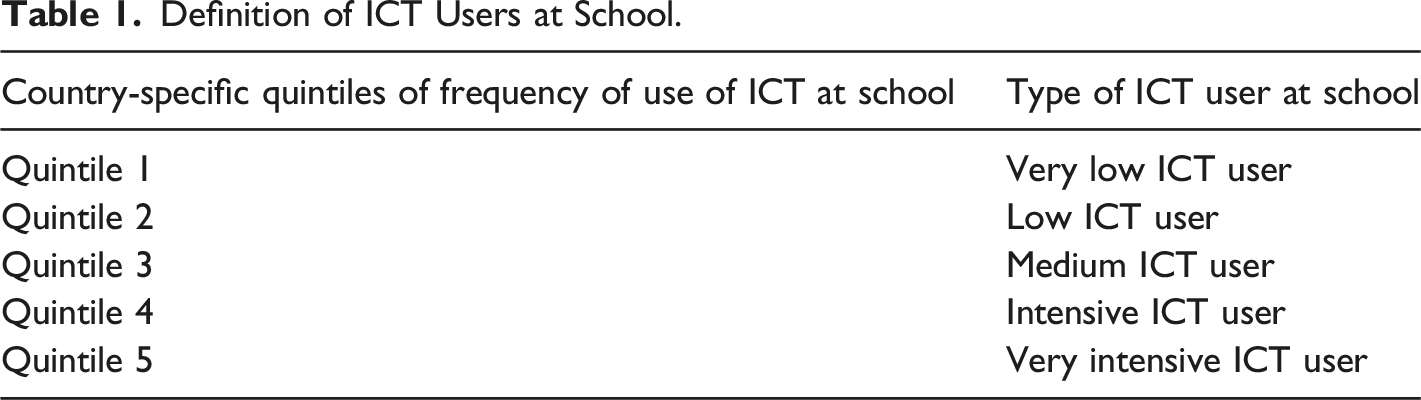
Definition of ICT Users at School.
Other control variables
As explanatory variables we include a set of student background variables that have been frequently identified as relevant factors in earlier literature (e.g., Gamazo & Martínez-Abad, 2020; Hu et al., 2018). These variables reflect both the student- and school-level characteristics. At the student level, we include discrete indicators of gender, repetition and immigration status, given their relevance in explaining student performance. In particular, repeaters and migrants are frequently found to be negatively correlated with performance, whereas results by gender are mixed depending on the competence under study (Gamazo et al., 2018). Additionally, a binary variable that captures students’ late start in the use of technologies (above 9 years of age) is also covered, a feature that is generally more common amongst students from lower socio-economic backgrounds (Rodrigues & Biagi, 2017). Separately, the PISA index of economic, social and cultural status (ESCS) and a PISA index on the degree of bullying suffered are also included as control variables. These are standarised variables centered around an OECD mean of zero and a standard deviation of one. The ESCS index synthesises students’ responses regarding their family background (e.g., home possession, parents’ occupations and parents’ highest educational level), while the bullying exposure index comprises other questions such as whether other students made fun of the respondent. The literature indicates that the socio-economic status index is positively related to student performance, although this relationship is far from deterministic (OECD, 2020b). The ESCS is one of the most used variables in the PISA literature, as it helps address questions about educational opportunity and inequalities in learning outcomes (Avvisati, 2020). Conversely, the inclusion of the bullying index is often overlooked in the literature, while research highlights its negative impact on student performance (Yu & Zhao, 2021).
At the school level, we include the school size (in logarithmic terms), which the literature suggests to be associated with improved student performance (Giambona & Porcu, 2018). The type of school ownership (public or not) is also included as a control variable. In this case, the literature on its effect on academic achievement offers mixed results (Gamazo & Martínez-Abad, 2020). Lastly, the inclusion of a ratio to measure the number of computers per student (as a continuous variable) serves as a proxy of the school’s available ICT resources per student.
Research Model and Procedure
The methodological framework is divided into two parts. First, it assesses—through hierarchical linear models—whether the hill-shaped relationship between ICT usage and student performance still holds after taking into account other student-specific determinants. The second part focuses on the very intensive ICT user and adopts a complementary technique to establish a causal relationship between the very intensive ICT usage at school and mathematical performance. This is done through a widely applied technique in the causality literature: Inverse Probability Weighting.
Hierarchical linear models
This first part outlines the empirical strategy to assess the relationship between ICT usage and student performance taking into consideration the nested nature of the data. The fact that students are nested within schools implies that multiple regression analysis is not suitable. Instead, the relation is estimated by means of multilevel models, also known as hierarchical linear models (Bryk & Raudenbush, 1992). This is a form of Ordinary Least Squares that analyses the variance in the dependent variable when the predictor variables are at different levels (Woltman et al., 2012).
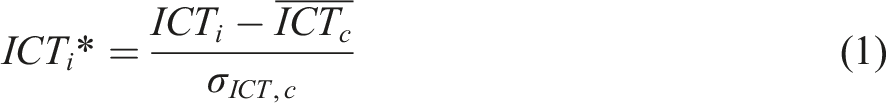
The rationale for this estimation procedure is described below and is formally specified in equations (2) and (3). The first-level specification gauges the relationship between student performance (student i attending school j) and the p different explanatory variables considered (i.e., the set of independent variables outlined in the “Variable Description” subsection). More specifically, the variables ranging from X1 to X4 are binary variables that denote the type of ICT user each student can be deemed as depending on the level of usage of ICT (based on the country-specific quintiles of ICT usage): low, medium, intensive and very intensive, respectively, and the very low user is taken the as the reference variable. This allows to estimate the relationship between the frequency of ICT usage and mathematics performance when compared to those students who barely ever (or never) make use of it. This is in contrast with most of previous studies that attempt to gauge the non-linear association between ICT use and academic performance, which usually resort to quadratic models, whereas the specification herein used is more flexible by being non-parametric.
The remaining variables entail other features such as the student’s gender or socio-economic status, among others (see “Variable Description” subsection). Lastly, e
ij
refers to the residuals. The second-level specification shows that the intercept varies across schools; that is, the overall mean intercept includes a school-specific random-effect term. The reminder
Level 1 specification

Level 2 specification


Mixed model specification

In all cases, the 10 plausible values for each student are considered simultaneously, and the 80 weights assigned to each student are taken into account to avoid potential bias in the estimated coefficients (OECD, 2017).
In sum, while this methodology allows to isolate the correlation between ICT usage at school and the academic performance, causality cannot be inferred. To address this, the following subsection outlines the methodology underpinning the causality analysis.
Inverse probability weighting
The second part of the empirical framework focuses on the very intensive ICT user, who is of particular interest on account of the results, which evidence their differentiated socio-demographic profile and their notorious underperformance in mathematics compared to the rest of users. Those results, both at the descriptive and at the empirical levels (through hierarchical linear models), cannot be deemed as causal, which is to be analysed in this second part of the analysis.
The causality analysis attempts to identify whether the variable of interest (very intensive ICT usage in this case) is actually causing the outcome variable (student performance) to decrease. For example, if some non-observable variables shared across very intensive ICT users were determining the low mathematics performance, then these variables—rather than very intensive ICT use—would be the cause of a low performance. The fundamental rationale of the causality analysis is to ideally compare a situation where an individual uses technology very intensively with a situation where that same individual hardly uses it at all. If the comparison were to lead to a significant gap in mathematical performance in favour of the non-intensive user, it could be concluded that the very intensive use of ICT is the cause of poor mathematical skills acquisition. However, since in reality this comparison is not feasible for the same individual, there are a number of econometric techniques that offer an approach to address this issue.
In this paper, the Inverse Probability Weighting (IPW) method is applied. This methodology is based on the idea that random assignment ensures that the distribution of variables among treated and control individuals is probabilistically equivalent. Nevertheless, when the assignment is not random (and this is the case for being a very intensive ICT user), some students have higher probability of being treated, depending on their characteristics. In order to obtain a pseudo-random sample that guarantees that the distribution of covariates would be probabilistically equivalent, we weight students by the inverse probability of being very intensive users (De la Rica and Gorjón, 2019). The aim of this estimation method is, in turn, to approximate the distribution of the observable variables of the treatment group (very intensive users) and of the control group (the rest of the students), assuming that in this way the distribution of the non-observable variables would also be assimilated (see Wooldridge, 2002 and 2010 for a detailed explanation of this methodology).
The estimation method is based on the following procedure. Firstly, a logit model is defined to estimate the probability that student i is a very intensive ICT user (
Once the model is estimated, the probability of being a very intensive user is predicted (

These weights enable the over-representation of those individuals who, given their characteristics, are likely to be very intensive users but do not report being so on the basis of the ICT questionnaire. On the contrary, if the student’s characteristics lead to a prediction of low probability of being a very intensive user and the student does not report to be one, the weight to be applied to that student will be close to one. Similarly, if the model predicts a high probability of being a very intensive user and this is indeed the case, the weights assigned will also be close to one. Finally, when the user is indeed very intensive but her/his characteristics predict a low probability of being so, this person will also be over-represented. Through the approximation of observable variables between the control and treatment groups, it is assumed that this approximation is also assimilated in the unobservable variables.
The estimation of the model through IPW allows to obtain the Average Treatment Effects (ATE), which measures the potential causal impact of the very intensive usage of ICT on student performance. The ATE requires that the whole population under study is eligible to be treated, given that it compares the whole population were it treated versus were it not treated. To ensure that this is the case in the present paper, we will analyse the distribution of the propensity score (i.e., the predicted probability of being a very intensive ICT user) between the treatment and control groups (“Results” section). If the distribution is comparable, then the estimation of ATE is well founded, as long as extreme values are not present in the distribution (Cunningham, 2021). In fact, the presence of extreme values could bias the estimator and induce excessive variance, given that the weights attained through the IPW methodology (see equations (5) and (6)) could become overly large and could hence give rise to unstable estimates (Avagyan & Vansteelandt, 2018).
Following the approach proposed by DuGoff et al. (2014), the final weights applied to the model are the product of the sample weights and the IPW weights, calculated as detailed in (4), (5) and (6) above. With these final weights, the average impact in mathematics between the very intensive user and the remainder of the users is estimated, in order to capture whether the existing mathematical gap changes when these weights are applied.
Data Analysis
The descriptive results show, in first place, the mean use of ICT at school for each of the five types of users herein defined and for the three countries. This allows to infer to what extent a specific ICT user is indeed comparable across the three countries.
Figure 1 shows how the average frequency of ICT use at school varies by type of ICT user in all three countries. For each type of user, the average frequency of ICT use at school is similar in Spain and Estonia, and lower than in Finland. Nevertheless, these differences are relatively small. A clear pattern that emerges is the jump in terms of the frequency reported by the very intensive user in the three countries. While the difference between the four reminder users is relatively stable, the very intensive user reports significantly higher frequency, with the use being close “almost every day”, especially for Estonia and Spain. The average frequency reported for each of the 10 questions, by country and ICT user type, is provided in Appendix C. Average frequency of use of ICT at school in Spain, Estonia and Finland.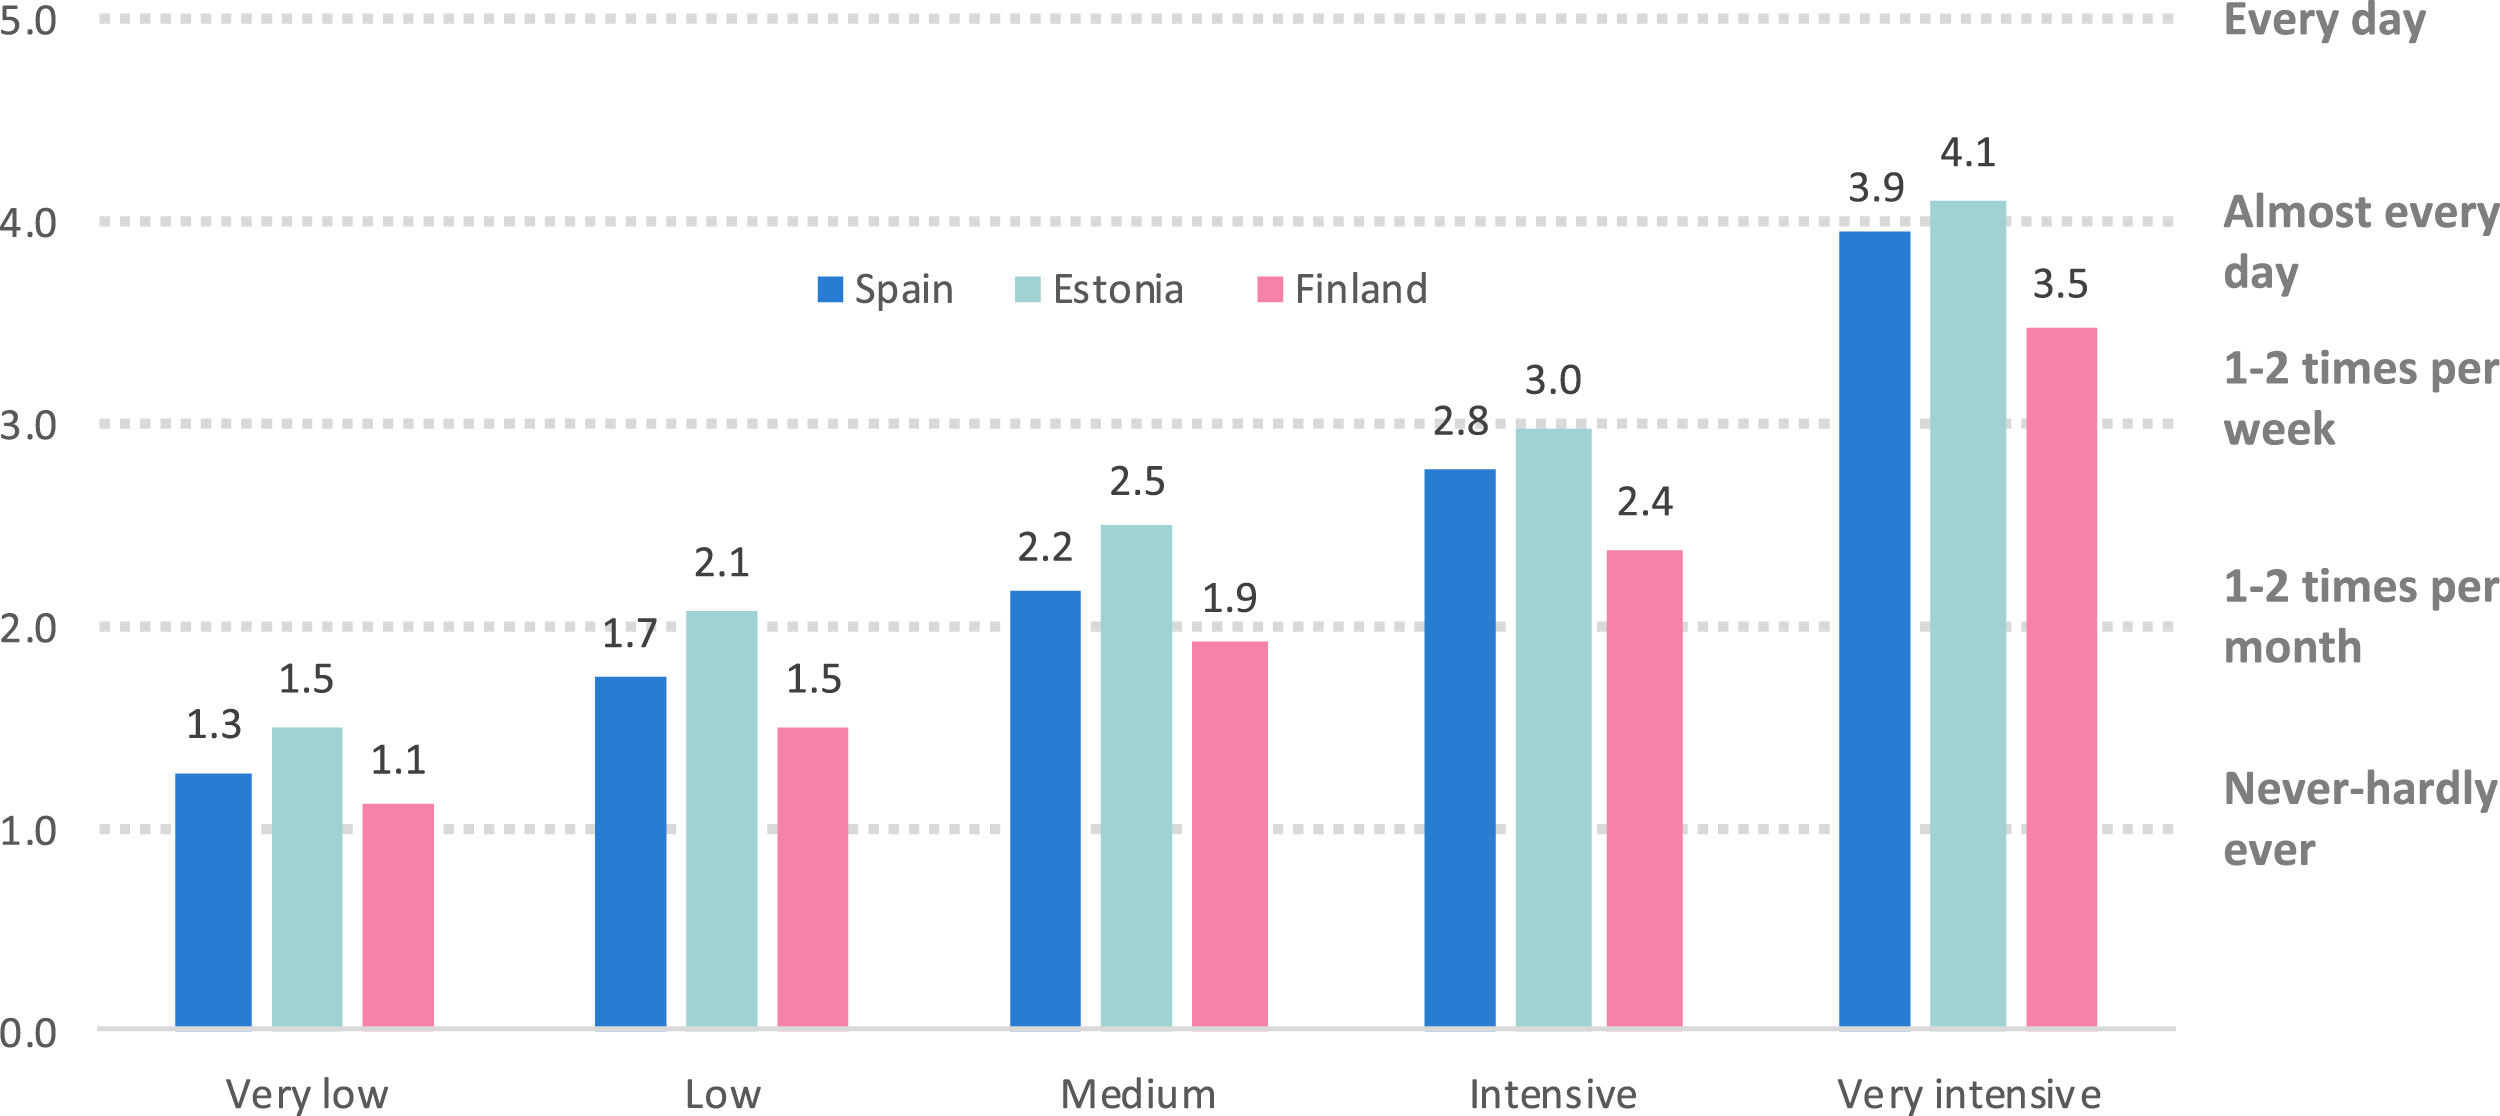
After identifying the actual average use of ICT at school for each type of user, Figure 2 shows the average score of each user in the three main areas of PISA. The results confirm that, in the three countries, the relationship between frequency of ICT use at school and the performance in mathematics, science and reading follows an inverted U shape, where the highest frequency user group (i.e., very intensive users) obtain a significantly lower average grade than the remainder of users. In Spain and Estonia, the maximum peak score in the three knowledge areas is obtained by the medium user (quintile 3, i.e., those who use ICT at school more than 1–2 times per month). In Finland, low users (those that use the ICT 1–2 times per month) and medium users (less than once a week, approximately)—and intensive users, although slightly less so—are the ones who show the strongest mathematical competences, in contrast to the scientific and reading competences, where it is the low intensity user (quintile 2) who obtains the best average competences. Given the fact that the inverted U-shaped relationship holds for the three knowledge areas (mathematics, science and reading), the empirical analysis will focus on the particular case of mathematics. Average score in Spain, Finland and Estonia by frequency of use of ICT at school.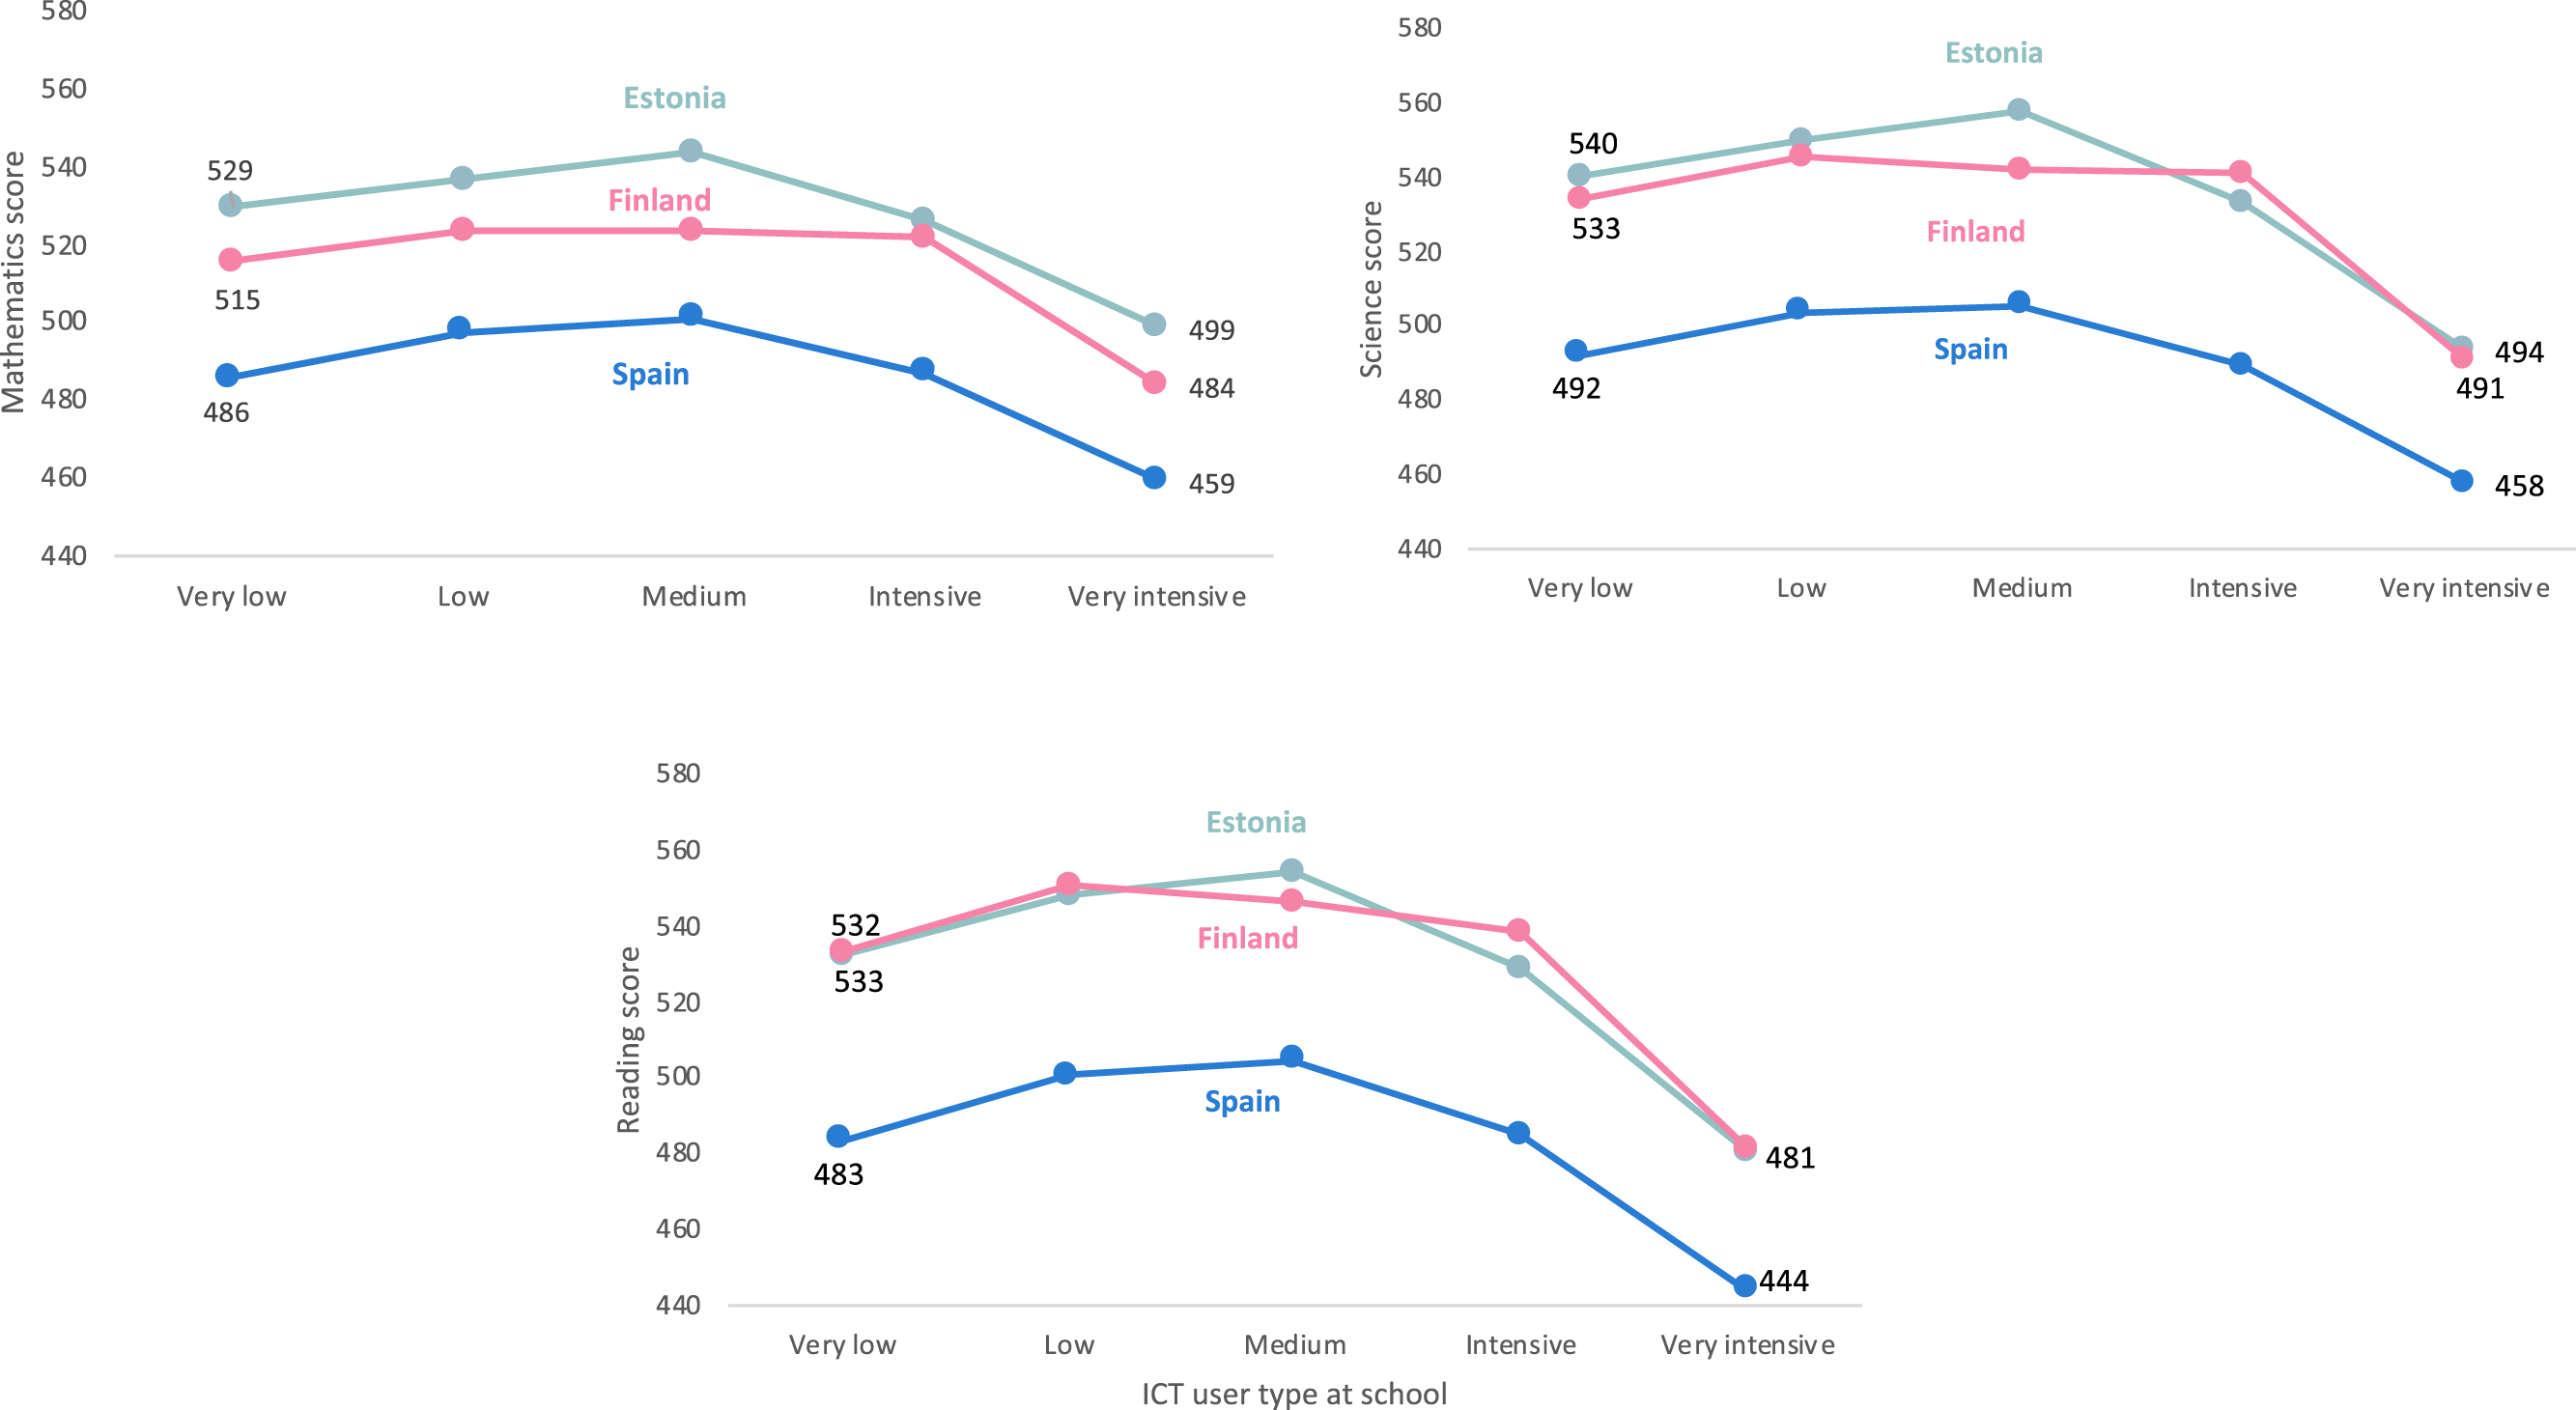
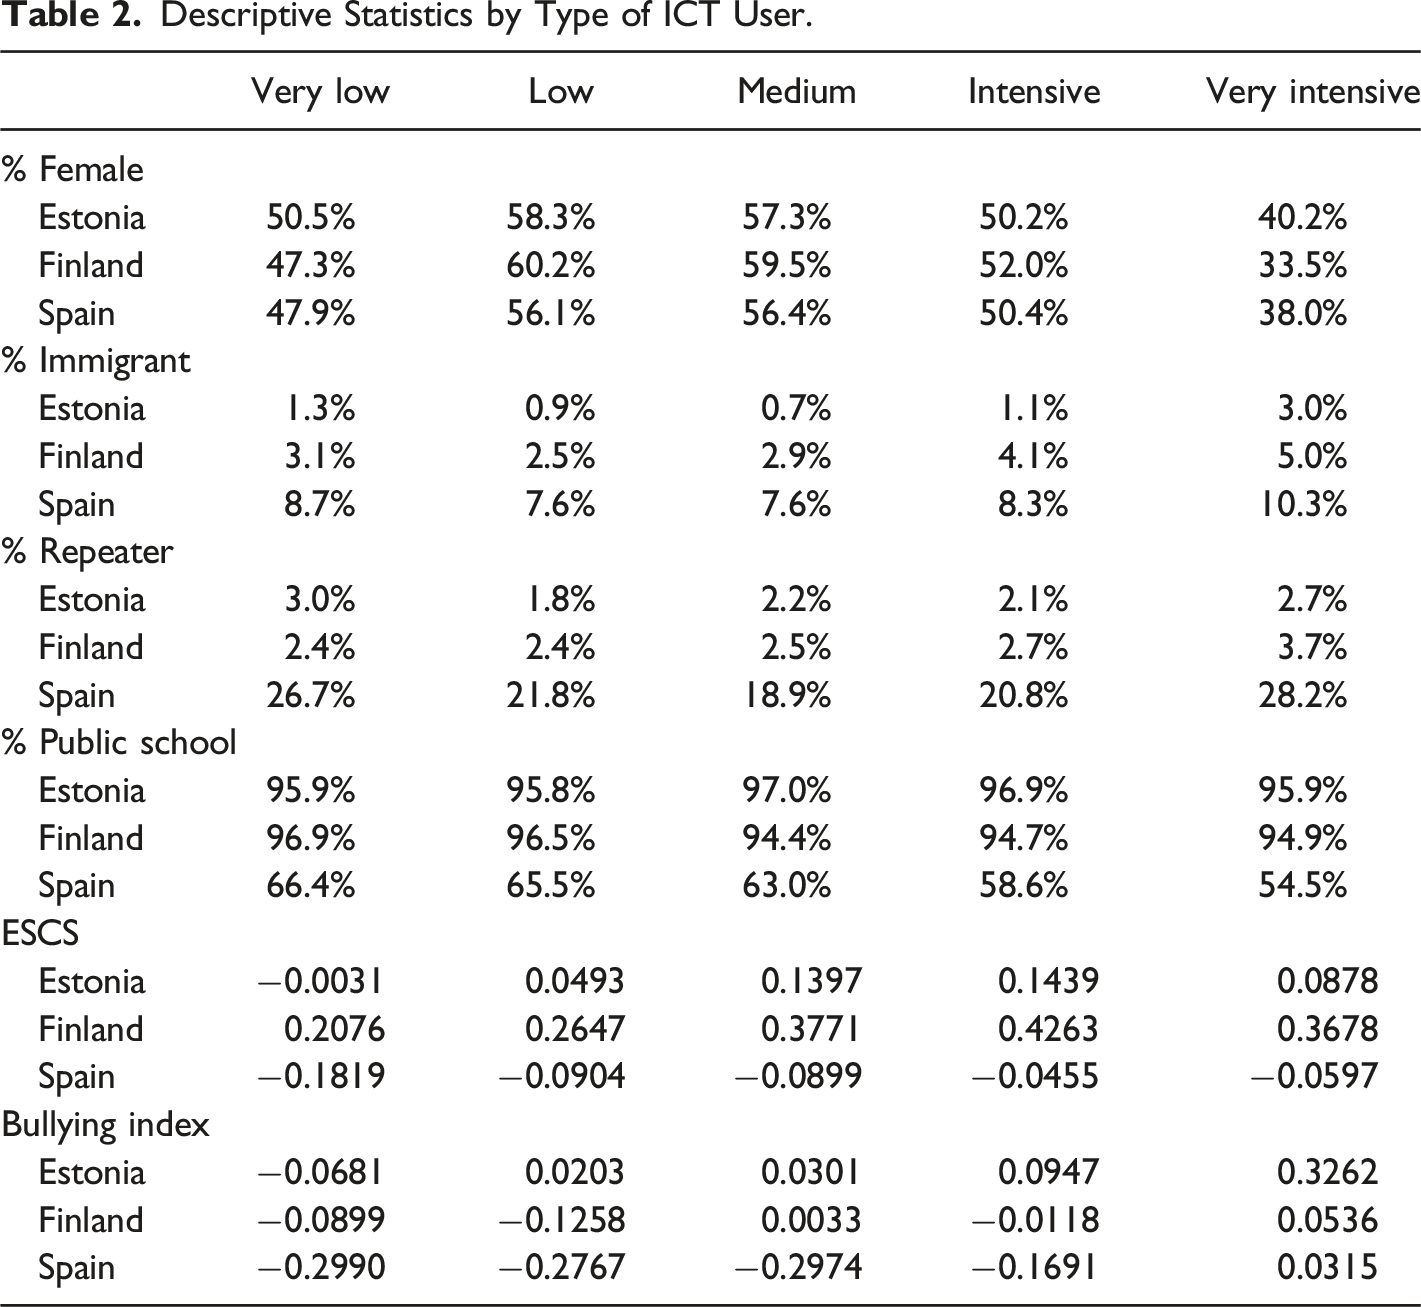
Descriptive Statistics by Type of ICT User.
Estimated Association Between the Mathematics Achievement and the ICT Usage and Other Covariates.
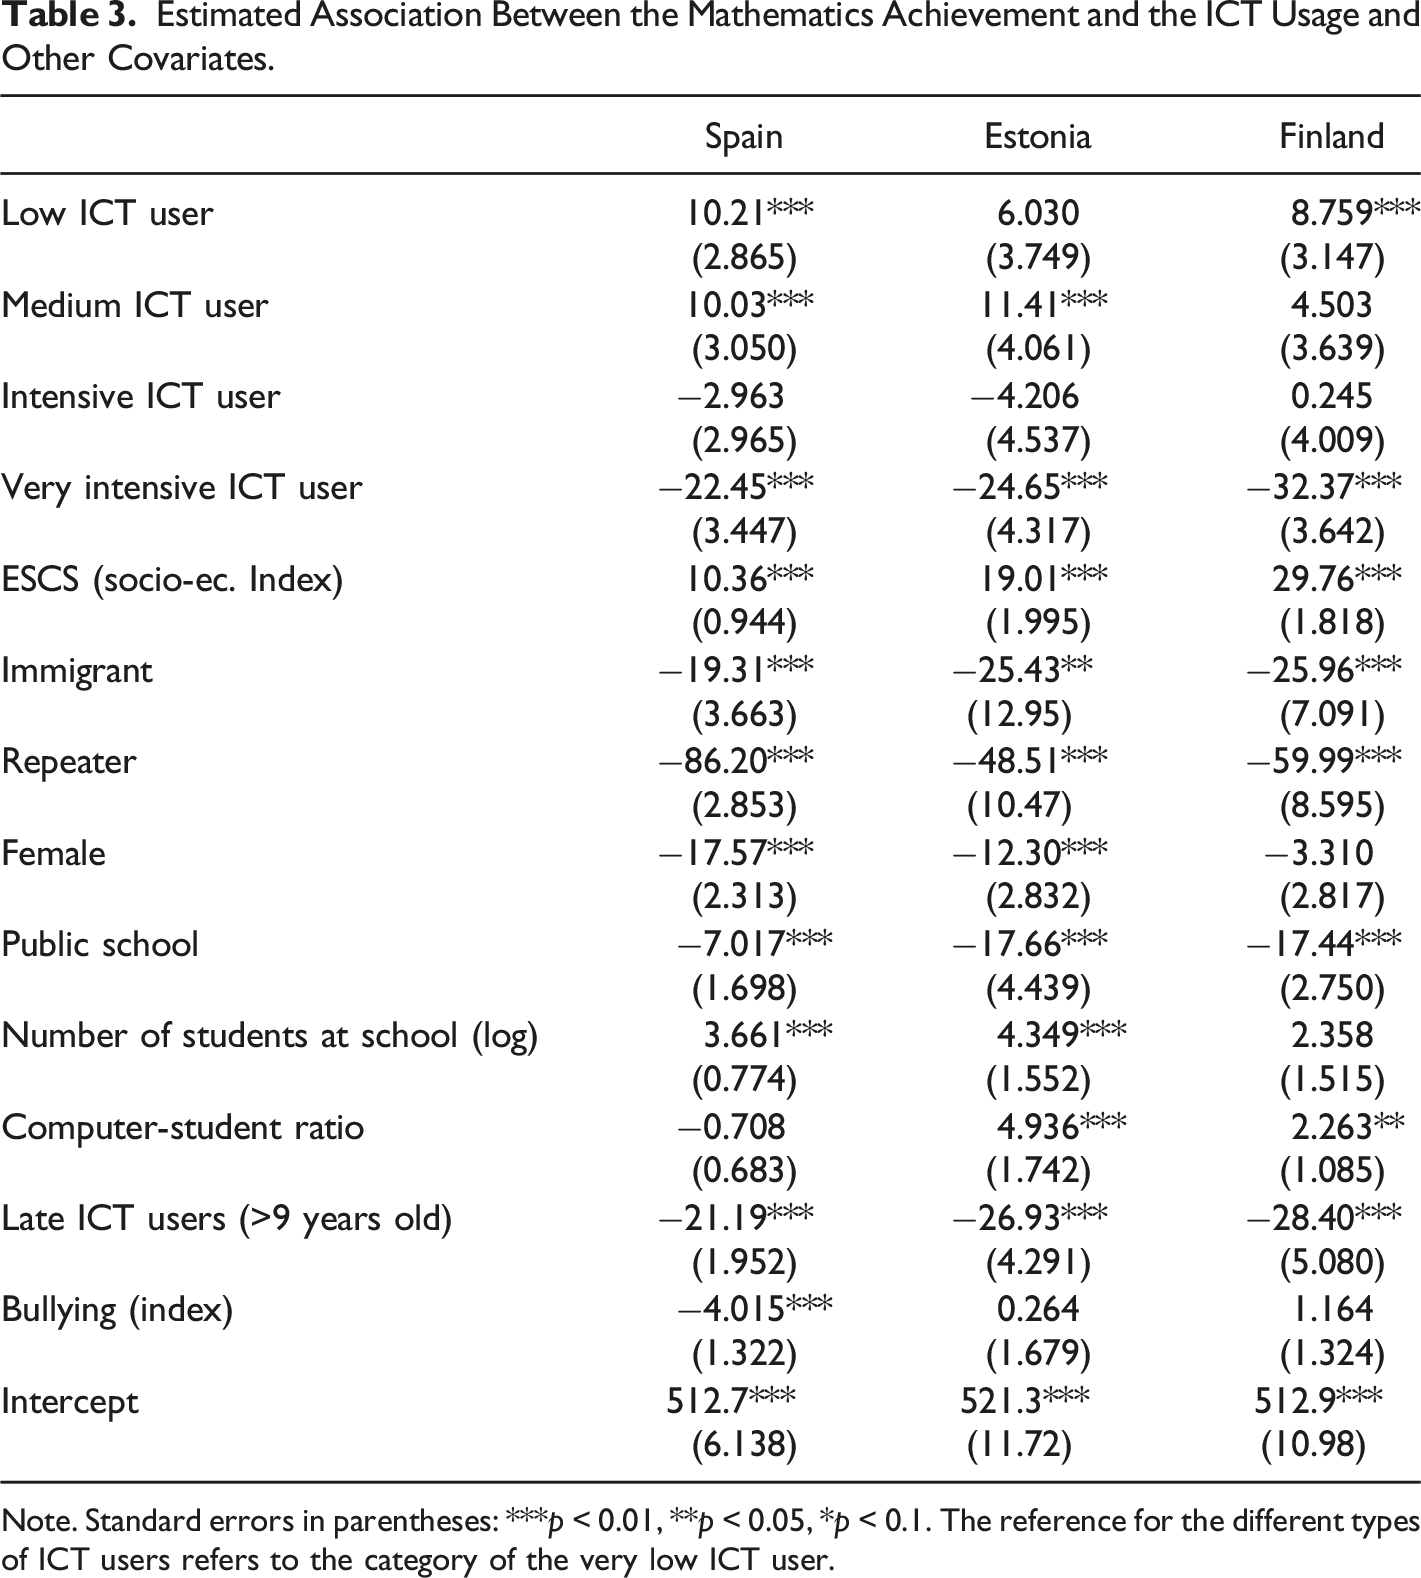
Note. Standard errors in parentheses: ***p < 0.01, **p < 0.05, *p < 0.1. The reference for the different types of ICT users refers to the category of the very low ICT user.
It is important to note that the results presented in this section are merely descriptive. They do not imply that the hill-shaped relationship is necessarily attributed to the frequency of ICT usage, as there might be other variables beyond the ICT usage that are driving the effect. This might be particularly the case for very intensive ICT users, who have a very differentiated socio-economic profile (Table 2). The following section will attempt to infer whether this relationship remains once students’ personal characteristics are taken into account.
Results
This section presents the empirical results and is divided in two parts. The first one shows the estimated relationship between each type of ICT user and their mathematical performance to identify whether the hill-shaped relationship found in the descriptive analysis holds when considering students’ characteristics. Results are then disaggregated by gender, ESCS and ICT-related activities. The methodology underpinning these results is based on Hierarchical Linear, or Multi-Level, Models. The second part of this section presents the causal estimates for the very intensive ICT user by applying the IPW framework.
Results of the Multi-Level Analysis
The results derived from the hierarchical linear model allow to compare the over- or under-performance of low, medium, intensive or very intensive ICT users when compared to very low users, taking into account their socio-demographic features.
Main Results
The estimated coefficients of the hierarchical linear model are summarised in Table 3 for the three selected countries and expanded to the 22 OECD countries herein considered in Appendix D. On the one hand, the results show that, for practically all the countries under study (including those in the appendix), the low ICT user status (quintile 2, i.e., average ICT usage slightly below once a month for Spain and Finland; and once or twice a month in Estonia) is associated with better results than the very low user status (quintile 1). The medium user (quintile 3, i.e., those with an average use between 1 and 2 times per month and 1–2 times per week in Spain and Estonia, and 1–2 times per month in Finland) also tends to be related with more positive results than the very low user, although this variable is not significant for an important part of the countries. For Spain and Estonia, on the other hand, positive and significant effects of 10 and 11 points, respectively, are found in relation to the less frequent user.
On the other hand, for the intensive user of ICT at school, a clearly negative trend is observed in most of the countries analysed. However, the coefficient associated with this variable is not significant in Spain, Finland and Estonia, among others. The strong and very significant impact in all the countries lies on the very intensive users, that is, those who use ICT almost every day. In this group of very intensive users of ICT at school (last quintile), a unanimous pattern is observed in all the countries examined: compared to very low frequency users and, broadly, to the reminder of users, very intensive users score significantly lower in mathematics. In order to interpret such results, it is important to recall that a difference of 40 points is roughly equivalent to a full academic year. This means that very intensive users in Spain or Estonia underperform by more than half year compared to non-ICT users, and by three-quarters of year when compared to low or medium ICT users. In the case of Finland, very intensive ICT users perform a full academic year worse than their low ICT user counterparts.
To expand the analysis, equation (3) is estimated separately by gender and socio-economic status (higher or lower than the median). The results, shown in Table E1 of Appendix E, confirm that the existence of the inverted U-shaped relationship between ICT usage at school and students’ performance in mathematics still holds for all the four groups herein considered.
As a robustness exercise, Appendix F estimates the results for the 22 OECD countries by using the ICT frequency index as a continuous variable—as opposed to the user-specific dummies—and compares it to the results found in Hu et al. (2018), undertaken with the PISA 2015 wave. Results are similar in magnitude when using PISA 2018 and PISA 2015 data, and they point to a negative—and highly significant—relationship between ICT usage and mathematical performance in all the countries analysed.
Results by ICT Activity
The analysis so far has focused on the overall use of ICT at school. However, a relevant question to policy makers and instructors is to disentangle which specific ICT-related activities might be associated with improved or poorer performance of students (see Agasisti et al., 2020 for a preliminary analysis on the effects of ICT activities at home). To this end, equation (3) is now estimated by including the 10 specific ICT-related activities listed in Appendix A, which replace the ICT index as the control variable of interest. 4 Each of these activities is introduced in the model as a categorical variable that reflects the reported frequency by students, with five possible answers that range from “never or hardly ever” to “every day” (see the “Variable Description” section), taking the earlier as the reference category.
The results (shown in Appendix G) suggest that for most of the activities, there is a negative association between excessive use and student achievement—particularly the instruction-related ones, to a larger extent than those related with homework—with very few exceptions. The most noteworthy exception relates to the activity of browsing the internet for schoolwork: spending time in this activity is associated with improved performance in mathematics, compared to never or hardly ever doing so, for the three main countries under study. For Spain and Estonia, this association is hill-shaped, whereas it is linear for Finland. Conversely, some other activities such as playing simulations at school, posting work on the school’s website or practicing and drilling yield either negative effects (in the first case) or non-significant effects (in the latter activity). These results support the findings of Agasisti et al. (2020), Hori and Fujii (2021), Luu and Freeman (2011), Odell et al. (2020) and OECD (2021) when studying the effects of ICT-related activities on different outcomes. Lastly, a hill-shaped relationship is found between the use of school computers for group work and communication with other students—among other activities—in Spain and Finland, where the monthly or weekly usage has positive effects on academic performance. 5 In sum, this analysis suggests that the use of ICT at school is more helpful in some school activities than in others, which may hamper student achievement, and that the use of digital devices might be displacing other instructional activities (Falck et al., 2018; OECD, 2021).
As the overall conclusions on the negative effects of ICT overuse hold when analysing the activities separately, the reminder of the paper turns to the usage of the aggregate index. The following section will delve deeper into whether causality can be inferred regarding the negative impact of a very intensive use of ICT on students’ mathematical performance.
Results of the Inverse Probability Weighting Analysis
This subsection focuses on the causal impact of the very intensive user to assess whether the underperformance related to the very intensive ICT user seen in the previous subsection can actually be attributed to the very frequent use of ICT.
Before presenting the causal estimates, it is important to first ensure that the distribution of the propensity score (i.e., the predicted probability of being a very intensive ICT user) between the treatment and control groups are comparable such that the ATE is well founded, as long as extreme values are not present in the distribution (Cunningham, 2021). Figure 3 shows the distribution of the propensity scores to ensure that the application of IPW would not lead to biased estimates. In the three countries under study, the propensity scores are comparably distributed across treatment and control groups. In addition, extreme cases are uncommon, ensuring that the ATE estimation through IPW is justified. Propensity score distribution of treatment and control groups.
Inverse Probability Weighting Estimates of Very Intensive ICT Usage.

Note. Standard errors in parentheses: ***p < 0.01, **p < 0.05, *p < 0.1. Pomeans refers to the predicted-outcome means; and ATE, to the average treatment effect.
The results shown in Table 4 confirm that very intensive ICT usage causes significant underperformance in mathematics. That is, after approximating the observed variables between the treatment and control group (and assuming that the unobserved features are also assimilated), there is evidence that a very intensive usage of ICT causes substantial underperformance in mathematics. The usage of ICT at school more than 1–2 times per week reduces very significantly students score in mathematics. This penalty is equivalent to more than half an academic year for very intensive users in Spain, and ¾ of an academic year for the homologous users in Finland and Estonia.
As done earlier, the analysis is extended by socio-economic status and gender, with the aim of assessing whether the causal impact of the very intensive ICT usage on the mathematical performance holds across these groups. 6 These results, shown in Appendix E (Table E2), confirm this fact and show that the relative impact of very intensive ICT usage is more negative for female students in Estonia and Finland, and for male students in Spain. In Spain and Estonia, the relative impact is more negative for students from high socio-economic profiles, while the opposite is found for Finland.
Discussion
In sum, after confirming the existence of an inverted U-shaped relationship between frequency of use of ICT at school and academic performance, which is significantly negative for very intensive users, the present study has confirmed that the penalty associated with the very intensive ICT usage is causal, rather than explained by the particular socio-demographic features of this student subgroup. Below, we discuss the results arising from this study and put them into context based on related literature.
The Hill-Shaped Relationship Between ICT Usage and Student Achievement in OECD Countries
The results on the inverted U-shaped relationship between ICT usage and student performance are aligned with Gubbels et al. (2020), who focused on the specific case of the Netherlands. While the setting of the study is slightly different—particularly regarding the field of study (reading), the measurement of the frequency of use of ICT at school (a continuous variable based on the OECD index) and the quadratic functional form of the model—results are still comparable. After controlling for similar covariates as in the present study, a hill-shaped relationship is found, and the difference in the mean predicted performance between the least and the most intensive user amounts to the equivalent of over an academic course. This is similar to the difference in the predicted mean in the reading performance found by the OECD (2015). Again, these magnitudes are not directly comparable to the present study, but the overall conclusions do concur. Similarly, the broad conclusions are in line with Borgonovi and Pokropek (2021) and Hu and Yu (2021), while they cover a number of countries in an aggregate manner, as in OECD (2015), and assess the relation with regard to students’ reading performance. In contrast, recent findings by Zhu and Li (2022) for Hong Kong are slightly different. While accounting for non-linearity, the authors assess a linear and negative relationship between ICT use at school and student performance in reading. However, the relatively less time available to efficiently use ICT tools compared to OECD peers might partly explain this divergence (Zhu & Li, 2022).
The Negative Impact of a Very Intensive ICT Usage on Student Performance
Concerning the causal negative impact of very intensive use of ICT at school on the mathematical performance found in this paper, to our knowledge there is no directly comparable paper to contrast the results with. However, the study by Agasisti et al. (2020) would constitute a close example assessing causality through analogous econometric techniques. The findings reveal that the intensive use of ICT at home has a negative causal impact on all subjects in most EU-15 countries. The present study focuses on the use of ICT at school, and hence further studies are needed to further delve into the direction of the impact, as well as the factor that might be driving the results.
Overall, the reasons underpinning the negative impact between the very intensive ICT usage on the mathematical performance are beyond the scope of the paper, but some potential hypotheses are explored here. On the one hand, students could possibly get distracted by using ICT at school for activities unrelated with the educational purpose of the usage of these devices. This might lead them to over-report the amount of time spent using technology at school (Agasisti et al., 2020). The possibilities that ICT offers students for “multitasking”, that is, performing a large number of tasks at the same time, can prove detrimental to students’ ability to capture information (Borgonovi & Pokropek, 2021; OECD, 2018; Vedechkina & Borgonovi, 2021). On the other hand, deficiencies in training teachers towards digitalisation have also been identified by the OECD (2018) and other authors (e.g., Hu et al., 2018) as an obstacle to successfully foster student learning through digital devices. This might be the case when teachers’ ICT knowledge is not regularly updated, although since the outbreak of the COVID-19 pandemic—which is not gauged in this study—many teachers and educators were forced to rapidly develop and learn ICT skills to optimise their instruction (Vedechkina & Borgonovi, 2021).
In view of the results, some policy implications can be drawn. First, stakeholders should exercise caution when integrating ICT at school to ensure that educational technology does not interfere with students’ learning processes. To this end, it is important to particularly monitor the very frequent users of technology at school—as the study has shown that this overuse has a strong negative impact on students’ achievement in mathematics—together with other key stakeholders in the integration of ICT at school, notably, teachers. If factors largely beyond the reach of instructors were found to explain students’ underperformance (e.g., distraction as a result of the large amount of time spent using ICT), as the study suggests, then policies should be addressed in order to limit what could be deemed as an excessive frequency of use. The study also highlights the need for teachers, educators, school principals and policy makers to carefully identify their context-specific deficiencies, which the paper has shown to differ both geographically and across student subgroups. Preliminary results suggest that the negative effects of ICT overuse at school be primarily associated with instruction-related activities, in contrast with other activities such as browsing the internet for schoolwork. Investigating the specific activities that contribute to improved achievement through rigorous studies is paramount for a well-founded implementation of ICT at school. The quality of integration of ICT at school could be improved through channels claimed in the literature, such as computer-assisted instruction or technology-based curricula (Hu et al., 2018).
Conclusions, Limitations and Future Research
The present study contributes to the field in two key ways. First, this study captures the varying effects of ICT at school in the performance in mathematics depending on the intensity of use for a number of OECD countries. Second, it applies the Inverse Probability Weighting technique to gauge the potential causal impact of ICT overuse on student performance, while most of previous studies using large-scale surveys limit the results to the correlation sphere.
The results from this study confirm the existence of a hill-shaped relationship in explaining the frequency of ICT usage at school and students’ performance in mathematics in 22 OECD countries, with varying magnitudes across countries and types of ICT activities. The study reveals that even in the most advanced countries in terms of ICT integration at school—such as Finland or Estonia—the group of very intensive frequency users experiences a significant penalty in terms of their performance in mathematics, while the low and medium ICT user status is related to better results than the very low user status.
However, these very intensive have a very differentiated socio-economic profile compared to the rest of users: they report above-average levels of bullying, and they are over-represented by male, repeaters and immigrant students. Given this, the study further explores whether the observed underperformance is attributed to such differentiated profiles or, conversely, whether the penalty can be attributed to the excessive use of ICT at school. Results indicate that the overuse of ICT causes an underperformance in mathematics, which is of the order of more than half academic year in Estonia, Finland and Spain.
The present study is not without limitations, which could be addressed in future research. The first relates to the measurement and definition of the main variable of interest, use of ICT at school, which is made on the basis of quantity of time spent, as opposed to quality of usage (Petko et al., 2017). In fact, the definition of the variable of interest is broad, which limits the interpretation of the results. Although we have attempted to disentangle the role of each ICT-related activities on student performance, the rationale for the differing effects—as well as the causal impact of the separate activities—remains a question to be addressed. In addition, future research could further explore whether the impact differs when looking at other computer-related activities that might be more specifically addressed to improving student performance, such as computer thinking applied to digital devices. The PISA data to date did not cover information of this nature; however, future editions intend to include activities such as the use of digital resources to solve equations or for coding purposes (Lorenceau et al., 2019). The second limitation refers to the absence of other covariates that might be of relevance to the model. One question that arises in view of the results is how the performance of students clustered in the same classroom where ICT is very intensively used might vary. This is currently unattainable with the PISA database due to the lack of an identifier that links students with classrooms. The availability of this data would also allow to identify whether specific ICT methodologies implemented by teachers, as well as ICT training received, entail a differential impact on student performance, which has been noted to be paramount in this research context (Pérez-Sanagustín et al., 2017). The third limitation relates to the cross-sectional nature of the database: the usage of panel data (or quasi-experimental studies) would further enrich the analysis and, notably, the causality analysis. A fourth limitation related to the causality analysis lies on the assumption that the unobserved features between treatment and control groups are assimilated, which might not always be the case if unobserved variables proved relevant in either of the two groups (whether treatment or control). Lastly, although this paper covers a wide range of countries, ICT activities and population subgroups, results cannot necessarily be generalised to other contexts, whether geographic or temporal. Despite the gaps that are yet to be overcome, the present paper has intended to further contribute to the exploration of the way ICT—which is increasingly present in schools—affects student performance, a paramount topic for instructors and policy makers in their search for an optimal use of technology that enhances students’ learning processes.
Footnotes
Acknowledgments
We would like to thank Sara de la Rica for her valuable advice and continuous support throughout the study.
Declaration of Conflicting Interests
The author(s) declared no potential conflicts of interest with respect to the research, authorship, and/or publication of this article.
Funding
The author(s) disclosed receipt of the following financial support for the research, authorship, and/or publication of this article: We gratefully acknowledge funding from Fundación COTEC para la innovación (Programa de Innovación Abierta 2019).