
Abstract
Previous research has not adequately explored students’ behavioral processes when addressing computational thinking (CT) problems of varying difficulty, limiting insights into students’ detailed CT development characteristics. This study seeks to fill this gap by employing gamified CT items across multiple difficulty levels to calculate comprehensive behavioral sequence quality indicators. And then, through latent profile analysis, we identified four distinct latent classes of behavioral process. We then examined the in-game performance differences among these classes, uncovering each class’s unique attributes. Class 1 students consistently demonstrated high-quality, efficient behavioral sequences regardless of item difficulty. In contrast, class 2 students applied significant cognitive effort and trial-and-error strategies, achieving acceptable scores despite low behavioral sequence quality. Class 3 students excelled in simpler items but faltered with more complex ones. Class 4 students displayed low motivation for challenging items, often guessing answers quickly. Additionally, we investigated the predictive value of students’ performance in gamified items and their behavioral process classes for their external CT test scores. The study finally elaborated on the theoretical implications for researchers and the practical suggestions for teachers in CT cultivation.
Introduction
In today’s world, computational thinking (CT) has surpassed the boundaries of computer science and has evolved into a skillset that should be possessed by the individuals of every field. According to many researchers, CT refers to the ability of analyzing and solving the real-world problems by using the fundamental concepts of computer science (Wing, 2006; Shute et al., 2017; Shen et al., 2022). CT has been identified as a substantial learning target in K-12 education (Grover & Pea, 2013) and is considered critical to the career success of students (Grover et al., 2017). With the adoption of digital learning assessment, it has become very easy to record students’ interactions with computers to solve CT problems through continuous timestamped behaviors (He et al., 2021; Jiang et al., 2023). This typically involves students completing pre-designed contextual tasks, which include real-life problem scenarios, such as using correct and concise steps to retrieve task-related information and send an email (Xiao et al., 2021). Additionally, virtual gaming scenarios are often employed by researchers, for example, completing binary conversion tasks in a game named ENGAGE (Min et al., 2019). Analyzing the behavioral sequences generated by students as they complete these contextual tasks helps to effectively describe their problem-solving processes in CT, understand their self-regulated thinking in problem-solving, and reflect their potential thinking and cognitive traits, thereby providing more detailed information for CT cultivation (Liu et al., 2019; Fu et al., 2022; Bergner & von Davier, 2019).
Review and The Present Study
Computational Thinking
The concept of CT was first introduced by Papert (1980), who suggested that the computers may enhance the thinking process of human beings and change the patterns of knowledge accessibility. The early definitions of CT typically associated it with programming skills and emphasized that people should have access to computers and they should use the computers for expressing their ideas (Papert, 1996). Over the years, the conceptual connotation of CT has expanded. Researchers generally consider that CT is not exclusive to programmers; instead, it is a basic skill that should be mastered by a broader social group (Grover & Pea, 2013; Tang et al., 2020b). Many researchers associate CT with problem-solving, considering CT to be a general approach for thinking and solving a variety of real-world problems. For instance, Wing (2006) stated that CT refers to the use of thinking ways from computer science to solve real-world problems, design systems, and understand human behavior. Shen et al. (2022) considered CT as a thinking process and practice of using computers or other tools to formulate and solve problems.
In order to cultivate students’ CT, it is necessary to first measure their CT development status. Generally, the studies adopted for assessing the CT development of students are based on question-answering methods, such as programming-based exams (Grover et al., 2015), standardized tests (Jenson & Droumeva, 2016; Peteranetz et al., 2017) and self-report surveys (Jun et al., 2014; Yadav et al., 2014). However, these measures only provide the results of problem-solving, and hardly serve as effective targeted cultivators of CT (Tang et al., 2020b). To find solutions to the same problem, individuals may adopt different strategies and thinking processes, engage in varying degrees of self-regulated learning, and exhibit distinct behavioral paths (He et al., 2021). Even when some individuals arrive at the same answer, their thinking and behavioral processes may reveal subtle differences (Shen et al., 2022). Therefore, it is useful for CT cultivation to collect the data samples comprising complete sequence of students’ behaviors incurred during the process of CT problem-solving and discover the detailed characteristics of different behavioral processes (Liu & Israel, 2022; Shen et al., 2022). Current research typically creates simulated items that mimic real-life scenarios or gamified items to collect students’ behavioral sequences. These two types of items differ only in their context, but are similar in content, both requiring students to complete simulated CT tasks through problem abstraction and decomposition (Anderson, 2016), and their shared goal is to obtain the interactive behavior sequence of the participants.
Revealing Behavioral Processes of CT Problem-Solving
Validation-Oriented Mining Approaches
The previous literature indicates that one renowned type of utilizing behavioral sequences to explore the characteristics of behavioral processes in CT problem-solving is validation-oriented (Xiao et al., 2021). This method subjectively pre-groups the students. The pre-grouping is usually performed based on students’ performance, such as scores, and assumes that students’ behavioral processes within a performance group are homogeneous. The differences in the behavioral processes are then verified between the groups. The validation-oriented pattern mining involves creating a model for each group that corresponds to the local linkage relationships between every two fine-grained behavior-related events. The commonly used validation-oriented modeling methods include hidden Markov models (HMM) (Rabiner & Juang, 1986; Xiao et al., 2021), sequence pattern mining (Kinnebrew et al., 2014; Liu & Israel, 2022), process mining (Juhaňák et al., 2019; Schoor & Bannert, 2012), etc. Xiao et al. (2021) applied HMM to the behavioral sequential data of a CT-related item in the problem-solving technology-rich environment (PSTRE) domain of the program for the international assessment of adult competencies (PIAAC). The authors constructed and compared the latent states of behaviors and patterns of linkage transitions between the states of different achievement groups (correct vs. incorrect). Martinez et al. (2011) employed sequence pattern mining technique in the logs of interactive desktop problem-solving tasks to study the recurring behavioral sequences in high-achieving and low-achieving groups.
The validation-oriented techniques emphasize pre-grouping that inevitably ignores the heterogeneity of the latent group. In addition, establishing local links between actions normally reproduce behavioral transition processes, but are unable to assess the quality of behavioral sequences for problem-solving. There are multiple behavior sequences that may lead to the same result, and even if the result is wrong, the behavior sequence may still be commendable and of high quality (Chen et al., 2020; Fu et al., 2022; Shute et al., 2016). Additionally, the aforementioned works essentially establish models around a specific item, which may lead to the contingent findings. It is possible that if a different item, either more difficult or easier, were chosen, the findings of the study would not hold. In fact, a student may employ different thinking processes when handling items with varying contexts, difficulties, and complexities. The behavioral sequence quality and final performance of the student may be unstable. Therefore, identifying general characteristics of behavioral processes exhibited by students across multiple items of varying difficulty is an important line of inquiry to improve upon previous research. (He et al., 2021).
Exploration-Oriented Mining Approaches
The exploration-oriented techniques are another way to uncover the behavioral processes of CT problem-solving. These methods involve the use of clustering techniques to identify latent student groups with similar behavioral processes. The application of clustering algorithms on behavioral sequences requires pre-defined behavioral features, also known as the process measures (Perera et al., 2008). After mining the latent categories of behavioral processes, the differences in the demographic subgroups as well as performance between categories are compared (Liu et al., 2019), which can provide more insight into the differences between categories and the reasons for their formation. For example, Nasir et al. (2021) performed K-means clustering using 28 features, including the frequency of the deleted behaviors captured by an interactive desktop CT task and identified three latent categories. The further analysis highlights the differences in the performance of nuanced behavioral features between the three categories. Liu et al. (2017) designed a programming game and derived behavioral patterns during the debugging process based on the clustering analysis of different features, including spent time and frequency of compilation operations. The authors discovered the differences between the programming performance based on the clustering results.
Although the works based on clustering methods moved beyond pre-grouping and were able to uncover heterogeneous characteristics of latent behavioral processes, the behavioral features used for clustering usually involved fixed indicators, such as frequency of click, spent time, number of completed tasks (Cheng et al., 2015; Hou, 2012; Liu et al., 2019). The clustering results obtained using only some fixed indicators of specific behaviors may be unilateral as the time-series property of behavioral sequences was not considered and the rich temporal information was ignored. Furthermore, similar to the validation-oriented studies, most exploratory-oriented studies have not considered the quality of the behavioral sequences, nor have they taken into account the general characteristics of the behavioral processes exhibited across multiple items of different difficulties.
Quality of the Cross-Item Behavioral Sequences
Measuring the Quality by Comparison of Student and Expert
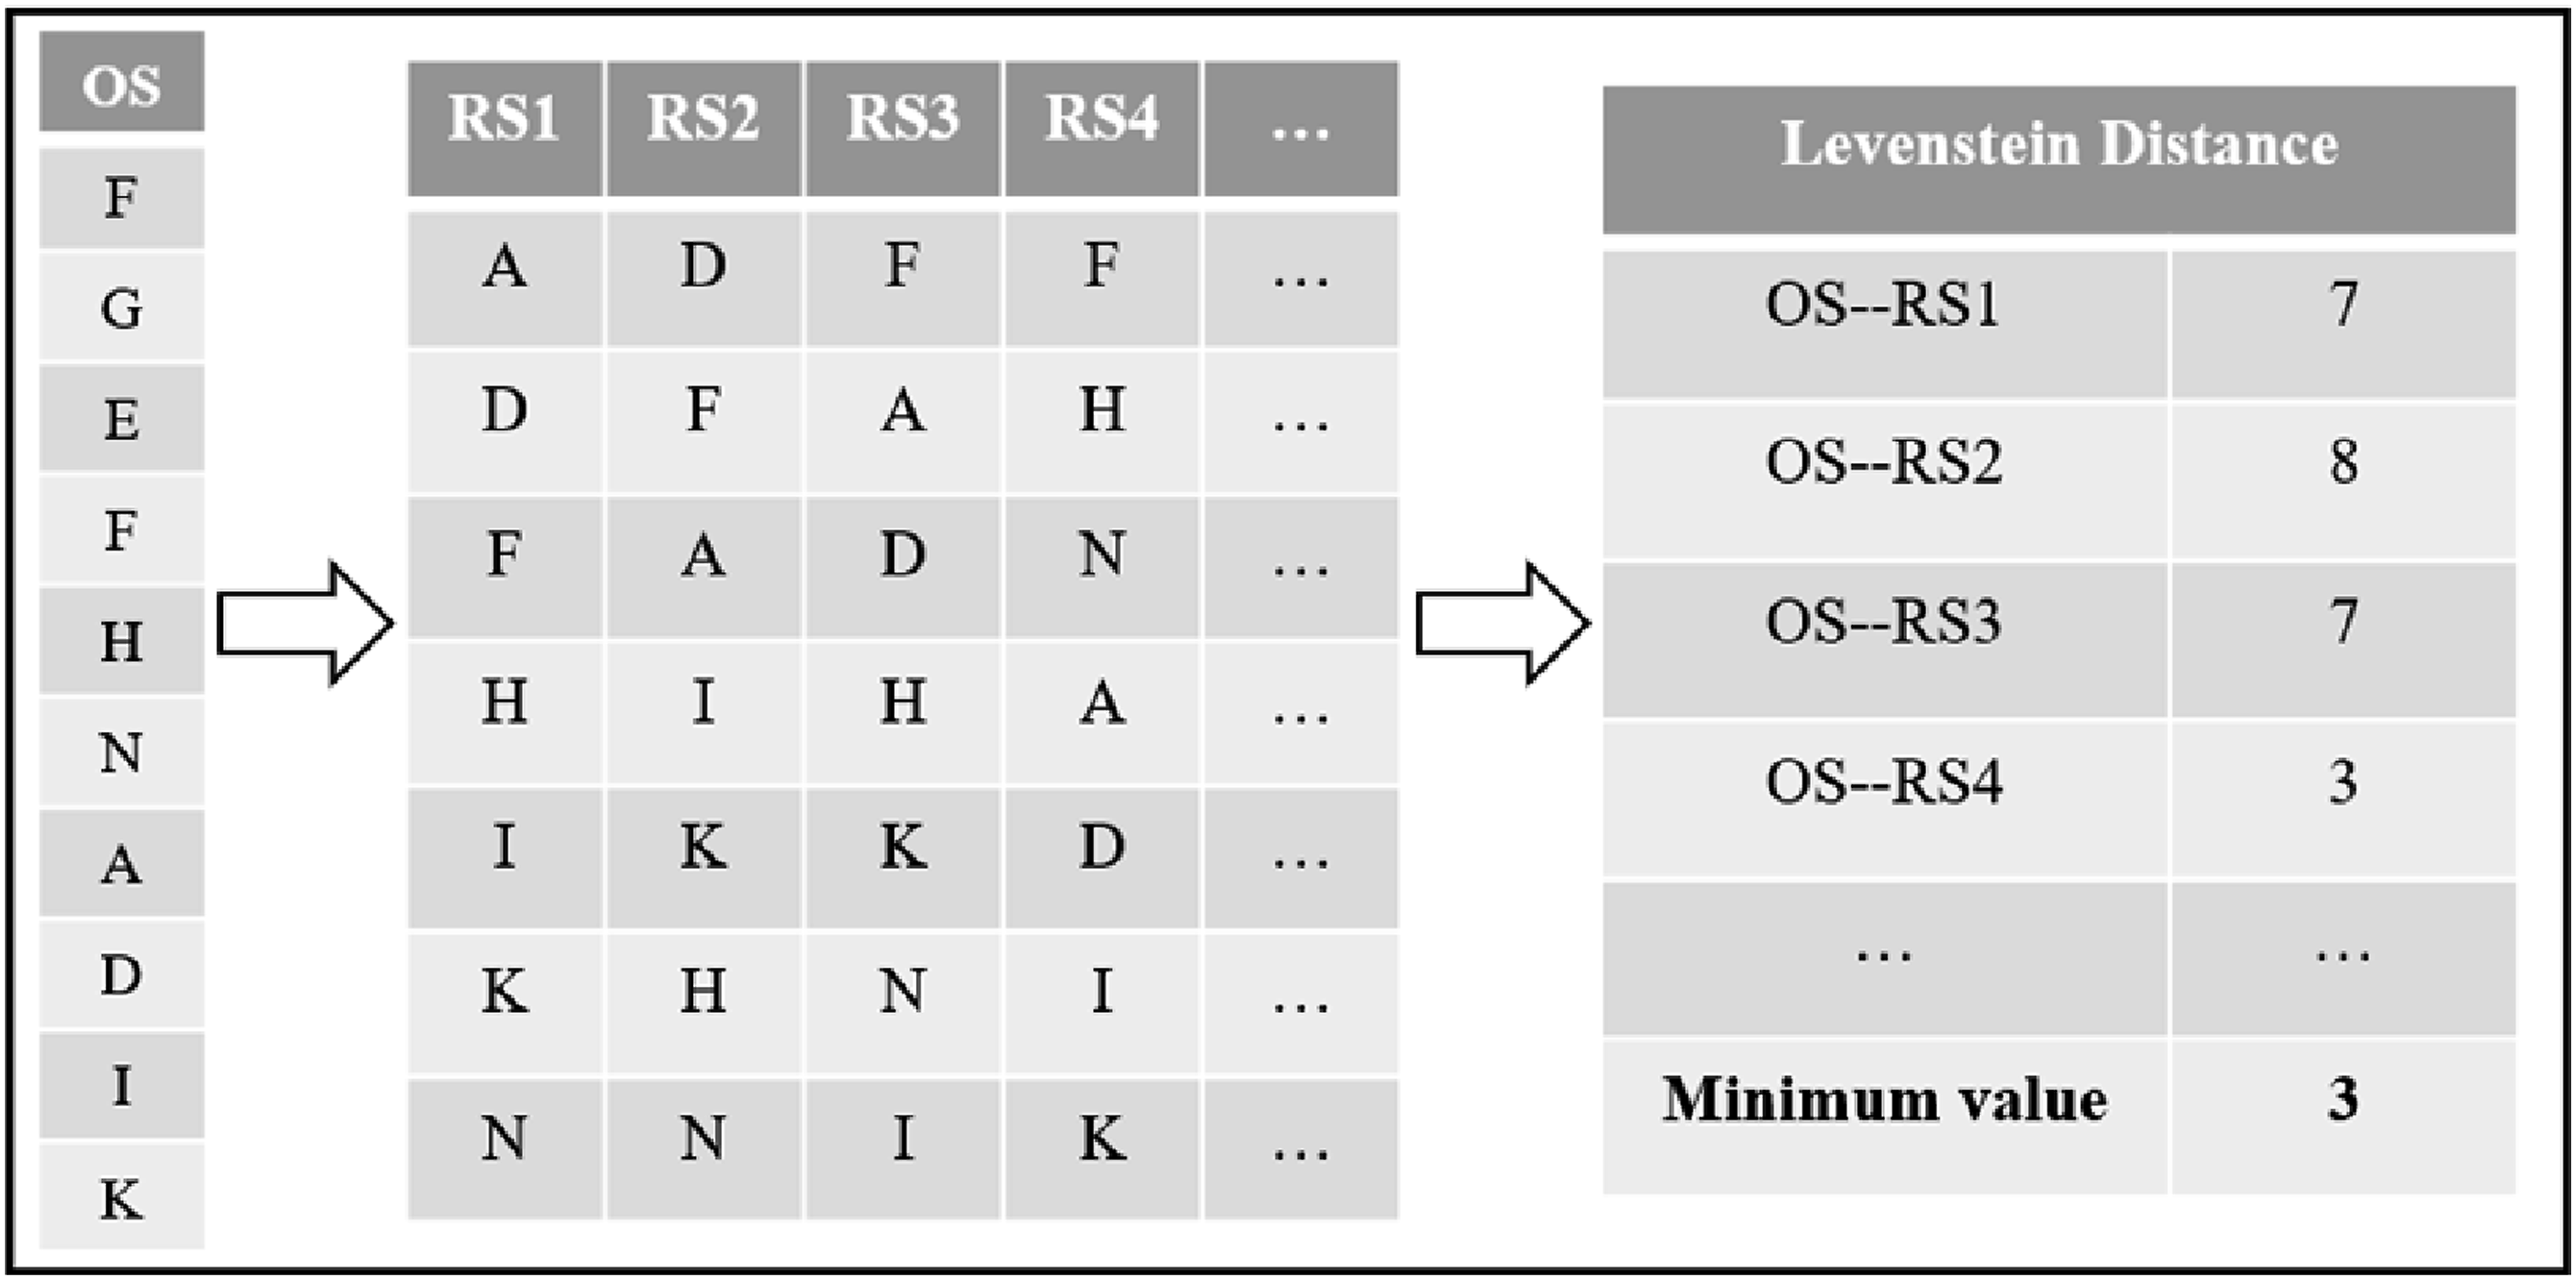
Few recent works have focused on measuring the quality of students’ behavioral sequences acquired during the process of solving problems (Bergner & von Davier, 2019; Tang et al., 2020a). A well-known technique is to compare the differences between the observed student behavior sequences (OS) and the reference expert behavior sequences (RS) (Xiao et al., 2021). OS refers to the actual sequences of operations captured from the students. RS refers to optimal sequences that were predefined by the item developer and subject experts, and they consist of the best way to successfully complete a task. Some works calculated the Levenstein distance between the behavioral sequences of students and experts (Hao et al., 2015; Schulz & Mihov, 2002; Yang et al., 2021). The Levenstein distance refers to the transformation of behavioral sequences into strings. As a result, minimum number of operations, such as modifications, insertions, deletions, etc., are required to transform one string into another string. The smaller distance denotes higher quality of student’s behavioral sequences. Another method, namely longest common subsequence (LCS) finds the behavioral subsequences shared by the students and the experts, and calculates the longest subsequence (He et al., 2021; Hirschberg, 1977). The larger LCS indicates closeness towards the expert’s behavior, i.e., higher quality of the behavioral sequence.
The aforementioned measures used for assessing the quality of behavioral sequences are useful for understanding the process of solving a certain problem by the students as these methods consider the temporal nature of behavioral sequences and provide more insightful and comprehensive indicators. Specifically, using the students’ problem-solving behavioral sequences in an expert problem-solving space for measuring the quality of behavioral sequences can be used to effectively predict the standardized learning gains, explore the difficulties faced by students during problem solving, and potential of open learning environment. These characteristics provide guidance for adjusting the instructional plans.
Constructing Cross-item Quality Indicators
Students’ behavioral and thinking processes may be unstable when facing items with varying cognitive loads. Constructing cross-item quality indicators means exploring the comprehensive characteristics of behavioral processes across multiple items of varying difficulty, which will provide more generalized insights. However, current research, including validation-oriented and exploration-oriented studies, predominantly reveals the characteristics of students’ problem-solving behavioral processes on a single CT item (Jiang et al., 2023; LaMar, 2018). Recently, some researchers have combined the quality of behavioral sequences with the research requirements of cross-item problem-solving, and constructed quality indicators of behavioral sequences that effectively integrate multiple items to characterize the status of students’ problem-solving (He et al., 2021). Firstly, the LCS between the OS and the RS is calculated for each item, leading to the definition of four cross-item indicators (He et al., 2021). The first, similarity, measures the average deviation of the OS from the RS per item, represented as a proportional coefficient; a higher value signifies less deviation. The second, consistency of similarity, gauges the uniformity of these deviations across various tasks, with a lower value indicating stable similarity between OS and RS across items of varying difficulty. This suggests consistent quality in students’ behavioral and cognitive processes. The third indicator, efficiency, akin to similarity in its calculation but has a different connotation, assesses the capability to solve problems in the fewest possible steps, regardless of correctness. When the OS is close in length to the RS, efficiency is higher, however, similarity may be lower due to various incorrect operations. Hence, the ideal behavioral process should be both accurately (with a higher similarity value) and efficiently (with a higher efficiency value). The fourth indicator, consistency of efficiency, evaluates the uniformity in minimizing steps across all items. A lower value of this indicator suggests that students are capable of maintaining the stability of the absolute difference in the number of behaviors between the OS and RS across items of varying difficulties.
The aforementioned indicators fully utilize temporal information in the behavioral sequences, achieving cross-item measurements of the quality of behavioral sequences from both accuracy and efficiency perspectives. They also enable the assessment of the stability of the quality of behavioral sequences across items of varying difficulty. However, research exploring behavioral processes categories and their characteristics based on these cross-item quality indicators is still scarce. Consequently, there is a lack of further research on demographic differences and specific item performance differences between the categories. The further exploration of potential CT problem-solving behavioral processes is of significant value, as it can offer new insights into understanding students’ thinking and cognitive characteristics. This, in turn, can prompt educators to modify their teaching plans, thereby facilitating CT learning for each student with different behavioral processes.
The Present Study
This study aims to refine the methods for analyzing behavioral processes in CT problem-solving. Current validation-oriented methods do not account for the latent classes of behavioral processes, while exploration-oriented methods, though identifying these classes, neglect the temporal richness of behavioral sequences. This oversight can result in spurious or uninterpretable clustering results. Additionally, both approaches have failed to assess the quality of behavioral sequences, often missing out on the general characteristics of behavioral processes across items of varying difficulty. Recent literature introduces methods that leverage cross-item quality measures of behavioral sequences, but these have yet to be applied to uncover latent classes of behavioral processes. It is worth noting that the identification of latent classes is typically exploratory and descriptive, aiding in class differentiation but not in understanding the reasons behind these differences. Therefore, following the identification of latent classes, previous studies have examined demographic subgroup differences (Nasir et al., 2021) and specific behavioral performance variances (Liu et al., 2019) to uncover more nuanced inter-class differences and their underlying causes. Accordingly, this work will also investigate the demographic backgrounds and behavioral performance of students within different latent classes of behavioral processes to uncover the unique characteristics of these latent classes.
This work uses the cross-item quality indicators of behavioral sequences as features to perform clustering and to uncover the latent classes of behavioral processes in CT problem-solving across different difficulties. Afterwards, this work further analyzes the differences in the latent classes in terms of demographic subgroups and the behavioral performance during the problem-solving. This will reveal potential differences and characteristics of students’ behavioral processes across diverse CT items. Finally, this work connects the latent classes of behavioral processes in CT problem-solving with students’ levels of external CT tests in order to explore the predictive effects of behavioral processes on academic performance. The main research questions focused in this work are presented below.
What latent classes of behavioral processes in CT problem-solving can be revealed and what are the characteristics of each?
Are there any demographic differences in the latent classes based on students’ gender, grade level, and parental education level?
What are the differences in the behavioral performance of students in problem-solving across latent classes?
Do behavioral performance, quality indicators, and latent classes of behavioral processes effectively predict the CT levels of students?
The Proposed Method
Materials
There are two tools used in this study. First, several gamified CT items with varying levels of difficulty and operational rules, whose game log systems enable us to easily record students’ behavioral sequences. Second, a CT standardized test, whose results represent the CT levels of students.
Gamified CT Items
The gamified CT items used in this work are a part of our previous work regarding game design and development (Author, 2022). The previous work was aimed at developing an assessment game based on information literacy for elementary and middle school students. In this game, the students take on the role of GuoGan, i.e., an elementary school student, and solve 14 information literacy-related questions on an “Azure Star” adventure to rescue a mermaid princess. Among them, three interactive items are used to examine CT. Figure 1 presents various interfaces of the game and brief descriptions of the three items used in the proposed work. These three items were designed by experts in the field of CT with the intention of having clear differences in difficulty. The Forest Maze item is the easiest, followed by the Magic Stone item, with the Magic Potion item being the most challenging. Subsequently, these items were reviewed by additional experts to ensure the gradient of difficulty and content validity. The game is designed to provide students with help options, gold coins, and a pass-card mechanism. The students are rewarded with different number of gold coins based on their performance in each item. Initially, the students can freely use the help feature once, when they make an incorrect answer. Afterwards, they can spend the gold coins for seeking help. The old coins are deducted upon clicking the help button. If a student answers incorrectly twice, they receive a pass-card and are required to exit the current item. The three gamified CT problem-solving items used in this work.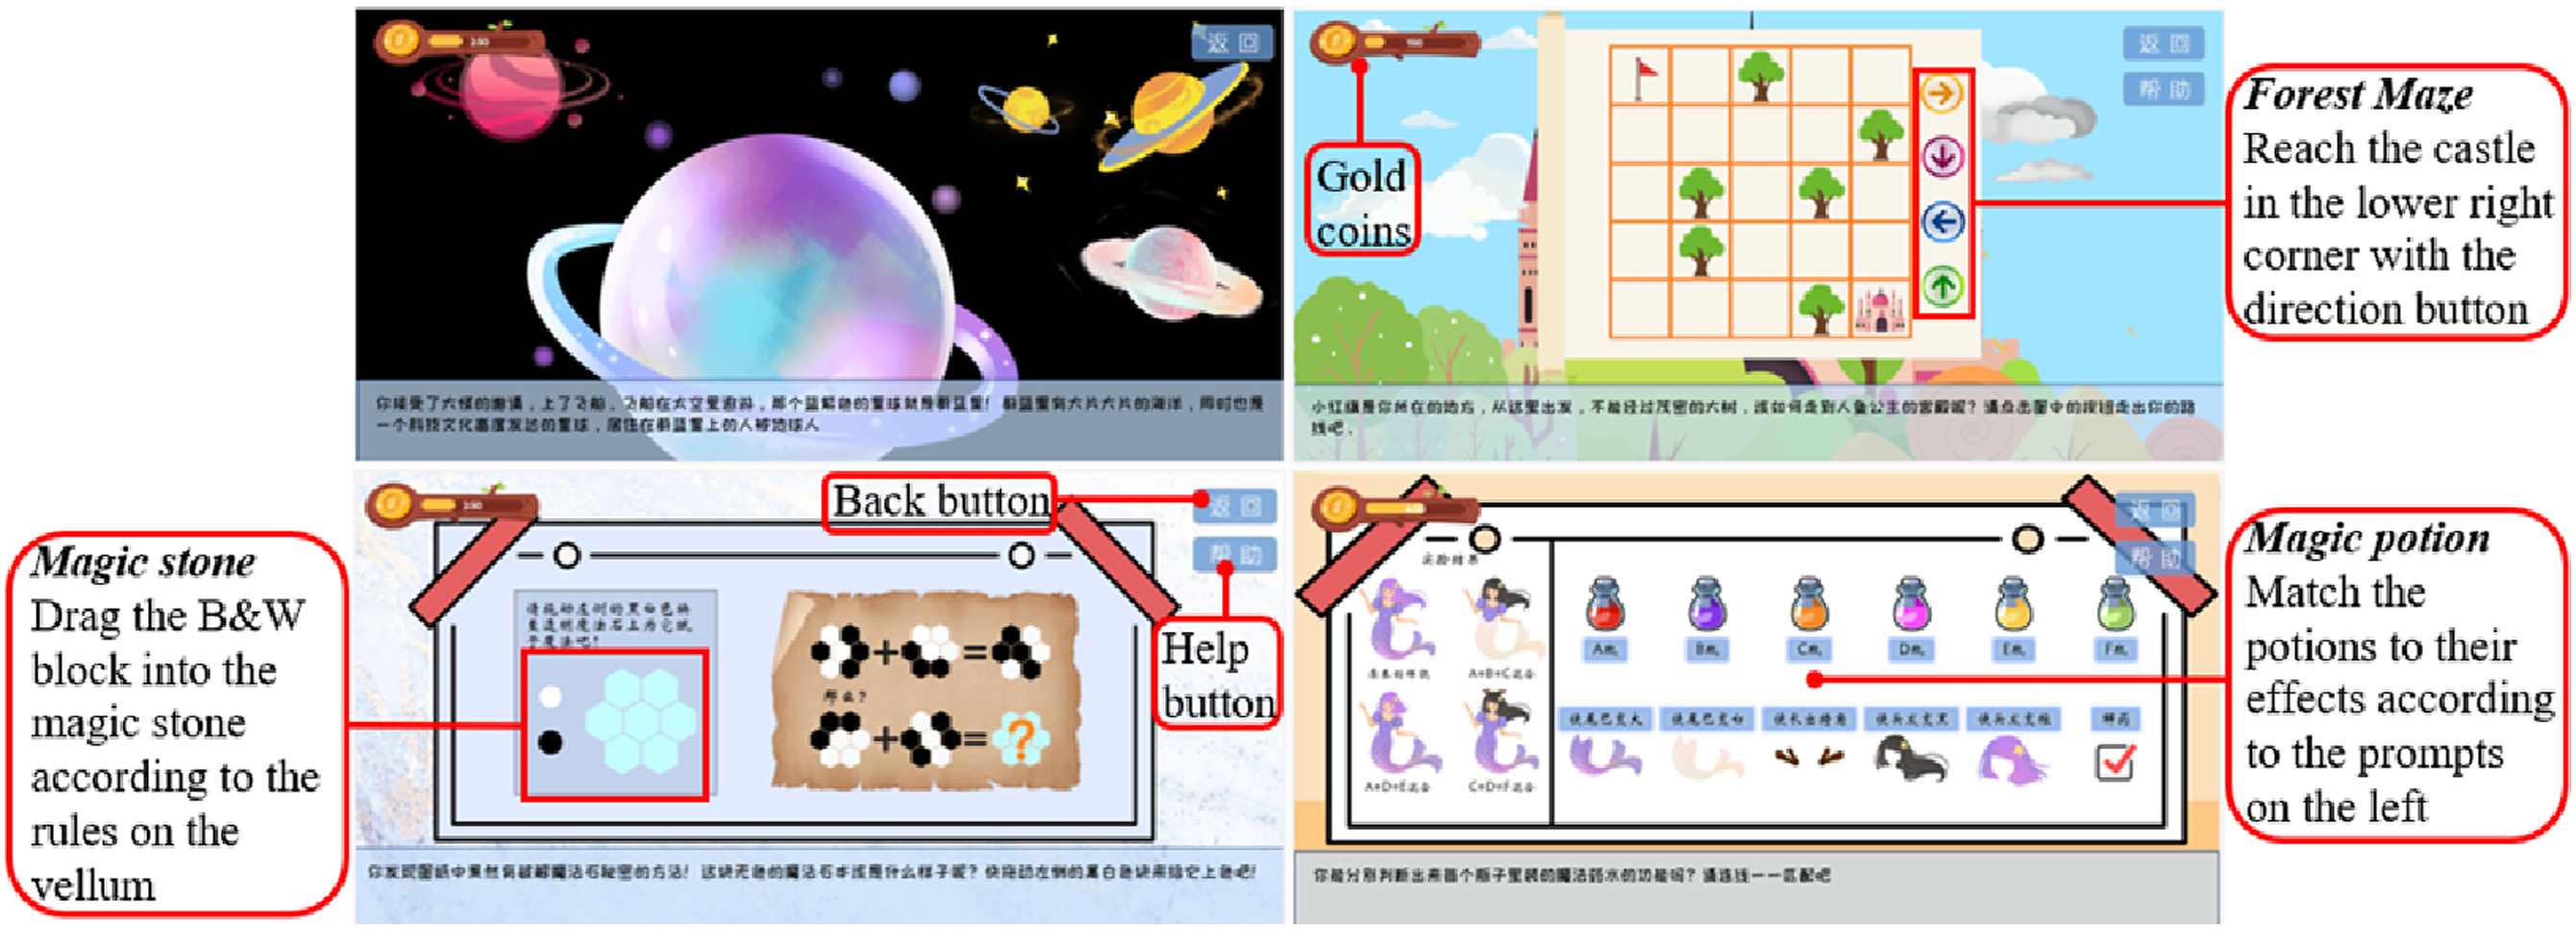
Standardized Test of CT Level
The CT standardized test used in this work is derived from a standardized test based on the information literacy level of students (Zhu et al., 2020). The test content has been validated by multiple rounds of expert validation, using the Delphi method. The test content is finalized after the experts agree on the revised version of the content to be measured by the items. This standardized test has been widely adopted in primary and middle schools throughout 31 provinces in mainland China. The corresponding results have been tested by using the Rasch model to ensure high reliability and validity (Wu et al., 2020). There are six multiple choice items involving CT in the complete information literacy standardized test. These six items are used in this work to assess the CT levels of students.
Participants and Procedure
This study is conducted in one elementary school and one middle school located in Wuhan economic and technological development zone, China. The selected elementary and middle schools are well represented in the dominant as the CT level of students were ranked “medium” in the previous information literacy assessments. In this work, four classes in grade 4 (G4) of the elementary school and five classes in grade 8 (G8) of the middle school are randomly selected for sampling. There are 138 G4 students and 175 G8 students who agreed to participate in this study. These students are receiving unified information technology education in school and have experience with digital learning and gamified learning, making them suitable for selection as participants in this study. Based on game completion, we remove the samples that are not complete in terms of all the three CT items for satisfying the subsequent clustering analysis and eliminate the possible bias due to the missing results. Finally, 256 samples comprising 124 G4 students (57 males and 67 females) and 132 G8 students (66 males and 66 females) are included in the analysis.
Each class is asked to complete the game items and standardized tests in a designated computer laboratory. First, the instructor restates the content and purpose of the assessment, explaining that the data will not breach the privacy of any individual participating in this study and will only be used for performing academic research. Then, a Web site link that contains all the CT standardized tests is sent to the participants. The students are required to fill out four demographic items after clicking on the link, which is followed by the actual test. The four demographic items include grade (G4:1, G8:2), gender (FEMALE: 0; MALE:1), father’s education level (FATEDU), and mother’s education level (MOMEDU) (Primary school: 0; Junior high school: 1; Senior high school: 2; Junior college: 3. Undergraduate: 4; Master’s degree: 5; Doctoral degree: 6). After submitting the test, the hyperlink to the game items automatically appears on the screen, and the students have to click the hyperlink for starting the game. The entire study lasted for a full lesson, i.e., approximately 35 minutes.
Data Storage
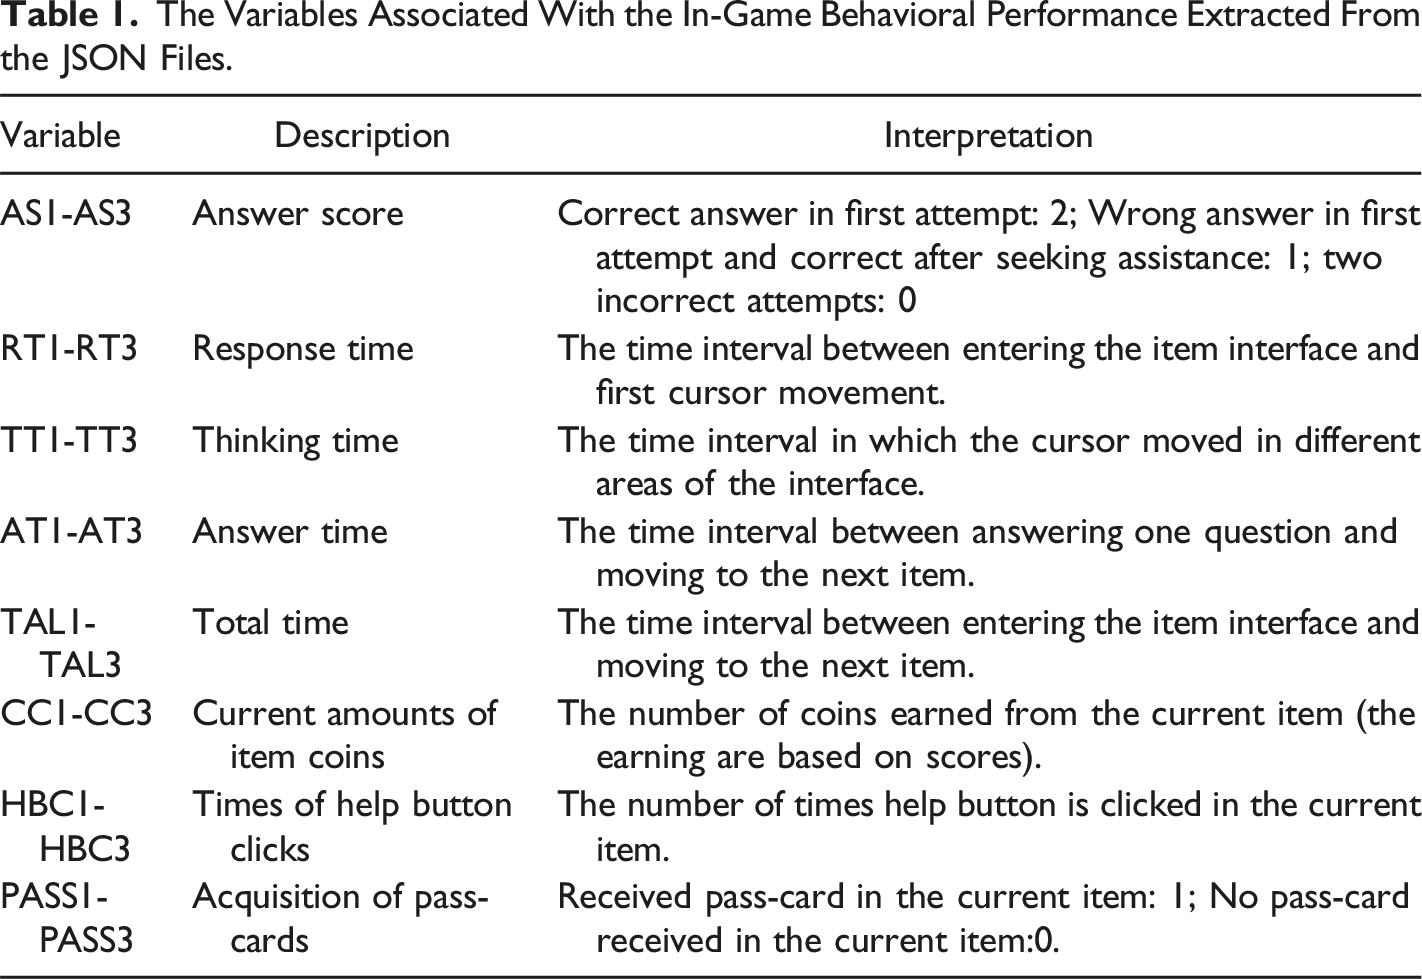
We design a framework for storing the log data using the experience application programming interface (xAPI). The xAPI describes the behavior of students in terms of unified statements based on eight attributes: student profile, actor, context, task, verb, object, tool, and timestamp. The xAPI uses JavaScript’s format object representation (JSON) for creating statements. Figure 2 presents an example of xAPI-based data stored in JSON format. Table 1 summarizes the variables extracted from the JSON file, which are relevant to the in-game behavioral performance of the students. An example of xAPI-based data stored in JSON format. The Variables Associated With the In-Game Behavioral Performance Extracted From the JSON Files.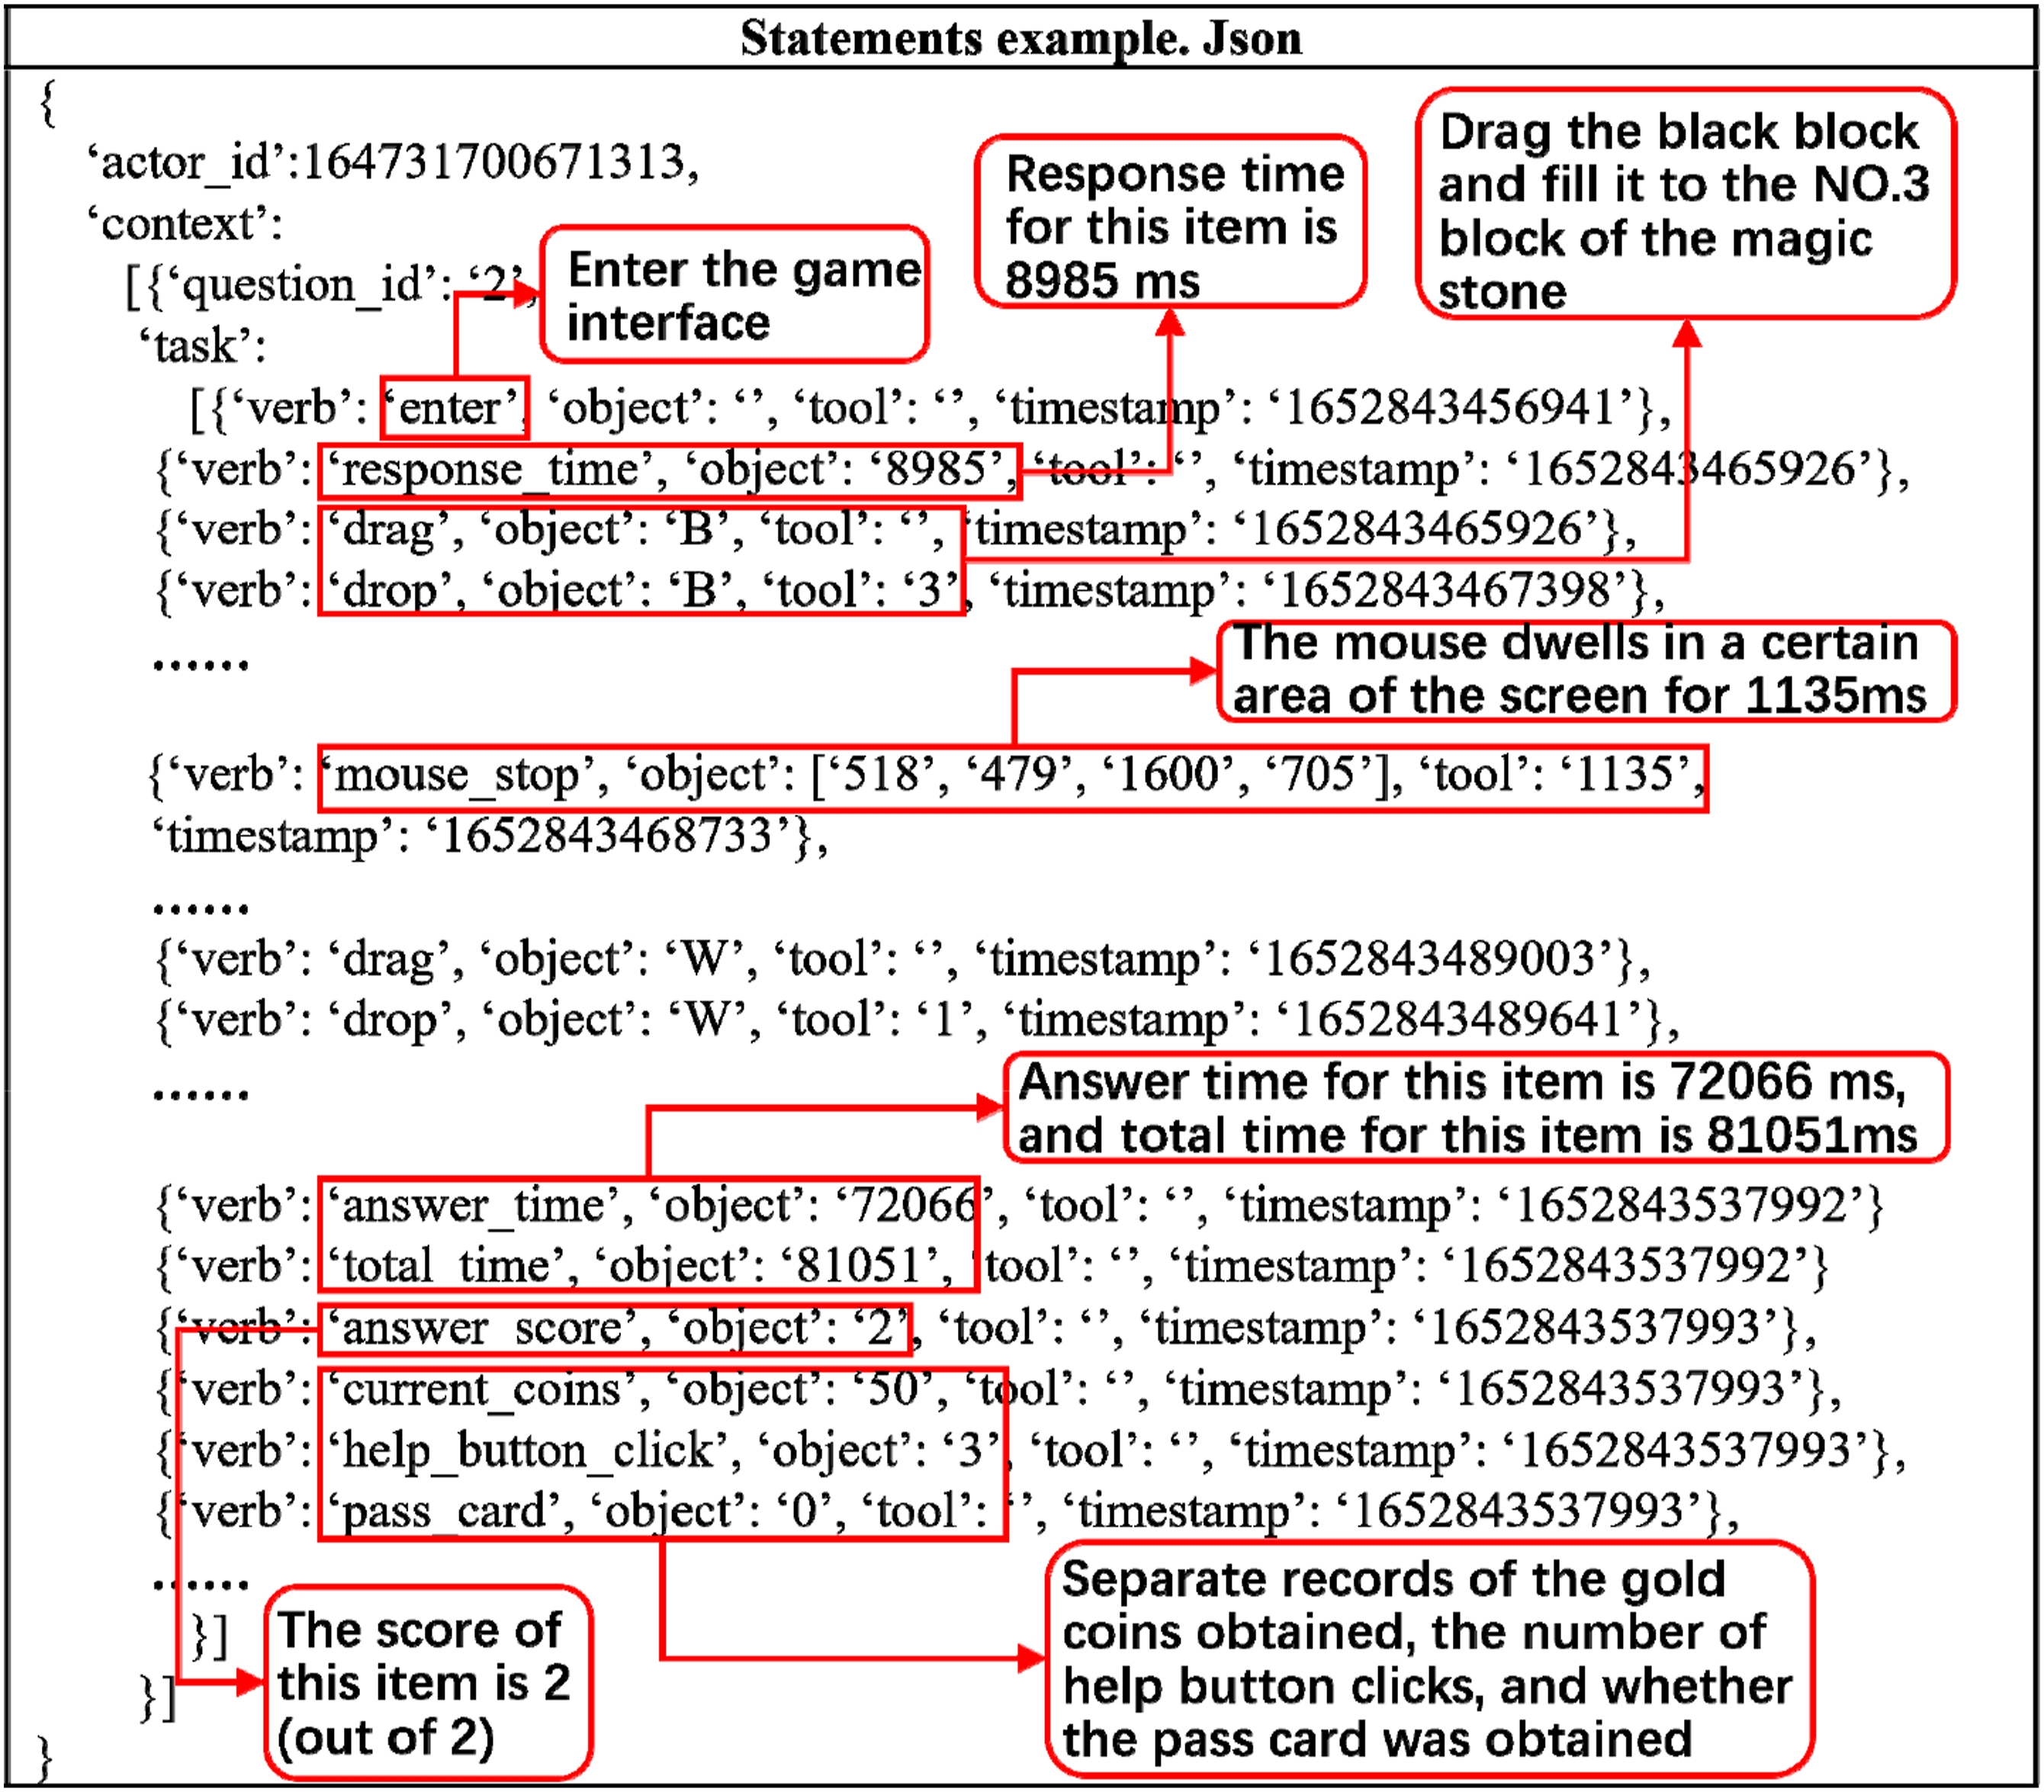
Construction of Cross-Item Indicators
Calculating the Levenstein Distance
In this work, Levenstein distance between the students and experts is selected for estimating distances as the length of behavioral sequences is relatively short, and using the LCS method may not differentiate the students effectively. In the three interactive CT items considered in this work, each movement of a student through the maze, e.g., move_left, each complete drag and tug, e.g., dragBdrog3, and each complete click and line, e.g., click2line3, are considered as separate behaviors. An example of the calculation process of the Levenstein distance using the Magic Stone item is presented below. Since the Magic Stone item requires dragging two color blocks into seven blank blocks, there are a total of 14 possible operations. These 14 operations are converted to characters individually, and afterwards, OS and RS are replaced with strings. The conversion process is presented in Figure 3. Among them, OS is transformed from the JSON files of students’ behaviors recorded by xAPI, while RS is the optimal response pre-determined by experts, representing the complete and correct behavioral sequence with no repetitions or errors. Since the item does not require an order of actions, students can choose any order in which to drag the color blocks and fill the magic stones. Therefore, to ensure the reliability of subsequent calculation of Levenstein distance, it is necessary to perform a complete permutation on RS after the string conversion, to obtain all correct RS with different permutations. The student’s OS may be closest to a specific RS permutation. Then, the Levenstein distance between OS and each RS in full permutation is calculated cyclically, and the minimum value is regarded as the final estimate of distance. The computation process of Levenstein distance is presented in Figure 4. For the Forest Maze item, there are three correct sequence paths that can lead to the endpoint, all of which are considered as RS. Since the behavior in this item is directional and cannot be reversed, there is no need for the RS to be permutated as in the other two items. In the calculation, each student’s OS is compared one-to-one with the three RS, and the Levenstein distance is calculated for each comparison. The minimum value is selected as the final measure of the behavioral sequence distance. The process of transforming behavioral sequences into strings. The calculation process of Levenstein distance.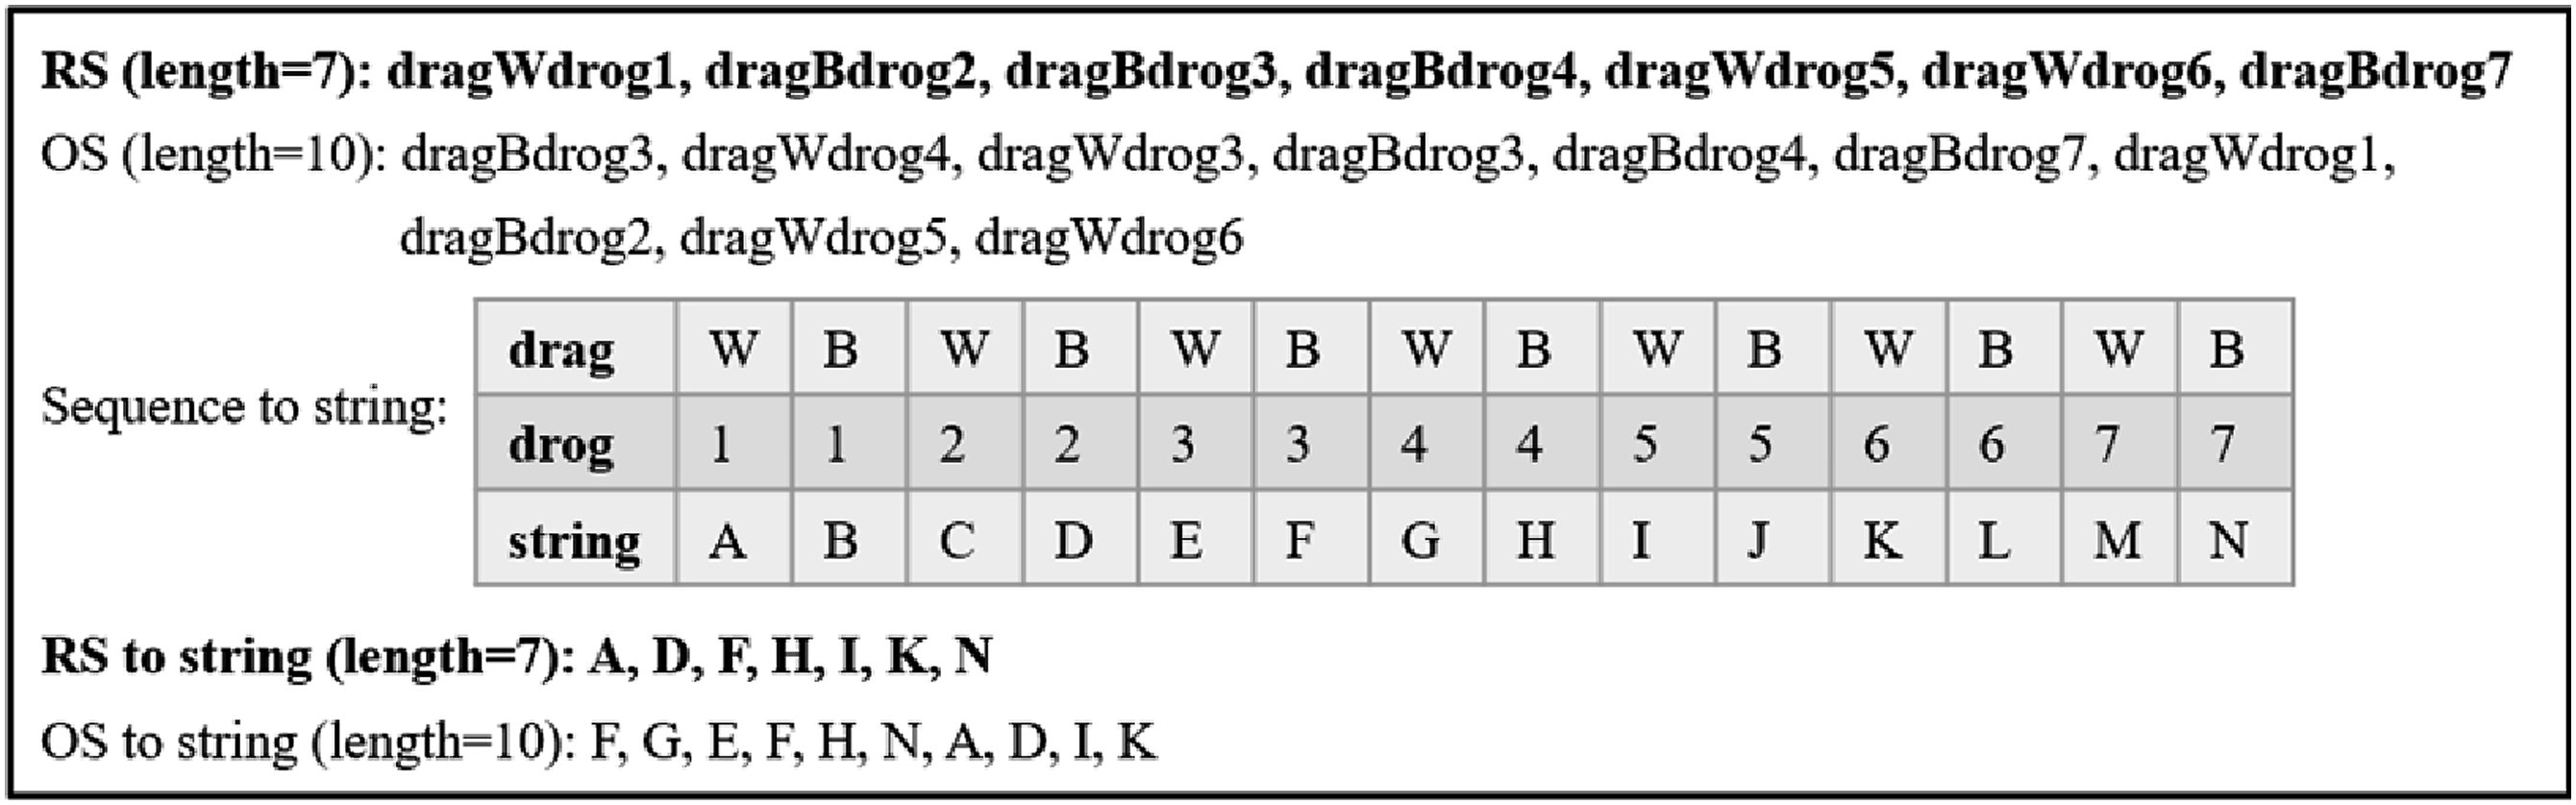
Constructing Cross-item Indicators
Considering the work presented by He et al. (2021), this study constructs a set of cross-item quality metrics for assessing the behavioral sequences, including similarity, consistency of similarity, efficiency, and consistency of efficiency. As mentioned above, these four indicators assess the quality of behavioral sequences from the perspectives of accuracy (related to similarity indicators) and efficiency (related to efficiency indicators). Therefore, these are indicators with distinct meanings. The following section will provide a detailed explanation of the calculation methods and the significance of the numerical values of these indicators.
Similarity and Consistency of Similarity
For each item, similarity is defined as the ratio of the length of RS, i.e., len(RS), to the sum of RS and Levenstein distance, i.e., len(Levenstein)+len(RS). We compute the mean value of students’ similarity (SM) across the three CT items as the cross-item similarity. It is an indicator of the accuracy of behavioral sequences, describing whether students, on average, closely follow the RS during the problem-solving process. A higher value of SM denotes stronger average similarity. However, due to the varying difficulty levels of the three items, students with different CT levels may exhibit varying degrees of stability in their performance across the items. This means that students with a lower SM value may also exhibit behavioral processes close to the RS on a certain or some items. To describe this stability, the standard deviation of similarity (SSD) for the three items is recorded as the consistency of similarity, depicting whether students maintain consistent similarity on each item. A larger SSD value indicates weaker consistency of similarity, suggesting that students are more likely to exhibit behavioral processes with significant quality differences across items of different difficulties.
Efficiency and Consistency of Efficiency
The similarity-related indicators mentioned above are constructed based on the Levenstein distance between behavioral sequences, measuring the accuracy of students’ behavioral processes. Another set of indicators is developed from the absolute number of actions in behavior sequences, used to assess whether students’ behavioral processes are efficient. For each item, efficiency is defined as the ratio of the length of RS, i.e., len(RS) to the length of OS, i.e., len(OS). We calculate the mean value of students’ efficiency (EM) across the three CT items as the cross-item efficiency. This indicator represents whether students’ behavioral processes are efficient, i.e., on average, whether the absolute number of actions taken is as close as possible to the length of the RS. A higher EM value indicates higher average efficiency. Similar to the SSD indicator, the standard deviation of efficiency (ESD) for the three items is considered as the consistency of efficiency. It signifies whether students maintain consistent efficiency across each item. A larger ESD value suggests weaker consistency of efficiency, implying that students may exhibit varying efficiency across items of different difficulties.
In addition to the four aforementioned indicators, this work also constructed a mean scoring rate (SR) indicator based on the scores of students obtained for each item, i.e., variables AS1-AS3 presented in Table 1, for characterizing the mean performance of the students on the three CT items. It is meaningful to consider the performance along with the quality indicators of behavioral sequences as it enables us to understand the relationship between the process and the outcome in problem-solving, thus making the mined latent classes of behavioral processes in CT problem-solving more interpretable.
Data Analysis
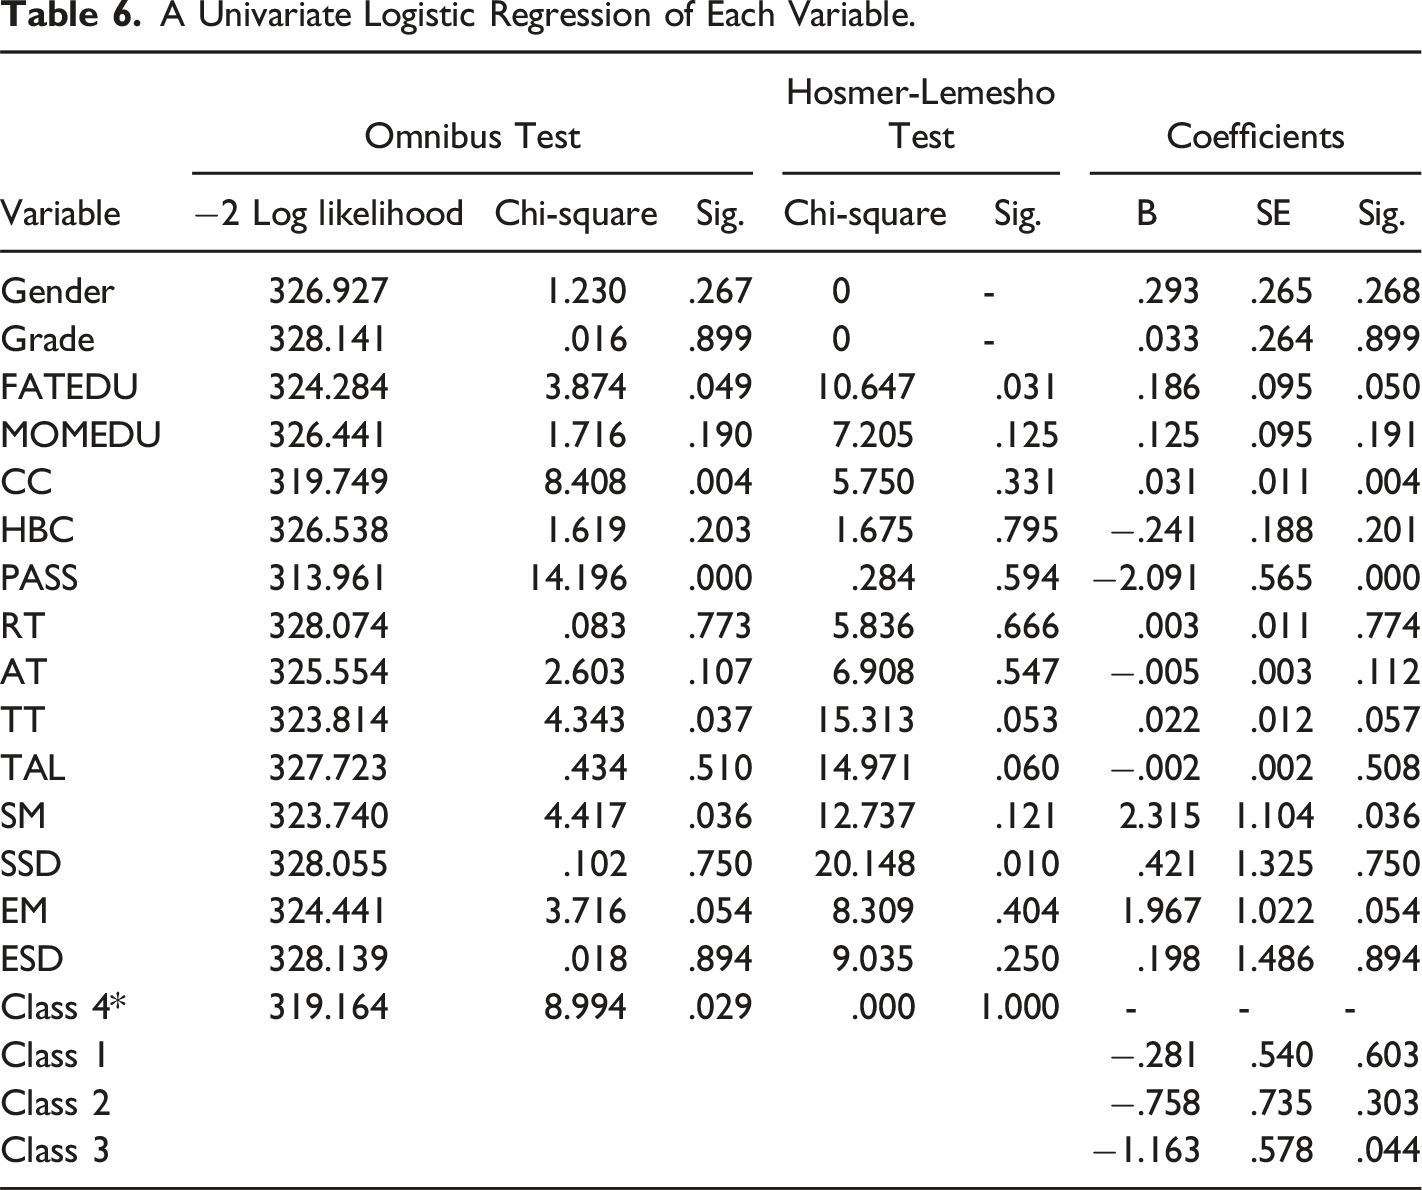
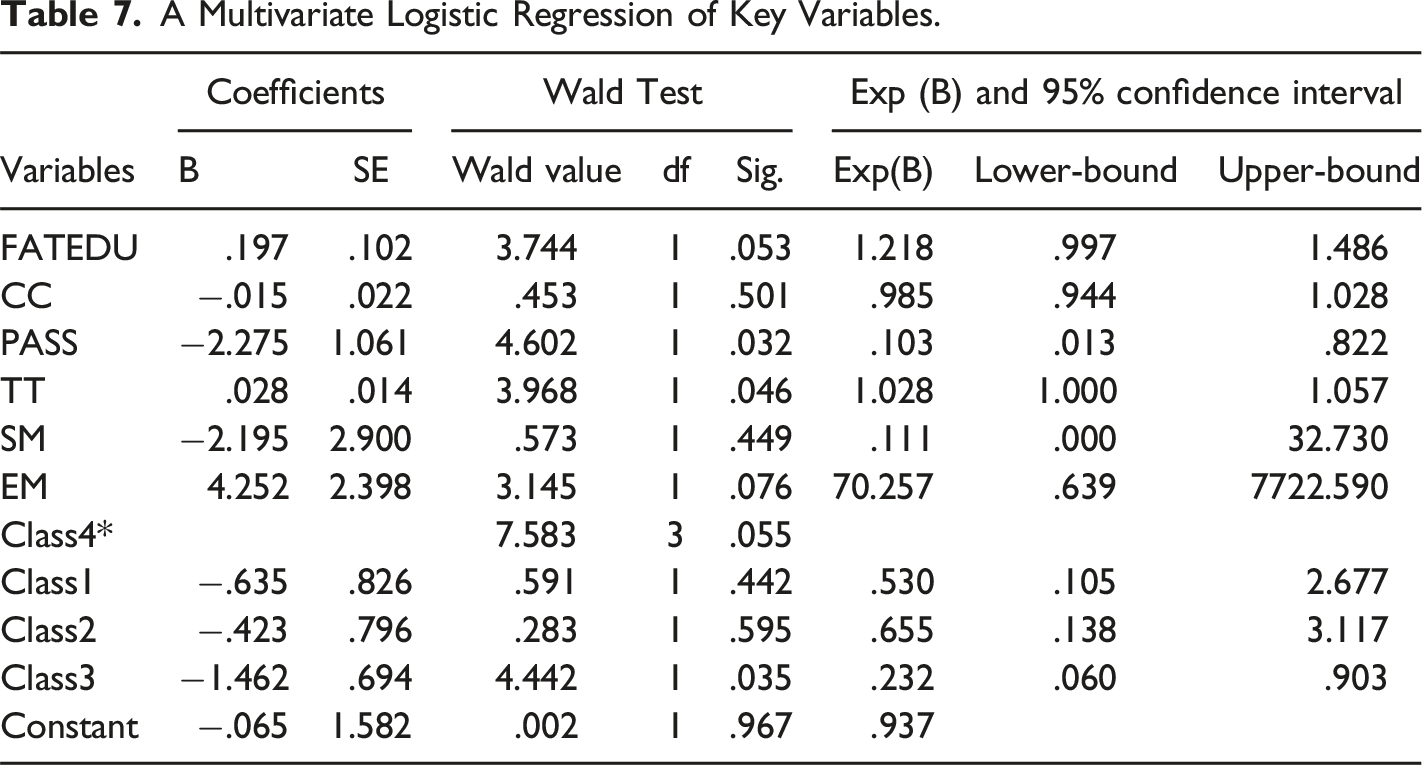
The data analysis performed in this work is divided into the following five steps. (1) R is used to compute the Levenstein distance between behavioral sequences of students for each CT item. The similarity and efficiency are further calculated to compute four cross-item quality indicators, namely SM, SSD, EM, and ESD. We also compute the SR indicators. (2) For RQ1, the latent profile analysis (LPA) is executed using Mplus7 for obtaining the latent classes of behavioral processes in CT problem-solving. LPA is a statistical procedure used to identify the latent heterogeneity classes present in the samples (Hagenaars & McCutcheon, 2002). In this work, the clustering features used for LPA contain four cross-item quality indicators of behavioral sequences, namely SM, SSD, EM, and ESD), and one cross-item mean scoring rate indicator, namely SR. We use the maximum likelihood robust (MLR) as the estimation method, and multiple evaluation metrics are adopted to jointly determine the optimal number of latent classes. (3) For RQ2, chi-square tests available in the SPSS25 environment are used to detect the differences caused on the basis of gender or grade for each latent class of behavioral processes in CT problem-solving. The one-way ANOVA tests are used to analyze whether there exist any differences in the parental educational levels among latent classes. (4) For RQ3, one-way ANOVA tests available in the SPSS25 environment are used to analyze the differences in the behavioral performance of students among different latent classes, specifically game acquisition (current number of item coins, number of times the help button is clicked, and the acquisition of pass-cards) and game time (response time, thinking time, answering time, and total time). (5) For RQ4, K-means clustering is applied on the results corresponding to the CT standardized tests of students and different CT levels are delineated based on cluster centers. The K-means clustering reflects that having two levels is the most appropriate choice (when there are three or more levels, some of the levels are not representative due to their small size). Therefore, we divided the students into two CT levels, i.e., high and low levels. We then performed univariate logistic regressions on demographic factors, game performance variables, quality indicators of behavioral sequences, and various latent classes of behavioral processes (treated as dummy variables) using CT levels of students as the dependent variable. Finally, the variables with statistically significant univariate logistic regression results are selected for inclusion in a multivariate logistic regression model to systematically measure the predictive effect of each factor on the students’ CT levels. Both K-means and logistic regression are applied using SPSS25.
Results
What latent classes of behavioral processes in CT problem-solving can be revealed and what are the characteristics of each?
In order to determine the optimal number of latent classes, we first estimate a single-class LPA model, and then gradually increase the number of classes to compare and select the most appropriate model. The following statistical metrics are used to examine and compare the models: (1) information criteria, including Akaike information criterion (AIC), Bayesian information criterion (BIC), and sample-size adjusted Bayesian information criterion (ABIC). Lower values of the information metrics imply a better fit (Weller et al., 2020); (2) entropy, an indicator of model classification quality (an entropy above 0.8 denotes an acceptable model quality) (Celeux & Soromenho, 1996); (3) Lo-Mendell-Rubin adjusted likelihood ratio test (LMR), which provides the significance tests to detect significant quality differences between models with various numbers of classes (an LMR value less than 0.05 indicates that the next model with one more class significantly outperforms the previous model) (Lo et al., 2001); (4) A synthesis of theoretical interpretability and the Occam’s Razor principle. Some researchers have pointed out that the selection of multiple models in practice may depend on sampling results, and the final choice cannot be fully determined by quantitative statistical results (Preacher & Merkle, 2012). Specifically, when selecting the best model, one must consider both the Occam’s Razor principle, which advocates for the simplest model, and the practical interpretability of multiclass statistical models (Wit et al., 2012). This comprehensive analysis results in a model that is both statistically significant and practically meaningful, and thus, in research, it is often preferred to choose a model with statistically suboptimal result but stronger interpretability (Preacher & Merkle, 2012).
The Performance of LPA Models for Different Number of Classes.
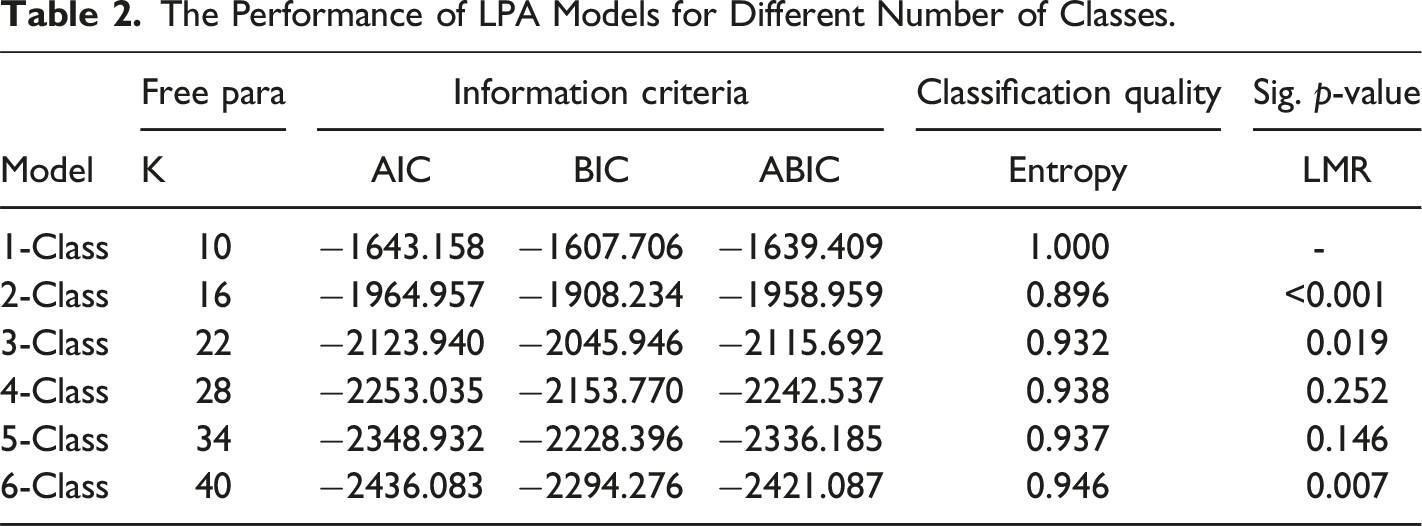
Figure 5 presents four different types of behavioral processes that students exhibit when solving multiple computational problems. The initial parsing is presented below. Further revelations about the characteristics of these classes will be discussed after the subsequent analysis of the research questions. The four classes of CT patterns.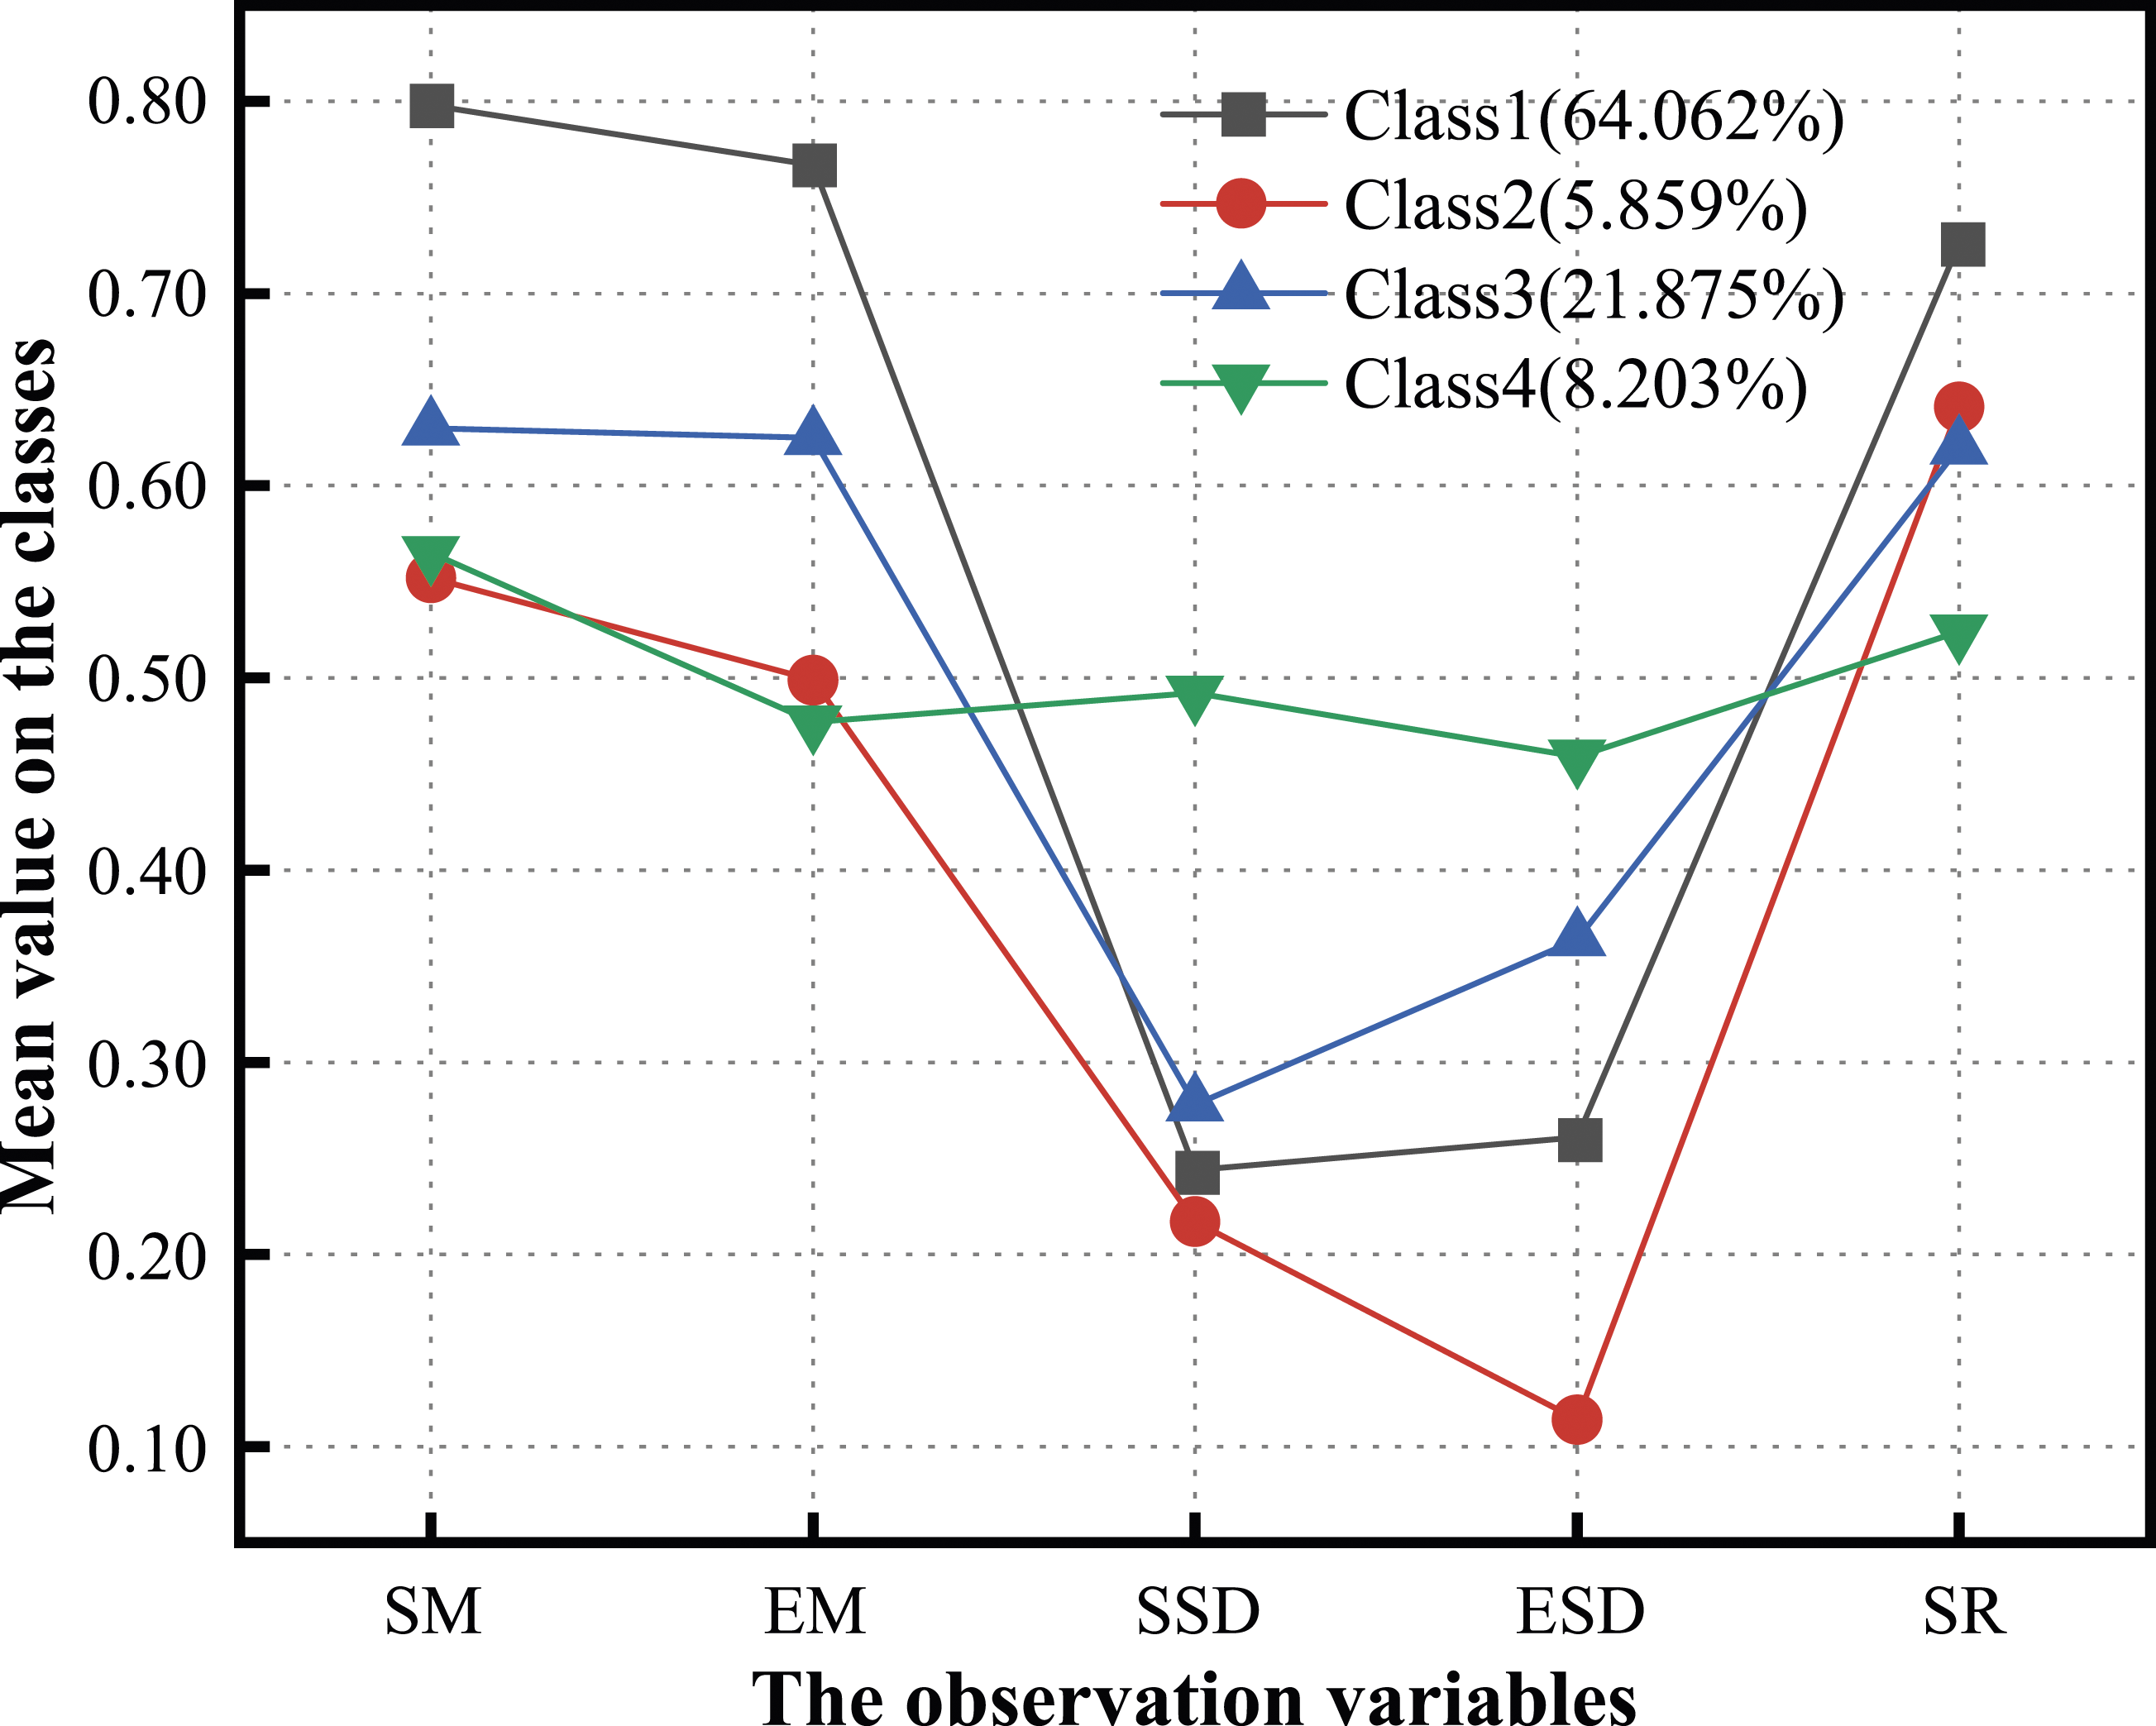
Class 1
The average values of SM and EM for students in this class are both above 0.7 (with the EM value slightly lower than the SM value), higher than those of the other three classes. This suggests that students in class 1 generally exhibit both accuracy and relative efficiency in their behavioral sequences when solving multiple CT items. In terms of consistency, the SSD value of class 1 is relatively low compared to other classes, while the ESD value is at a relatively moderate level. This indicates that students in class 1 can maintain a generally high level of accuracy in their behavioral sequences across items of different difficulty levels, with their efficiency being also generally satisfactory. Among the four classes, students in class 1 have the highest average SR (greater than 0.7), indicating that they demonstrate high quality, high efficiency behavioral sequences on multiple CT items with positive outcomes. It can be concluded that students in this class are a group with an overall superior performance in CT problem-solving.
Class 2
Students in class 2 have relative low SM and EM values for their behavioral sequences across the three CT items (with the EM value slightly lower than the SM value). This indicates that the average accuracy and efficiency of this class of students in solving multiple CT items of varying difficulty are both poor. As for the consistency indicators, the SSD value (approximately 0.2) and ESD value (approximately 0.1) of the students in class 2 are the lowest compared to the other classes. This suggests that the accuracy and efficiency of students in class 2 are consistently poor across all items, regardless of the difficulty. Surprisingly, however, despite the unexceptional quality of the behavioral sequences, students in class 2 were in a relatively good position to find out the results of their item responses (SR values greater than 0.6). Although the high-quality behavioral sequences of students in class 1 resulted in accurate response results, the presence of students in class 2 implies that the quality of the behavioral sequences does not necessarily reflect whether the final results are correct or not. Further analysis of students’ performance within the items will explain the unique characteristics and causes of this particular class.
Class 3
The average SM and EM values for students in class 3 are slightly above 0.6, placing them in the middle of the four classes. This suggests that the accuracy and efficiency of students’ behavioral sequences in this class are at an intermediate and acceptable level when solving multiple CT items. In terms of consistency, the SSD value (approximately 0.3) for class 3 students is relatively low, while the ESD value (slightly below 0.4) is at a higher level compared to the other three classes. This indicates that students tend to exhibit similar accuracy level across different difficulties. However, the consistency of their efficiency is affected by the item difficulty. Students in class 3 may spend fewer number of actions on some items and more on others. Finally, the average result of class 3 students in completing the three items is similar to that of class 2, with an SR value slightly above 0.6.
Class 4
Students in class 4 exhibited almost the lowest SM values (below 0.6) and EM values (below 0.5), similar to those of class 2. This indicates that the average accuracy and efficiency of this class of students in behavior sequences are both poor. Interestingly, the SSD and ESD values (both close to 0.5) of the behavioral sequences of these students across the three items are the highest among the four classes. This suggests that students in class 4 may exhibit unstable accuracy and efficiency in their behavior sequences due to differences in item difficulty, meaning they do not consistently perform poorly across all difficulty levels. Finally, in terms of the outcomes, the performance of students in this class is also the worst (with an SR value slightly above 0.5).
Are There Any Demographic Differences in the Latent Classes Based on Students’ Gender, Grade Level, and Parental Education Level?
The results of the chi-square tests for gender and grade levels are presented in Figure 6. For each latent class, the distribution of males and females is relatively balanced and no significant gender differences are observed. Regarding grade level, it is observed that the percentage of G8 students in class 1 is significantly higher than that of the G4 students, while the percentage of G4 students in class 4 is significantly higher than that of the G8 students. This is an obvious result, as the CT skills of students in G4 have not been fully developed, and there are necessarily more G4 students G8 students in class 4. Our subsequent research assumes that there is a correlation between an individual’s latent class of behavioral processes and their own in-game performance, and that an individual’s behavioral sequence quality and latent class of behavioral processes reflect their own CT level. Therefore, grade differences do not affect further analysis at the individual level. Chi-square tests used for estimating gender and grade level differences among all CT patterns. F & M indicate female and male. G4 & G8 indicate grade 4 and grade 8.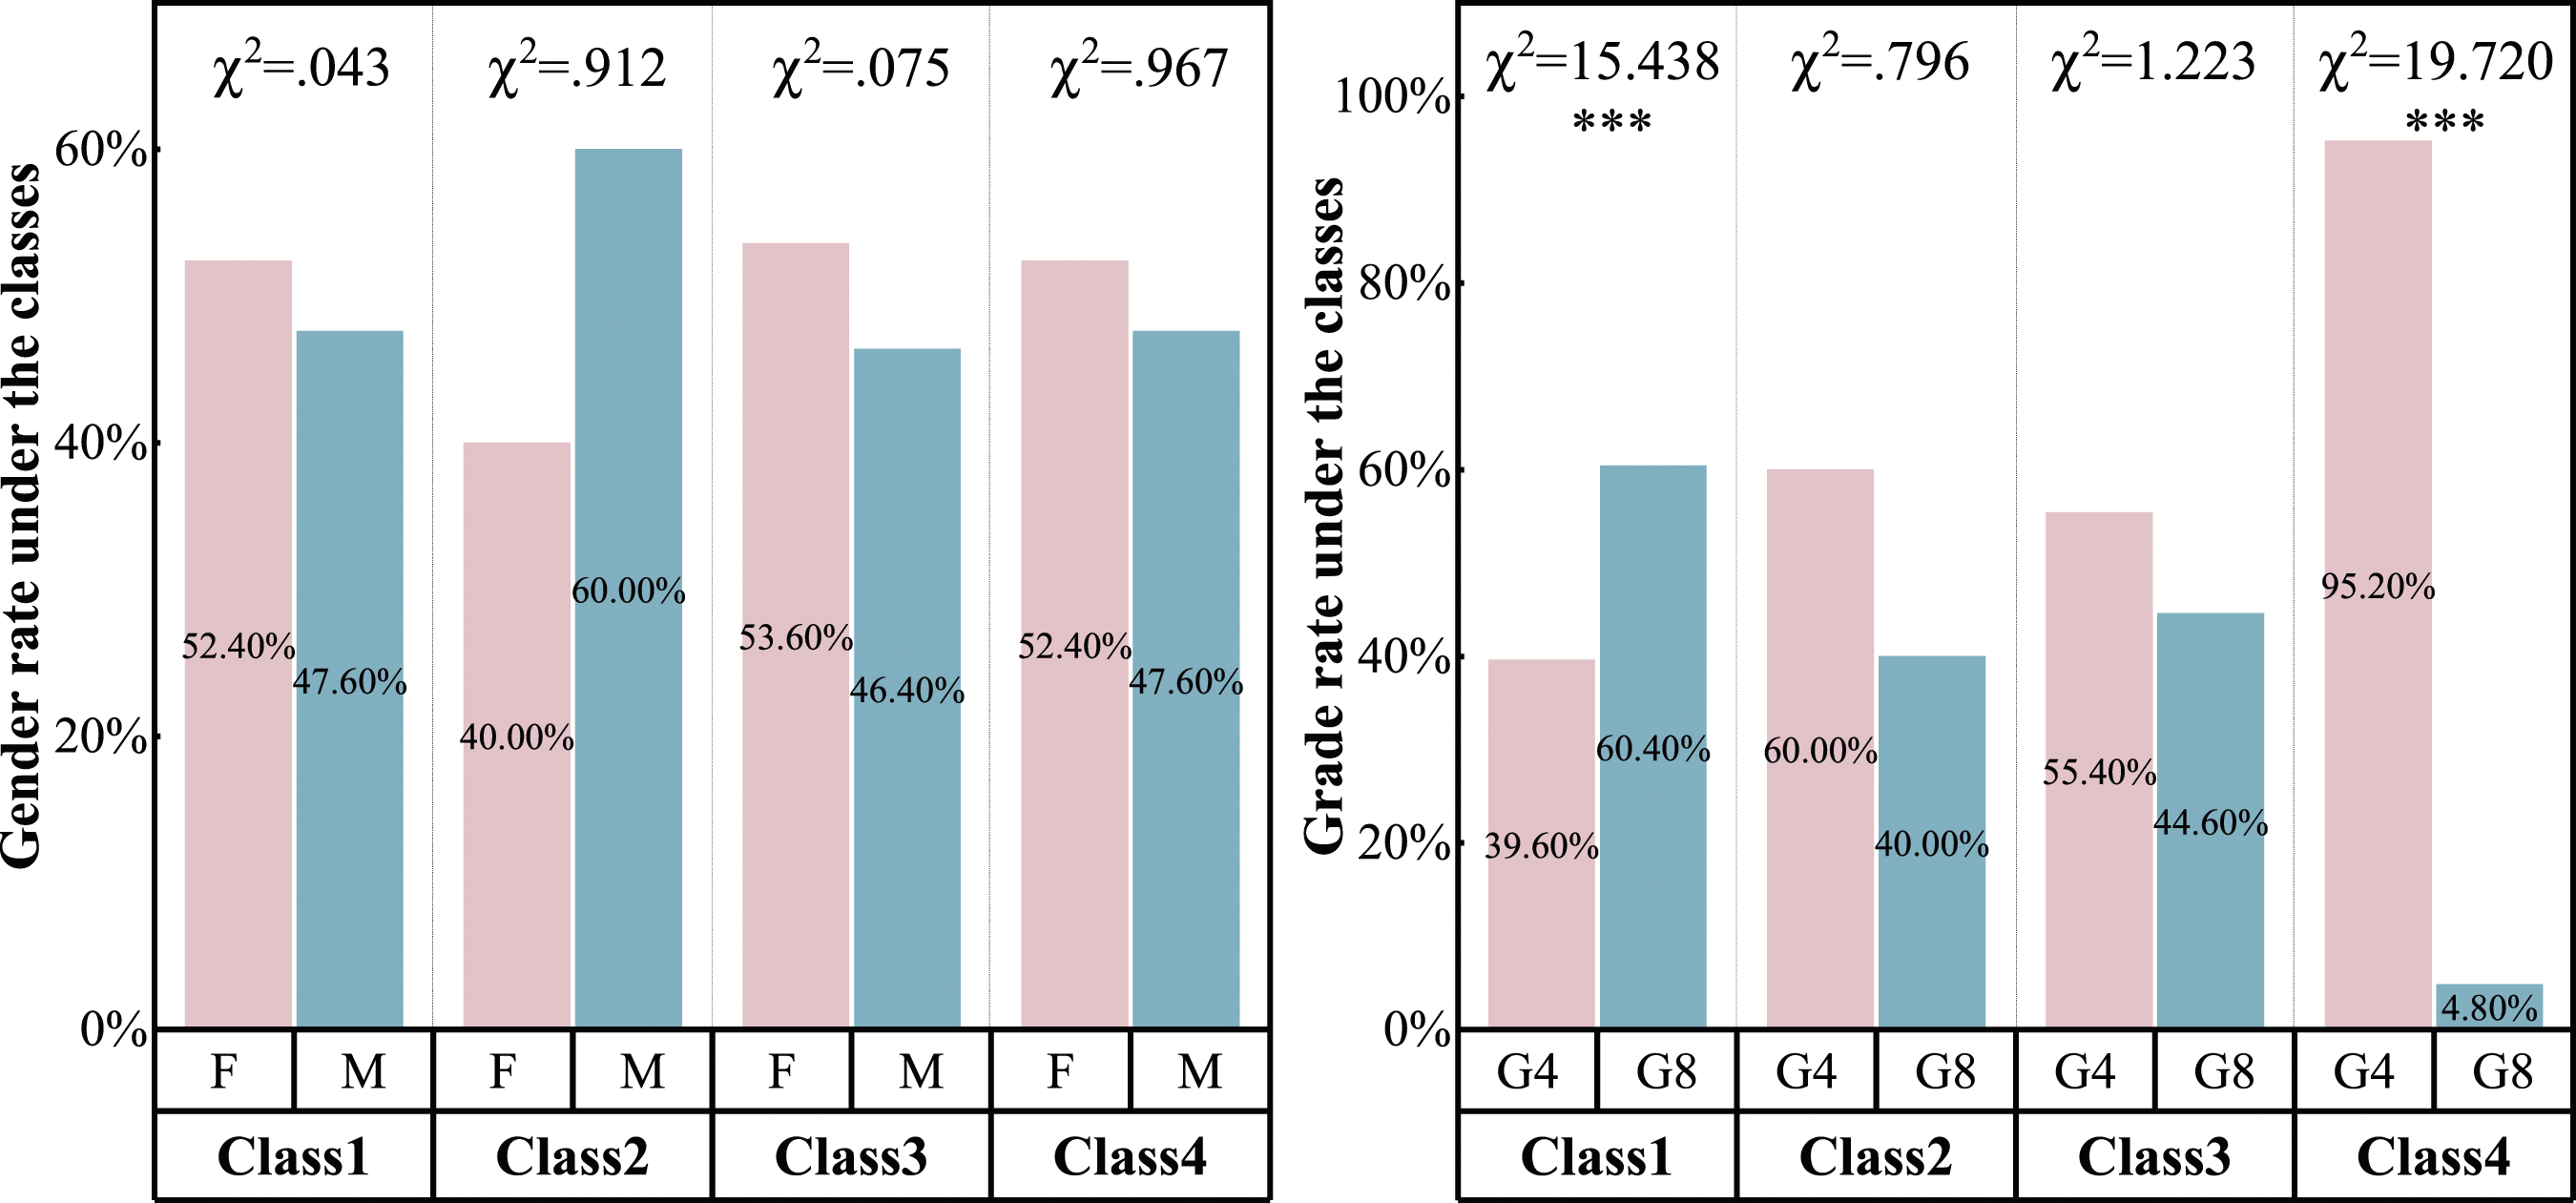
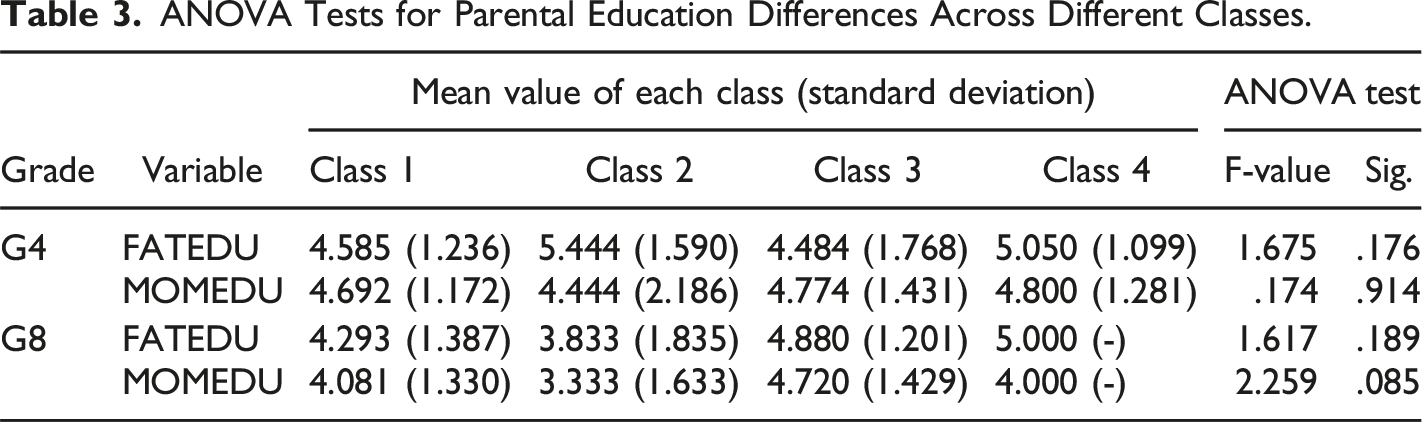
ANOVA Tests for Parental Education Differences Across Different Classes.
What Are the Differences in the Behavioral Performance of Students in Problem-Solving Across Latent Classes?
ANOVA Tests for Game Acquisition Differences Across Different Classes.
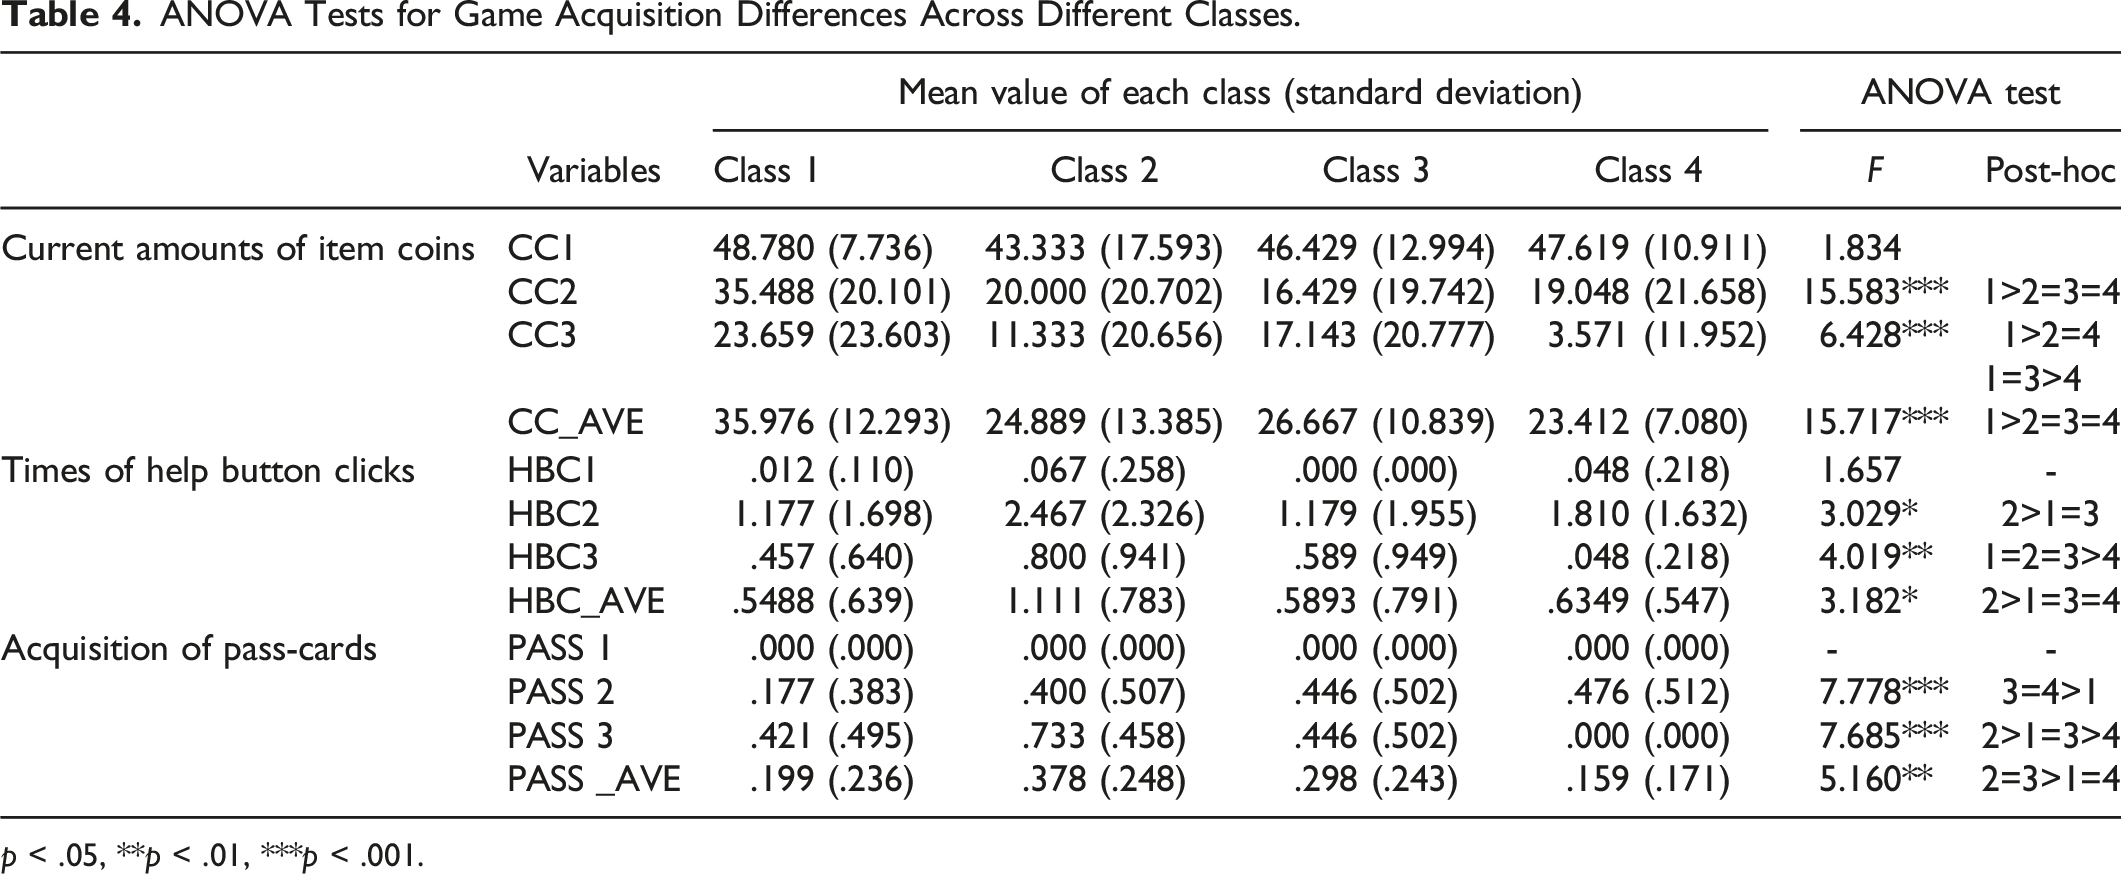
p < .05, **p < .01, ***p < .001.
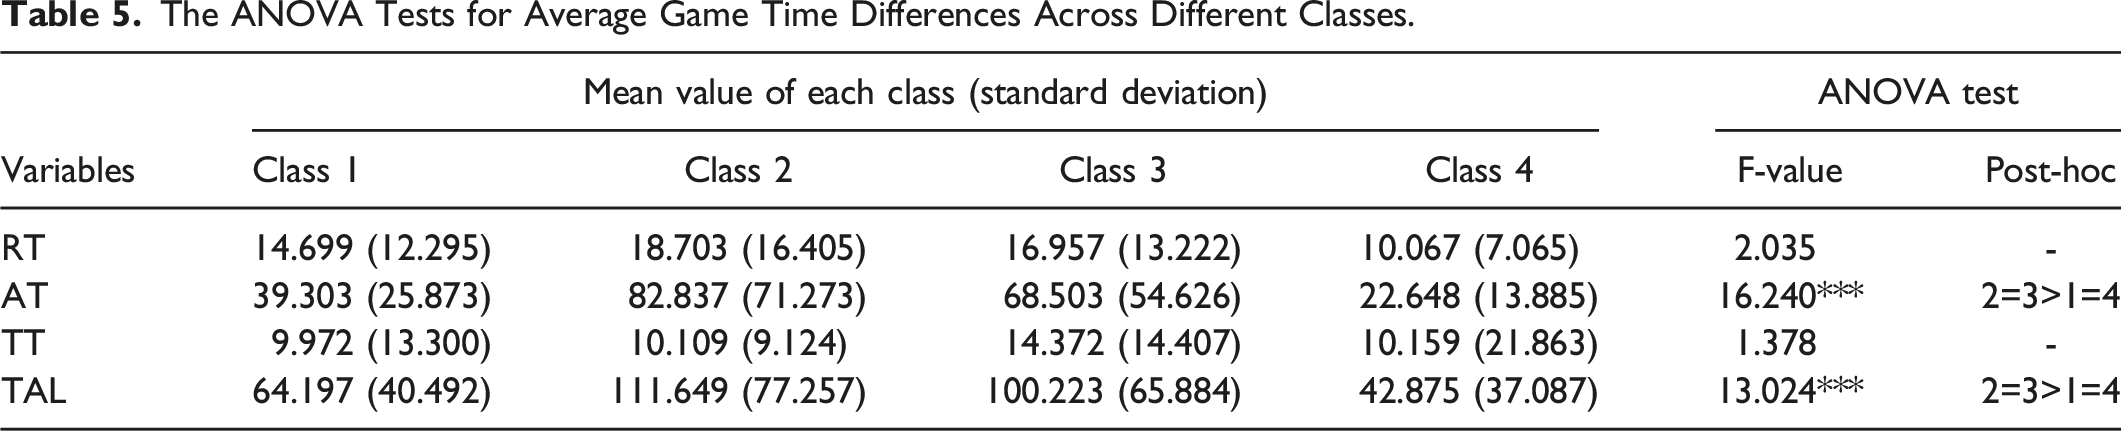
The results of the one-way ANOVA tests applied on game time variables for each item are presented in Figure 7. The results of the one-way ANOVA tests for average time variables for all items are presented in Table 5. The students in class 2 have a significantly higher response time on item 3 (magic potion) as compared to other classes. On the other hand, there is no significant difference in the classes for the average response time of the three items. In terms of answer time, the students in class 2 spent significantly more time on item 1 (Forest Maze) and item 3, the students in class 3 spent significantly more time on item 2 (Magic Stone), and the students in class 2 and class 3 spent significantly more time as compared to the other classes. The students in class 3 spent significantly more thinking time on item 2 as compared to other classes, while there is no significant difference in the classes in terms of average thinking time for all the three items. In terms of total time, the students in class 3 spent significantly more time on item 2 and the students in class 3 spent significantly more time on item 3, with no difference in the average spending between these two classes on the three items and significantly more than the other classes. The ANOVA tests for analyzing the game time differences across different classes. C1 - C4 indicate Class 1 - Class 4. The ANOVA Tests for Average Game Time Differences Across Different Classes.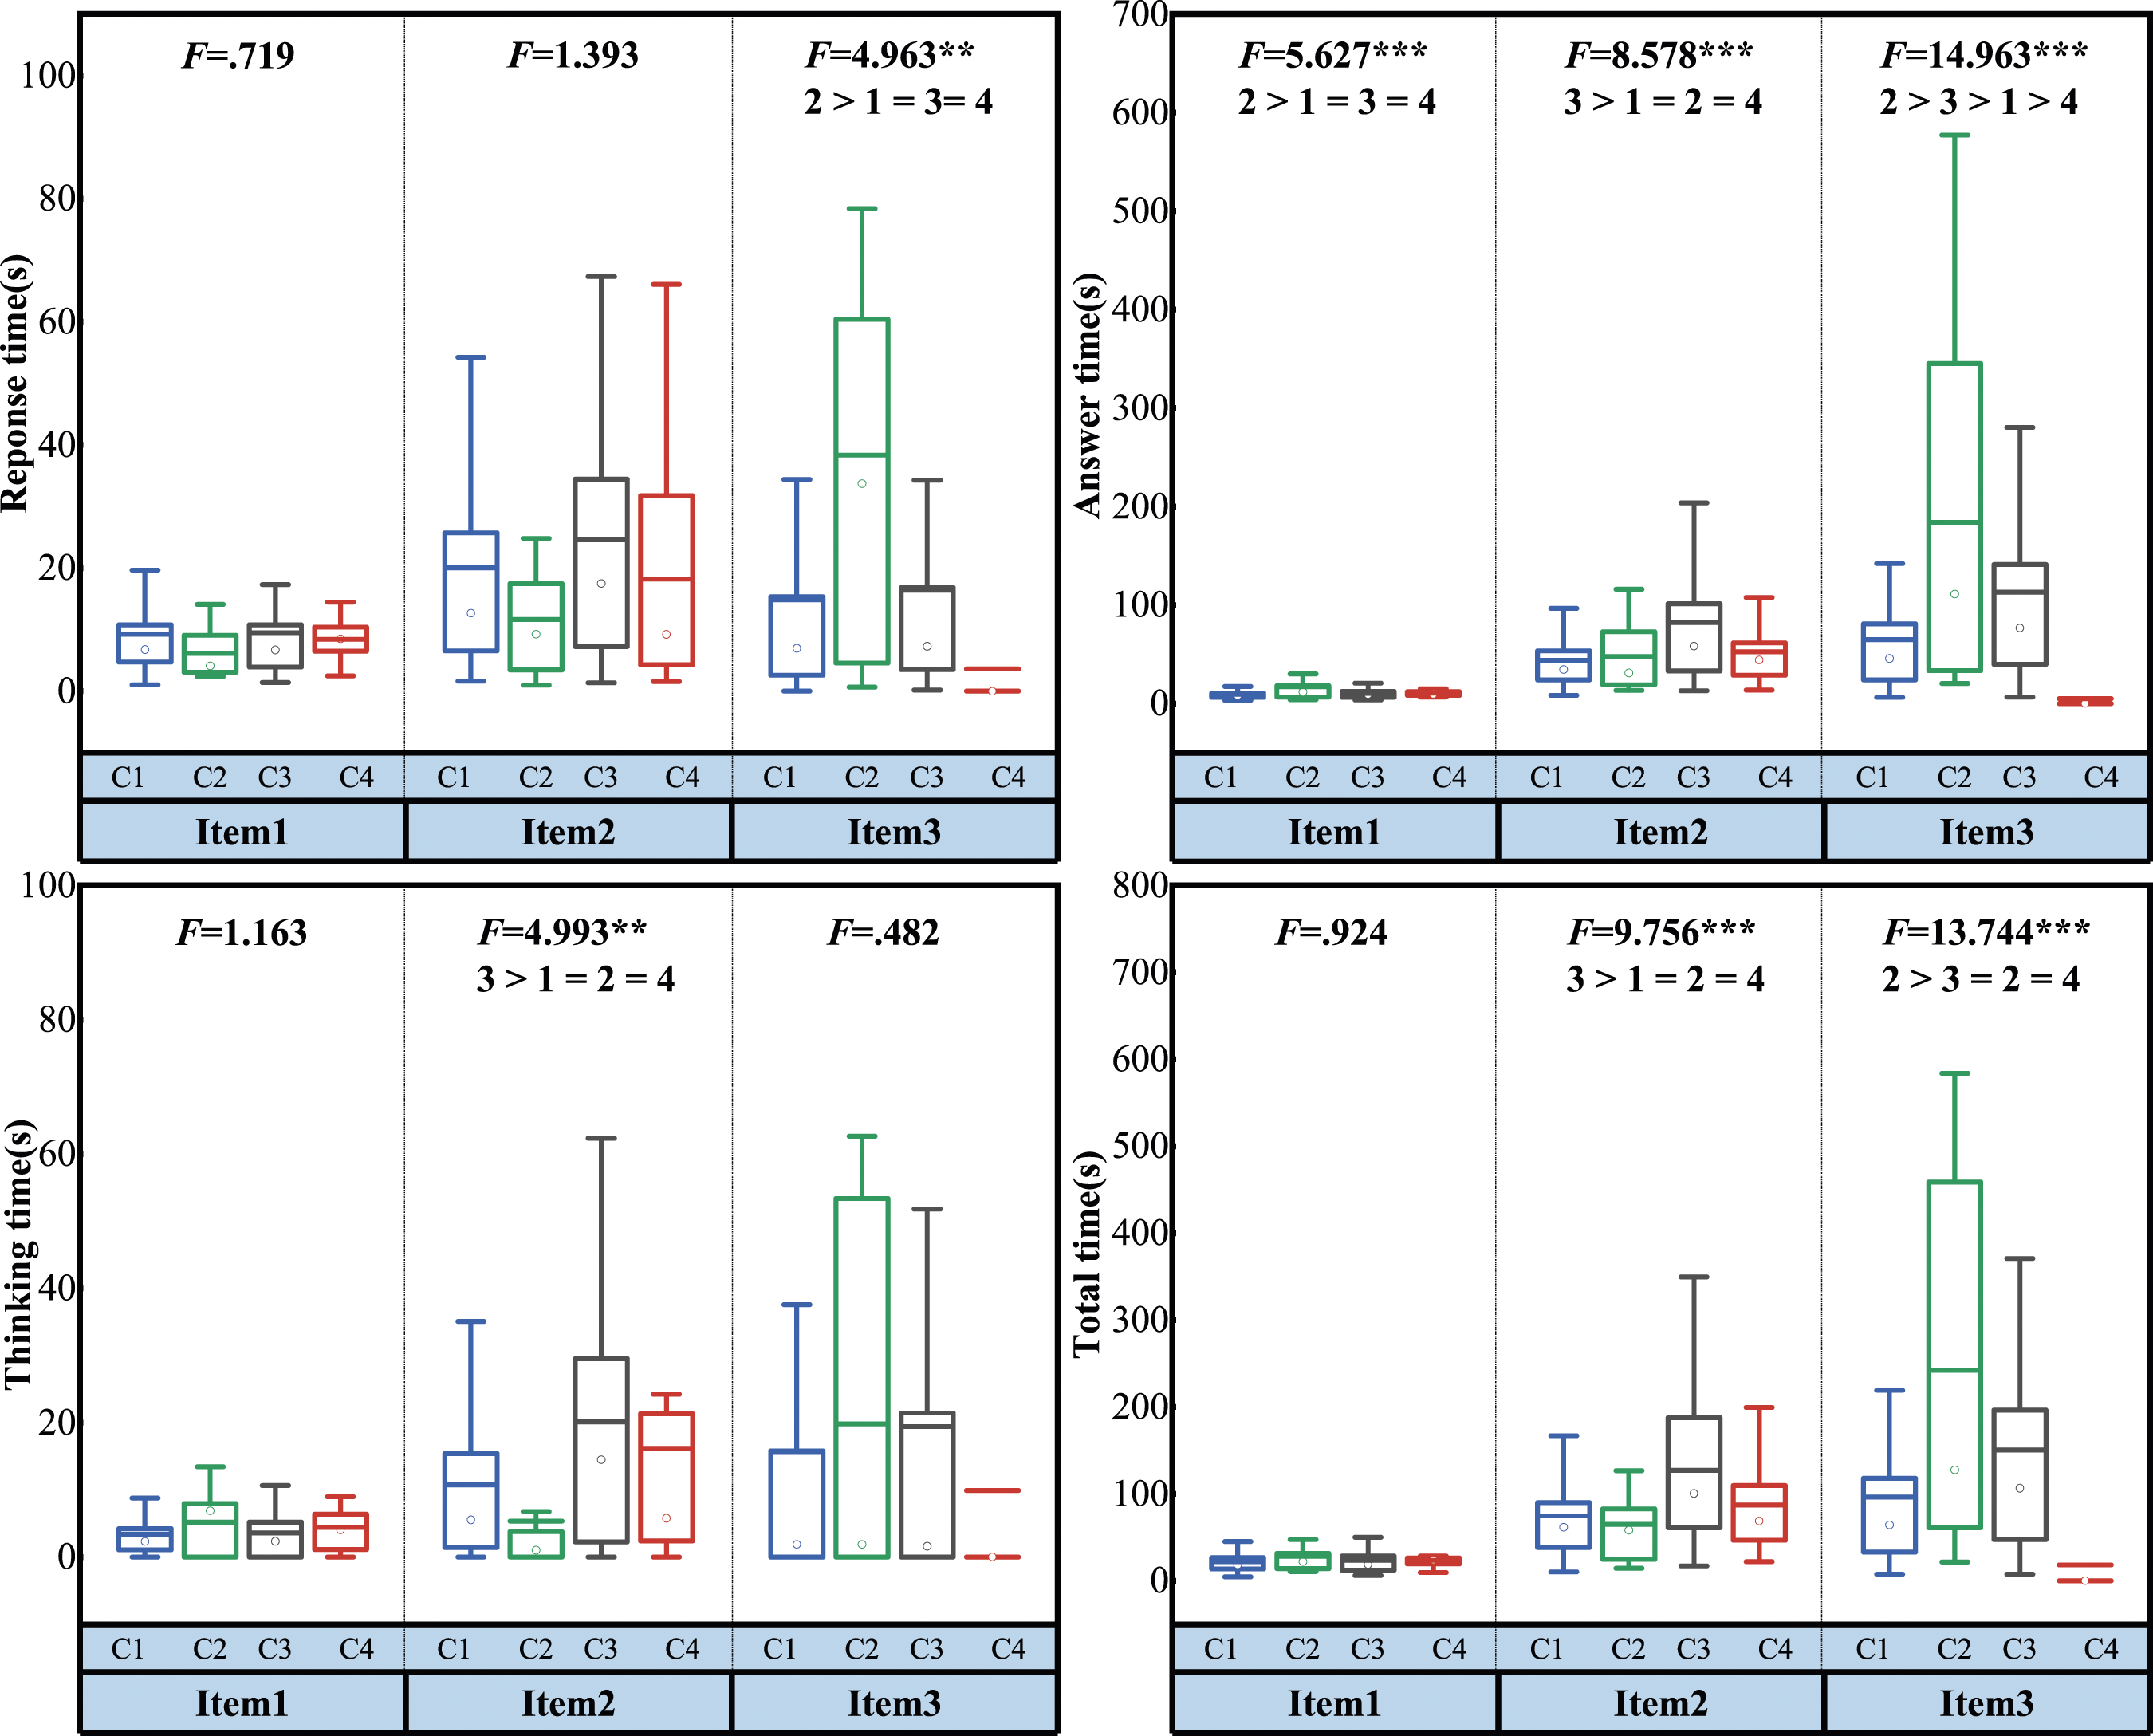
Do Behavioral Performance, Quality Indicators, and Latent Classes of Behavioral Processes Effectively Predict the CT Levels of Students?
A Univariate Logistic Regression of Each Variable.
A Multivariate Logistic Regression of Key Variables.
Discussion
Current studies on revealing the characteristics of behavioral processes in CT problem-solving pose some challenges, including vague latent classes (Liu et al., 2019), neglecting quality indicators of behavioral sequences (Tang et al., 2020b), and overlooking the mining of cross-item characteristics of behavioral processes (He et al., 2021). In this work, four cross-item quality indicators of behavioral sequences are constructed based on the Levenstein distance algorithm, and four latent classes of behavioral processes in CT problem-solving are then obtained by combining these indicators with cross-item scoring rate. The differences in the demographic and behavioral performances across the four classes are analyzed and the predictive effects of the four classes on CT scores are further explored.
The Characteristics of Behavioral Processes in CT Problem-Solving Mined by LPA
For RQ1, four latent classes of behavioral processes in CT problem-solving are uncovered after applying LPA (Weller et al., 2020). In conjunction with the findings of RQ3, the unique characteristics of each potential class are discussed in detail below. The students in class 1 have higher quality of behavioral sequences for solving all the CT items of different difficulties. They firmly tend to take fewer and correct actions, and their final performance on all items is the best (highest SR value). This result seems to show that the CT problem-solving performance is expected to be better when a student’s problem-solving path is more similar to the expert solution, or is more consistent across multiple problems (Liu et al., 2019).
Class 2 accounts for a relatively small population. The students in this class have poor quality behavioral sequences on all CT items. In this work, poorer quality of behavioral sequences indicates messier (low accuracy) and longer (low efficiency) behavioral sequences compared with the expert solution. It is worth noting that the efficiency performance of students in class 2 is lower compared to their similarity performance, indicating that they have more amounts of operations (indicating low efficiency) but some of these operations are, to some extent, necessary for problem-solving (with similarity value higher than efficiency value). However, it is surprising that this small group of students with poor quality of behavioral sequences achieves preferable outcome. This group of students appears to be incongruent with the characteristics of Class 1, as lower-quality behavioral sequences did not result in poorer final performance. Similar finding has been explained in previous studies, where the students changed their ideas throughout the submission process, resulting in deviant behavioral sequence, but getting closer to the correct solution (Yang et al., 2021). Another reason for the favorable performance is that the long sequences of operations are not blind. Instead, the results are a consequence of active exploration after spending a long time and seeking assistance (Fu et al., 2022). The details of this process are discussed later. Overall, the existence of students in class 2 is not to be overlooked, as it serves as a warning that relying solely on problem-solving outcomes to evaluate CT levels is not comprehensive. Because not all students who demonstrate satisfactory results can solve CT problems accurately and efficiently; some still require significant cognitive effort. These special students require the attention of CT educators.
The students in this class 3 have a relatively balanced performance, with moderate gaps between the behavioral sequences and the expert solution, moderate consistency of similarity across items, and favorable performance in problem-solving. However, the consistency of their efficiency is relatively low. Overall, the students in class 3 may not have the great CT problem-solving skills as the students in class 1 complete the items quickly and accurately, while they should have higher CT problem-solving skills as compared to the students in class 2 because they can achieve similar performance with fewer behaviors on average. Furthermore, the efficiency in solving CT problems of different difficulties was unstable for students in class 3. In this study, they spent more time on the moderately difficult item 2 (Magic Stone), which suggests they wasted more numbers of actions, leading to lower efficiency and dragging down the consistency level of efficiency across the three items. Overall, the distinction between class 3 and class 2 is interesting and meaningful. Students in class 2 tend to invest significant cognitive effort into each problem, regardless of its difficulty. In contrast, students in class 3 are able to quickly and accurately answer simple questions, while increasing their cognitive engagement in certain difficult problems. Therefore, although the outcomes of CT problem-solving for both classes are similar, the subtle behavioral and thinking processes differences reflect different levels and states of students’ CT development, which are worthy of educators’ attention and consideration for distinct CT cultivation programs.
The similarity and efficiency between the behavioral sequences of students in class 4 and the expert solutions are almost equal to those of class 2. However, the consistency of the quality of behavior sequences among students in class 4 is low across different difficulty levels, and their final performance in CT problem-solving is the worst. A similar pattern has also been observed in previous studies (Fu et al., 2022; Ulitzsch et al., 2022). The reason for the difference in performance between students in class 4 and class 2 is may be that the students in the class 4 lack motivation to engage in problem-solving (Ulitzsch et al., 2022), thus leading to a large number of useless operations performed blindly and without thinking in a short period of time (Sahin & Colvin, 2020). The low behavioral consistency of students in class 4 across items means that they are not motivated enough for performing certain items. Particularly on the third item (Magic Potion), which is the most difficult, they were unwilling to accept the high cognitive load, leading to nearly blind completion of the item within an extremely short time. Their behavioral sequences in item 3 undermined their average similarity and efficiency. Conversely, they spent more time carefully answering the first two items, possibly maintaining productive behavioral sequences, thus causing the low level of consistency in the quality of their behavioral sequences. In summary, students in class 4 are special, as educators cannot define their weak CT levels based on incorrect answers, because they lack the motivation to even attempt difficult problems, making their true CT level unknown.
Differences in the Demographic Background and In-Game Behavioral Performance of Diverse Latent Classes of Behavioral Processes
For RQ2 and RQ3, we perform further analysis to discover how specific differences exist in the demographic background and in-game behavioral performance of the latent classes of behavioral processes. This analysis will help us to deeply understand the peculiar traits of different behavioral processes in CT problem-solving.
In terms of demographic background, the gender of the students does not differ significantly in the classes. However, previous research has found that adult males were more likely than females to exhibit similar behavioral sequences as expert solution (He et al., 2021). The reason for the inconsistent findings may be due to the fact that the participants in this work are students rather than adults. The gamified scenarios in this study may mitigate the differential effects of various factors, such as test anxiety, on students’ gender. (Hong & Karstensson, 2002; Zhu et al., 2023). The results of this study also confirm that the quality of behavioral sequences of students is significantly better in the upper grades as compared to the lower grades. He et al. (2021) derived the opposite conclusion as they observed that young adults were more likely to follow the experts’ behavioral sequence than older participants. This may be due to the fact that the proposed study is conducted with juvenile students who are currently school-going individuals instead of adults who have already finished their school education.
In terms of in-game behavioral performance, we observed interesting differences among the latent classes of behavioral processes, reflecting the particular significance of each class. First, we observe that the students in class 1 earned significantly more coins on average as compared to the students in other classes. This result is not surprising, as it is predictable that students who consistently exhibit high behavioral quality across all items will also demonstrate better problem-solving performance (Liu et al., 2019). In contrast to the result-oriented performance of coin acquisition, it is interesting to observe the differences in process-oriented behavioral performance among students from different classes. For examples, we observe that, on average, the students in class 2 clicked on help hyperlink more often, took longer to answer, and spent considerably more total time in the game as compared to the students of other classes, especially when compared to class 4. This result effectively explains the heterogeneity between class 2 and class 4. According to the previous research, seeking assistance is a positive self-regulatory strategy (Fu et al., 2022), and the students in class 2 tend to obtain scaffoldings to support higher performance (Martín-Arbós et al., 2021). In addition, the longer playing time of students in class 2 also indicates that they actively explored while seeking help (Fu et al., 2022), and eventually achieved a higher score. However, although the students in class 4 showed similar SM and EM as the students in class 2, they were not willing to accept assistance and only performed a large number of operations in a short period of time. This result strongly suggests that the students in class 4, due to the lack of motivation to solve difficult problem (Ulitzsch et al., 2022), simply adopted numerous invalid operations mindlessly within certain difficult items, resulting in lower average values of SM and EM (Sahin & Colvin, 2020). Finally, we also observe that the students in class 4 did not receive more pass-cards to force skip the items as expected, given the low average scoring rate. This corroborates our earlier analysis that the students in class 4 had lower consistency of behavioral sequences across items of different difficulties. So, the weak average performance does not indicate that they responded blindly on every item and received every pass-card after wrong answers. They still performed effectively on some easier items, and the average performance is only dragged down by some blind answers corresponding to certain difficult items.
Prediction Effect of the Variables in This Study on CT Levels
The previous studies have demonstrated that the problem-solving behavioral performance, e.g., spent time (Liu et al., 2019), behavioral similarity (He et al., 2021), and the latent classes (Schoor & Bannert, 2012) accurately predict the external standardized test performance. This work also uses the relevant variables to predict the CT levels of students for external measurement. The results of multivariate logistic regression show that the students who tend to obtain pass-cards in the game are more likely to perform at low CT levels on external tests. This finding is predictable because obtaining a pass-card in our game implies repeated wrong answers on the item. Another finding states that the students who spent more time in thinking during the game are more likely to exhibit higher levels of CT. This result is consistent with the previous findings (Liu et al., 2019), and a valid explanation is that the students who are willing to spend more time have stronger problem-solving motivation (Ulitzsch et al., 2022), and are more likely to perform better in various situations. Finally, a surprising observation is that the students in class 3, who have a balanced average performance in the game, are more likely to reach low CT levels as compared to the students in class 4, who have a poorer average performance. This may be explained based on the characteristics of class 3, where students have low consistency of behavioral sequences across items. Consequently, they only lacked motivation on partial items and answered blindly, thus lowering the overall performance (Sahin & Colvin, 2020; Ulitzsch et al., 2022).
Conclusions
This study parsed students’ behavioral sequences into four distinct latent classes, each marked by unique traits. Class 1 students maintained high quality and efficient sequences across varying CT tasks, securing positive outcomes. Class 2 students exerted considerable cognitive effort and trial-and-error, scoring relatively well despite lower accuracy and efficiency. Class 3 students were characterized by moderate quality and scores, excelling in simple items but struggling with complex ones. Class 4 students exhibited minimal motivation for challenging items, rushing through them while handling simple ones diligently, leading to low quality and inconsistent behavioral sequences. Furthermore, the study found that students’ process performance, including pass-card acquisition, thinking time, and behavioral process types, alongside paternal education level significantly predicted students’ external CT test scores.
This study holds theoretical and practical value for different audiences. First, for researchers in related fields, this study can provide them with theoretical and methodological references. We proposed an idea of mining the behavioral processes during problem-solving based on cross-item quality indicators of behavioral sequences (Juhaňák et al., 2019; Liu & Israel, 2022; Nasir et al., 2021; Xiao et al., 2021). Specifically, we break through the limitations of subjective pre-grouping of validation-oriented methods. In addition, we transcend the deficiencies of exploration-oriented studies that ignore the quality of the behavioral sequences and demonstrate that it is highly meaningful to reveal the behavioral processes of students based on behavioral sequences. Moreover, the cross-item construction of different difficulty levels, which is not previously considered is also implemented in this study (He et al., 2021; Jiang et al., 2023).
This study offers practical insights for educators aiming to enhance CT skills among students. By identifying latent classes and their distinct behavioral process characteristics in CT problem-solving, teachers can tailor their instructional strategies to meet the specific needs of different student groups. For students in class 1, who exhibit strong CT problem-solving abilities across various difficulties, teachers might consider introducing more challenging problems to further develop their skills. Class 2 students, though enthusiastic and exploratory, may lack the problem-solving prowess of their class 1 counterparts (Fu et al., 2022). It is crucial for educators to maintain these students’ motivation by progressively increasing problem difficulty without overwhelming them. Students in class 3 demonstrate moderate performance, tending to easily solve simple CT problems but struggling with those of greater difficulty. This suggests that they may possess certain CT skills but are not yet fully able to understand CT concepts and apply them to solve complex problems. Educators should focus on deepening these students’ conceptual understanding and applying CT principles to complex problem-solving, perhaps using real-world scenarios as examples. The poor performance of students in the class 4 is likely to be deceptive and is a consequence of blind operations (Ulitzsch et al., 2022). In case of these students, the primary job is to motivate them for problem-solving and make them actively engage in order to demonstrate their authentic CT problem-solving skills. For these students, the priority should be to foster genuine engagement and motivation in problem-solving activities, ensuring they apply their true CT skills.
It is worth noting that there are some limitations of this work. First, the number of CT items considered in this work are relatively small. Although meaningful latent classes and their characteristics of behavioral processes are successfully uncovered, we plan to consider additional items in the future studies to validate the current findings. Second, this work is conducted in only two grades, G4 and G8. The future studies will further focus on other grades for exploring the differences of behavioral processes in CT problem-solving across multiple grade levels. Finally, this work shows that the behavioral data in games is rich, and the variables of interest in this work are only a portion of it. The future studies can consider other interesting variables for additional investigation.
Footnotes
Author Contributions
Qing Guo: Data Curation, Methodology, Writing Original Draft, Visualization. Huan Li: Formal analysis, Visualization. Sha Zhu: Supervision, Project administration, Funding acquisition.
Declaration of Conflicting Interests
The author(s) declared no potential conflicts of interest with respect to the research, authorship, and/or publication of this article.
Funding
The author(s) disclosed receipt of the following financial support for the research, authorship, and/or publication of this article: The research in this article was supported by a National Natural Science Foundation of China [62107019], a Key Project of The Special Funding for Educational Science Planning in Hubei Province in 2023 [2023ZA032], and a Key Subjects of Philosophy and Social Science Research in Hubei Province of 2022 [22D043].