
Abstract
Empirical studies on the causes of civil war robustly show that poor countries are more likely to suffer civil war than rich ones. However, the interpretations of this finding differ. The literature proposes three different causal mechanisms: (1) poverty leads to grievances; (2) income proxies the opportunity-cost of rebelling; and (3) income proxies state capacity. Using factor analysis, logistic modeling and multiple imputation, we test which of the three possible explanations can best explain the link between poverty and conflict. We find per capita income to belong to a wealth/poverty dimension, and to have little in common with “pure” measures of grievance and state capacity. Thus our findings support the opportunity-cost argument. The wealth dimension is also shown to be the most important underlying cause of civil war.
Introduction
It is a genuine puzzle that, despite exorbitant costs associated with civil wars, it is poorer countries that suffer them—a luxury the poor can ill afford. If the poor really mobilize to fight for justice, why such exorbitant costs are not borne to solve problems underlying injustice and depravation is a mystery. Civil wars are thus either luxury goods for some within these societies, who silently gain while the many suffer deeply, or rebels are selfless saints that bear all the costs for providing the public goods of justice and broad welfare. Recent studies address the causes of war by juxtaposing theoretical approaches between those who believe broad grievances cause conflict and others who view conflicts as generated by opportunity for violence where opportunistic actors predate rather than provide justice to the many. While empirical studies robustly show that poorer countries suffer civil war (see, for example, Hegre and Sambanis, 2006; Sambanis, 2004; Ward et al., 2010), theories linking poverty to conflict differ. There are three possible explanations: (1) poverty (and the accompanying social injustices) leads to grievances, and bad structures associated with poverty are resisted. The other two explanations are related to the opportunity-cost argument: (2) income level proxies the opportunity-cost of fighting. Low incomes affect individual decisions about joining violent movements from which they can benefit marginally more than from regular labor-market opportunities (Collier and Hoeffler, 2004). (3) Income proxies state capacity so that rebel labor increases with the opportunity for successful rebellion because of ineffective counterinsurgency (Fearon, 2005; Fearon and Laitin, 2003). That is, poverty is a proxy for state administrative, military and police capabilities. Understanding which of these mechanisms drives conflict is fundamental to policy aimed at ending costly civil war (Blattman and Miguel, 2010; Sambanis, 2004).
Using several unique measures of poverty, we examine first, by way of factor analysis, whether per capita income belongs to an opportunity-cost, state-capacity or grievance dimension. This is done by including measures other than per capita income that are more “pure” proxies for poverty, state strength and social justice, respectively. 1 Second, we investigate the relationship between the different dimensions and the onset of civil war. 2 Third, to ensure robustness, we test single indicators of each of the dimensions on the same dependent variable in order to verify the results from the factor dimensions. In addition, to compensate for the low N due to missing data on some of the measures, we use the method of multiple imputation to supplement our models. Our results are easily summarized: we find per capita income to belong to a wealth/poverty dimension together with more direct measures of poverty and agricultural production. This dimension is distinct from the state-capacity measures, such as the quality of bureaucracy and governance, and from measures of grievances like physical integrity and empowerment rights that measure state repression and serious social dissent within society. The last part of the analysis shows that the wealth/poverty dimension is the best predictor of civil war onset. In sum, our findings lend support to Collier and Hoeffler’s (2004) rationale that income level is a measure of the opportunity-costs of joining a civil war, which makes rebel labor far more numerous in poorer nations. As they suggest, it may very well be that even extremely wealthy countries, such as Norway, will have “rebels with causes”—but they will not have armies.
Three explanations for the link between per capita income and violence
Existing empirical evidence robustly demonstrates that poor countries are more likely to suffer civil war than rich ones. The theoretical debate is not yet sorted out, however, with the literature proposing three different causal mechanisms to account for this relationship: (1) poverty leads to grievances, which in turn spur armed rebellion; (2) per capita income proxies the opportunity-cost of fighting, leading to a larger pool of potential rebels in destitute nations; and (3) income reflects state capacity, a low level of which increases the likelihood that any insurgency will prove successful.
Like most theories, these three explanations are surely idealized representations of what is arguably a rather complex reality. For a start, to a lesser or larger degree the independent variables are intertwined. Poverty and destitution could, for example, provide individuals with material incentives for taking up arms (which is an explanation within the opportunity-cost framework); still, non-material grievances (e.g. anger and disillusion with an unequal distribution of income) can easily be a necessary cause for the actual effectuation of a rebellion (Blattman and Miguel, 2010: 14–18). Likewise, pecuniary motives could follow in the wake of non-pecuniary ones (Humphreys and Weinstein, 2008; Keen, 2000). Colombia’s civil war is perhaps a good example. Although it may have started out as a grievance-based struggle based on leftist ideology—and while it “continues to be politically and ideologically driven at its core” (Guáqueta, 2003: 74)—the main groups responsible for the fighting soon evolved into true criminal business entities whose growth was largely attributable to an extraordinary ability to generate revenue through kidnappings, extortion, acts of sabotage and drug production (Richani, 2005). Furthermore, in both the opportunity-cost and the grievance frameworks individuals will not resort to arms unless the perceived probability of success is large, the latter being a function of state capacity (Oyefusi, 2008: 543–4). 3 Consider also a recent study that rightly stresses the issue of endogeneity and the multitude of causal connections between key variables of interest in the civil war literature, such as natural resources, income growth, state strength and civil war itself (Mitchell and Thies, 2012). Despite these provisos, isolating the three causal explanations should nonetheless be warranted. In part, the justification we bring to bear is analytical: we are specifically interested in the more narrow question of what the link between poverty and civil war really entails. Partly we are aiming to help “solve” a long-running theoretical debate in the literature; and in part, considering that this question cannot satisfactorily be resolved a priori, this should be an issue well-suited for empirical treatment by means of factor analysis, which we perform.
Opportunity-costs of rebellion
Most accounts of why costly conflict occurs suggest that armed fights are over “stuff”, so that rebellion comes about because it is more “profitable” than peace (Grossman, 1998; Hirschleifer, 1995). The opportunity-cost argument is a rational-choice explanation based on economic theory. This explanation assumes that each individual, implicitly or explicitly, performs a cost–benefit calculus determining whether or not the expected utility (EU) of rebellion (R) is greater than the expected utility of keeping his or her daytime job (D) (Hirshleifer, 1987; Lichbach, 1989; Mueller et al., 1991). This, in turn, is a function of income level (i), potential reward ($) for the insurgency, and the perceived probability of success (p). Following these assumptions, an increase in i contributes to EU(R) < EU(D); that is, the more a person earns, the less likely he or she is to take on the risk of joining a rebel movement. Likewise, if a person is poor, then she has less to lose by indulging in such activities relative to sorting out issues through regular institutionalized channels. An increase in $ or p makes the probability of EU(R) > EU(D) greater. Simply put, low income for any given individual increases the likelihood that he or she will find rebellion a more attractive option than those associated with more prosaic income opportunities.
Note, however, that per capita income might in fact be too broad to capture this aspect of the explanation, whereas other measures can be better indicators of such a mechanism, such as the incidence of extreme poverty. Moreover, others have found that terrorists are far more likely to be richer and more educated than the general population (Krueger and Malecková, 2003); that rebelliousness over issues such as nationalism increases among those more modernized and better educated (Sambanis, 2004); and that a higher average per capita income also increases the prize over which one will ultimately fight, thereby potentially making it less tempting to join a rebellion in a poor country (Dube and Vargas, 2008).
While the opportunity-cost motivation in theory could be present in rich countries as well, given that it effectively represents an individual-level explanation, in practice it is primarily a developing-country phenomenon. First, this is so because the relative number of absolute poor people—and hence the number of potential rebels (according to the opportunity-cost framework)—will be larger in countries with a low average per capita income. Second, poverty as such is a relative phenomenon, which implies that the opportunity-costs of joining a rebellion for a “poor” person in a rich country will usually be substantially higher than it is for a poor person in a developing country. Third, intervening factors (e.g. state or military strength) are more likely to come into play in rich countries, further raising the opportunity-costs of rebellion, not least by making insurgency less feasible (Collier et al., 2009).
Collier and Hoeffler (2004) view per capita income as “earnings foregone in rebellion”; thus, if foregone earnings are low this will increase the risk of violence, all else being equal. This can be illustrated by the concept of “seasonal desertion”, which occurred in both the American and Russian revolutions (and, in the latter case, also in the subsequent civil war). In the summer/autumn, when people’s income was high (harvesting time), one would experience more desertion than in the winter when income was low. More recent illustrations are provided by surveys investigating the motives behind rebellions. For example, individual-level data from Nigeria (Oyefusi, 2008) and Colombia (Arjona and Kalyvas, 2008) indicate that the lack of access to alternative income opportunities may drive many into armed rebellion. As such, this explanation suggests that recruits are more readily available when per capita income is low (the cost of recruits to insurgencies should be “related to the income forgone by enlisting as a rebel” (Collier and Hoeffler, 2004: 569), hence making rebellion cheaper in poor nations). This represents i in the inequality presented above, where a decrease in i leads to (a movement toward) EU(R) > EU(D). If this interpretation is the correct one, we could expect per capita income to belong to a wealth dimension along with other measures of poverty, such as education, health, living standard and also whether or not a country has an agrarian-based economy where the incidence of poverty is usually high. From Collier and Hoeffler’s reasoning we deduct our first hypothesis:
State capacity and insurgency
For others, though, the broad measure of per capita income captures something else. Fearon and Laitin (2003) use gross domestic product (GDP) per capita as a proxy for state strength. Their argument is that state weakness, such as limited policing capacity and poor infrastructure, provides the opportunity for rebels to sustain insurgency. Following this reasoning, per capita income represents the perceived probability of success (p) of rebellion. If a state is poorly run, then it is vulnerable to insurgent attacks because the probability of the rebels surviving, or of them achieving their goals, is greater than if it was a strong, well-organized state.
Fearon and Laitin (2003) place weight on the government’s capacity to deter and defeat insurgencies. In their view per capita income is a proxy for a state’s ability to administer and police its territory; whereas a rich state has the financial, institutional and military means to prevent the establishment of rebel organizations, poverty is linked with a financially and bureaucratically weak state whose associated governance “vacuum” increases the likelihood of insurgency formation and ultimate success. If the state is frail and thus unable effectively to guard its own domain, then rebels will have an easier time recruiting. Here they effectively draw on the argument of Hobbes, that the state of nature is a “war of all against all”, and that in the absence of a state that is able to control its territory, “both fears and opportunities encourage the rise of would-be rulers who supply a rough local justice while arrogating the power to ‘tax’ for themselves and, often, for a larger cause” (Fearon and Laitin, 2003: 76). Humphreys (2005) lends some support to Fearon and Laitin when he states that conflict onset is more likely to occur if there has been previous natural-resource production (which implies that government income in large part has come from other sources than taxing its population) than if there is potential for future production or extraction. Thus, state structures are, according to this view, weaker in resource-dependent countries—because if a population is not taxed, then it is not controlled. While the literature on the “resource curse” holds that resource wealth reduces state capacity (see Ross 1999 for a fine overview), others disagree. A recent, sophisticated study by Thies (2010) finds to the contrary, that state capacity is actually boosted by natural-resource wealth. Of even more pertinence to the present study is Thies’s conclusion that Fearon and Laitin’s proxy for state strength—GDP per capita—constitutes a poor proxy; as measures of the size, scope and strength of the state, Thies instead uses a variety of fiscal variables, thereby disconnecting per capita income from the state-capacity concept. Other studies also implicitly perform a similar disentanglement of GDP per capita and state capacity; in a recent article Ahmed (2012) shows that authoritarian governments can divert foreign income—such as development assistance and migrant remittances—to strengthen their grip on power, implying that the story about state strength and control is not necessarily about average levels of income among citizens; while Nielsen et al. (2011) demonstrate that income shocks (which are only very loosely related to average income) hamper the government’s bargaining power vis-à-vis rebels, thereby increasing the likelihood of armed violence. Still others pinpoint and emphasize sub-dimensions of state capacity, such as policy and military strength (Arjona and Kalyvas, 2008; Fearon and Laitin, 2003); infrastructure (Collier et al., 2009; Fearon and Laitin, 2003); and public-goods provision more broadly (Oyefusi, 2008).
Hence, state capacity need not be unidimensional. Neither is it unaffected by the dependent variable itself (Mitchell and Thies, 2012), and neither are its effects on civil war probability necessarily unequivocal; considering that armed conflict takes place over “stuff”, the victor’s prize—and therefore incentives for rebellion—should increase with state capacity (Collier and Hoeffler, 1998; Thies, 2010). Here as well, the relative weight of these forces ultimately becomes an empirical issue. Although the weak-state-fuels-civil-war argument seems plausible, and has been frequently mentioned in the literature (e.g. Brinton, 1965; Fearon, 2005; Ross, 2003; Russel, 1974), we argue that per capita income is not necessarily a good indicator of state capabilities. Fearon and Laitin make an assumption that per capita income is highly correlated with military, policing, administrative and bureaucratic capacities of a state. They do not, however, directly test such a proposition by using measures capturing these dimensions. Of course, employing these dimensions in standard regression models is inappropriate because they are highly collinear with each other as well as with per capita income. We propose, therefore, to identify a common factor that explains income and good governance, such as the quality of the bureaucracy and level of corruption, and use that factor in standard models investigating the determinants of the onset of civil war.
A measure of grievance
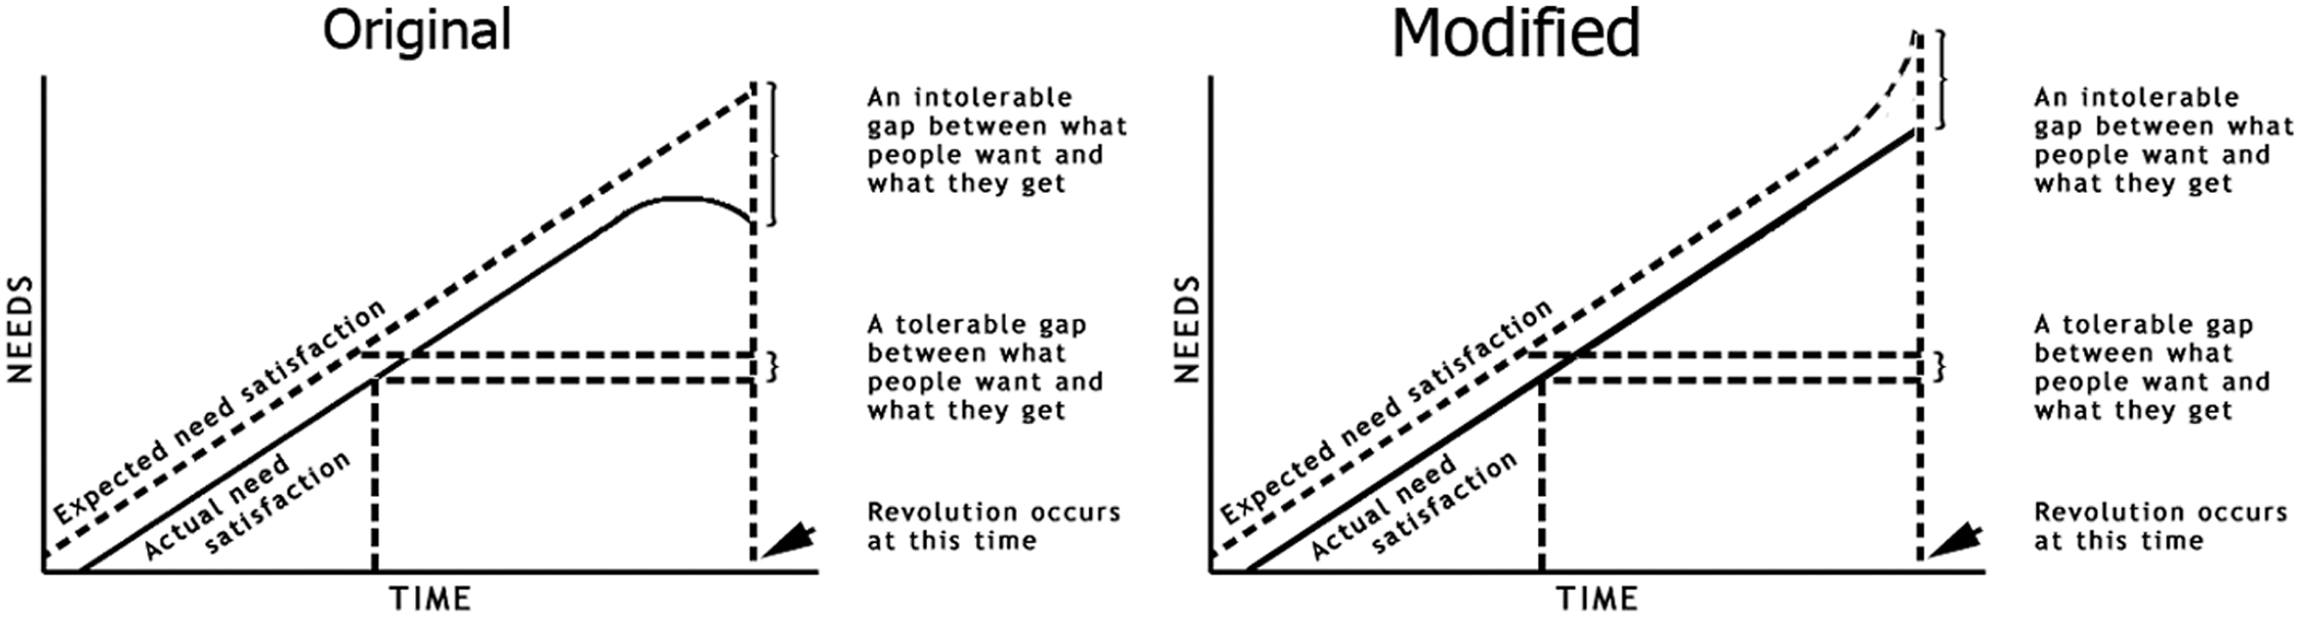
A third approach to interpreting the significance of per capita income is to view it as a measure of grievances: that is, poor societies experience relative deprivation and the lack of empowerment (i.e. a lack of access to rights, laws and justice), which result in strong social dissent and resistance, and ultimately rebellion. The grievance explanation of violent behavior is based largely on the theory of relative deprivation (Gurr, 1970). This school assumes that anger and frustration resulting from deprivation has a direct effect on the likelihood that a person will rebel. According to Davies’s (1962) J-curve theory, revolutions are most likely to occur when there is an intolerable gap between what people want and what they get. Such a gap can become manifest when there is a sharp reversal of development during the modernization process. However, it can also be argued that this theory is relevant if there is a sudden rise in expectations in a relatively poor society (e.g. through increased exposure to information on Western democracy and living standards via the Internet and social media). Apparently, modernization processes were supposed to have this effect on rising expectations, which seemed to explain the many communist uprisings during the Cold War (Huntington, 1957). More recently, the 2011 revolts in Tunisia, Egypt and Libya can serve as examples of support for this argument. As such, low per capita income can be a factor leading to relative deprivation if expectations rise due to increased transparency that brings images of economic and political success from elsewhere to people who desire the same (see the modified J-curve in Figure 1).
Davies’s J-curve.
Yet, it can also be argued that the situation in North Africa is more closely related to the original J-curve proposed by Davies (on the left in Figure 1)—that is, that there was an increase in food prices (and thus a drop in actual need satisfaction) prior to the events in these countries. Of course, many of the North African states are generally quite rich in material standards, whereas global food prices should affect all countries. However, it could be argued that the relative lack of social and political rights helped inflame the passions, which indicates that grievance is a multidimensional concept. In any case, the literature on civil war does not find a robust correlation between income inequality and the onset of civil war, suggesting that poverty does not capture the theorized aspects about income inequality (Sambanis, 2004). Indeed, the general grievance explanation started facing increased pressure at the turn of the century, with a number of studies instead finding evidence in support of explanations that centered on “opportunity” or “greed” (e.g. Collier and Hoeffler, 2004; de Soysa, 2000; Fearon and Laitin, 2003). Recent studies have confronted this challenge, though. Employing alternative approaches (e.g. the use of household data (Østby, 2008), surveys (Humphreys and Weinstein, 2008), and disaggregated geographical data (Buhaug et al., 2011; Cederman et al., 2011; Dube and Vargas, 2008)), these studies by and large object to what they deem the “premature dismissal of grievances” (Buhaug et al., 2011: 816), in particular by emphasizing the necessity of focusing on “horizontal” inequalities that correspond to more fundamental cleavages that separate groups within countries. This literature, furthermore, does not adopt an overly constricted understanding of the concept of grievances. There should also be good grounds to assume that potentially vital inequalities of various sorts, including the inequality of access to social justice, are better captured by measures of de facto and de jure everyday rights of people vis-à-vis ruling classes, than by mere GDP per capita. The present paper therefore employs more direct proxies of the anger of people, as captured by variables measuring the repression of human rights and the empowerment rights of people—which should, whether with or without per capita income, constitute a common dimension or factor representing grievances.
At this stage it is appropriate to emphasize that grievances—in particular when broadly conceived—can be key with regard to another aspect of collective violence as well, namely the organization of rebel movements. A common denominator of all three explanations surveyed in the theory section is their individual-level vantage point. Especially when the explanation is rooted within the rational-actor school (which is certainly the case with the opportunity-cost explanation), a potential logical stumbling block appears: the purported cost–benefit analysis would, even for poor people, result in a rational decision not to join a rebel movement; as Olson (1965) informs us, the collective-action (and the concomitant free-rider) problem would advise the individual to let others provide the “public good” of rebellion, irrespective of its likelihood of succeeding. Cue the ethnic group and its grievances—either in the capacity of a psychological spur for individuals to join their brethren in the struggle against the government (Hechter et al., 1982), or as an instrument for political or rebel leaders who might, whether their true objective is justice or rapacity, highlight the grievances of their people, thereby potentially alleviating the problem of recruitment (Gagnon, 1994–1995). While the process of organizing a rebellion is beyond the scope of the present study, focusing as we do on the aggregated effects of individual-level decisions, we make this point also because it testifies to the often complex interrelationships between variables, which is vital to keep in mind when dwelling on highly stylized arguments and hypothesized causal relationships. Yet, many theoretical intricacies can usefully be dealt with by means of empirical analysis; and given the questions raised by this study, factor analysis should be a suitable tool here.
The research strategy
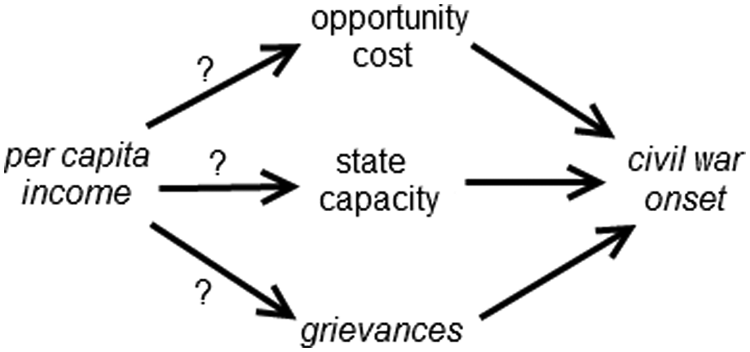
It is common in the social sciences to assume that indicators effect indicators; that is, that a latent unmeasured variable is decisive for the values of observed indicators. However, when investigating the causes of civil war this would be somewhat incorrect and blurry. The assumption for the first part of our analysis is that we are operating with formative indicators. That is, per capita income does not lead directly to conflict; instead it works through other mechanisms. Thus, per capita income is a formative indicator of one or more mechanisms that in turn (might) lead to armed conflict (see Figure 2), rather than an indicator of an underlying factor.
Per capita income as a formative indicator.
Whether to choose a formative or a reflective specification depends on the causal priority between the indicator and the latent variable (Bollen, 1989; Diamantopoulos and Winklhofer, 2001). Our reasoning follows MacCallum and Browne (1993: 533), who state that “in many cases, indicators could be viewed as causing rather than being caused by the latent variable measured by the indicators”. For example, opportunity-cost could be formed as a combination of per capita income, share of poverty, and agricultural population. If any of these measures changes, then opportunity-cost will also change. This is arguably more correct than claiming, say, that if opportunity-cost changes, then per capita income will change as well. It is therefore imprecise to call per capita income a proxy; one should rather call it a formative indicator of one (or more) mechanism(s) that lead(s) to armed civil conflict. So, if η represents the concept, x represents the empirical measures, and y is a parameter reflecting the contribution of x to the concept η, then:

We use factor analysis to calculate and determine the number of factors that can explain the correlations between a set of variables. This will provide us with formative indexes (the factor scores) of the mechanisms that may lead to onset of civil war. We use a selection of proxy variables often identified in the empirical literature as capturing some explanation about wealth and state capacity. In fact, the associations between per capita income, natural-resource wealth and country size are all claimed to be either poverty effects or state-capacity effects explaining the risk of conflict. We use measures of all these factors to generate four distinct dimensions: wealth, natural resources, empowerment and capacity. By applying this approach one assumes that the observed variables are linear combinations of underlying factors that best describe the observed covariance between the variables. A variable’s variance consists of three components: communality, unique component and measurement error. The communality is the variance of an observed variable accounted for by the common factors, while the unique component is the part of the variable unaccounted for, disregarding measurement error (see Kim and Mueller, 1978: 83ff). In our factor analysis we have included some measures that we assume to be associated with the opportunity-cost of rebellion, others that are clearly related to state capabilities, and also measures that are more genuine determinants of grievances. Hendrix’s (2010) study offers a useful, though circumscribed, template: he used factor analysis to estimate the underlying dimensionality of 15 measures of state capabilities. His approach differs from ours, though, in that he only tested measures hypothesized to capture state strength, discovering three dimensions. We argue that only two of the identified dimensions actually measure state capacity, and that by introducing other measures we can identify which ones belong to wealth, resources, empowerment and capacity.
Some of the measures included are those we expect belong to a wealth dimension: per capita income (GDPPC) (World Bank, 2009); the Multidimensional Poverty Index (MPI), which measures poverty at the household level and which also looks at relative and absolute depravation (Alkire and Santos, 2010); agricultural GDP as a share of total GDP (AGRICUL); and social security as a share of GDP (SOCSEC) (Johnson and Rabinowitz, 2005). The latter variable captures a wealth dimension as well as a well-being dimension given that higher social-security spending proxies a government’s commitment to reducing depravation. Social-security revenues, therefore, could be both wealth and state capacity because they demonstrate the ability to extract reveneus and to provide public goods. Other variables naturally fall into a resources category: mining production divided by total GDP (MINING) (Johnson and Rabinowitz, 2005); fuel exports (FUEL), which is a dummy variable given the value 1 for country–years in which fuel exports exceed one-third of export revenues, using Fearon and Laitin (2003) and World Bank (2009) data; states’ non-tax revenue (NONTAX), which is the revenue states obtain as rents from resources or aid (Johnson and Rabinowitz, 2005); and exports divided by total GDP (EXPORT) (Johnson and Rabinowitz, 2005). In addition to representing the resources dimension, these measures may also, as implied by Thies (2010), simultaneously capture important aspects of state strength or capacity in terms of access to revenue independently of taxing citizens directly.
We also include measures that should fall under the grievances heading, which we here denote as empowerment: physical integrity rights (PHYSINT), which encompass reported incidents of extrajudicial killings, torture, disappearances and political imprisonment; and empowerment rights (EMPINX), a variable measuring freedom of movement, freedom of speech, workers’ rights, political participation and freedom of religion. Both PHYSINT and EMPINX are from CIRI (2008) and Cingranelli and Richards (1999a, b). As probable indicators of capacity we include a measure of military expenditures (as a percentage of GDP), with data from the World Bank (MILITARY); a tax-ratio variable (TAXRAT), which is total revenue minus NONTAX and SOCSEC (Johnson and Rabinowitz, 2005); education spending (EDUCAT; World Bank, 2009); and measures of good governance and lack of corruption (GOODGOV), and bureaucratic quality (BUREAUC) (ICRG, 2011). 4
In addition, we include Fearon and Laitin’s (2003) updated ethnolinguistic fractionalization index as a measure of ethnic diversity (ETHFRAC). Based on data from Atlas Naradov Mira (Department of Geodesy and Cartography in the State Geological Committees of the USSR, 1964), this index estimates the probability that two randomly drawn individuals from a given country will belong to different ethnolinguistical groups. As mentioned earlier, ethnicity has been used as an explanation of how rebels can overcome the problem of collective action, both from a grievance and an opportunity perspective. Grievances might be more conspicuously present in a heterogeneous society, as the rulers’ preferences are likely to differ from those held by substantial parts of the population. Lastly, we also include population size (LNPOP), which is one of the two variables that are most robustly related to conflict, even if it is rather under-theorized (World Bank, 2009). Collier and Hoeffler (2004), for their part, state that grievances might increase with population owing to increased heterogeneity (which does not necessarily encompass only ethnic heterogeneity, we surmise, but also regional differences). Based on the variables outlined above, we next perform an exploratory factor analysis that seeks to identify common factors, each of which represents mechanisms that are proposed as causes of civil war onset.
Analysis
Underlying dimensions
We investigated time-series cross-section (TSCS) data from the period 1985–2007. The factor analysis identifies five underlying dimensions in the data material (see Table 1; for descriptive statistics, see the Appendix, Table A1). These factors correspond to the theoretical dimensions usually associated with the onset of civil war. Each variable scores differently on the different factors, but the majority of those tested have the lion’s share of their variance determined by one single factor. This testifies to the notion that, despite obvious interrelationships between (some of) them, individual dimensions—and the associated theoretical explanations—merit separate treatment. The analysis yields five distinct dimensions, which we have named Wealth, Empowerment, Capacity, Resources and Polarity, the first three of which are unambiguously linked to our three proposed theoretical explanations for the outbreak of civil war. The first factor, Wealth, is a dimension primarily made up of “pure” measures of poverty. We see from Table 1 that per capita income has more in common with these measures of poverty than with measures of relative political capacity (note that, to make the presentation clearer, factor loadings <0.35 are not shown). Placing itself as the core of the Wealth dimension, it has, statistically, little in common with the (state) Capacity dimension, the latter including measures of state strength like bureaucratic quality, governance and state military capacity. In other words, per capita income represents i rather than p in equation (1). This result is therefore more in line with Collier and Hoeffler’s (2004) opportunity-cost argument than with Fearon and Laitin’s (2003) state-capabilities argument for explaining what is behind the correlation of per capita income with the onset of civil war.
Eigenvalues, rotated factor loadings, and unique variances, 1988–2005.
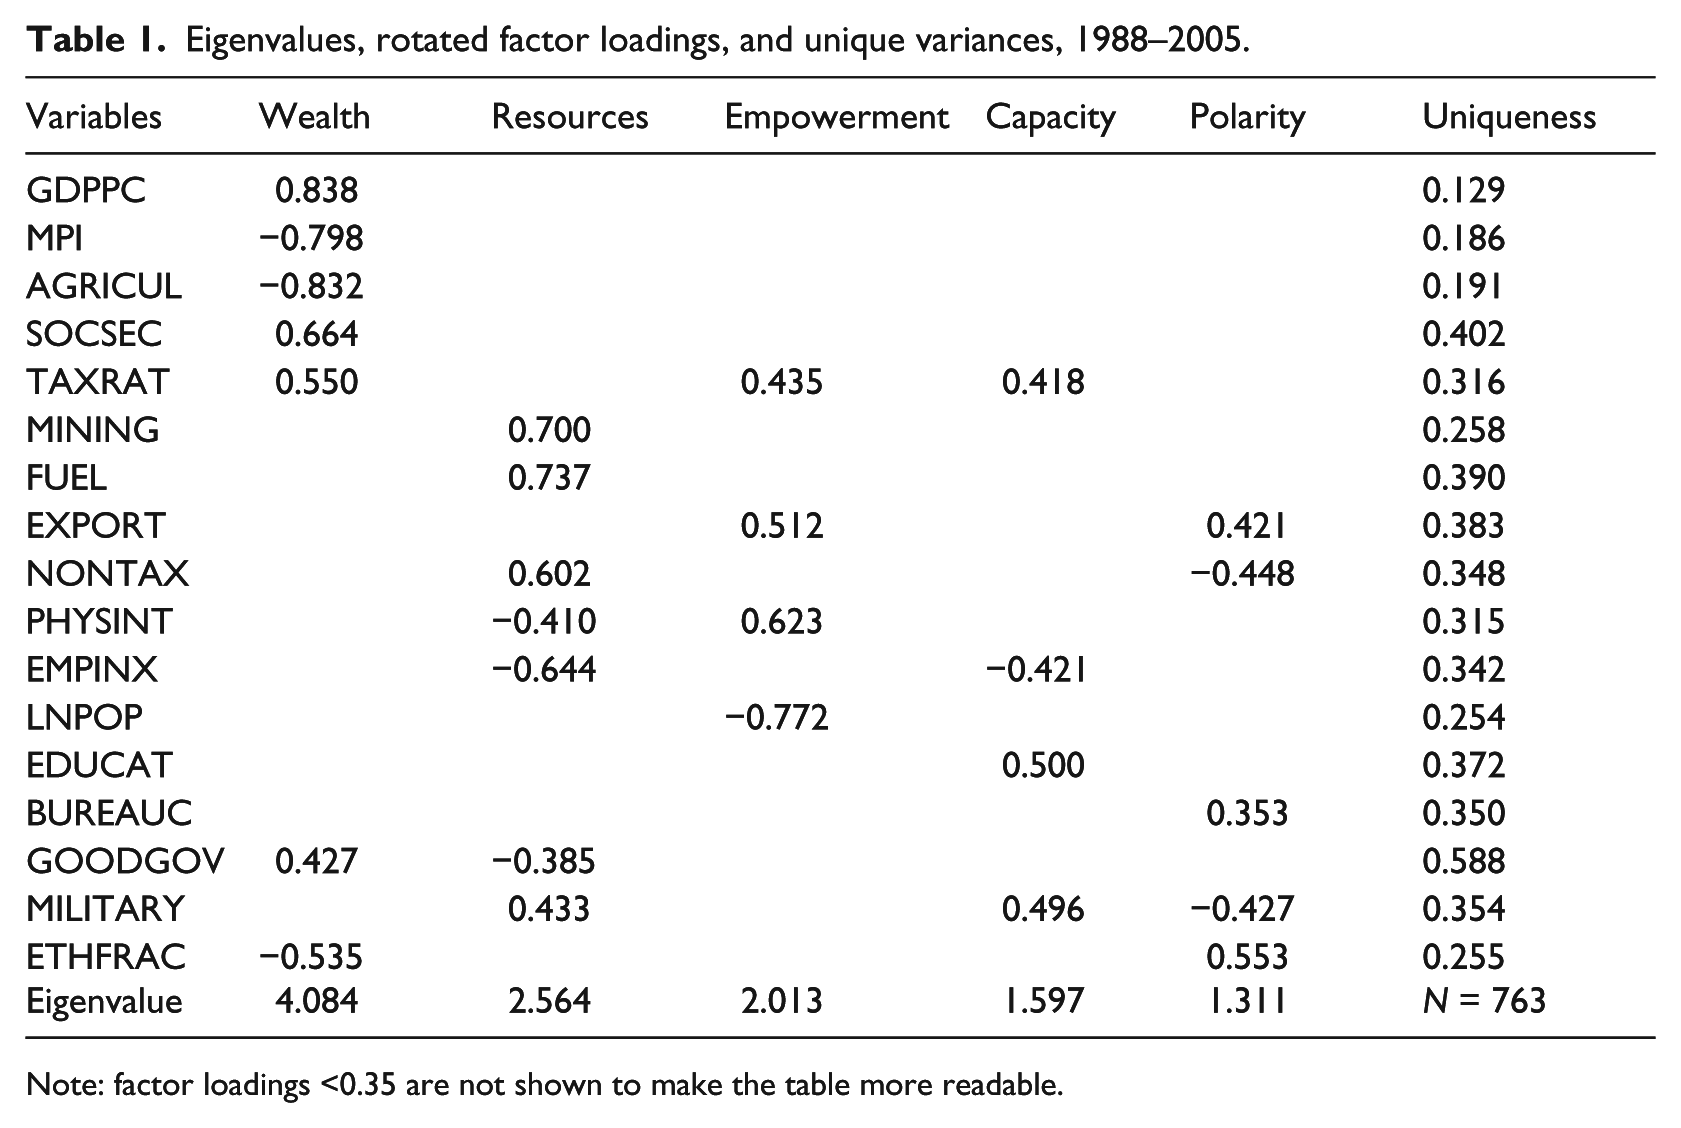
Note: factor loadings <0.35 are not shown to make the table more readable.
Further, the dimension we name Resources is mainly composed of mining and fuel exports, although PHYSINT and NONTAX also help constitute this factor. This dimension represents what we may call the potential prize for insurgents or the “rewards of rebellion”. For example, if a country is a large exporter of oil or other natural resources, then opportunities for reward through extortion or kidnappings can make rebellion an attractive option (Collier and Hoeffler, 2004: 588; Le Billon, 2001; Snyder and Bhavnani, 2005). Short-term pecuniary benefits aside, consider also that natural resources, especially “non-lootable” ones like petroleum or deep-shaft minerals, constitute a long-term prize for which it may make sense fighting to secure territorial control and even future independence. While some argue that natural-resource wealth works to augment state capacity and overall does not increase the likelihood of civil war onset (Thies, 2010), others contend that states that acquire large rents from resources are liable to the “resource curse” and hence especially vulnerable to capture through coups and rebellion, particularly by separatist forces (Ross, 2003).
Different types of empowerment rights capture the Empowerment dimension, which effectively represents the grievance explanation of civil war. A lack of empowerment rights presumably leads to frustration, anger, and also normative justifications for collective violence. It is noteworthy that population size is related to this factor, a finding that is easily explained by reference to bigger states perhaps needing to resort to a greater amount of repression to control the diverse demands of a large population, which is a result reported by many empirical studies on political repression (Blattman and Miguel, 2010; Landman, 2005). Importantly, per capita income is clearly not related to this empowerment dimension. If income per capita captures some sort of poverty/discrimination-related grievance, one would expect it to be driven by the same underlying factor as other measures of grievance and political marginalization. It can be argued that, if per capita income is low in a country, this will lead to frustration, anger and aggression in the form of political violence. However, the argument proposed by deprived-actor theorists like Davies (1962), Gurr (1968, 1970), and Graham and Gurr (1969) is that it is relative deprivation, and not deprivation per se, that matters; that is, what counts in this context is man’s perceived discrepancy between value expectations and value capabilities. Per capita income is arguably not a proxy for relative deprivation, though, as it obviously does not take into account what people’s expectations are. One further variant of the deprived-actor school states instead that inequality is what leads to conflict. The proposed causal mechanism is that inequality is viewed in relation to others’ rather than to each person’s individual expectations (Eckstein 1989; Midlarsky, 1988). Following this logic, a measure of inequality—such as the Gini coefficient of national income distribution—would be better suited as a measure of grievances than would per capita income. There are no studies to our knowledge that find any relationship between Gini and conflict onset, however (Sambanis, 2004). It should be noted, though, that some aspects of relative deprivation are captured by the MPI, which is part of the poverty factor.
The last thing to note with regard to Table 1 is that ethnic fractionalization is included within two different dimensions—Wealth and Polarity—which can be explained by the tendency for ethnically fractionalized societies to be poorer and more dependent on exporting natural resources than is the case for more homogenous countries (Easterly and Levine, 1997).
Wealth, empowerment, capabilities and civil war onset
In the present section we investigate empirically the causes of civil war onset. Given our theoretical focus, and despite that both Resources and Polarity in their own right are dimensions of significant interest in the study of armed conflict, we primarily deal with and comment on our three “main” explanatory factors. Our dependent variable is taken from the Uppsala conflict dataset (Gleditsch et al., 2002). Here, civil war onset is defined as armed violence that has resulted in at least 25 combatant deaths in the year in question. The definition ecompasses both “pure” and internationalized internal armed conflict. When investigating civil war onset in the period 1985–2007, which is roughly the post-Cold war years, we examine the whole population of countries rather than just a sample of it. According to sample theory, when one looks at the entire population, one should get perfect predictions, thereby making confidence intervals and significance values superfluous. However, when operating with a full population we make our generalizations within the stochastic model theory. We are generalizing from the observation made, to the process or mechanism that brings about the actual data (Gold, 1969; Henkel, 1976). This is what Henkel (1976: 86) names an “unspecified random process”. If there is a lack of statistical significance, this indicates that the association produced by nature is no more probable than that produced by chance (Gold, 1969: 44).
Before we proceed with the first regression results, we need to point to a few caveats. First, following much earlier quantitative treatment of the civil war phenomenon, from which we also derive our theoretical arguments, the empirical analysis operates at a very high level of aggregation. The literature on armed conflict has recently been given a boost by the publication of studies that either make use of more fine-grained subnational indicators (Buhaug et al., 2011; Cederman et al., 2011; Dube and Vargas, 2008) or employ a survey method to identify the possible motivations of combatants (Humphreys and Weinstein, 2008; Oyefusi, 2008). We firmly believe, in any case, that analyses at different levels of aggregation are needed in order to acquire a more comprehensive understanding of the civil war phenomenon. Second, the probably complex relationship between the independent variables, and between the independents and civil war onset, raises the issue of endogeneity (Mitchell and Thies, 2012). We attempt to alleviate some of these concerns, first, by identifying dimensions or factors that, in a statistical sense, turn out relatively unrelated to others, and then employing these in the regression analysis, and, second, by lagging the independent variables, as do the key studies on which we build our arguments (Collier and Hoeffler, 2004; Fearon and Laitin, 2003). Third, many of the measures included in our factor analysis suffer from a large amount of missing values. Since we are employing listwise deletion in our regression models (i.e. if a value is missing on at least one variable, it is omitted from the model), the total N quickly becomes very low. To compensate for this, we first run the available data (with a large number of missing values), and then use the method of multiple imputation to supplement the original results. This is done by using the information from all values from other variables where data are available to predict values on the variable with a low N in order to fill in the blanks (for this purpose we have used the standard explanatory variables, see Tables 3 and A2 in the Appendix). 5 One must take into account that the objective of multiple imputation is not to predict the values as closely as possible to the true ones, but rather to enable us to handle missing data in a way that can provide us with valid statistical inference (Rubin, 1996). By comparing the results from the original data and the imputed data, we should be able to achieve a more robust view of the validity of the findings.
Table 2 exhibits the results from a logistic regression where the independent variables are the five dimensions or factors identified in Table 1. 6 From the table we read that WEALTH, overall, is the strongest predictor of civil war onset. This suggests that the poorer a country’s population is, the greater the risk of civil war onset, a finding in line with previous research. Also, (state) CAPACITY and RESOURCES—and, albeit to a lesser extent, also EMPOWERMENT and POLARITY—all show some explanatory power on collective violence. Note also that the overall results by and large remain unaltered when we use a 1000-battle-deaths threshold for our dependent variable (not reported owing to space limitations).
Logistic regression, coefficient (standard error), civil war onset with two year intermittency threshold, factor scores as independent variables.
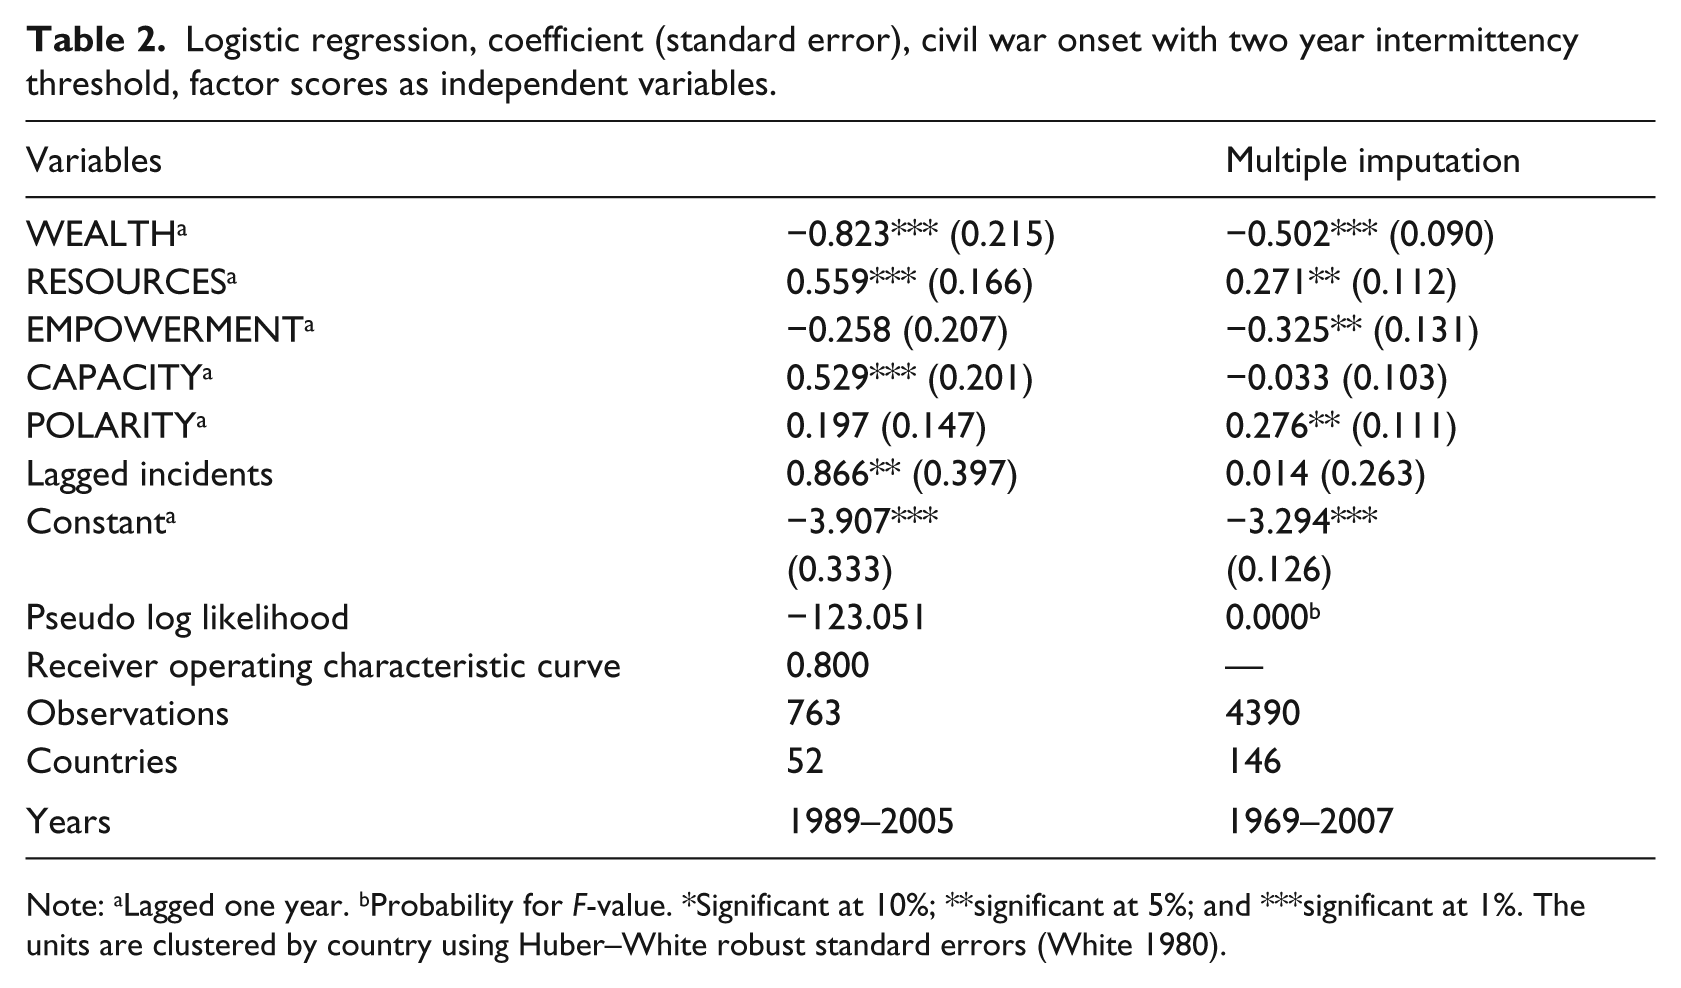
Note: aLagged one year. bProbability for F-value. *Significant at 10%; **significant at 5%; and ***significant at 1%. The units are clustered by country using Huber–White robust standard errors (White 1980).
When interpreting the first two tables in conjunction, our findings seem to support Collier and Hoeffler’s (2004) version of the rational-actor argument. First, this is because per capita income, which is one of the most robust predictors of civil war, in the previous section was identified as belonging to the Wealth dimension rather than to Empowerment (i.e. grievances) or Capacity. Secondly, when testing a model with the factor scores as independent variables, we see that the wealth dimension is the strongest predictor of civil war onset. In other words, per capita income represents i in equation (1), and i is also the strongest predictor of civil war onset. What seems to drive civil war, then, is poverty and depravation.
Indicators and civil war
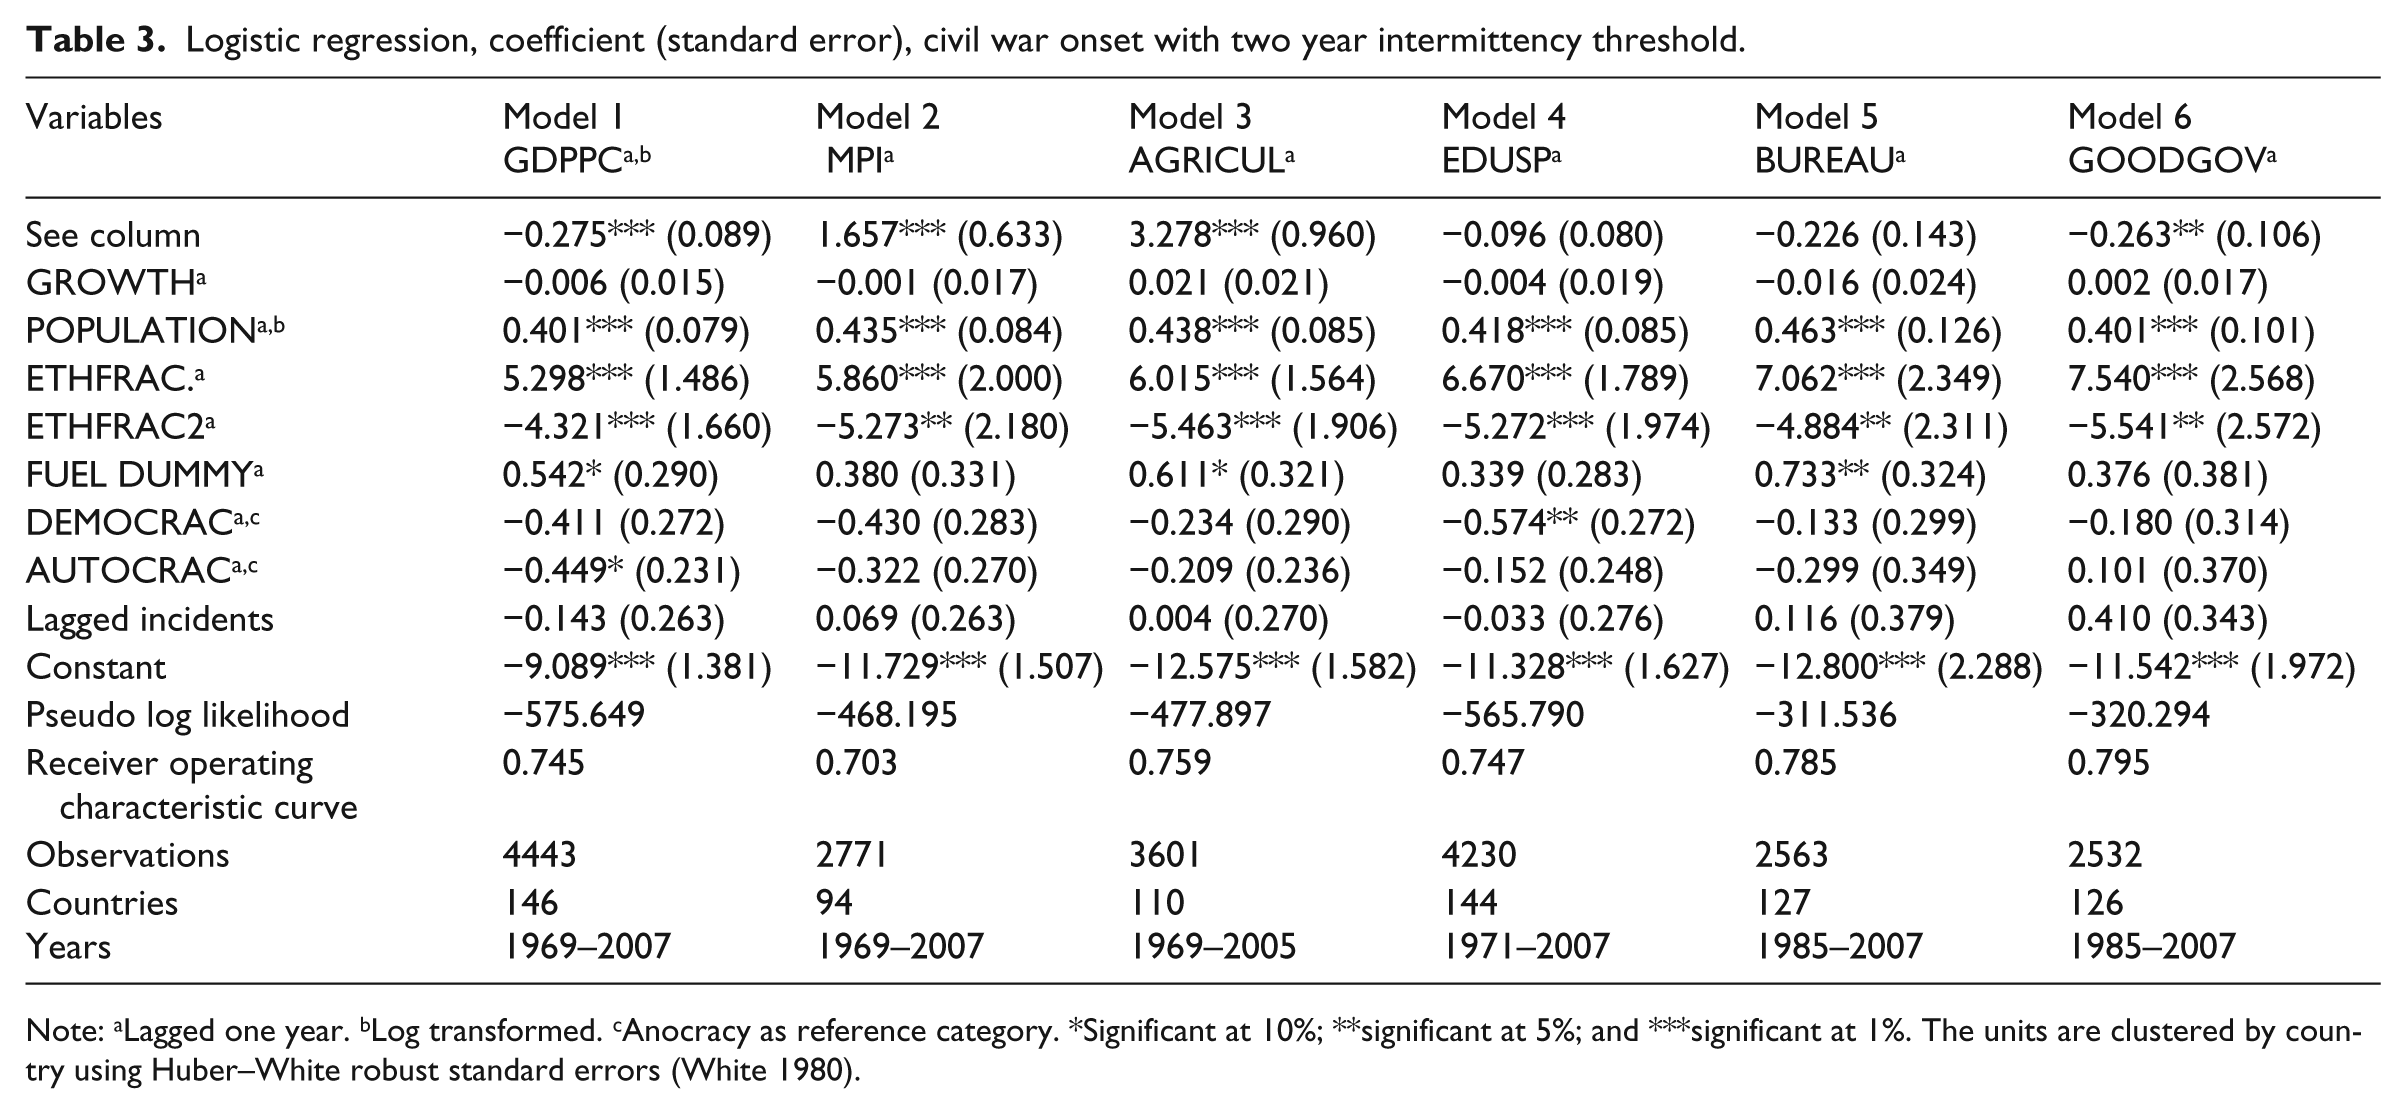
As already mentioned, there are shortcomings to our models. For one, there will always be a problem of missing data, especially when dealing with countries that are experiencing civil unrest. This places a limit on which variables we can include in our models; ideally we would have liked to include other measures as well. However, even with the ones we did use in our models, the missing values of each variable add up to become quite large, creating a relatively small N to compute our factors scores. To compensate for this, we have supplemented our analysis with models that use the method of multiple imputation. Still, generating new values based on other explanatory variables is not ideal. We therefore present addition models, depicted in Table 3, where we study the individual variables as opposed to the factors. This is mainly to see if the results from Table 2 are robust. We test six variables, of which three are associated with the Wealth dimension (columns 1–3) and three with the Capacity dimension (columns 4–6).
Logistic regression, coefficient (standard error), civil war onset with two year intermittency threshold.
Note: aLagged one year. bLog transformed. cAnocracy as reference category. *Significant at 10%; **significant at 5%; and ***significant at 1%. The units are clustered by country using Huber–White robust standard errors (White 1980).
Table 3 shows the regular models, where we control for economic growth, population size, ethnicity, fuel exports and regime type. The most noteworthy thing is that all three indicators of Wealth—per capita income, the Multidimensional Poverty Index and agricultural GDP—are highly significant (at the 0.01 level) predictors of civil war onset. Of the measures associated with state capacity, only good governance is shown to reduce significantly the risk of armed conflict, albeit only at the 0.05 level. As a robustness check, in Table A2 (in the Appendix) we again use the method of multiple imputation. The main results are, for the most part, similar to those presented in Table 3: the effect of wealth on civil war onset is unambiguously negative and significant.
We end this section by recapping the rational-actor argument. The central comparison is between the expected utility (EU) of rebellion (R) and the expected utility of keeping one’s daytime job (D)—that is, EU(R) > EU(D)—which, in a stylized sense, is a function of income level (i), potential reward ($) for insurgency and the perceived probability of success (p). Our factor analysis showed per capita income to be associated with other, perhaps more precise, proxies of poverty that measure education, health, living standard and the size of the agricultural population—and not to the dimensions made up by recognized indicators of grievances and state capacity, like state repression or corruption. In other words, we find relatively more support for the argument that poverty and depravation make organizing rebellion easier, an argument put forth by Collier and Hoeffler (2004) relating to rebel labor. We do acknowledge, though, that there are counter arguments against our conclusion. One would be that both grievance and state capacity are multidimensional concepts and that, despite that per capita income not being correlated to our Empowerment and Capacity dimensions, it could represent other facets of either of the two. We believe that this argument carries greater weight in relation to state capacity than to grievance. Our results anyway indicate stronger support for the arguments drawn up by Collier and Hoeffler (2004) than for those of Fearon and Laitin (2003). Even though the indicators we have used are rough, they are data used regularly in the literature. Our results are robust in that we both identified the different dimensions that can explain civil war onset, and estimated the impact of these dimensions separately on the onset of civil war.
Conclusion
Previous studies have shown per capita income to be a strong predictor of peace, but there have been several different interpretations as to why this is so. Some suggest that per capita income captures the opportunity-costs of rebellion. The poor fight because rebel leaders can easily recruit them compared with what governments will be able to offer through the regular economy. Others suggest that poverty is a measure of state capacity for deterring insurgency, and still others suggest that poverty captures the grievances of people because they have little access to social justice. We have investigated measures other than per capita income that are more “pure” indicators for poverty, state strength and social justice, respectively.
Our findings show that the wealth dimension is the most important underlying cause of civil war. This dimension is made up of variables like per capita income, the Multidimensional Poverty Index, and agricultural GDP. All of these measures are statistically significant if they stand as the only proxy for the wealth dimension, thus confirming that poverty leads to increased risk of civil war onset. One could argue that per capita income also encompasses state strength. However, our analysis shows that this measure actually has little in common with more “pure” state-strength measures like bureaucratic quality and good governance. We have also argued that empowerment of individuals and groups constitutes a better measure of access to social justice than is reading in too much about the level of grievances in a poor society. For sure, poverty fuels grievances, but income level also—and, as suggested herein, to a more substantial degree—affects the rational calculation of whether or not one instigates or joins a costly rebellion, and the results indicate that it is the latter factor that dominates among the determinants of rebellion.
Identifying the mechanism that drives conflict within poor countries is indispensable for aid and other peace-promoting policies. Increasing per capita incomes seems to matter substantially for bringing about peace relative to initiatives that might be more focused on softer issues of social justice. The fact that the rebellions in Tunisia and Egypt remained relatively peaceful and were subsequently more successful than in Libya or Yemen is telling. Despite much anger, the middle classes in Tunisia and Egypt were less likely to engage in violence because of higher opportunity-costs. Our results suggest that targeting the poor in ways that curb their possible inclinations to join violence is a rather prudent measure for building peace and prosperity compared with efforts of reform alone, reforms that the poor who ultimately engage in costly conflict may or may not understand as being necessary for their immediate economic well-being. Notice that the poor in Egypt, who depended on tourism, seemed to be the strongest allies of Hosni Mubarak. Notice also that the 2009 amnesty for rebels in the Niger Delta, a deal that promised thousands of militants training, stipends and jobs if they gave up their arms, has so far met with considerable success (The Economist, 2009, 2012). More generally, our results suggest that the recent decrease in the risk of civil war might in fact relate to the way in which many poor countries have managed to reduce levels of poverty in recent years. Armed conflict is not a necessary cost for removing bad governments and structures; raising incomes may indeed bring this about peacefully, and international donors might more effectively help accomplish this by means of political pressure and financial inducements even when there is no armed uprising.
There are, as mentioned, certain shortcomings to our analysis. The big elephant in the room, as in most other large-N studies of the causes of war, is the great number of missing values. We have compensated for this by using the method of multiple imputation, along with additional models testing the single variables independently. Although we make our findings and argue in favor of the Collier and Hoeffler (2004) interpretation of per capita income, we agree that a complex matter like why civil wars erupt needs to be addressed from multiple viewpoints. It is therefore encouraging for this research area that a number of recent studies have taken up the challenge presented by causal complexity by sophisticatedly focusing on the interrelationship between variables (e.g. Mitchell and Thies, 2012; Thies, 2010); by studying the impact of intervening variables and shocks to the system (e.g. Chassang and Padró i Miquel, 2009; Dube and Vargas, 2008; Nielsen et al., 2011); and by moving down to the subnational (e.g. Buhaug et al., 2011; Cederman et al., 2011) and individual (e.g. Humphreys and Weinstein, 2008; Oyefusi, 2008) levels. Civil war studies cannot rely solely on one methodological perspective. Neither can armed rebellion be properly understood merely by looking at one explanatory factor, as it is often the sum of both grievances and opportunity, the latter of which includes income, reward and the probability of success.
Footnotes
Appendix
Logistic regression, coefficient (standard error), civil war onset with two year intermittency threshold, using multiple imputation of missing values for main explanatory variable.
| Variables | Model 1 GDPPCa,b | Model 2 MPI a | Model 3 AGRICUL a | Model 4 EDUSP a | Model 5 BUREAU a | Model 6 GOOD GOV a |
|---|---|---|---|---|---|---|
| See column | −0.272*** (0.098) | 1.915*** (0.593) | 2.898*** (0.922) | −0.090 (0.078) | −0.221** (0.107) | −0.225** (0.089) |
| GROWTH a | 0.004 (0.014) | 0.005 (0.015) | 0.003 (0.014) | −0.003 (0.015) | −0.002 (0.015) | −0.002 (0.015) |
| POPULATIONa,b | 0.400*** (0.078) | 0.446*** (0.082) | 0.406*** (0.081) | 0.392*** (0.083) | 0.418*** (0.082) | 0.410*** (0.077) |
| ETHFRAC a | 5.699*** (1.664) | 6.209*** (1.690) | 5.854*** (1.601) | 6.278*** (1.721) | 5.394*** (1.547) | 6.066*** (1.683) |
| ETHFRAC 2 a | −4.965*** (1.855) | −5.689*** (1.890) | −5.095*** (1.837) | −4.856** (1.923) | −3.901** (1.713) | −4.783** (1.867) |
| FUEL DUMMY a | 0.427 (0.289) | 0.394 (0.274) | 0.556* (0.293) | 0.293 (0.290) | 0.355 (0.289) | 0.171 (0.304) |
| DEMOCRACa,c | −0.439 (0.273) | −0.499* (0.274) | −0.449* (0.268) | −0.616* (0.267) | −0.508* (0.260) | −0.585** (0.269) |
| AUTOCRACa,c | −0.237 (0.241) | −0.200 (0.244) | −0.290 (0.217) | −0.198 (0.241) | −0.384* (0.231) | −0.241 (0.246) |
| Lagged incidents | 0.008 (0.260) | 0.030 (0.260) | −0.027 (0.251) | 0.019 (0.266) | −0.148 (0.275) | 0.007 (0.265) |
| Constant | −9.100*** (1.403) | −12.076*** (1.491) | −11.818*** (1.503) | −10.821*** (1.572) | −11.028*** (1.478) | −10.725*** (1.413) |
| Probability of F | 0.000 | 0.000 | 0.000 | 0.000 | 0.000 | 0.000 |
| Observations | 4458 | 4429 | 4443 | 4436 | 4390 | 4413 |
| Countries | 149 | 148 | 148 | 149 | 148 | 149 |
| Years | 1969–2007 | 1969–2007 | 1969–2007 | 1969–2007 | 1969–2007 | 1969–2007 |

Note: aLagged one year. bLog transformed. cAnocracy as reference category. *Significant at 10%; **significant at 5%; and ***significant at 1%. The units are clustered by country using Huber–White robust standard errors (White 1980). Missing values of the main explanatory variables were imputed using multiple imputation based on the other explanatory variables.
Acknowledgements
The authors would like to thank Jon S. E. Jakobsen and Bjørn Høyland for graphical assistance and valuable input on this article.
Funding
This research received no specific grant from any funding agency in the public, commercial, or not-for-profit sectors.