




Abstract
We investigate the extent to which different forms of community participation explain variation in handpump sustainability using data collected from 200 rural communities in Ghana. Data sources include household surveys, engineering assessments of water points, and interviews with water committees and village leaders. The depth of community members’ involvement in project planning is positively associated with handpump sustainability, whereas the breadth of community participation is not. All else held constant, handpump sustainability is enhanced by household members’ involvement in management-related decisions, but is compromised when households are responsible for technical decisions.
Keywords
Introduction
Access to improved water supplies is lower in rural sub-Saharan Africa than any other world region. One in two people rely on unprotected sources such as traditional wells and rivers for their domestic needs (Joint Monitoring Programme 2012). Low access to improved water supplies in this region is explained in part by poor sustainability of water infrastructure. For example, virtually all of the funds for rural water supply development in Africa are dedicated to communal water points (e.g., borewells with handpumps), yet an estimated 36 percent of these are not working at any given time (Rural Water Supply Network 2009).
In an attempt to address challenges with sustaining rural water infrastructure, planners have shifted in recent decades from a centralized, supply-driven paradigm toward a more flexible, demand-oriented strategy (Briscoe and Ferranti 1988; Garn 1997). This shift was catalyzed by assessments of the International Drinking Water Supply and Sanitation Decade (1981–1990) which faulted a supply-driven approach for the premature failure of infrastructure installed during the decade (Therkildsen, 1988). In particular, governments and donors had largely prioritized rapid construction and expert advice over community engagement and water users’ input on key planning decisions. This approach often resulted in investments that did not reflect communities’ felt needs and preferences, and assets that they were unwilling and/or unable to operate and maintain. By contrast, demand-oriented planning theoretically targets communities that truly want and need water supply improvements, requires water users’ participation throughout planning and implementation, and vests them with key decisions about the project.
Two empirical studies sponsored by the World Bank suggest that demand-oriented planning has improved the sustainability of rural water supplies programs throughout developing regions. The first investigated the extent of demand responsiveness among 125 rural water projects across six countries, measured in terms of project initiation by community members, their ability to make informed choices, and their level of contribution to the project (Sara and Katz 1998). Demand responsiveness was found to be positively associated with indicators of project sustainability, all else held constant. The second study examined project records for 121 rural water schemes and assigned scores for the degree of control that community members exercised over project-related decisions during planning and construction. Greater community control was significantly associated with improved project effectiveness, which was measured in terms of construction quality, ongoing management, and the benefits delivered to community members (Isham, Narayan, and Pritchett 1995; Narayan 1995). More recently, a three-country study of rural water programs that emphasized participatory planning found that 89 to 95 percent of the communities had functioning water points four or more years after construction (Whittington et al. 2009). The authors conclude that the demand-responsive planning model (coupled with access to institutional support) has substantially improved the sustainability of community-managed water supplies in developing countries.
Whereas the association between participatory planning and sustainability of rural water infrastructure is well documented in the literature, comparatively little attention has been afforded to identifying the particular forms of community participation that matter most. Addressing this knowledge gap is important when one considers the significant investments and responsibilities that demand-oriented planning confers upon community members (Jaglin 2002). Such responsibilities often include contributing cash and labor toward the capital cost of the water system; attending planning meetings and trainings related to the project; making key decisions regarding technology choice, service pricing, and management of the infrastructure; and financing 100 percent of ongoing operation and maintenance (O&M) costs. Institutionally, communities are often required to form a water committee charged with overseeing the ongoing management of the system. Understanding which among these activities actually contributes to water system sustainability can thus strengthen rural water planning and project design.
Indeed, the limited empirical literature exploring the relationship between specific forms of community participation and outcomes suggests limited impacts of some commonly adopted project elements. In an investigation of 45 rural water projects in India, Prokopy (2005) found that capital cost contributions and household involvement in decision making were both associated with indicators of better water system performance, but households’ attendance at planning meetings before and after construction was not. In a study of community-managed infrastructure projects in Northern Pakistan, Khwaja (2004) concluded that households’ involvement in nontechnical decisions (e.g., usage rules and management) was associated with better maintenance of assets, but involvement in technical decisions (e.g., infrastructure design and project scale) was detrimental to maintenance. Two studies using data from 50 rural communities in Kenya focused on intermediate outcomes (sense of ownership and satisfaction) that are theorized to drive the sustainability improvements associated with participatory water planning (Marks and Davis 2012; Marks, Onda, and Davis 2013). In both cases, the authors found that these outcomes were positively associated with a household’s having made substantial cash contributions toward construction of their piped water system, and having helped decide the level of service to be provided.
The research presented here builds upon this previous work in two important ways. First, it examines a broad range of participatory activities that community members may undertake during the planning and construction of their water system, rather than focusing on a limited set. Second, it pays particular attention to both the breadth of community participation (as measured by the percentage of households that participated in a particular planning activity), as well as the depth of community participation (as measured by the typical households’ extent of engagement).
The study makes use of data from a 2005 study on postconstruction support (PCS) for community handpumps that was conducted within two hundred rural communities located in two regions of Ghana. In the next section, we describe the study setting, followed by a description of the sample frame and data collection strategy. Next, we present findings on community characteristics and the forms of participation undertaken by households. Sustainability of the project handpumps is explored, as measured by the condition of the infrastructure, the quality of the water service, and the ongoing management practices of the water committee. Several models of handpump sustainability are presented as a function of community members’ depth and breadth of participation. We conclude with a discussion of key findings and recommendations for the rural water planning community.
Study Site: Rural Water Supply in Ghana
Ghana had a population of about 21 million people in 2005, the year the study was conducted, with about half the population living in rural areas. In 1990, the percentage of rural Ghanaians with access to improved water supply was 36 percent (Joint Monitoring Programme 2010). By 2005, rural coverage had increased to 69 % it has further increased to 80 percent as of 2011. This progress was made despite a 2.5 percent average annual increase in the country’s population over the same period (Joint Monitoring Programme 2010).
Since the 1990s, national water policy in Ghana has included the goal of expanding effective and sustainable services to rural areas, where most of the country’s unserved live, through a decentralized “demand-driven” approach (World Bank 2006). The national Community Water and Sanitation Agency (CWSA) is responsible for coordinating and facilitating the activities of the rural water sector. The CWSA also provides management training to district assemblies who are responsible for planning and implementing rural water investments. Communities submit proposals for new rural water projects to the district assemblies; if a community’s proposal is accepted, it is expected to form a water and sanitation committee and engage water users (especially women, as the main users of domestic water points in rural areas) in decisions regarding technology options and management choices (World Bank 2006). Following construction of the water point, communities are expected to operate and maintain it, with district assemblies holding the infrastructure in trust.
This study takes place within two hundred communities in the Volta and Brong Ahafo regions, where the Danish International Development Agency (Danida) and the World Bank’s International Development Association (IDA) financed rural water programs, respectively (Figure 1). The Danida and IDA programs are comparable in the type of technology delivered (deep boreholes with manual handpumps) and in their approach to mobilizing community members. In both programs, capacity building during project planning included initial training in management skills for water committees and technical training for handpump caretakers. Community members were consulted about key decisions such as tariff design, water committee membership, and/or borehole siting. Communities were also expected to make contributions toward the capital costs of the water point, and to provide labor during its installation. The cost of installing a water point in this region was in the range of US$10,000–US$12,000 at the time of the study (Whittington et al. 2009).
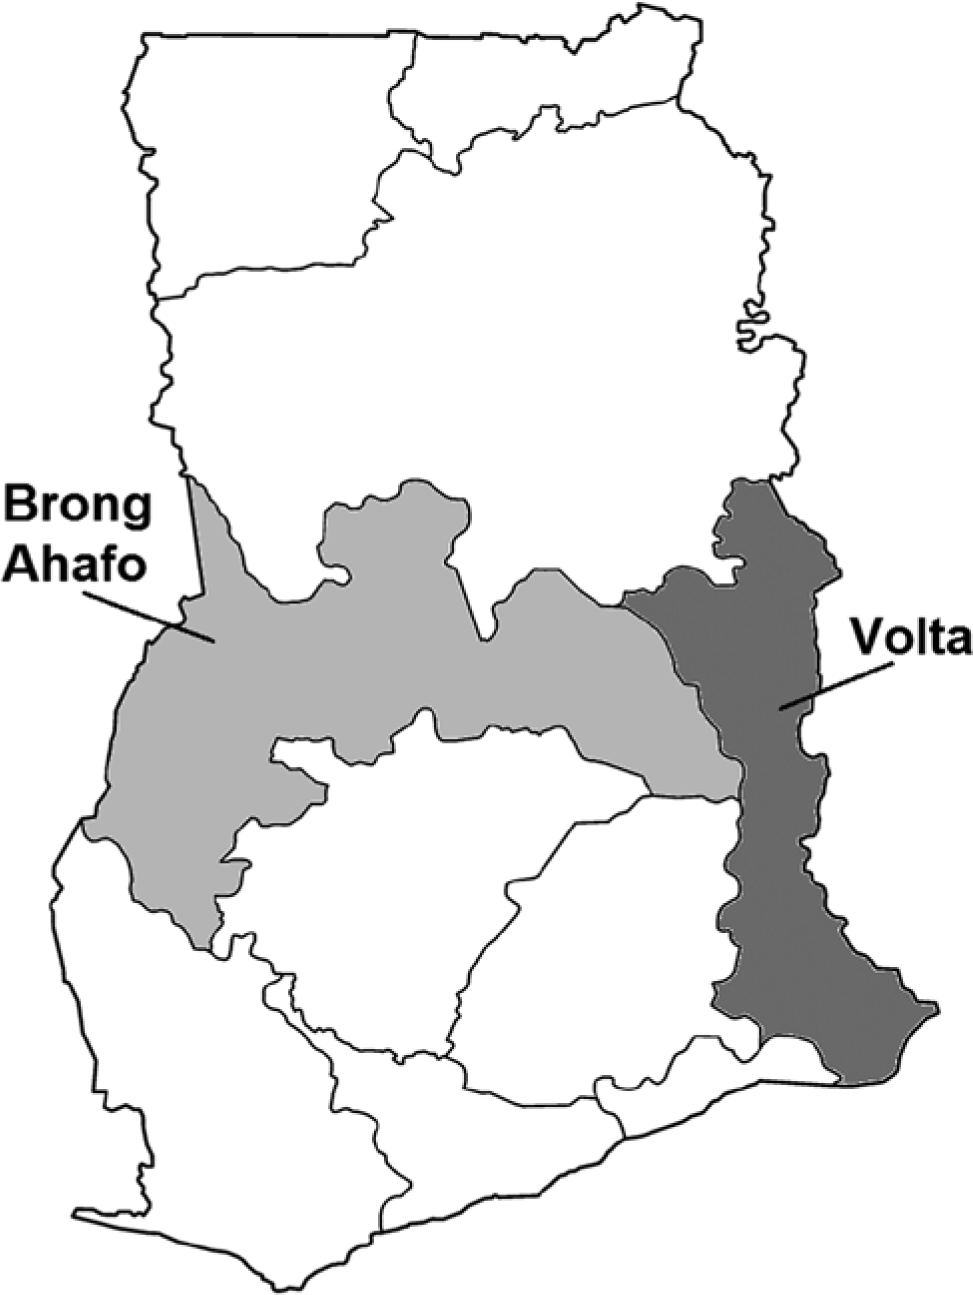
Map of Ghana showing study regions.
Communities in our sample also had access to several forms of postconstruction support for maintaining their water points. The Danida-funded program in Volta included quarterly visits by environmental health assistants who provided technical and administrative assistance to water committees. Communities within both regions had access to the district water and sanitation team (DWST), which consisted of an engineer, a hygiene expert, and a community mobilizer. The DWST did not provide circuit rider visits, but would send a technician trained in routine maintenance and repair work if requested by a community. In addition, other ad hoc forms of postconstruction support were available in certain districts, including grants provided by members of parliament or free repairs provided by nongovernmental organizations (Komives et al. 2008). At the time of the study, the project boreholes had been installed for between four and eight years; 94 percent were working at the time of the study team’s visit.
Methods: Sample Frame Development and Data Collection Activities
Development of the study sample frame was driven by a prior investigation focused on postconstruction support for rural handpumps (Whittington et al. 2009). The two study regions were chosen because they provided different forms of postconstruction support to communities. Otherwise, they were similar in terms of water resources availability and the design and implementation of the rural water program. Within each region, districts were matched based on the available socioeconomic data, with four districts selected within Brong Ahafo and five districts selected within Volta.
Within selected districts, sampling was limited to communities that had received one or two boreholes withhandpumps through the Danida or IDA program at least five years prior to the study. Based on these criteria, 120 communities within Brong Ahafo and 97 communities within Volta were identified. In Brong Ahafo 103 of the 120 communities were randomly selected and all 97 communities within Volta were retained, for a total of 200 communities. At the time of the study (2005) the population within the sampled communities ranged from two hundred to five thousand. Within each community, twenty-five households were chosen at random for participation in the study.
Across the two hundred sample communities, a total of 5,002 household surveys, 195 group interviews with water committee members, 200 interviews of village leaders, and 200 focus group discussions with women were completed. In addition, a technical assessment of each community’s water point(s) was conducted by district government engineers collaborating with the study team. All interviews were conducted in either Twi or Ewe languages. Field teams spent about one full day in each community to complete all data collection activities.
Findings: Community, Household, and Committee Characteristics
The typical community in our sample contained hundred households and was seven miles from a paved road. Half of the sampled communities had received one borehole and the other half had received two. Each borehole served a median of 177 people. The household survey collected data on trust among community members, which is hypothesized to influence their willingness to collectively manage their water point. An average of 45 percent of households said that they could borrow money from someone outside of their family, and the same proportion agreed that most people within their village are willing to help their neighbors if needed. Three-quarters of households said that they trust their neighbors.
The typical household survey respondent was forty-three years old and lived in a home with cement flooring and a durable roof (Table 1). Respondents reported a mean monthly expenditure per capita of about US$13.60. Few households had a working electricity connection or a cell phone at the time of the study. On average, 95 percent of households within a sampled village reported using the project boreholes on a regular basis, although 38 percent also continued to collect water from unprotected sources during the dry season.
Household Characteristics (n = 200).
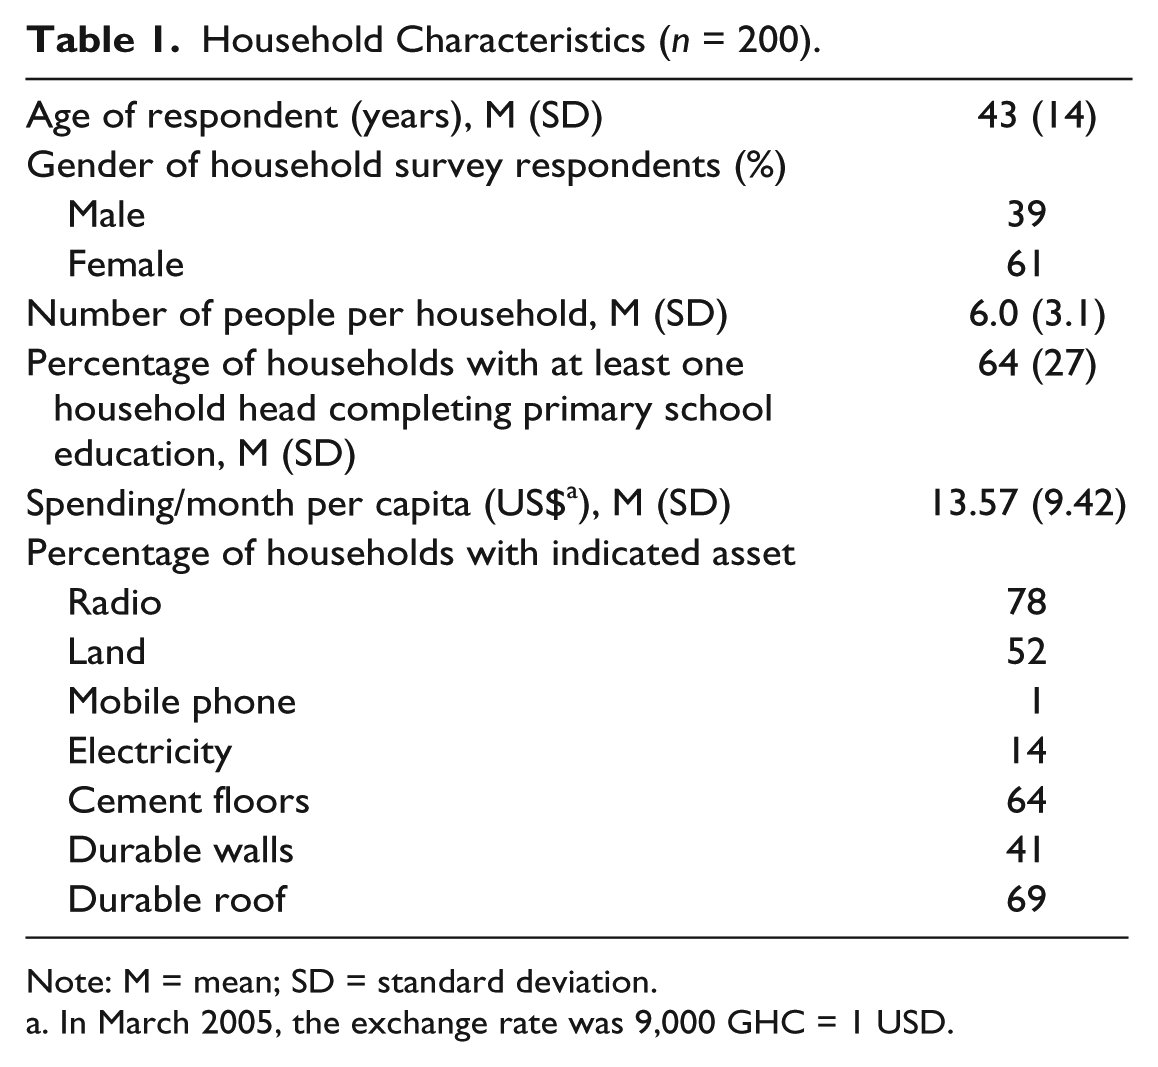
Note: M = mean; SD = standard deviation.
In March 2005, the exchange rate was 9,000 GHC = 1 USD.
Water Committees and External Support
Most water committee members were either elected (42 percent) or appointed (43 percent) to their positions as chairperson, vice chair, treasurer, secretary, or caretaker. Virtually all water committees included at least one woman, with an average of three women serving. The majority of water committees (83 percent) had undergone some form of training since the handpumps were installed.
Water committees were responsible for a variety of management functions, including contacting area mechanics for technical assistance when needed (96 percent), maintaining financial and maintenance records for the water point (96 percent), resolving conflicts among water users (90 percent), and facilitating training sessions within the community (81 percent). Water committees were responsible for relatively fewer technical tasks, including performing regular maintenance checks (70 percent), making minor repairs (51 percent), and ensuring that the water points remain clean (55 percent).
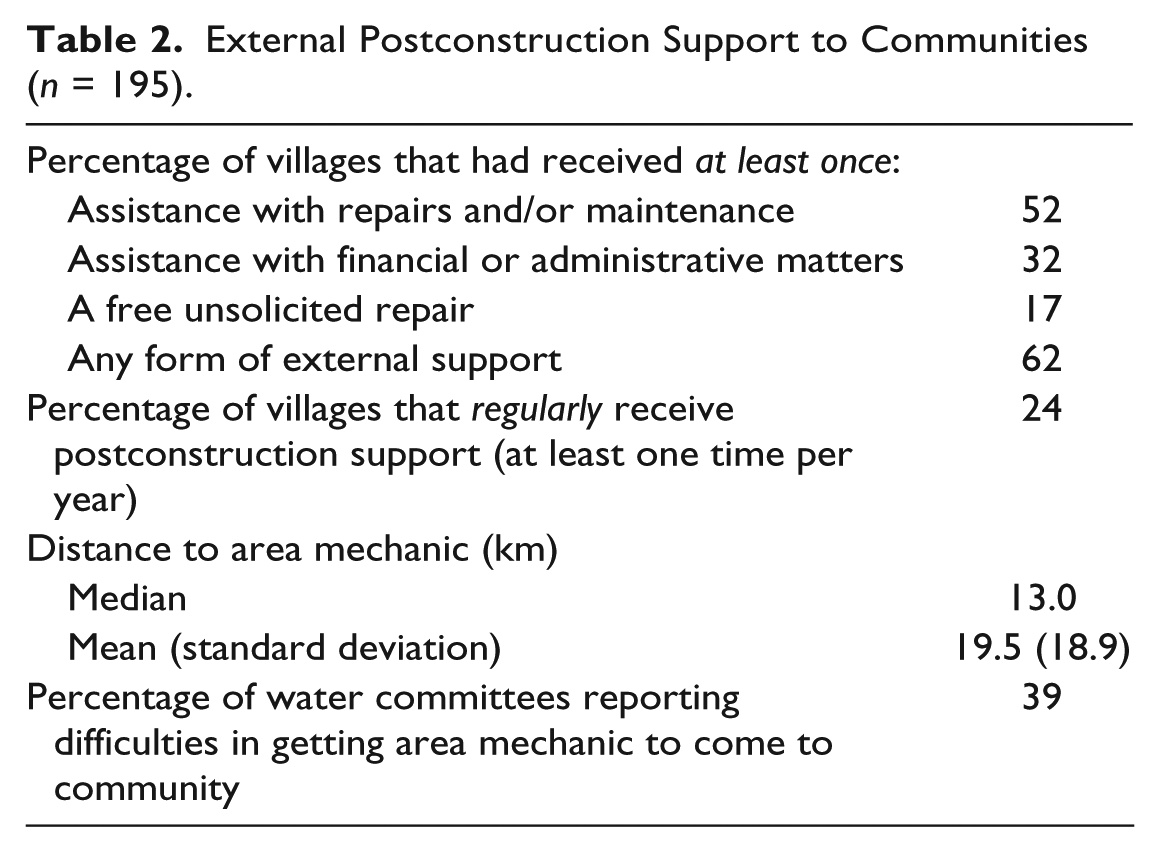
The water committee survey revealed that postconstruction external support played an important role in many communities (Table 2). Following installation of their water points, nearly two-thirds (62 percent) of the sampled communities had received assistance with repairs, maintenance, or management matters. A quarter reported receiving such visits on a regular basis. Despite the prevalence of such support, a substantial share of committees reported difficulties getting area mechanics to come to the community when needed.
External Postconstruction Support to Communities (n = 195).
Community Participation in Planning and Construction
Breadth of participation is measured in terms of the share of households that reported having been involved in a particular planning or construction activity. Depth of participation is measured in terms of the amount of cash or labor contributed to the project, the number of planning meetings attended prior to construction, and whether households felt that the community had had the most influence over project-related decisions.
In the average community, most households had attended planning meetings about the project, half had contributed cash toward the capital cost of the infrastructure, and one-quarter had provided labor (Table 3). Measures of participation depth revealed a median capital cost contribution of US$0.60 (equivalent to 7 percent of current average weekly household expenditures). The median labor contribution was less than one day per household, likely because of the relatively low labor requirements for handpumps.
Households’ Participation in Planning and Construction as Defined by Measures of Breadth versus Depth (n = 200).
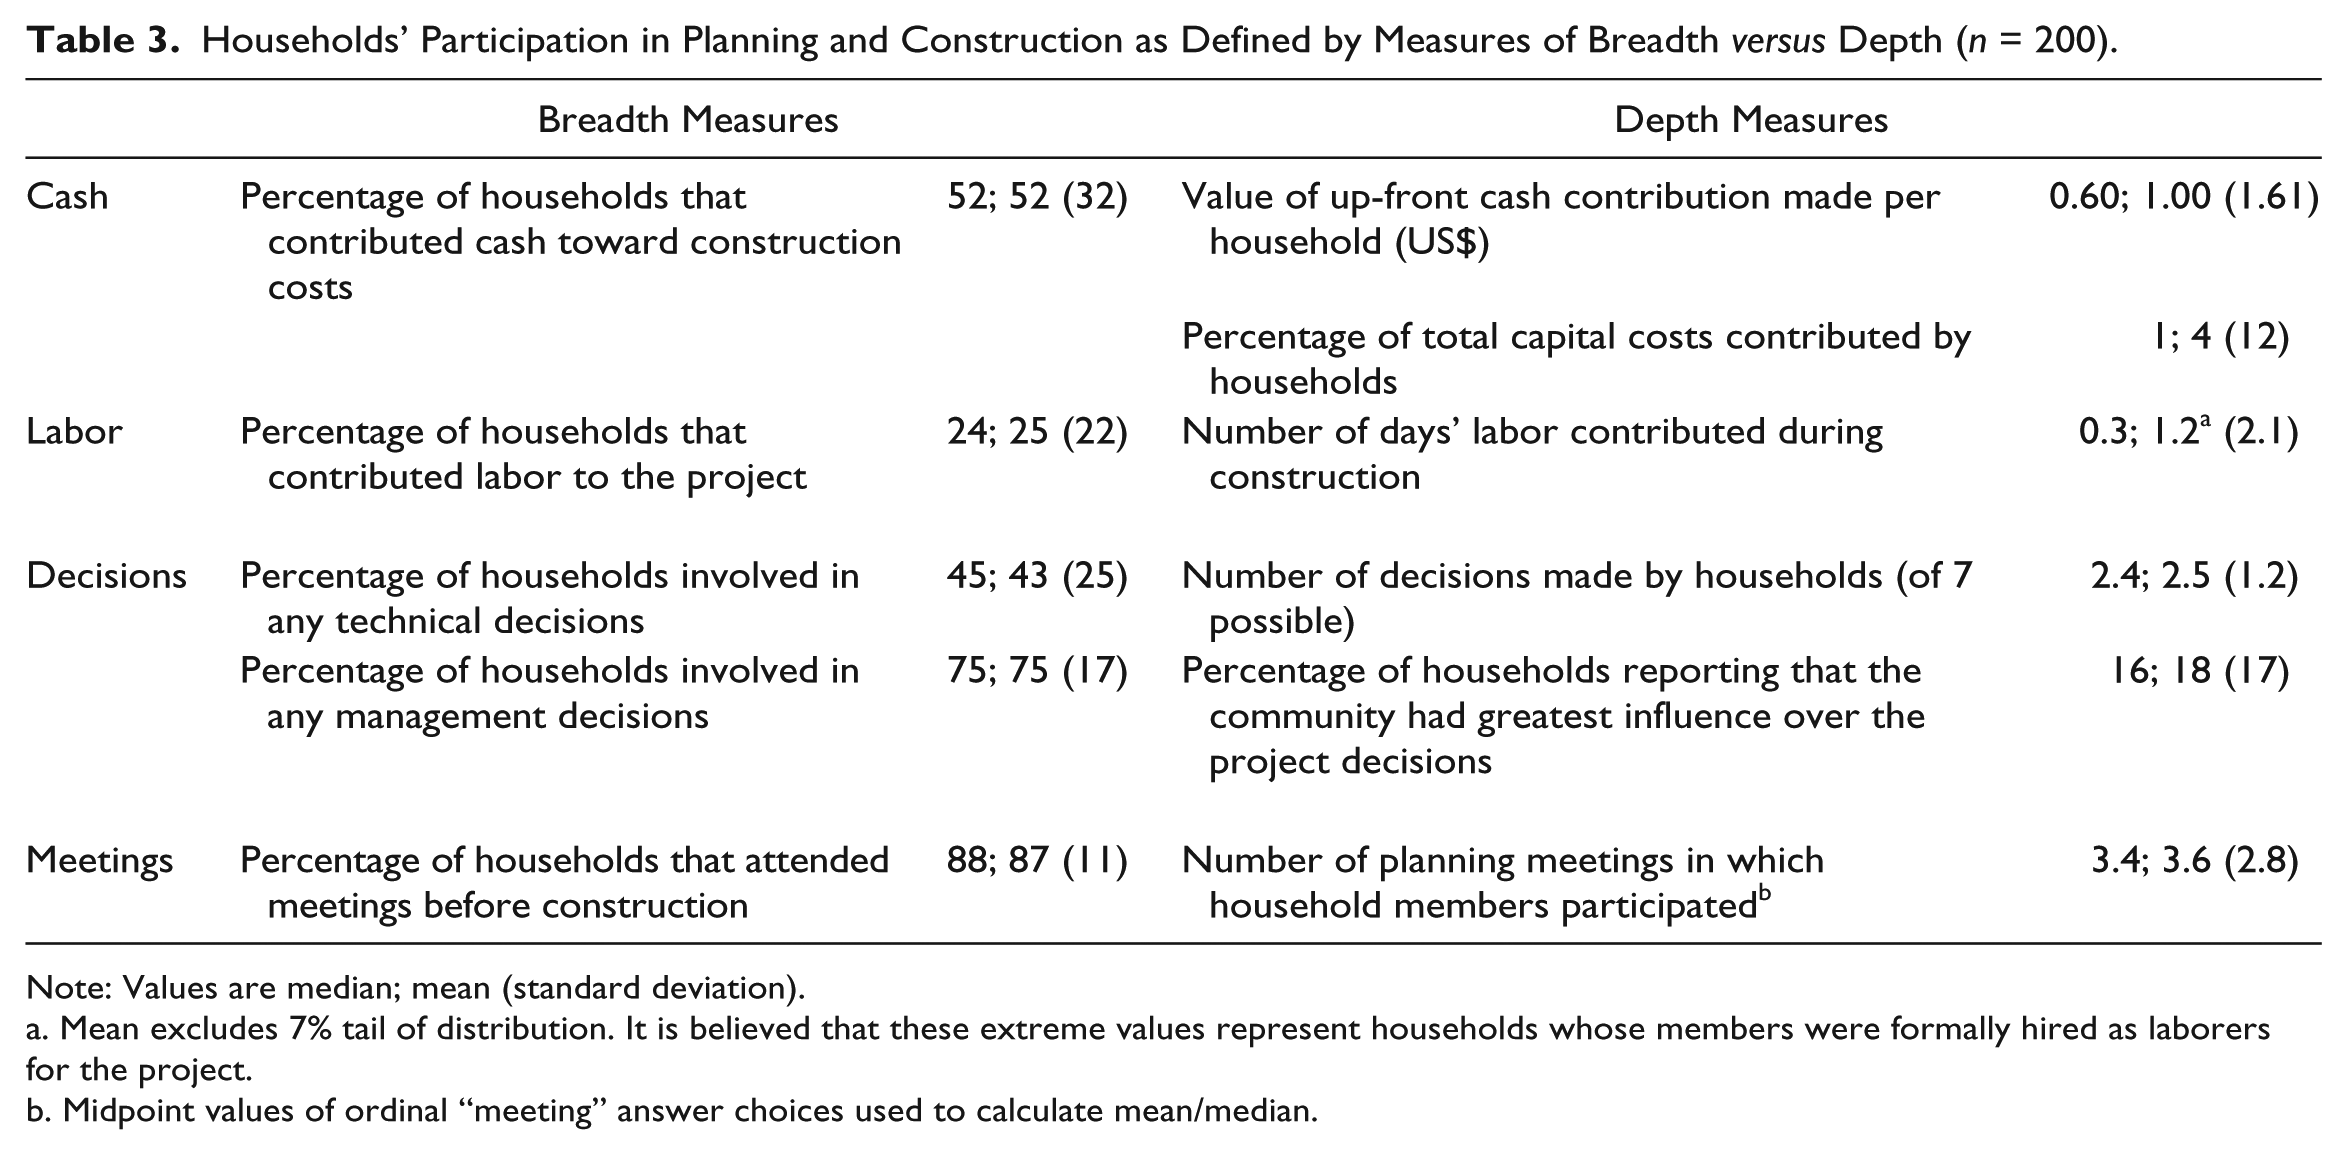
Note: Values are median; mean (standard deviation).
Mean excludes 7% tail of distribution. It is believed that these extreme values represent households whose members were formally hired as laborers for the project.
Midpoint values of ordinal “meeting” answer choices used to calculate mean/median.
A substantial share of respondents reported having been involved in making both technical and management decisions about their community’s water project. Technical decisions included choosing the type of handpump to be installed and where to drill the boreholes. Management-related decisions included selecting water committee members, determining operating hours for the water point, establishing requirements for cash and/or labor contributions by households, and choosing a tariff structure for their water service. The average household was involved in 2.5 decisions of the seven decisions probed, the most common being establishing water committee member selection procedures and determining requirements for cash and labor contributions.
When asked an unprompted question about which group or individual had the greatest influence in decisions about the water project overall, approximately one in five households responded that community members were the most influential. Most households reported that community leaders or the water committee had had the most influence over the project.
Sustainability of Project Handpumps
Sustainability was operationalized along several dimensions based on concepts and indicators presented in two previous studies of rural water supplies (Davis et al. 2008; Prokopy 2005). First, using the engineer’s technical assessment and water committee survey data, the current infrastructure condition in each community was assessed in terms of (1) whether all handpumps were functioning at the time of the study, (2) whether there had been an unexpected interruption in the water service during the six months prior to the interview, and (3) a rating of the handpump platforms’ condition from “poor” to “very good.” Second, household survey and women’s focus group data were used to assess the quality of water service, as measured by (1) the percentage of households that reported being satisfied with their water service, and whether or not participants in the women’s focus group collectively reported being satisfied with the (2) operation and maintenance of their water point, and (3) quality of water supplied by the handpump. Third, the ongoing operation and management of the water point was assessed using water committee interview data, specifically (1) the share of committees who collectively believe their community’s water point would continue to function over the next 5 years; (2) whether the committee had collected sufficient revenues in the year prior to the study to cover regular O&M expenditures; (3) whether O&M expenditures in the past year equaled at least 1 percent of the infrastructure’s capital cost; and (4) whether the committee held regular monthly meetings with users in the past year.
Infrastructure Condition and Service Quality
Most project handpumps were functioning at the time of the field team’s visit. However, many communities were experiencing ongoing challenges with operating and maintaining their water points. For example, nearly half of the water committees interviewed reported having an interruption in water services in the past six months (Table 4). More than one-third of the handpumps assessed had platforms judged to be in poor condition by the study team engineers.
Recent Handpump Functioning.

Household satisfaction with the project handpumps was generally high. At the community level, four out of five water users on average reported being satisfied with the preventative maintenance of, repair services for, and committee’s management of the water point. About half of the women’s focus groups reported being collectively satisfied with the pressure, taste, color, odor, and safety of water obtained from the handpump.
Ongoing Management Practices
Efforts to cover operation and maintenance costs through collection of user fees appeared successful in about half of sample communities (Table 5), suggesting challenges to the financial viability of the project handpumps are likely to arise in the future. Just over half of the water committees had spent US$25 or more in the year prior to interview, a value that has been proposed as a minimum threshold for sustaining a typical borehole/handpump system over the medium term (Baumann 2006). Most water committees (80 percent) thought that their handpumps would continue to function over the next year, but only 56 percent believed that it would be operational for another five years.
Financial Health of the Project Handpumps (n = 193).

Note: O&M = operation and maintenance.
An additional measure of the ongoing management of the water points is the frequency with which committees held meetings with water users. Nearly half (45 percent) of the water committees interviewed reported holding meetings on a regular basis, with a median of six meetings in the year prior to the interview. Two-thirds of water committees reported that women participated in meetings at least as much as men did.
Explaining Variation in Sustainability: Regression Analysis
Several multivariate regression models of handpump sustainability were estimated in order to identify types, depth, and breadth of participation associated with better outcomes. These models control for other factors known to influence the functionality of water points in rural settings, such as socioeconomic status, availability of secondary water sources, the level of trust among community members, and the water committee’s access to postconstruction support.
Models 1 and 2 (Table 6) explain variation in water infrastructure condition as measured by whether the handpump was working at the time of the study and whether the platform was deemed to be in good condition during the engineering assessment. None of the participation breadth variables is significantly associated with handpump functionality (Model 1), although this result could be driven in part by limited variation in the dependent variable. All else constant, households’ attendance at preconstruction meetings (p = 0.04) and their involvement in technical decisions (p < 0.01) were each associated with poorer platform condition (Model 2). Conversely, platform condition was likely to be better, all else held constant, in communities where households had been relatively more involved in management-related decisions (p < 0.01). For example, comparing a community in which 80 percent of households participated in management-related decisions to one in which only 40 percent participated, the odds of having a platform in good condition would be 87 percent higher in the first community. Applying the same example to participation in technical decisions, the odds of a healthy platform would be 80 percent lower in the first community.
Regression Analysis: Infrastructure Condition.

Note: Exp(B) reported with Wald test statistic in parentheses. SD = standard deviation; HH = household; HP = handpump; DWST = district water and sanitation team.
Mean excludes 7% tail of distribution because it is believed that these values were reported by households whose members were hired as laborers for the project.
0.05 < p ≤ 0.10; **0.01 < p ≤ 0.05; ***p ≤ 0.01.
Larger up-front cash contributions are negatively associated with handpump functioning and platform condition, although the association is only marginally significant in Model 1 (p = 0.07). No other indicator of participation depth was significantly associated with infrastructure condition. Similarly, the majority of control variables included in the analysis were not significantly associated with the dependent variables. Exceptions included the availability of a secondary water source during the dry season (negatively associated with handpump functioning) and technical assistance visits from the district water team (positively associated with platform condition). Finally, and contrary to expectations, community trust was negatively associated with handpump functioning and positively associated with platform condition, all else constant (both p < 0.01).
Quality of Water Services
Table 7 presents the reduced models of households’ (Model 3) and focus group participants’ (Model 4) satisfaction with operation and maintenance of the water points. Households’ satisfaction with the water service is greater, all else constant, as the breadth of household involvement in technical project decisions decreases (p = 0.02). For example, in a community where 40 percent of households participated in technical decisions as compared to one in which 80 percent participated, the odds of satisfaction with the service is 55 percent greater. In addition, there is a 20 percent increase in the odds of women being satisfied with operation and maintenance for every additional 10 percent of households contributing cash toward construction (p = 0.04). No other indicators of breadth of participation were significantly associated with users’ satisfaction.
Regression Analysis: User Satisfaction.

Note: Exp(B) reported with Wald test statistic in parentheses. SD = standard deviation; O&M = operation and maintenance; HH = household; HP = handpump; DWST = district water and sanitation team.
Mean excludes 7% tail of distribution because it is believed that these values were reported by households whose members were hired as laborers for the project.
0.05 < p ≤ 0.10; **0.01 < p ≤ 0.05; ***p ≤ 0.01.
Depth of perceived community influence over project planning is independently associated with both household and women’s satisfaction with water supply services (p = 0.04 for both). By contrast, depth of participation in meetings was positively associated with satisfaction among household survey respondents (p = 0.05) but negatively associated with satisfaction among women’s focus group participants (p = 0.06). Finally, and as expected, the odds of a study participant being satisfied with their water services are higher in communities with a working handpump and less congestion at the water point.
Operation and Maintenance
Two final logistic regression models explore the association between participation and the financial health of water points in study communities (Table 8). In Model 5, the dependent variable takes a value of one if the water committee spent at least the equivalent of 1 percent of the capital cost of the water point on O&M in the year prior to interview, and zero otherwise (expenditure sufficiency). A full calculation for expenditure sufficiency for the hardware should include the O&M costs that were covered by the postconstruction support team, but these data were not available at the time of the study. In Model 6, the dependent variable takes the value of one if water committee members reported having collected enough monies from users to cover all regular O&M expenditures in the year prior to interview (revenue sufficiency).
Regression Analysis: Financing Maintenance.

Note: Exp(B) reported with Wald test statistic in parentheses. SD = standard deviation; O&M = operation and maintenance; HH = household; HP = handpump; DWST = district water and sanitation team.
Mean excludes 7% tail of distribution because it is believed that these values were reported by households whose members were hired as laborers for the project.
0.05 < p ≤ 0.10; **0.01 < p ≤ 0.05; ***p ≤ 0.01.
Contrary to expectations, increased breadth of participation in terms of preconstruction labor and cash contributions is negatively associated with these measures of financial health. As with the models of user satisfaction, the effect of preconstruction meetings is mixed: more attendance is positively associated with expenditure sufficiency but negatively associated with revenue sufficiency (both p = 0.03). Breadth of participation in management-related decisions during project planning is positively and significantly associated with revenue sufficiency; all else held constant, the odds of covering O&M costs through user fees increase by 40 percent with each 10 percent increase in the share of households engaged in management-related planning (p = 0.03).
Depth of financial contribution, as measured by the mean cash value given toward capital costs, is significantly and positively associated with both financial sustainability outcomes. Revenue sufficiency is also more likely in communities that convened relatively more preconstruction meetings with users (p = 0.02). Revenue sufficiency is negatively associated, however, with the share of households reporting that the community had the most influence over key project decisions (p = 0.01). Interestingly, O&M spending is negatively associated with community wealth (as measured by per capita monthly expenditure p = 0.05) and with receiving regular post-construction technical assistance visits (p = 0.04).
Discussion and Conclusions
Given the extensive documentation of high failure rates among water points in sub-Saharan Africa, it is notable that nearly 90 percent of handpumps in study communities were functioning at the time of the visit. At the same time, during the six months prior to the study nearly half of the sampled communities had experienced an interruption in their water service that typically required two weeks to repair. Moreover, nearly half of the water committees were not collecting enough in user fees for water to cover ongoing operation and maintenance. These findings demonstrate the importance of using multiple indicators to evaluate water point sustainability in a comprehensive manner.
This investigation is limited by its reliance on respondents’ recollections of events that took place within their community, often several years prior to the study. The majority of study participants, however, had clear memories about the construction of their water point, which typically represented a significant milestone in the history of their community. In addition, the cross-sectional research design allows for the possibility of reverse causality. For example, within communities with a functional water point, households may have a more favorable view of the planning process that took place and be more likely to report having influence over decisions about the project. It is also difficult to explore the contribution of community participation to handpump functionality given the limited variation in this outcome.
Given these caveats, the investigation yields several insights relevant to rural water infrastructure planning. First, in these communities water point sustainability is associated with the depth, but not the breadth, of residents’ involvement in the planning process. Water committees that held relatively more planning meetings with community members were more likely to be collecting user fees sufficient to cover maintenance and repairs several years into the postconstruction period. Water users’ satisfaction with the handpump is also positively associated with more intensive engagement during planning, including meeting attendance and taking part in key decisions about the project. In addition, financial health of the water point is positively associated with households’ mean cash contribution toward its construction. By contrast, the share of households participating in project planning or making up-front contributions is not associated with more sustainable outcomes.
These findings are particularly important given the widespread practice of engaging as many households as possible in rural water supply project planning. Indeed, many project rules stipulate minimum percentages of households whose representatives must take part in meetings and/or make particular types of up-front contributions in order for a community to be eligible for a new water point. The results from this work suggest instead that meaningful, non-token forms of participation—which may only engage a subset of the community—are more important for predicting water supply sustainability among villages in our sample. Similar conclusions were reached by Marks and Davis (2012) regarding the relationship between community members’ participation and their sense of ownership for rural water infrastructure in Kenya.
Second, we find that project outcomes are better within communities where a greater share of households reported participating in management-related decisions, and worse in communities where more households participated in technical decisions. This trend is observed across multiple decision types and models of sustainability. These findings are consistent with prior research on infrastructure performance in rural Pakistan (Khwaja 2004) and suggest that efforts to engage community members in water infrastructure planning must be balanced with the need for projects to be designed in accordance with sound engineering principles.
A third key insight is that communities’ access to postconstruction support services is strongly associated with handpump sustainability outcomes, even after features of the planning process are taken into account. This finding is consistent with prior studies that demonstrate the critical role of institutional support for ensuring sustainable water supplies (Schouten and Moriarty 2003; Whittington et al. 2009) and especially management-oriented support (Davis et al., 2008). Interestingly, post-construction support in this study is positively associated with better handpump platform condition and households’ satisfaction with their water service, but is negatively associated with expenditure sufficiency for O&M of the infrastructure. This finding could possibly be explained by the fact that support programs may provide discounted or even free repair services, thereby reducing the amount of money water committees must spend to maintain their water point. It could also be the result of reverse causality; that is, committees that fail to provide adequate funds for maintenance are more likely to experience technical challenges that lead them to solicit postconstruction support.
A final insight is that the use of multiple indicators of water supply sustainability can provide a more nuanced understanding of both short- and long-term prospects for reliable service delivery. To the extent that a more exhaustive yet standardized set of indicators were employed by researchers and practitioners, the sharing of knowledge and lessons learned across programmatic, organizational, and national boundaries could be facilitated.
The shift from supply- to demand-oriented planning of rural water supplies is widely believed to have improved the record of sustainability in the sector. In sub-Saharan Africa, however, the failure rate of handpumps remains disappointingly high. The next challenge for planners and researchers seems to be identifying those features of community participation processes (and postconstruction support services) that yield the greatest return for water infrastructure sustainability. The study presented here represents such an effort, and calls into question some key principles of participatory rural water planning as it is currently practiced. Additional investigations would help identify the extent to which these insights are robust to context and thus helpful for organizing community participation to greatest effect.
Footnotes
Acknowledgements
We thank Dr. Rich Thorsten for useful input on data analysis and Natalie Exum for research assistance on this project. Valentina Zuin, Ralph Hall, and David Freyberg provided helpful feedback on earlier versions of the manuscript.
Declaration of Conflicting Interests
The author(s) declared no potential conflicts of interest with respect to the research, authorship, and/or publication of this article.
Funding
The author(s) disclosed receipt of the following financial support for the research, authorship, and/or publication of this article: Graduate funding for S. J. M. was provided by the National Defense Science and Engineering Graduate Fellowship and a research fellowship from the Stanford Center for African Studies.