
Abstract
Public transit users are expected to have higher levels of active transportation (AT, walking and bicycling) because they often need to walk to and from transit. Surveys in Baltimore and Seattle (n = 1,622) revealed that transit users performed more AT than nonusers, especially when dependent on transit. Health benefits and impacts of their limited travel options are discussed. Choice transit riders, who use transit and have a car, and dependent transit riders, who are limited to transit use, are compared for differences in AT and leisure physical activity time (LPA). Less LPA is explored as a consequence of the additional AT.
Introduction
Active transportation has been identified as an important solution to the current health burden of inactive lifestyles (Sallis et al. 2004; USDHHS 2008). Many public transit users achieve physical activity recommendations solely by walking to and from transit (Besser and Dannenberg 2005; Morency, Trépanier, and Demers 2011; Freeland et al. 2013; Wasfi, Ross, and El-Geneidy 2013; Saelens et al. 2014). Lachapelle and Frank (2009) found that taking transit trips nearly tripled the probability of meeting the physical activity guidelines of at least moderate intensity—150 minutes a week of brisk walking or its equivalent (USDHHS 2008). The same study found that taking car trips reduced the probability of meeting this guideline. Commuting by public transit has also been associated with a lower probability of being obese (Ming Wen and Rissel 2008; MacDonald et al. 2010). General use of public transit and specifically commuting by public transit has been associated with higher overall levels of accelerometer-recorded physical activity (Brown and Werner 2007; Lachapelle et al. 2011) and pedometer-recorded walking (Wener and Evans 2007; Villanueva, Giles-Corti, and McCormack 2008). 1 Using the survey data analyzed here in combination with accelerometer measures, transit commuters performed more objectively measured physical activity regardless of whether they lived in high- or low-walkability neighborhoods (Lachapelle et al. 2011). This is partly because transit users walked more to destinations near their homes and workplaces.
Previous studies focused on the walk to transit, overall walking, and objectively measured physical activity of transit users (Rissel et al. 2012). Differences in physical activity may also exist among subgroups of transit users. Saelens et al. (2014) found that transit users walked more on transit days than on nontransit days. However, active transportation patterns may also differ across types of transit users and nonusers, depending on car availability. An analysis of the 2009 National Household Travel Survey (NHTS) showed that transit-dependent riders took more frequent walk and bicycle trips over a week (Lachapelle, 2015). There is also a well-documented literature on differences between those who choose to use and those who are dependent on transit (Bullard, Johnson, and Torres 2004; Sanchez and Brenman 2007). Choice riders have other means of transportation (e.g., car) but choose to take transit. Transit-dependent riders, on the other hand, have no other option but to walk, bicycle, and take public transit. Do these submarkets engage in different levels of active transportation?
Another important limitation of most past studies is that they failed to examine if active transportation (walking, cycling, and other nonmotorized modes) of transit users displaced other types of physical activity (e.g., leisure physical activity). Active transportation’s ability to displace other forms of physical activity may be a function of whether or not someone has access to other means of transportation or is dependent on transit. Do submarkets of transit users differ in the amount of leisure walking they do as a result of more active transportation?
A transportation and time use perspective was applied to the study of the potential health benefits of transit use using the Neighborhood Quality of Life Study (NQLS), a cross-sectional survey of thirty-two neighborhoods of Seattle, Washington, and Baltimore, Maryland, regions. The present paper seeks to (1) explore differences in active transportation and leisure physical activity between groups of transit users classified by car availability and (2) provide evidence on whether active transportation may reduce leisure physical activity for each group.
We posit that transit-dependent riders are constrained to using transit and performing more active transportation and would potentially be more likely to exhibit lower levels of leisure physical activity after controlling for demographic or other potential differences between these groups that could explain differences in both active transportation and leisure-time physical activity. We also examined perceived lack of time as a possible mechanism for such an effect.
Such analysis can inform transit planners and public health authorities on the behavior of transit markets with respect to active transportation and leisure physical activity. While physical activity has known health benefits (USDHHS 2008), examining its practice within a transportation framework may inform transportation planners of the consequences of transit dependence on active transportation and leisure physical activity.
Framework, Hypotheses, and Supporting Literature
The benefits of an active lifestyle have been clearly identified in the health literature (USDHHS 2008; Janssen 2012). Inversely, physical inactivity has been associated with coronary heart disease, type 2 diabetes, breast and colon cancers, as well as a reduction in life expectancy (Lee et al. 2012). In the ecological model of active living, domains of physical activity (e.g., leisure, transportation, occupation) are influenced internally by personal characteristics, attitudes and perceptions, as well as externally, by the built environment and public policies (Sallis et al. 2006). In the present article, we augmented this model with concepts from public transit research and time use studies. A conceptual framework of associations between transit markets and self-reported time spent being active in the most common domains of physical activity (transportation and leisure) is presented in Figure 1 along with the following hypotheses:
Hypothesis 1: Choice and dependent transit users participate in significantly more active transportation than nonusers, with no difference in leisure physical activity.
Hypothesis 2: Active transportation time is not associated with time spent on leisure physical activity, and this relationship does not vary across transit market segments.
Hypothesis 3: For choice and dependent transit riders, perceived lack of time for moderate physical activity is associated with active transportation and leisure physical activity.

Conceptual framework of the relationship between transit markets and domains of physical activity.
Contextual and control variables in the left column and the rationale for their use are described in the Methods section. How transit markets, a time use perspective, and perceived lack of time are conceptualized in the analysis of physical activity is described below.
Transit Markets and Distance to Transit
Car availability is an important predictor of the use of public transit and a determinant of travel behavior (Deka 2002; Vandersmissen, Theriault, and Villeneuve 2004; Zhang 2006; Coogan et al. 2007; Frank et al. 2007). Transportation and urban planning literature often separates transit users into transit-dependent riders, who do not have ready access to a car or at least not one available at the time of the trip, and those who have a car available, but choose to use public transit because of its comparative advantage for a given trip (Bullard, Johnson, and Torres 2004; Beimborn, Greenwald, and Jin 2003; Krizek and El-Geneidy 2007). Car availability provides a clear distinction between the two groups. These two user markets also have distinct sociodemographic profiles and are thought to have distinct lifestyles, preferences, and constraints (e.g., time constraints) (Bullard, Johnson, and Torres 2004; Vandersmissen, Theriault, and Villeneuve 2004; Krizek and El-Geneidy 2007). Perceived availability of transit service, attitudes towards transit use, and income have also been used to identify transit users and potential transit markets (Krizek and El-Geneidy 2007; Beimborn, Greenwald, and Jin 2003).
Transit agencies attempting to expand transit patronage for nonusers of transit often distinguish the near market of potential users with limited access to cars and residing in transit-served locations (potential transit users), and a car-dependent (here referred to as car-exclusive) market less likely to shift travel behavior to transit use. These groups are harder to influence because of available alternatives and because they are more likely to be located in places where transit is inconvenient near their home or destinations. Car ownership and availability, as well as access to transit service are key distinctions between the two groups (Zhang 2006).
In the present study, transit-dependent riders are hypothesized to participate in more active transportation than their choice rider counterparts because of a lack of alternative transportation mode other than walking, bicycling, and using public transit. Dependent riders are also hypothesized to be more likely to displace leisure physical activity by active transportation, since their decision to use transit and reach destinations through active transportation is theoretically more a constraint than a choice. The influence of lack of time is also expected to have a stronger impact on their leisure-time physical activity, for reasons explained below.
For transit users, walking to public transit can contribute to active transportation time (Besser and Dannenberg 2005; Saelens et al. 2014). Greater distance to public transit has been associated with higher probability of meeting physical activity guidelines for transit users (Lachapelle and Frank 2009). In the absence of choice, transit-dependent riders may use transit for a trip even if the distance to transit is prohibitive. As such, total time in active transportation is expected to be greater among transit-dependent riders. Choice riders, because they can use their car, will typically require better quality of service to choose public transit (Beimborn, Greenwald, and Jin 2003).
Time Use, Activity Displacement, and Lack of Time
Time use studies help understand how individuals and groups differ in the way they use time (Michelson 2005). The SLOTH model considers the distribution of time in four domains of activities, in order to elaborate physical activity policies specific to each domain (Sleep—a nonactive use of time, Leisure, Occupation, Transportation and Home-based) (Pratt et al. 2004). Each of these activities is part of an individual’s fixed time budget (24 hours), which can involve varying amounts of physical activity. Within a 24-hour time budget, and with limited available discretionary time, changes in time spent in one activity may influence or displace engagement in another (Sturm 2004; Pratt et al. 2004). Discretionary activities like leisure physical activity are considered more flexible and can be adjusted to other time constraints. Nondiscretionary activities are much less flexible (Frank et al. 2007). Having children, seeking a specific type of employment, and deciding where to live are choices that once made bind a person to certain time-budget constraints.
In this study, the concept of potential activity displacement is used to assess the relationship between active transportation and the time spent in leisure physical activity. Assessing potential displacement of activity can provide information on the lifestyle constraints associated with transit dependence. The relation between transport and leisure time physical activity seldom has been investigated, with the limited evidence to date suggesting they are unrelated (Rovniak et al. 2010).
Lack of time is frequently reported to explain low levels of physical activity (Sturm 2004) and likely has a stronger influence on engagement in discretionary activities. Activities that are negatively associated with perceived lack of time in present analyses are interpreted as more discretionary and subject to displacement. Differences between choice and dependent riders in associations between lack of time and physical activity are explored with the expectation that dependent riders may be more likely to displace other activities because of the inconvenience and added travel time associated with their travel constraints.
Method
Study Design and Sampling
The Neighborhood Quality of Life Study (NQLS) is an epidemiologic cross-sectional observational study designed to compare multiple health outcomes among residents of distinct neighborhoods. Data collection was carried out in the metropolitan regions of Seattle, Washington, and Baltimore, Maryland, between 2003 and 2005. Thirty-two neighborhoods (sixteen per region) were selected based on median income and “walkability” of neighborhoods defined as contiguous census block groups. Median neighborhood income was determined using block group level 2000 census information. Regional distributions were split in deciles, and block groups in the second, third, and fourth deciles and in the seventh, eighth, and ninth deciles were retained for, respectively, low- and high-income neighborhoods. A geographic information system-based index of neighborhood walkability was used to identify block groups of low and high walkability within deciles 1, 2, 3, 4 and 7, 8, 9, 10, respectively (Frank et al. 2010). Multiple studies have used the same walkability index to define the built environment characteristics associated with walking (Frank et al. 2005; Frank et al. 2006; Frank et al. 2008; Sallis et al. 2009). The index is equal to the sum of z scores of four measures theoretically and empirically associated with walking behavior in numerous studies. They are intersection density, retail floor area ratio, land use mix, and net residential density (Ewing and Cervero 2001; Handy et al. 2002; Frank et al. 2005). Contiguous block groups that matched the selected low and high deciles of walkability and income were used to sample thirty-two neighborhoods across both regions (neighborhoods were composed of two to thirteen adjacent census block groups). Eight neighborhoods (four by region) were categorized into each of the four cells created by the combination of high or low income by high or low walkability (see Table 1). Regions were chosen based on availability of parcel-level land use information and expected variability in walkability. Published papers present the neighborhood sampling methods in more detail (Sallis et al. 2009; Frank et al. 2010).
Sample Description by Transit Markets.

χ2 test of significance.
One-way analysis of variance.
SD = standard deviation.
χ2 test of significance restricted to choice and dependent riders.
Participants and Survey
Within the identified neighborhoods, contact information for residents was obtained from a marketing company. Recruitment was conducted both by mail and telephone to obtain informed consent from participants aged twenty to sixty-five (Sallis et al. 2009). Households were recruited in random order, and the adult with the most recent birthday was invited to participate first, with a second adult invited if the first one was ineligible or declined. Eligibility requirements included being able to complete the survey in English and absence of a medical condition that prevented walking. In order to prevent seasonal biases, participants of the same metropolitan area were recruited in all neighborhoods simultaneously. Two waves of survey with self-reported items on physical activity, attitudes toward physical activity, barriers to regular physical activity, and perceived neighborhood environment were sent to respondents. The first survey’s return rate was of 26 percent (measured/eligible contacts, n=2199) and the second survey, sent six months later to respondents of the first survey, had a return rate of 87 percent, after eliminating those initial respondents who moved out of the region. Because survey items on public transit use were only available in the second survey wave, the analysis was conducted using this smaller sample. Data collection was carried out between May 2002 and September 2004 in Seattle and June 2004 to October 2005 in Baltimore. Of those, 1,622 respondents completed all survey items used in regression analyses, but 1,729 individuals had enough information to be classified in the transit markets. All study participants reported being healthy enough to engage in physical activity.
Dependent Variables
The dependent variables were computed using the International Physical Activity Questionnaire (IPAQ Research Committee 2005). IPAQ survey scores have shown to be as reliable and valid as similar measures (Craig et al. 2003). The average times spent being physically active at least 10 minutes at a time for active transportation (destination-based walking and cycling) and for leisure (leisure walking, moderate and vigorous activity outdoors and indoors, including gym) in the past week were computed by multiplying the reported days per week and minutes per day (days*minutes/day = min./week) spent being active in each domain.
Independent Variables
Transit Market
The main correlate of physical activity in this study was a categorical variable named “transit markets,” defined by transit use and categories of car availability. Public transit users were defined as those having responded at least one day for any of these questions: “How many days in the past month have you walked to public transit from home?” and “How many days in the past month have you walked to public transit from work?” A categorical variable of car availability was developed using the following items: “How many adults live in your household?” “Do you have a valid driver’s license?” and “How many cars does your household own?” The variables were used to identify (a) licensed adult living in households with one vehicle or more available per adult, (b) households where there was less than one vehicle available per adults, (c) households with no cars, and (d) individuals with no driver’s license in a car-owning household.
A categorization of four transit markets is presented in Table 2: two transit user groups; (1) choice transit riders (defined by having one car or more per adults in the household—category a above); (2) transit-dependent riders (defined as having a shared car, no car or no license—categories b, c, and d); and two groups that did not walk to transit in the past month; (3) car exclusive (defined as having one car or more per adults in the household—category a above); and (4) potential transit riders (defined as having a shared car, no car, or no license—b, c, and d). Choice transit riders and car exclusives share the common trait of always having the option to use a car, but differ on whether they used transit or not. The analysis was centered on choice riders and transit-dependent riders, but the four categories were retained to avoid information loss on automobile availability for those not using transit (potential transit riders and car exclusive).
Transit Market Groups Classified Using Transit Use and Car Availability.
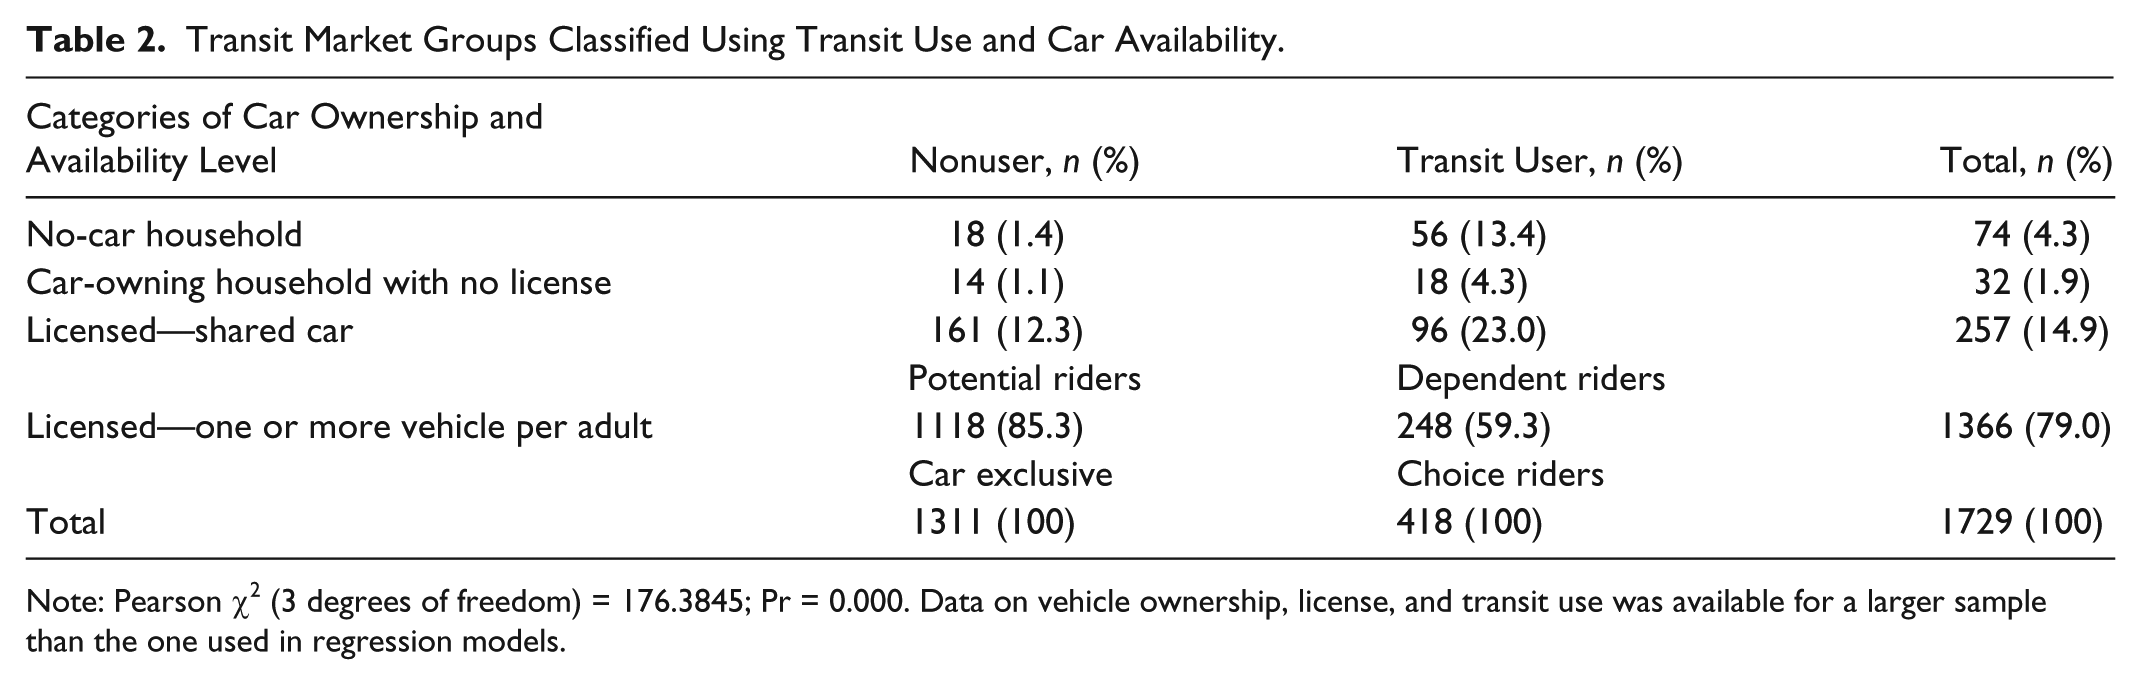
Note: Pearson χ2 (3 degrees of freedom) = 176.3845; Pr = 0.000. Data on vehicle ownership, license, and transit use was available for a larger sample than the one used in regression models.
Perceived Lack of Time
A question on perceived lack of time as a barrier to moderate physical activity (How often do the following prevent you from getting regular physical activity? … Lack of time) was measured on a five-point Likert-type scale (0 = never, 1 = rarely, 2 = sometimes, 3 = often, 4 = very often). The item was part of a valid scale (Calfas et al. 1994; Hovell et al. 1989). The variable was used for two purposes: first to identify physical activity domains that are more discretionary and therefore less likely to be practiced because of lack of time, and second, to assess group-specific impacts. Negative relationships with physical activity would indicate that lack of time prevents a person from participating in physical activity more frequently or for longer periods. As perceived lack of time increases, choice riders were expected to report less active transportation. The influence on dependent riders was expected to be lesser.
Control Variables
Public transit users tend to earn lower income and are composed of a higher percentage nonwhite and female than nonusers (Bullard, Johnson, and Torres 2004). Variations also exist between choice and dependent riders—and among nonusers (Zhang 2006). The transit market categories were compared across the following sociodemographic indicators: sex, having children, marital status, ethnicity, education (all dichotomous), age (continuous), and annual household income. These sociodemographic characteristics were also used as control variables in multivariate physical activity models in order to identify independent associations between physical activity levels and transit markets. As transit users may be distributed unevenly within and between cities, the two dichotomous design variables of high- and low-income and high- and low-walkability neighborhoods, as well as the Seattle and Baltimore region indicator, were used in descriptive comparisons and included in multivariate analyses.
Statistical Framework
To account for the neighborhood-sampling framework, hierarchical model structures were used in all models. The distribution of the dependent variable was accounted for by using a Tobit modeling framework, and research questions were explored through the introduction of interaction terms in independent variables. These three characteristics are specified below.
The multilevel sampling strategy used in this study (individuals clustered in thirty-two neighborhoods) leads to a violation of the independence of observation assumed in ordinary least squares regression, and requires a hierarchical modeling structure that includes neighborhood-level random effects to account for nesting of participants within neighborhoods (Masse et al. 2002; Bingenheimer and Raudenbush 2004).
The clustering of zero values for physical activity outcomes (some respondents reporting zero days) is a censored variable that violates the normal distribution assumption. The Tobit regression model can accommodate a censored dependent variable model and allows efficient inclusion of participants reporting no physical activity within a specific physical activity domain (Edwards 2008). The expected value (ŷ) of observed physical activity, conditional on physical activity being uncensored is used to provide adjusted estimates. Use of ordinary least squares (OLS) when a dependent variable is censored would potentially result in bias of the constant, or of the coefficients (Washington, Karlaftis, and Mannering 2003). The first series of models (Table 3) assessed associations between transit markets and types of physical activity, controlling for sociodemographic characteristics and perceived lack of time. Stratification of data by study sites was tested but did not improve results. Study site was instead included as a dummy variable in the models.
Multivariate Tobit Models Estimating Self-Reported Minutes of Active Transportation and Leisure Physical Activity.
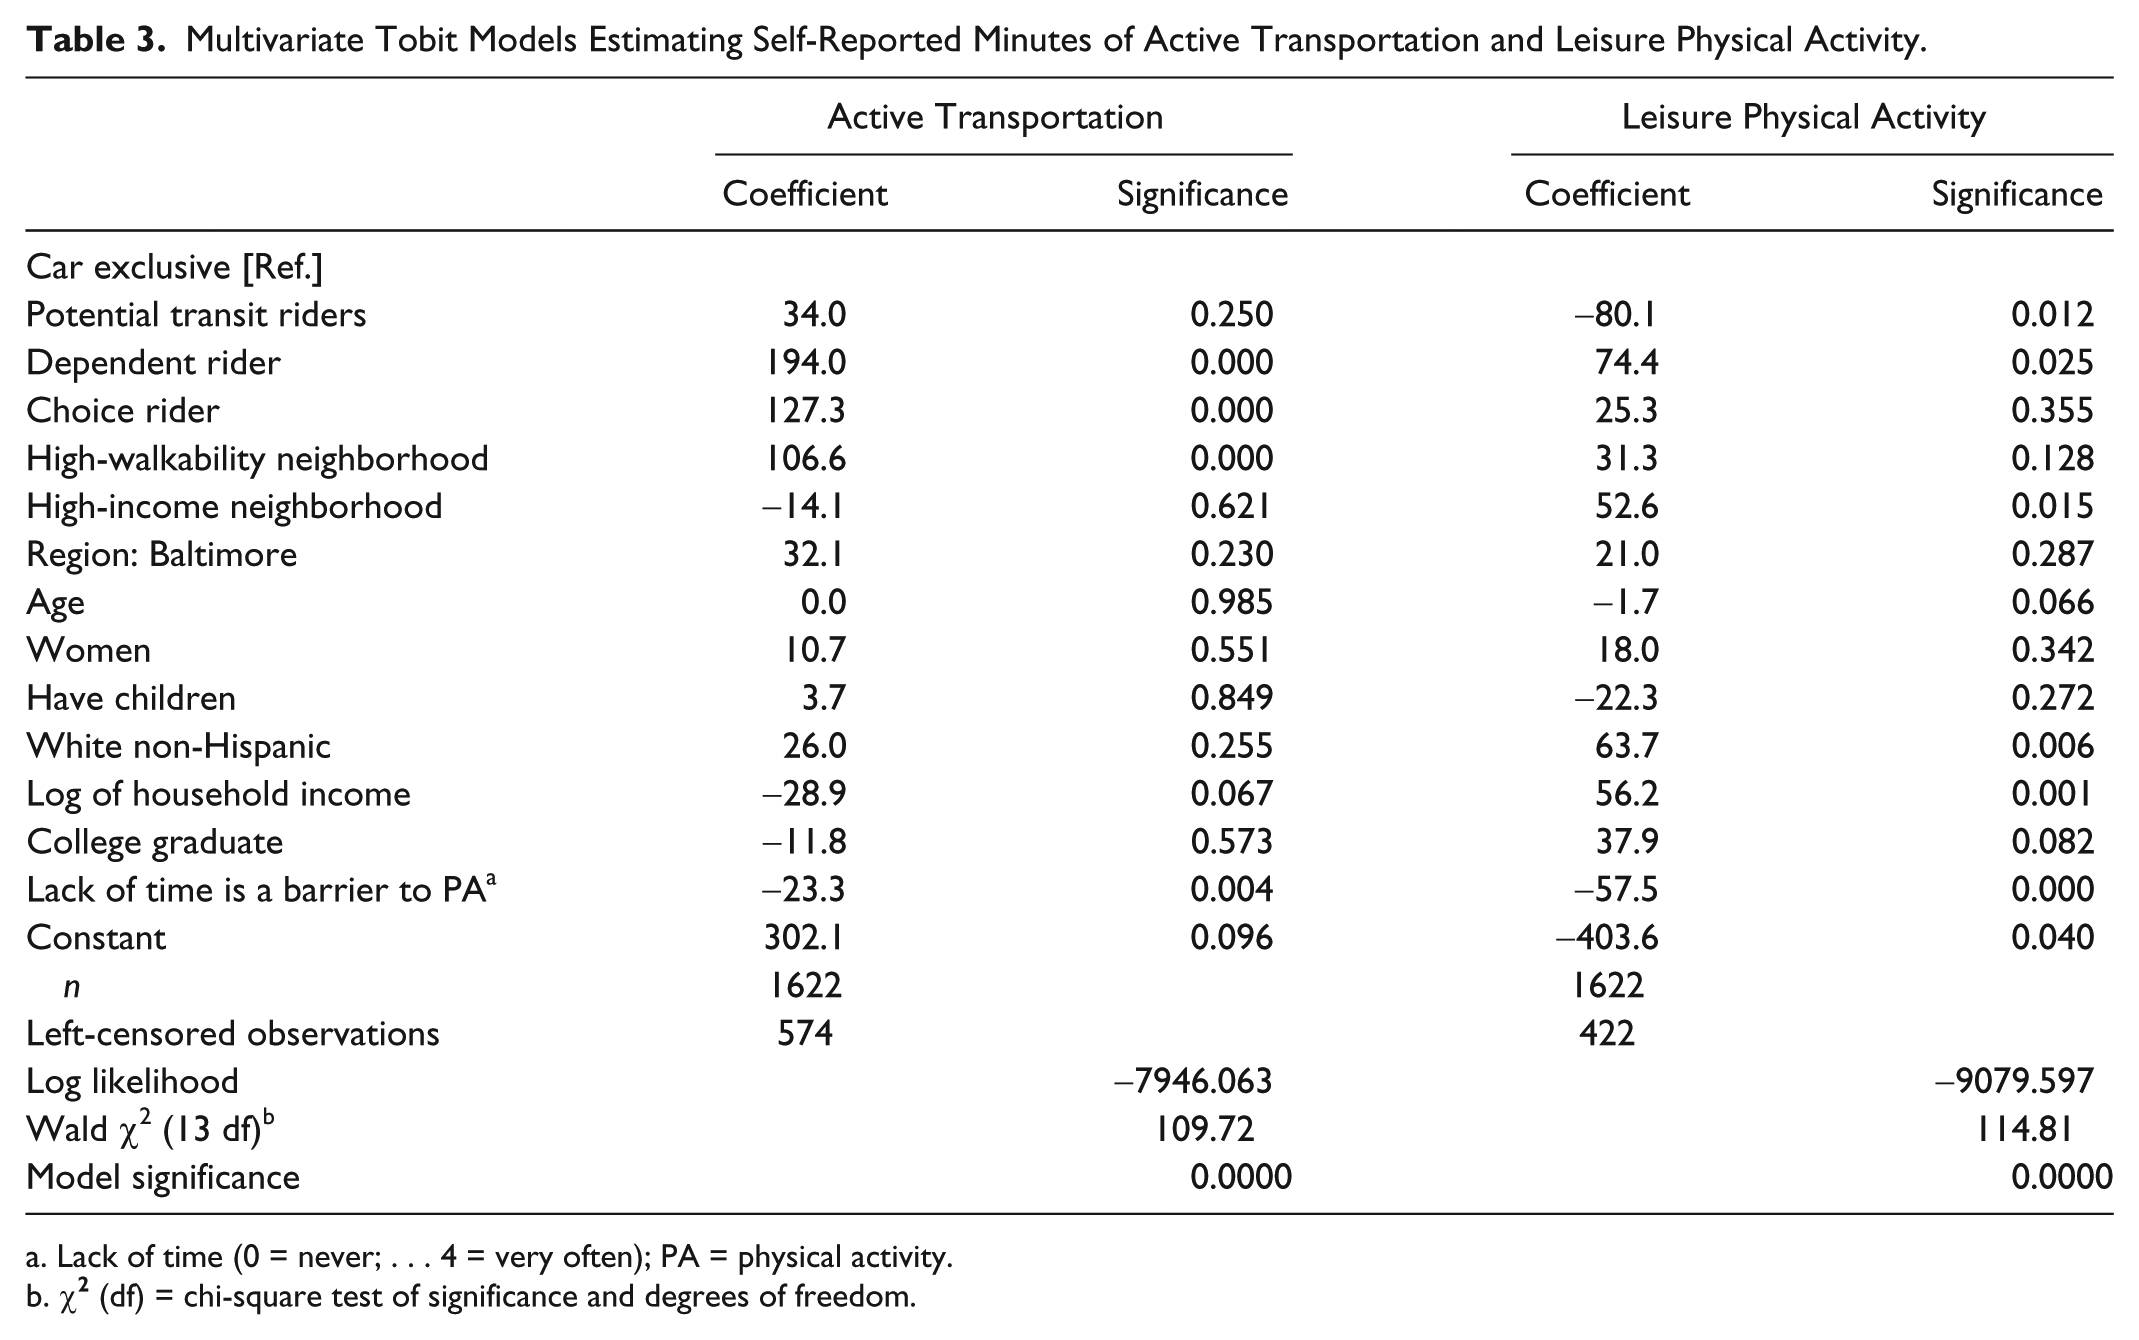
Lack of time (0 = never; . . . 4 = very often); PA = physical activity.
The concept of a moderating effect refers to a theoretical causal model (A → B1, B2, . . . → C), where the association between continuous independent variable A and continuous dependent variable C varies across levels of independent categorical variable B. Moderating effects can be statistically tested through the use of interaction terms (Bauman et al. 2002). The moderating effect of the transit market categories was tested for two associations. First, the activity displacement hypothesis was explored in a separate model (see Table 4), where an interaction term was used to evaluate the impact of active transportation (independent variable A) on leisure physical activity (dependent variable C) across transit markets (B1, . . . , B4). Second, two models restricted to the transit user groups (choice and dependent riders, not reported) provided estimates used to plot associations between perceived lack of time (A) and both active transportation and leisure physical activity (C) moderated by choice and dependent riders (B3, B4) (see Figure 4).
Model of Leisure Physical Activity and Influence of Active Transportation for Transit Markets.

Note: Interaction term noted by asterisk. df = degrees of freedom.
Results
Transit Markets
The sample distribution across the transit use/car availability categories is presented in Table 2. Exclusive car drivers are the least plausible transit user market and the largest group surveyed. Car availability levels were considerably lower in the transit-dependent markets than in the potential transit user market.
The distribution of sociodemographic characteristics and attitudes for the transit markets and the entire sample is presented in Table 1. The two survey sites did not differ significantly in the distribution of the transit use/car availability grouping. The distribution of the transit markets across neighborhood walkability and income was consistent with the neighborhood characteristics favorable to transit use. Nonusers of public transportation were spread more evenly across neighborhood walkability and income, although car-exclusive respondents were more frequently found in low-walkability/high-income neighborhoods, and potential riders were more frequently found in high-walkability/low-income neighborhoods. Choice and dependent transit users were more highly concentrated in the walkable (high- and low-income) neighborhoods. The distinction between choice and dependent transit users in neighborhood of residence was clear, with 61.2 percent of transit-dependent living in low-income neighborhoods (43.5 percent were in high-walkable/low-income), but only 46.7 percent of choice riders living in low-income neighborhoods (29.0 percent in high-walkable/low-income). Transit dependents had the highest proportion of respondents reporting using public transit more than sixteen days per month (38.7 percent). A higher proportion of choice riders (51 percent) rode transit between one and five days in the previous month. Lack of time was, on average, a greater barrier to physical activity for car-exclusive drivers and choice riders.
The four transit markets also differed in sociodemographic characteristics. When comparing the two transit user groups to their counterparts, proportionally fewer transit users were married and had children. Choice riders had the lowest percentage of married households with children and the highest percentage of college graduates. Exclusive drivers and choice transit riders were wealthier. Potential riders were more frequently members of households with at least one shared automobile compared with transit-dependent participants (not shown). Significant differences were found in all socio-demographic variables except age and gender. Of these 1,729 participants, 107 participants did not provide complete physical activity or sociodemographic measures. The analytical sample size therefore comprised 1,622 observations.
The Relationship between Transit Markets and Physical Activity Types
Associations between transit markets and active transportation and leisure physical activity (Hypothesis 1) were estimated in two Tobit models (Table 3). As presented by the number of left-censored respondents for each physical activity outcome, more respondents reported no active transportation (35.4 percent) compared to no leisure physical activity (26 percent).
Being a choice or dependent transit user was positively and significantly associated with more active transportation as compared to the car-exclusive reference category. Dependent riders also reported the most leisure physical activity and had the highest coefficient. Living in a walkable neighborhood was positively associated with active transportation. Household income was not significantly associated with active transportation but was positively related to leisure physical activity.
Perceived lack of time as a barrier to physical activity was negatively and significantly associated with both active transportation and leisure physical activity. The larger negative association between lack of time and leisure physical activity (more than twice the magnitude even though differences in minutes of both types of physical activities were quite similar) is interpreted as being due to its discretionary nature. This result supports the theoretical distinction between discretionary and nondiscretionary activities.
Using estimates from Table 3, adjusted median minutes of active transportation and leisure physical activity for each transit market are presented in Figure 2. The median was favored as a measure of central tendency because of the skewed nature of the physical activity data (IPAQ Research Committee 2005). Transit-dependent riders reported the most active transportation. Choice riders also reported more active transportation than those not using transit. Less active transportation time for choice than dependent riders may reflect the former group’s ability to locate or work nearer to transit stops or stations. Choice and dependent transit riders also reported more leisure physical activity than their nonrider counterparts, with a slightly higher value for dependent riders.
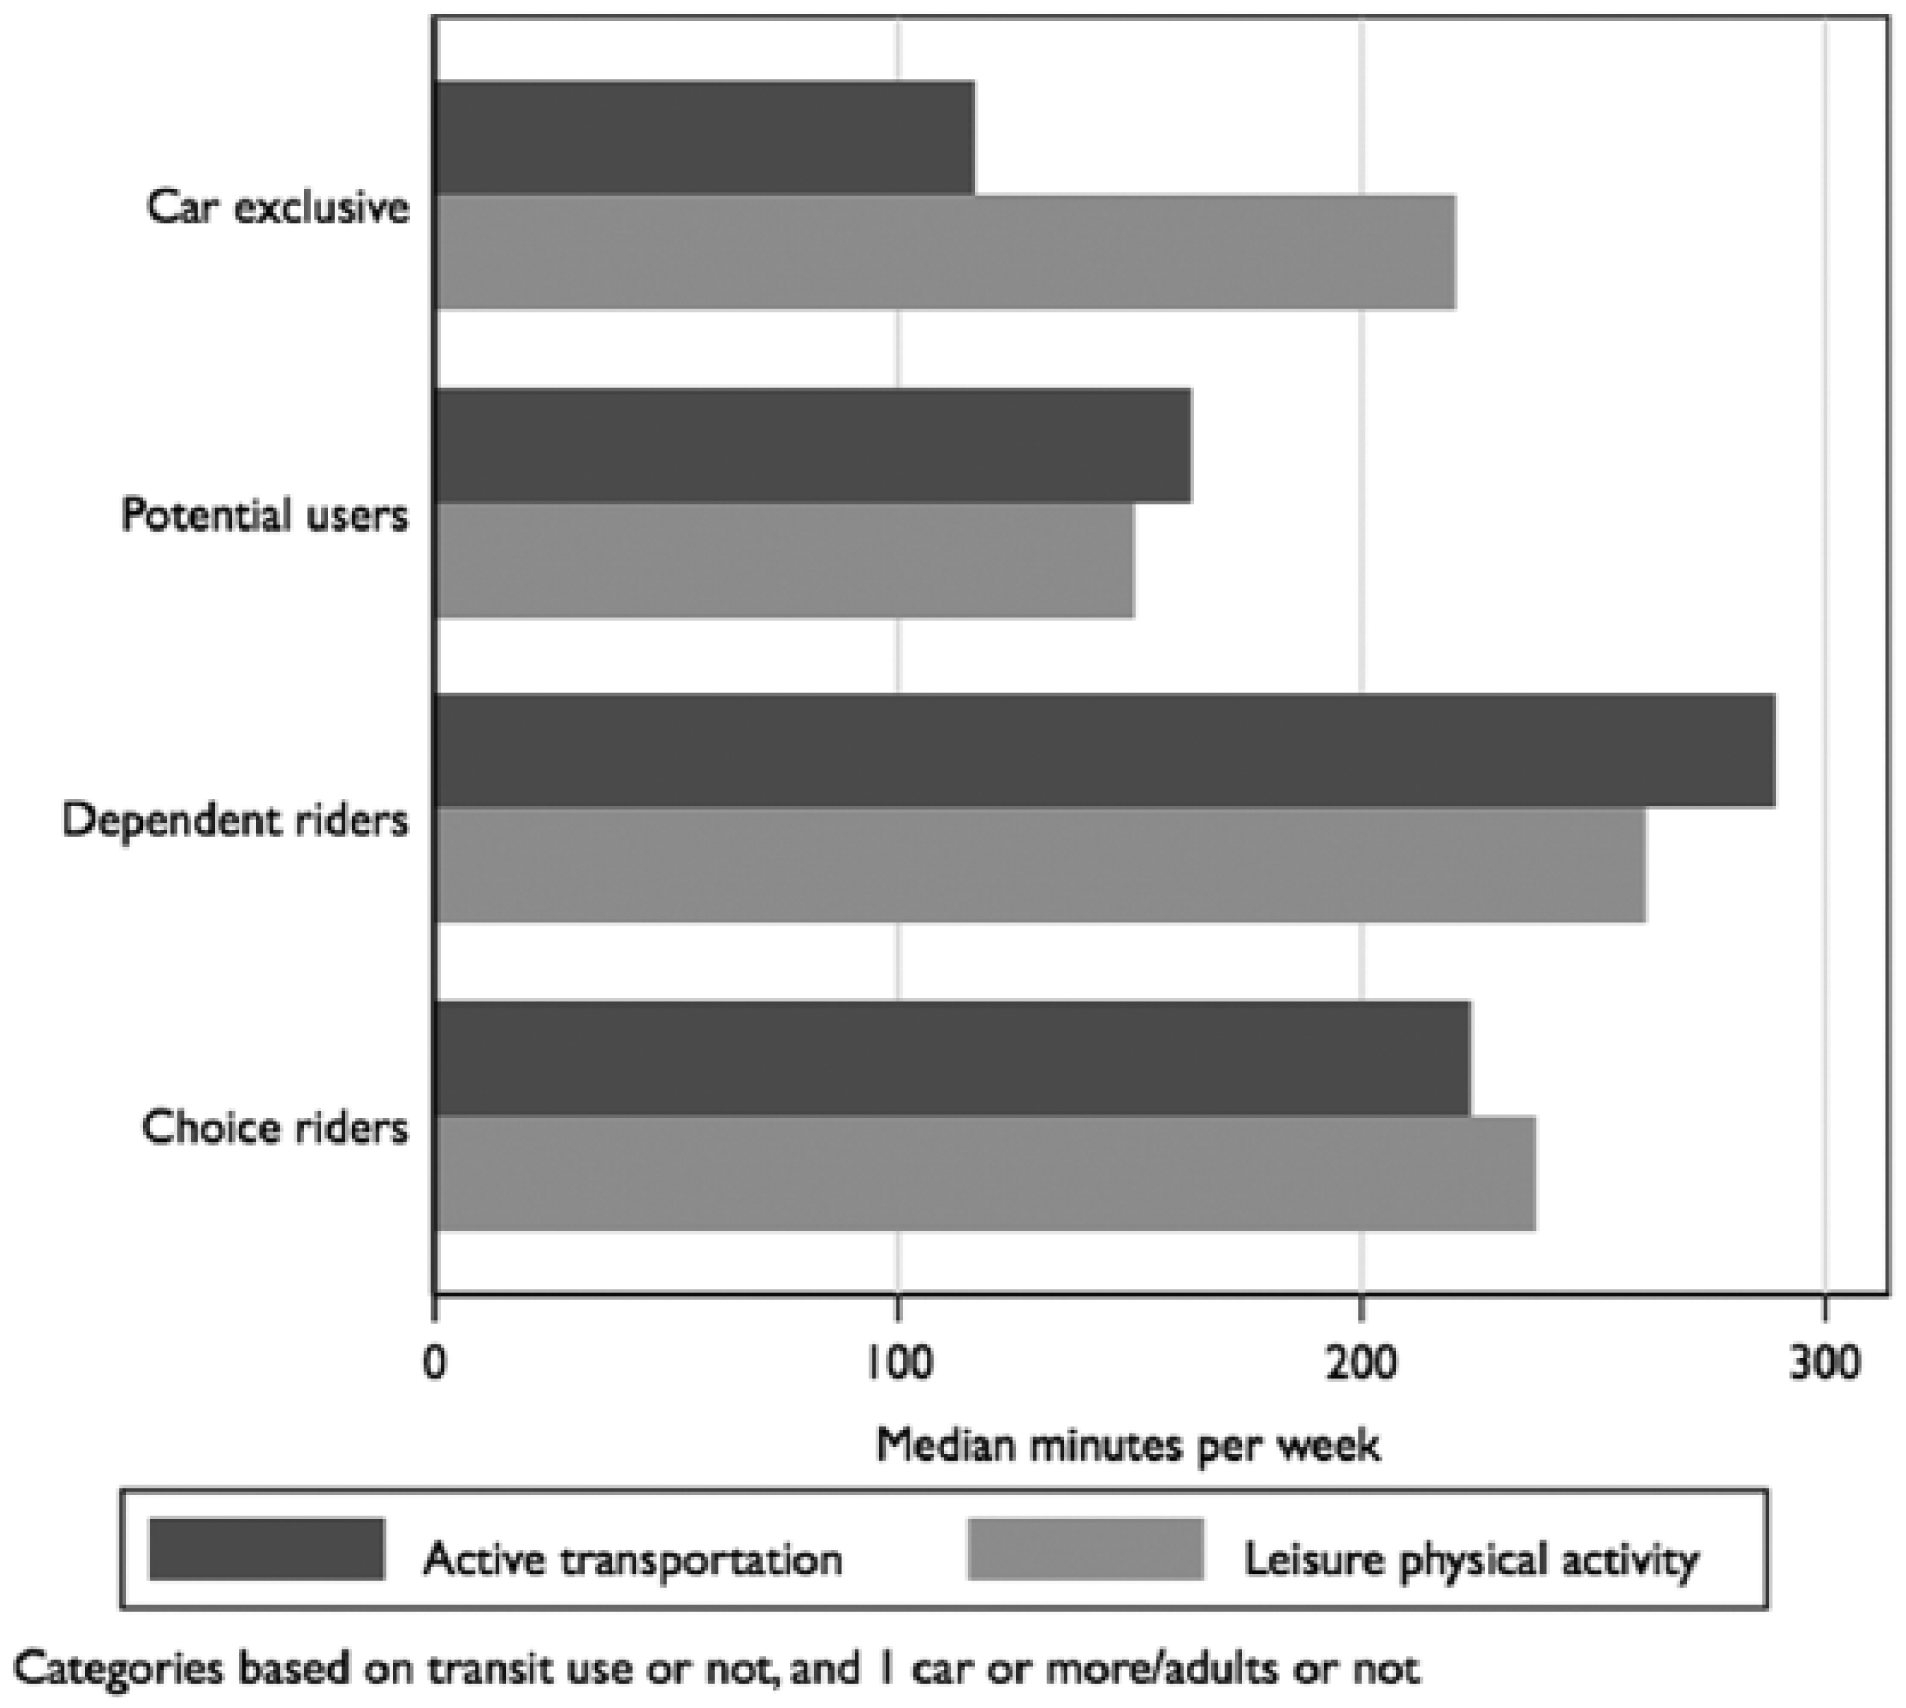
Estimated median leisure and transportation physical activity by transit markets in the Neighborhood Quality of Life Study (NQLS).
Activity Displacement of Leisure Physical Activity by Active Transportation
Can the amount of time spent on leisure physical activity be influenced by the amount of time spent in active transportation? Would choice and dependent transit rider status moderate the relationship between active transportation and leisure physical activity (hypothesis 2)? In Table 4, leisure physical activity was estimated as a function of an interaction between active transportation and transit markets. Active transportation time was independently positively and significantly associated with leisure-time physical activity when controlling for other covariates. Transit dependence was also positively and significantly associated with leisure physical activity. Interactions between active transportation and the transit market categories revealed a negative association for potential transit riders and dependent riders.
Estimating leisure physical activity using model coefficients in Table 4 for specific active transportation times and for each transit market clarifies interpretation of the model. In Figure 3, estimations are presented for the study population mean (132 minutes), median (200 minutes), and three other selected active transportation times, for each transit market, maintaining other covariates constant. As active transportation increased, there was an associated increase in leisure physical activity for individuals in each category, although the magnitude differed. The increase was considerably larger for the two categories with full car availability (car exclusive and choice riders). These results, albeit cross-sectional, are not supportive of the hypothesis that active transportation displaces time spent in leisure activity and rather suggest co-occurrence. Estimates suggest that limited car availability may be more important than transit use in modifying the relationship between the two domains of physical activity.

Estimated Leisure Physical Activity as a function of active transportation and transit marketsa in the Neighborhood Quality of Life Study (NQLS).
Attitudes: Lack of Time for Transit User Markets
To test the final hypothesis, only the two transit submarkets of choice and dependent riders were used. The distinct influence of lack of time for physical activity for choice and dependent transit riders on both active transportation and leisure physical activity (hypothesis 3) was modeled (model not shown). The active transportation and leisure physical activity models in Table 3 were constrained to transit users, used choice riders as a reference category, and included an interaction term between lack of time and the two groups. Plotting the estimated relationships allowed a visual exploration of associations between lack of time and the time spent practicing these two physical activities (Figure 4). Perceived lack of time for physical activity was negatively associated with the level of active transportation and leisure physical activity for choice and dependent riders. For transit-dependent riders, however, increased lack of time had a particularly strong and significant negative association with leisure physical activity time. If a transit-dependent individual had no other means but to walk, bicycle, or use transit (a combination of slower modes of transportation), perceived lack of time may have had a greater influence on time spent in discretionary activities like leisure physical activity even in the absence of observed displacement.
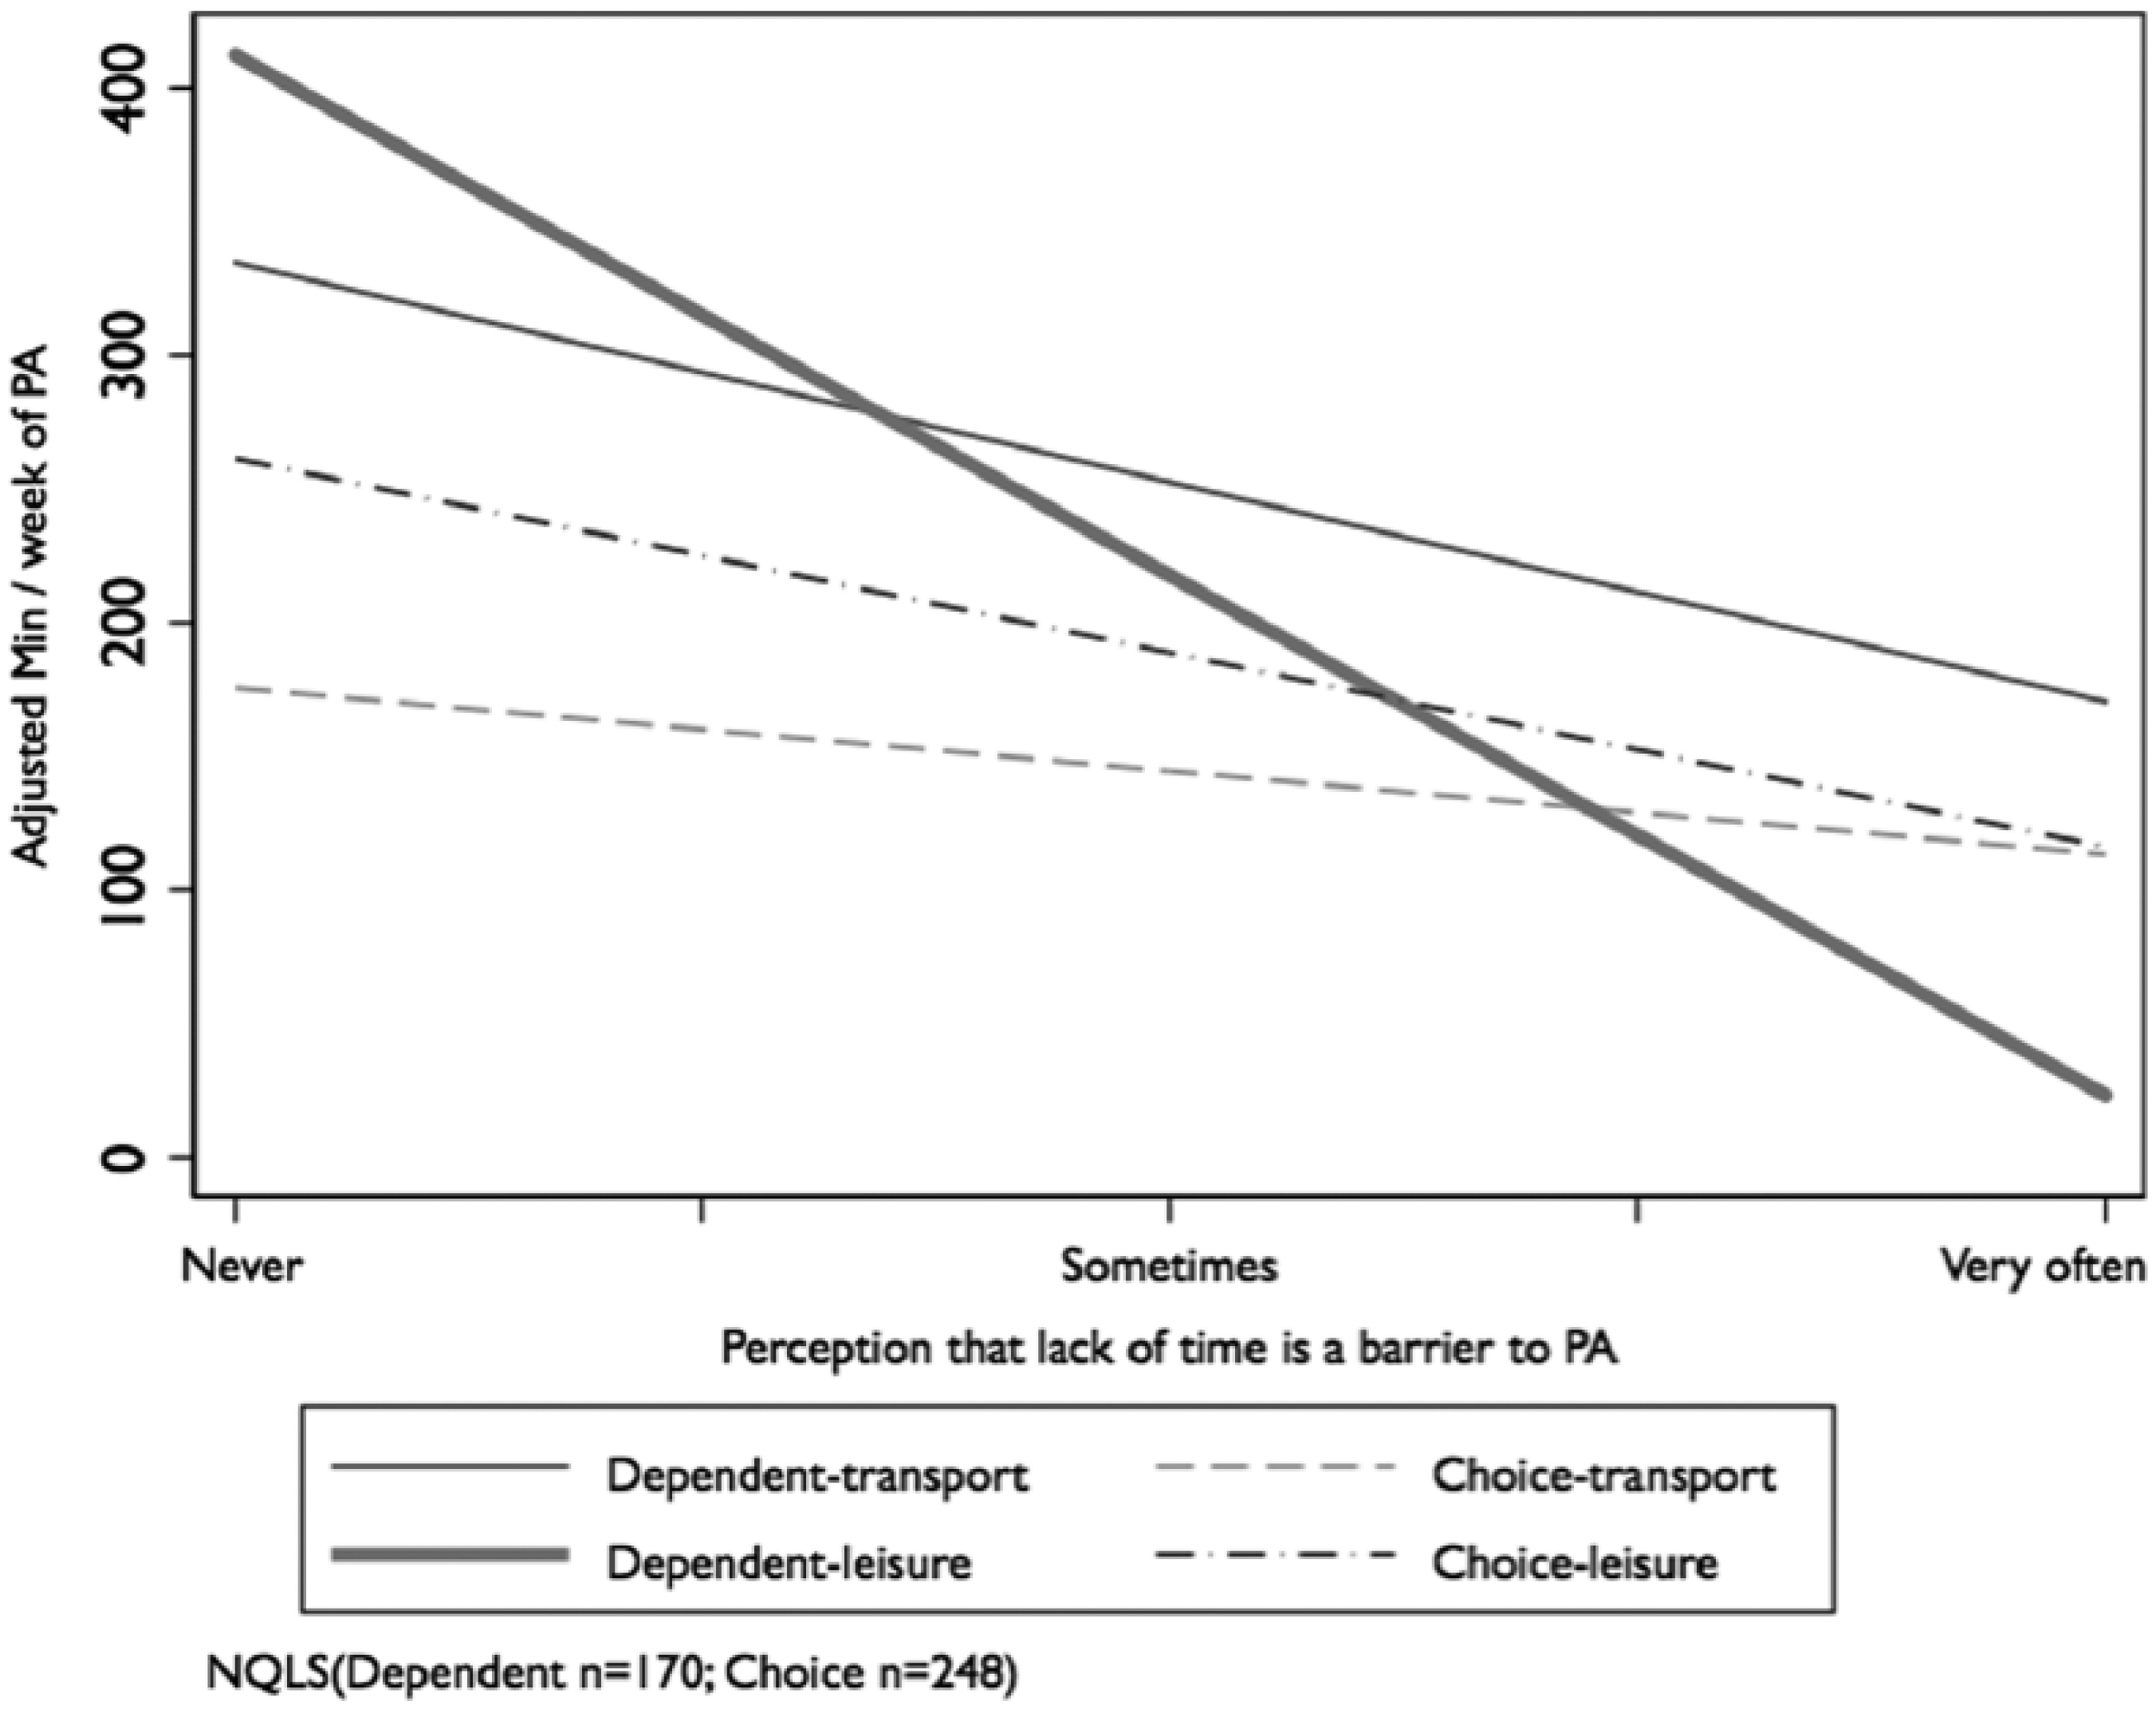
Active transportation and leisure physical activity for choice and dependent transit riders as a function of perceived lack of time in the Neighborhood Quality of Life Study (NQLS).
Discussion
The present article provides information on how transit dependence may be associated with active transportation, leisure physical activity, and perceived time constraints. Transit riders performed more active transportation than nonriders, and transit-dependent riders surpassed choice riders in active transportation. Interestingly, transit-dependent riders also reported higher median minutes of leisure physical activity than all other groups. Choice riders still spent more time in leisure physical activity than their nonuser counterparts. A positive relationship between transit use and leisure physical activity is an unexpected novel health-promoting result. Because transit users did more active transportation and more leisure physical activity, displacement of leisure physical activity by active transportation is not likely. This finding suggests that lower vehicle ownership and transit use leads to an overall more active lifestyle. Activity displacement, in this analysis, would have been most clearly evidenced by a decrease in leisure physical activity time as active transportation time would increase, and only for transit users or a subgroup thereof. This was not the case.
Negative associations with perceived lack of time indicated that both active transportation and leisure physical activity have discretionary characteristics. Leisure physical activity, with the highest negative association with perceived lack of time, was confirmed to be the most discretionary form of physical activity, and therefore the most vulnerable to displacement by other uses of time. Theoretical considerations, as well as this result, supported the choice to model variations in leisure physical activity as a function of active transportation time of transit users.
Lack of time had a particularly strong negative association with leisure physical activity for transit-dependent riders (Figure 4). Activities are not inherently discretionary or nondiscretionary. Personal characteristics, circumstances, and environmental constraints may also render the practice of an activity more or less discretionary. For transit-dependent riders, active transportation may often be the only alternative to motorized travel by transit. Because an automobile or a ride is less readily available, transit-dependent riders may be forced into active transportation, walking more out of necessity than out of interest, regardless of lack of time. This is the most likely explanation for the stronger negative association between leisure physical activity and lack of time for dependent riders.
One result was somewhat surprising: the positive relationship between transit-dependent riders and leisure physical activity. A potential explanation worth exploring further is that transit-dependent riders, by being accustomed to walk more for transportation, may develop an appreciation for leisure physical activity. Relationships between transit markets and leisure physical activity are likely the product of unobserved characteristics of the transit markets and should be the subject of further investigation. Associations between types of physical activities and transit market were independent of neighborhood walkability. Thus, more leisure-time physical activity may be a newly identified cobenefit of public transit use.
There were too few cyclists in the sample to carry out separate analyses for cycling time. Grouping cycling with walking was chosen because cycling could complement walking and transit use in multimodal travel. Because activities of different intensity require different energetic output, the IPAQ Research Committee (2005) provides guidelines to convert time to Metabolic Equivalent of Task (MET), or metabolic equivalent. MET is a physiological concept expressing the ratio of metabolic rate associated with an activity to the metabolic rate at rest. This allows a more accurate comparison of energy expenditures for physical activities. All models were estimated using variables converted to METs (not shown). Direction of effect and significance of main variable of interest were consistent with the results displayed here. Time values were reported because of their more direct and intuitive associations with lifestyles and the concept of lack of time.
Limitations
The main limitation of this study was its cross-sectional design. Following a cohort of individuals over time to evaluate how changes in transit use, dependence, active transportation, and leisure physical activity are related would support stronger causal inference. The sociodemographic characteristics of categories of respondents used in this analysis are consistent with existing descriptions of transit-dependent and choice riders (Murray and Davis 2001; Bullard, Johnson, and Torres 2004; Deka 2002) and of car-exclusive drivers (Zhang 2006 refers to “car captive”), but may not be ideal given the sampling frame for the parent study. Car availability provided a simple but effective way to analyze different transit markets. However, some individuals who can afford a car may choose not to own a car and use transit as the only motorized mode. The categorization used in this article would not have allowed their identification as choice riders. A participant was categorized as transit user even if he/she used transit only once in the past month. The reported relationships with active transportation are thus considered conservative.
The self-reported metrics of physical activity used in this study allowed a distinction in types of physical activity but were subject to recall bias and self-report bias. Compared to activity diaries used in travel surveys and time use studies that often focus on one or two days, a strength of the present survey approach was the assessment of weekly physical activity that may be more representative of typical patterns. Because the NQLS provided information on monthly transit use, the time discrepancy between the dependent and independent variable is recognized as a limitation that biases in a conservative direction.
The measure of active transportation in this study did not allow for disaggregation into transit-related active transportation versus active transportation not related to transit. Part of the reported active transportation involved walking to transit stops or stations. Choice riders may access transit using park-and-ride, but information on access mode was lacking.
Conclusion
Public transit use appears to provide direct health benefits through active transportation, independent of sociodemographic characteristics, the practice of leisure physical activity or perceived lack of time for physical activity. Dependent transit users had the highest levels of active transportation. Because transit dependence is a situation that most would rather avoid, the health benefits of active transportation may come at the expense of lower mobility. Choice transit riders, as defined in this study, spent less active transportation time and slightly less leisure physical activity time than their transit-dependent counterparts. This may partly be a function of their ability to locate in the most walkable areas where nonwork destinations and transit service are nearby or where they can use a car to access transit service.
For all respondents, and across transit markets, more active transportation was associated with more leisure physical activity. As such, an activity displacement effect was not supported, and greater leisure physical activity was identified as a likely cobenefit of transit use. It could be that other third variables explain this relationship (e.g., health status, vehicle ownership, attitudinal predisposition), but the finding lends credence to the health benefits of transit use identified in other studies (Brown and Werner 2007; Wener and Evans 2007; Wasfi, Ross, and El-Geneidy 2013; Freeland et al. 2013).
Though perceived lack of time has been studied often in relation to leisure time physical activity (Trost et al. 2002), present results indicated that lack of time also was related to active transport, which highlights the discretionary nature of this form of physical activity. However, the association of lack of time with leisure physical activity was stronger.
Transit markets are heterogeneous in their sociodemographic composition (i.e., the transit-dependent are poorer than choice riders), residential neighborhood type (choice riders live more often in high-income neighborhoods), attitudinal characteristics (lack of time has a stronger negative effect on leisure physical activity for transit-dependent riders) and physical activity behavior. From a transportation perspective, transit-dependent riders’ higher level of active transportation may be interpreted as poorer access to transport options. Hence, transit-dependent riders may walk more out of necessity, and choice riders may walk slightly less because of greater access to motorized options, including transit and automobiles, and lower preference for walking than dependent riders.
Present findings inform transportation planners by presenting implications of transit dependence on walking, as well as on reduced time for the practice of other activities. Transportation and land use planners can influence access and active transportation levels of choice and dependent riders by providing a range of housing types at differing price points near transit—for both rental and ownership markets (Reconnecting America 2007).
From a public health perspective, increasing active transportation provides health benefits that are augmented by more leisure-time physical activity. Public health authorities can provide support for public transportation in two main ways: first, by directly conveying educational and social marketing messages to the public on the physical activity benefits of using public transportation and, second, by providing interagency support for investments in public transportation infrastructure and policies. By doing so, public health agencies could indirectly support reductions of harmful pollution-related human impacts on natural systems through reduced automobile use, while working within their mandate of promoting and enhancing population health (Zheng 2008). For transit agencies, this health-based social marketing could support increases in ridership. Evidence that supports the stated need to consider health issues in public transit planning (de Nazelle et al. 2011) and to consider physical activity benefits as individual and social externalities of public transit service investments (Litman 2003) were presented in this paper. Cost-benefit analysis of future transit projects could include the health benefits of a physically active lifestyle and other health and ecological costs currently unaccounted for.
Footnotes
Acknowledgements
We acknowledge the financial support of the National Institutes of Health grant HL67350, the Social Science Research Council of Canada, the Fond Québécois de recherche sur la société et la culture and the Bombardier Foundation. We also thank our reviewers and guest editor for their thoughtful comments.
Declaration of Conflicting Interests
The author(s) declared no potential conflicts of interest with respect to the research, authorship, and/or publication of this article.
Funding
The author(s) disclosed receipt of the following financial support for the research, authorship, and/or publication of this article: We acknowledge the financial support of the National Institutes of Health grant HL67350, the Social Science Research Council of Canada, the Fond Quebecois de recherche sur la societe et la culture and the Bombardier Foundation.