
Abstract
Using a national survey of US local governments, we explore the drivers of planning and service delivery for older adults. Our regression models find that planning for aging and elder engagement are the most influential factors explaining the level of community services for elders. Services are lower in less dense suburban and rural communities, and market-based services are lower in communities with more senior poverty. This creates two challenges for planners: to help generate a market response for aging services, and to articulate the link between the built environment and services so communities that lack supportive physical environments can become better places to age.
Introduction
America is aging, and seniors will constitute nearly one-fifth of the population by 2030. Older residents are concentrated in rural and suburban communities, where service delivery is lower (Morken and Warner 2012). According to the Census from 2000 to 2010, the share of seniors in suburban communities grew faster than in cities (Frey 2011). Glasgow and Brown (2012), using 2000 Census data, report more than 15 percent of rural residents are seniors (as compared to only 12 percent in urban areas) with the proportion of elders in nonmetropolitan areas expected to grow to about 20 percent as remaining baby boomers reach sixty-five years of age.
A 2010 AARP survey found that 88 percent of those sixty-five and older desire to age in their home communities and neighborhoods, near family and friend support networks (Keenan 2010). This raises the question of how well communities are equipped for residents to successfully “age in place.” Using data from the first national survey on planning and service delivery for seniors, this paper explores the factors that lead municipalities and counties to respond to this challenge through government or private market (i.e., for-profit or nonprofit) service provision. We also explore the role of planning and senior engagement in helping communities meet the needs of an aging population.
Planning involves three processes: physical design, service delivery, and public participation. We present the literature on these aspects of planning as they relate to meeting the needs of an aging population. Land use planning and building codes are the physical planning processes, which can be used to promote a physical environment more conducive to aging in place. Services complement the built environment, and planners play a key role in designing government programs and in stimulating a community response for services to meet the changing needs of an aging society (Farber et al. 2011; Lehning 2012). Finally, older adults’ participation in the planning process is considered vital to ensure more responsive planning and service delivery (Howe 2012; World Health Organization 2002, 2007).
We propose a framework that recognizes the important complementarities between planning for physical design, elder participation, and community service delivery. Although the majority of seniors want to age in place (Keenan 2010), the built environment of many communities, particularly suburban and rural ones, makes that difficult. Planning can facilitate physical design changes over time, but in the near term, community services can provide a complement that helps older adults remain in their homes.
We present the first regression analysis of the Maturing of America 2010 survey on community service delivery for elders from a national sample of municipalities and counties across the United States (National Association of Area Agencies on Aging 2011). This survey is unique, not only for its measurement of a wide range of forty-one community services important for seniors, but also for its attention to whether services are provided by government or through the private market. The survey offers information on planning for aging (land use, comprehensive and strategic planning) and elder participation in the planning process.
Our model results show that planning for seniors and elder participation in the planning process help explain differences in the level of community services. Communities with built environments that are less favorable to aging in place, such as suburban communities, show lower service provision levels. While market delivery is higher in communities with more older adults, it is lower in communities with more seniors in poverty—presumably the ones who would need services most. This raises a challenge for planners in how to stimulate both a market and a government response. We conclude by proposing a conceptual model that suggests services may complement limitations in the built environment. Focusing on service delivery in the near term offers a way forward for planners who work in communities where changes to the built environment are difficult to achieve.
Literature Review
Communities around the United States and around the world seek to foster age supportive policies (Caro and Fitzgerald 2015). AARP’s intergenerational approach in Communities for All Ages and Communities for a Lifetime (Harrell, Lynott, and Guzman 2014), WHO’s Age Friendly Cities (2002, 2007), and efforts such as the village model and naturally occurring retirement communities (Greenfield et al. 2012) demonstrate increased attention to the community role in supporting aging in place. The American Planning Association’s Aging White Paper calls for “quality growth to support multi-generational communities” (Blanton and Bowen 2013, 2), and gives attention not only to the built environment (walkability, mixed use) but also to services such as housing, transportation, workforce training, civic engagement, recreation, and security. The Aging Policy Guide, adopted at the American Planning Association’s National Delegate Assembly in 2014, addresses six key areas: housing, transportation, land use and zoning, economic well-being, community assets and supports, and community engagement (APA 2014). These initiatives point to the importance planners place on all three roles of planning: physical planning for the built environment, planning for service delivery (transportation, housing supports, and other community services), and participation and public engagement. These dimensions of planning underpin our analysis, which seeks to explain differences in the level of services for seniors across US communities. First, we discuss the literature regarding the role of planning in physical design and service delivery. Second, we examine the importance of community participation and engagement. Third, we discuss the role of government and market in service delivery, and potential tradeoffs between meeting the needs of children and elders. Then we present our hypotheses regarding the role of planning and participation on service delivery for the elderly.
Planning for Physical Design and Services
Although physical design remains central to the debates on planning and aging (Kerr, Rosenberg, and Frank 2012; Handy et al. 2008; Golant 2003), service delivery and other indicators of community well-being are receiving increased attention (Howe 2012; Harrell, Lynott, and Guzman 2014; Lehning 2014). While New Urbanists claim their model for livable communities fosters aging in place (Farber et al. 2011; Duany and Plater-Zyberk 2009), others counter that the impact of the built environment outside of the home on the activity of people with functional limitations is overstated (Hovbrandt et al. 2007; Kerr, Rosenberg, and Frank 2012).
Lehning (2012, 2014) was one of the first to analyze senior services at the community level. She studied physical design, housing, and transportation services and how the provision of these is affected by community characteristics. Her sample of communities in the San Francisco Bay Area found that population, government expenditure, and advocacy are all important explanatory variables. We expand upon this work by looking across a national sample of representative local governments. We hypothesize that the level of service delivery for elders (either by government or market) is a function of planning for aging, elder participation, and community characteristics (need, capacity, built environment, and metro status). See Figure 1.

Planning, participation, and services model.
Planning for inclusive physical design can strengthen the environmental suitability of a place, but where the built environment impedes aging in place, planning can enhance service delivery to make up the gap. This is particularly important in the transportation arena, where public transit and paratransit services complement street design and walkability initiatives to increase mobility for seniors (Lynott, Fox-Grage, and Guzman 2013; Lehning, Chun, and Scharlach 2007). Decades of suburban sprawl have left many neighborhoods automobile dependent and physically disconnected from retail, services, and opportunities for social engagement. Elder-friendly communities may supplement physical design with services, such as accessible transportation, housing options, health care, recreation, and opportunities for engagement in civic affairs, in the workforce, in volunteer activities, and in family life (Lehning 2012, 2014; Alley et al. 2007). However, extending services such as paratransit to older adults, especially those in suburban and rural communities, requires significant investment (Rosenbloom 2013). Advocacy organizations—such as AARP and the National Association of Area Agencies on Aging—emphasize the role of community design in successful aging in place (National Association of Area Agencies on Aging 2011; Kochera, Straight, and Guterbock 2005). Kerr, Rosenberg, and Frank (2012) summarize the extant literature on physical design, transportation, and physical activity showing the pathways by which the built and social environments affect physical activity and subsequent health outcomes.
Housing is another arena where planning can help communities become better places to age in place. Universal design standards can affect new construction, and supportive home modification services can enable older adults to remain in their homes. However, many communities lack sufficient affordable and accessible housing (Lipman, Lubell, and Salomon 2011). Planners have raised concerns about the market response needed to accommodate elder renters and retiring baby boomers who seek to downsize their housing (Myers and SungHo 2008; Harrell, Brooks, and Nedwick 2009).
For many communities, especially lower density ones, which lack development pressure, physical changes to address these challenges may not be realistic in the short term. For suburbs and rural areas, where the percentage of elders is growing (Micklow and Warner 2014; Glasgow and Brown 2012; Frey 2011; Kneebone and Garr 2010), this is an important challenge. Planners must find ways to ensure basic services fill this gap.
Elder Participation in Planning
Participation is a key pillar of WHO’s Global Network of Age-friendly Cities and Communities initiative (WHO 2002, 2007). Scholars have examined the types of engagement used in age-friendly community initiatives and found active participation impacts planning and service delivery more than passive needs assessments, and it also helps to build social capital and social inclusion (Scharlach and Lehning 2013; Greenfield et al. 2012; Lehning 2012, 2014). Research on planning for family-friendly cities has found that family participation is key to affecting action, and community attitudes can reduce resistance to change (Warner and Rukus 2013). Dear (2007) found that planning based in a community’s shared values and knowledge of how to meet the needs of underrepresented groups can counteract NIMBYism. A multigenerational approach can strengthen planning and service delivery for both children and elders (Warner and Homsy 2015; Choi and Warner 2015; Morken and Warner 2013), while intergenerational engagement can promote inclusive changes to the built environment, especially parks and schools (Vincent 2012; Kaplan et al. 2004).
Engagement is important because officials become aware of gaps in services and potential solutions through the participation of older residents. For example, Ståhl et al. (2008) found that involvement of older adults led to a more elder-friendly built environment and opened avenues of communication that helped local transportation officials realize that desired solutions were not so costly. Livability indicators are gaining attention and involve elder participation in their design to ensure attention to diversity and allow for continued public participation in ongoing planning (Howe 2012; Harrell, Lynott, and Guzman 2014).
WHO’s Active Ageing Policy Framework (2002) emphasizes community engagement and civic participation of seniors as a foundation for action. Involving stakeholders brings local knowledge and perspectives to issues and is especially important when addressing public health concerns (Corburn 2004). Age-friendly New York City, part of the WHO initiative, began with a thorough assessment of existing age-friendliness and perceived needs by gathering the input of more than 2,000 seniors through community forums, focus groups, and interviews (Finkelstein et al. 2008). Similarly, for the Lifelong Communities initiative, the Atlanta Regional Commission surveyed 1,500 people and held a nine-day charrette to explore how the communities in this sprawling suburban context could become better places for people of all ages (Keyes et al. 2014; Morken 2012a, 2012b; Duany and Plater-Zyberk 2009). In the San Francisco Bay region, Lehning (2012, 2014) found that advocacy by older adults, and making the economic case to city officials, led to more innovations in planning, housing, and transportation services for seniors.
Government and Market Service Delivery
Government plays a lead role in funding services for seniors. Around $2 billion per year in federal funding flows to states and local Area Agencies on Aging for a wide range of supportive services—information and assistance (on health insurance, legal assistance, and long-term care), nutrition (primarily congregate and home-delivered meals), transportation (health-related and demand-response transit), homemaker and personal care services, and caregiver support (US GAO 2011). States leverage federal support and directly fund many of their own programs, such as rental assistance, home repair assistance, low-interest loans for home modification, subsidized nursing home development, health care screenings, home-based services, and transportation.
As the population ages, the market might respond to shifting consumer demand—in transport, housing, recreation, and heath care. But a market response can be delayed because of invisibility of senior demand or inadequate needs analysis on the part of providers. Planners play a key role in alleviating these shortcomings by raising market awareness of changes in consumer demand for senior housing (Myers and SungHo 2008), for those with disabilities (Smith, Rayer, and Smith 2008), and for mixed-use communities (Handy et al. 2008). For example, Age-Friendly New York City includes a retail initiative that helps local businesses serve seniors better and market to older customers (City of New York and New York Academy of Medicine 2011; Li 2014).
Communities face many competing demands, and one of the concerns of an aging society is the potential for tradeoffs between meeting the needs of elders and of children. Historically the United States spends two and a half times more on seniors than on children. Of this, the federal government provides 97 percent of public support for seniors, while states and localities provide 68 percent of public support for children (Isaacs 2009). Especially in communities with higher poverty, the rise in older adults could force a tradeoff in local government provided services for seniors and the need to serve children. Greater ethnic diversity among the younger population could exacerbate this problem. US social policy historian Michael Katz (1989) notes that children and minorities have been considered the undeserving poor, whereas seniors have been considered deserving.
If we expand our view from government-provided services to look at the implications for market-based service delivery, we may find a means to get beyond the tradeoff. Myers (2007, 2015) recognizes mutual benefits across generations, noting the market imperative of caring for children because the younger age cohorts provide the workers, consumers, and tax payers to support retiring boomers. The American Planning Association (APA) recognizes that the needs of both seniors and children can be met in an integrated multigenerational approach (Warner and Baran-Rees 2012; Ghazaleh et al. 2011). This notion is shared by WHO’s (2007) age-friendly city, AARP’s aging in place (Kochera, Straight, and Guterbock 2005), and UNICEF’s (2004) child-friendly city frameworks. A majority of planners recognize that young children and elders have common needs regarding the physical environment and transportation services (Israel and Warner 2008). City managers report that multigenerational approaches at the local level can enhance political support for funding for both age groups and increase efficiency and effectiveness of programs (Warner and Homsy 2015; Choi and Warner 2015). Joint use of schools, mentoring programs, and co-located child and elder care are examples of ways that communities promote intergenerational services that meet the needs of all residents—from early childhood programs to recreational facilities for the entire community (Morken and Baran-Rees 2012; Vincent 2012). Kaplan et al. (2004) found that engaging both youth and older adults resulted in a park redesign that fit the needs of both by including areas for skateboarding, shuffleboard, picnics, and a Braille trail. Multigenerational approaches offer promise for enhancing both government and a market response to meet the needs of an aging society.
We bring participation, planning and community characteristics into a common framework to explore which factors differentiate communities that offer a broader array of services for seniors. We hypothesize that elder participation will lead communities to engage in more planning for senior needs. We further hypothesize that planning for seniors will promote a higher level of government- and market-provided senior services. We control for community characteristics to assess differences in service levels by metro status and levels of community need, including the potential for tradeoffs or synergies across generations.
Data and Methodology
We use a national survey conducted in 2010, 1 which measures planning and service delivery for seniors in local governments across the United States. The Maturing of America 2010 survey was mailed to all city-type governments with populations of 2,500 or more and to all counties. We used FIPS codes to match survey responses to socioeconomic and government finance data from the 2010 Decennial Census, 2006–2010 American Community Survey, and 2007 Census of Governments. Our final sample includes 1,413 governments: 344 counties and 1,069 municipalities. 2
The survey was addressed to the chief executive—the person with the broadest knowledge of service provision in the community and who would have access to staff members with more specific expertise. The survey asked a series of closed-ended questions about the local availability of forty-one services to support older adults. For each service listed, the respondent was asked to indicate whether it was provided by local government or by market (nonprofit organization or a for-profit entity). The survey also asked, in a similar closed-ended fashion, who funds the service or program—the local government, a nonprofit, or a for-profit. The services were grouped into the following ten categories. Complete descriptions can be found in the Maturing of America report (National Association of Area Agencies on Aging 2011; Morken and Warner 2012).
Health care (five services: services that meet a range of needs, prescriptions, wellness programs, screenings and immunizations)
Nutrition (three services: congregate meals, home delivery, nutrition education)
Exercise (two services: exercise classes, parks and walking trails)
Transportation (eleven services: six related to transit [health care transportation, community services, public transit, paratransit, discounted bus or taxi fares, and demand response services], two related to road design and driving, and three related to walkability)
Public safety/emergency (seven services: two related to elder abuse, four to emergency response and information, and one related to energy assistance)
Housing (four services: home modification and maintenance, subsidized housing, and targeted services [snow shoveling, backyard trash collection, etc.])
Taxation and finance (three services: tax relief, tax preparation, and fraud protection)
Workforce development (two services: workforce training and employer outreach)
Community and civic engagement/volunteer (two services: volunteer and education opportunities)
Aging/human services (two services: in-home support services and one-stop shop information services)
The survey also inquired about planning efforts and asked whether the local government has in place, does not have in place, or is considering the following six strategic and land use planning related items.
“A strategic plan that specifically reflects the needs and potential contributions of older adults”
“A comprehensive assessment of the needs of older adults (e.g., health, transportation, housing, education)”
“A master plan—a land use plan that embodies the vision, which is then reflected in zoning and subdivision ordinances”
“Zoning requirements that support ‘complete street’ design, enabling safe access for all users”
“Zoning requirements that support aging in place and active lifestyles for older adults (e.g., higher density, mixed-use development, and amenities)”
“Building codes that incorporate universal design in new construction”
We used the survey to build three dependent variables. Government Provided or Funded Services is an additive index from 0 to 41 that includes only those services for older adults provided or funded by government. Market Provided Services is an additive index from 0 to 41 that includes services provided either by a for-profit or nonprofit organization. The Planning for Seniors Index ranges from 0 to 12 and is based on the six planning questions listed above and scored as follows: two points if a plan is in place, one point if the plan is under consideration, and no points if there is no plan in place and none under discussion. See Table 1 for descriptive statistics.
Summary Statistics for Variables (n = 1,413).
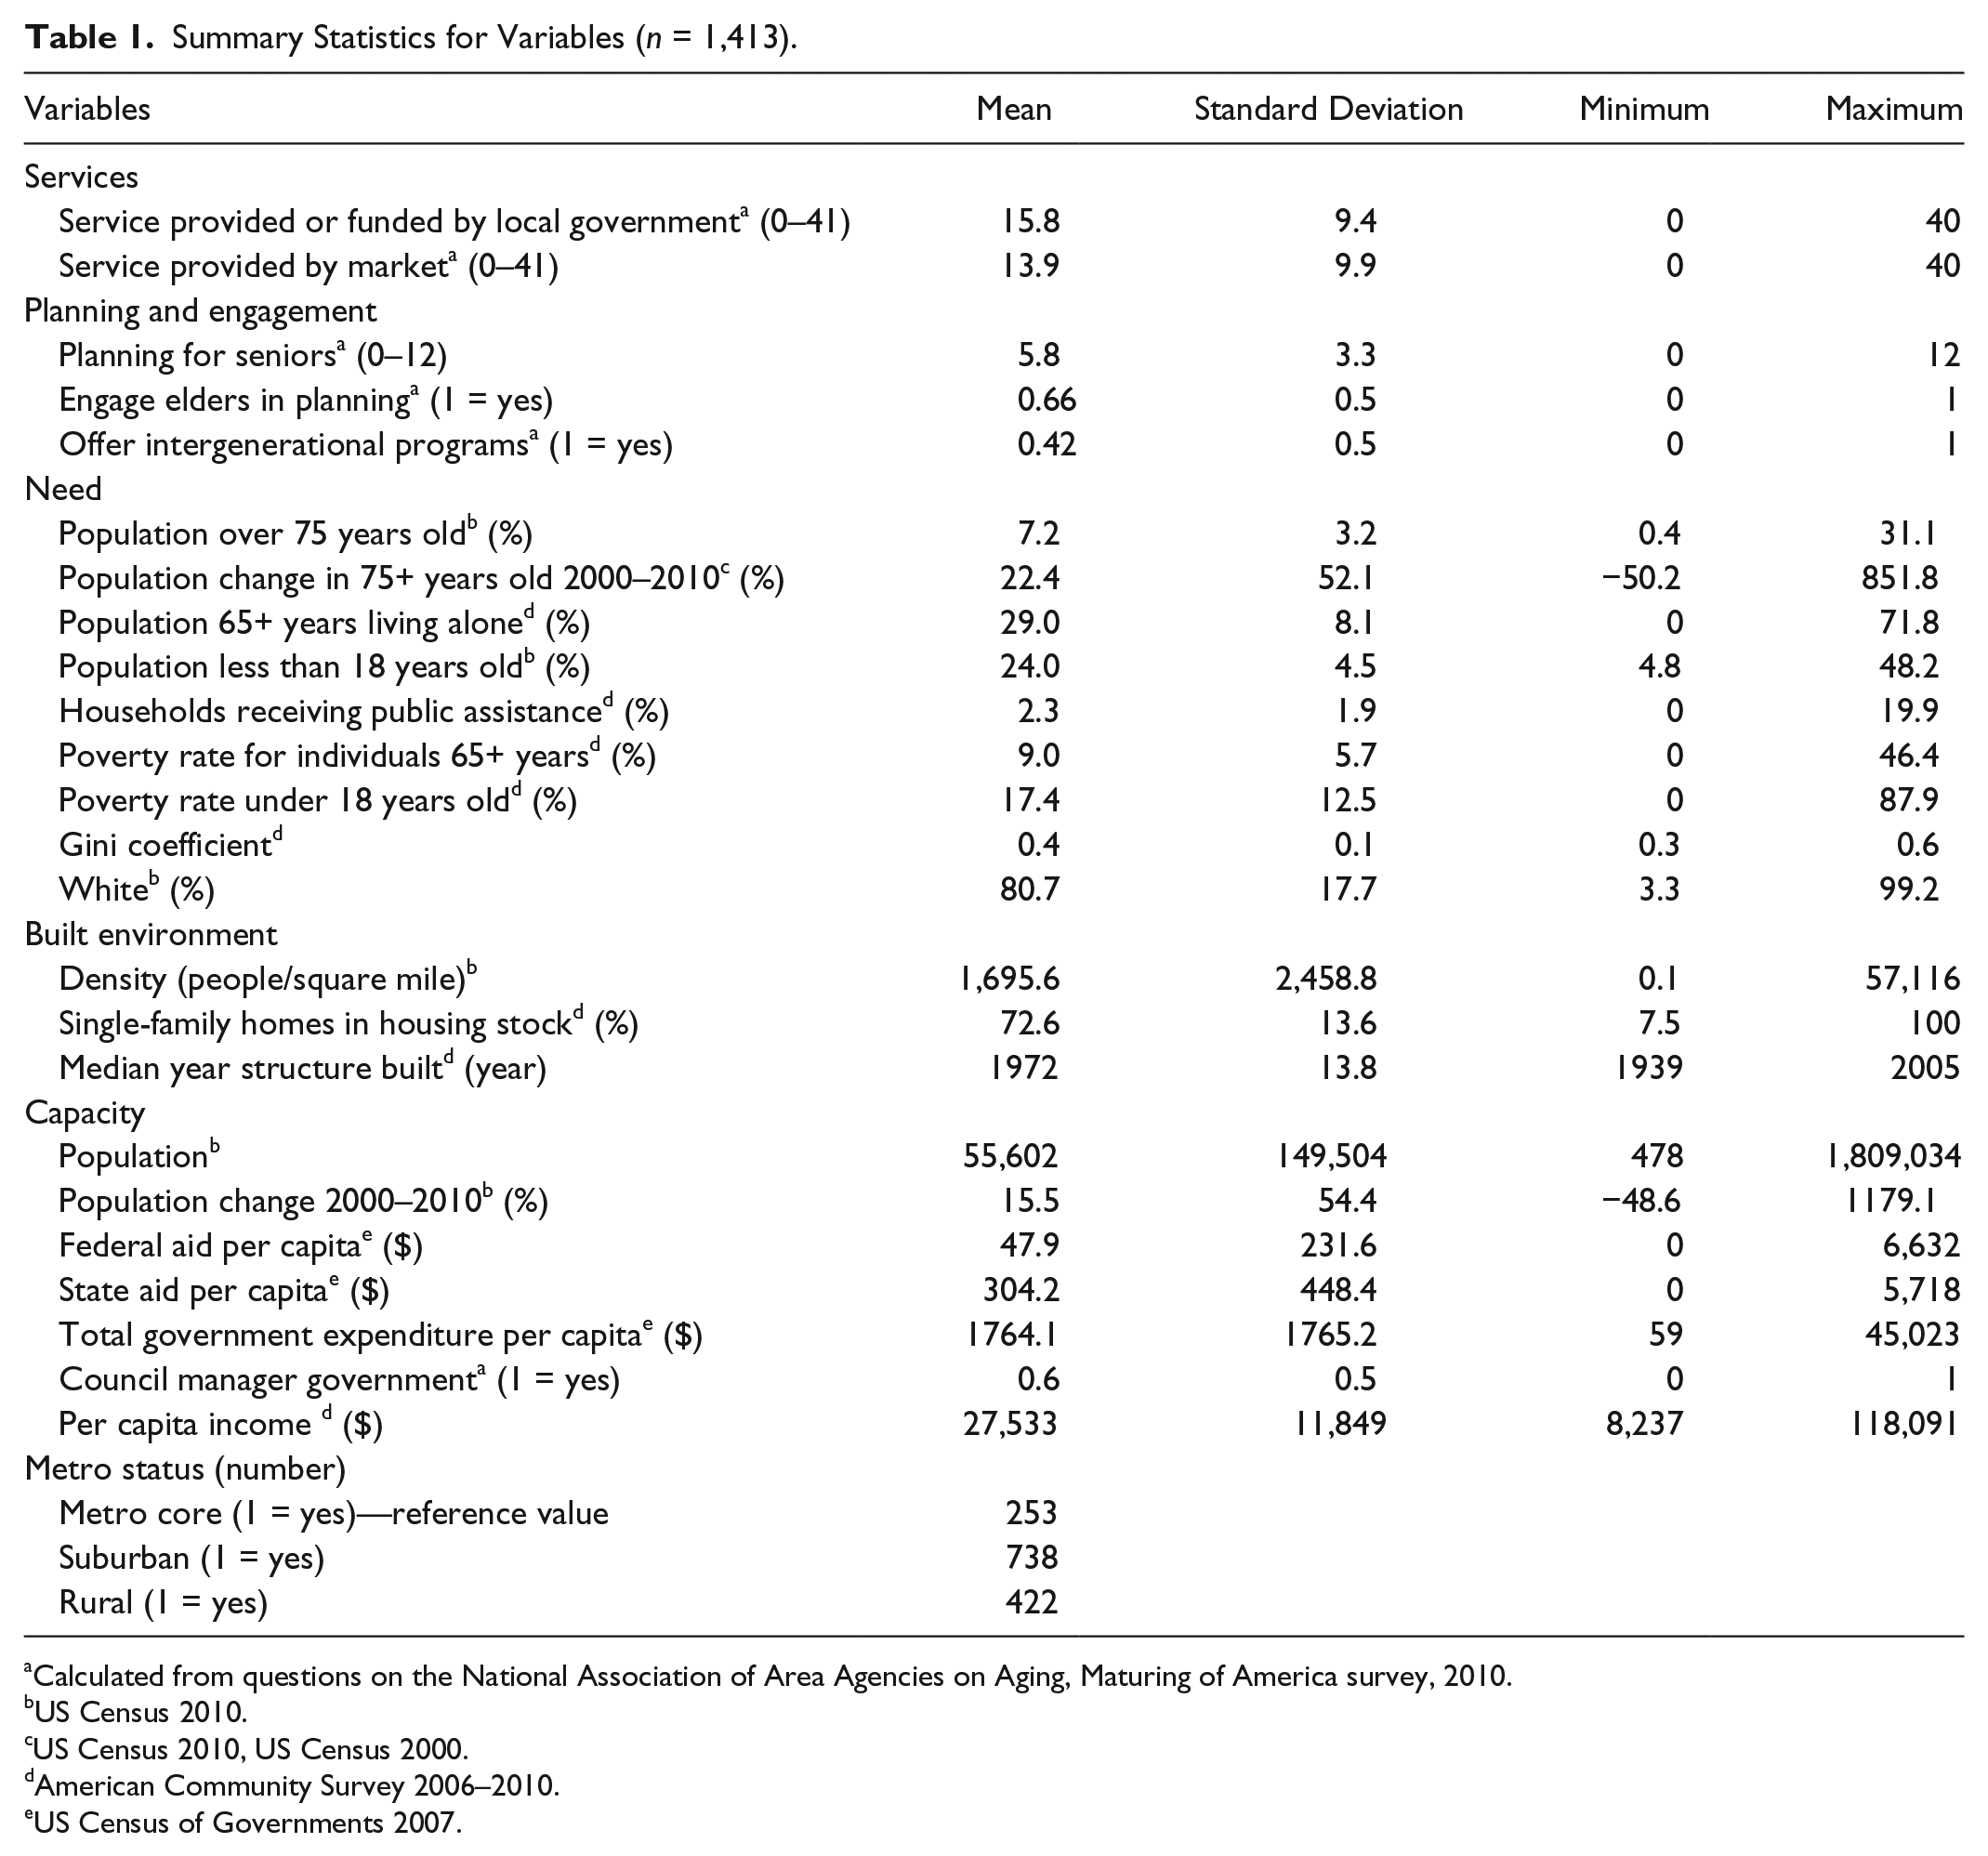
Calculated from questions on the National Association of Area Agencies on Aging, Maturing of America survey, 2010.
US Census 2010.
US Census 2010, US Census 2000.
American Community Survey 2006–2010.
US Census of Governments 2007.
The independent variables in our model include measures of community need, built environment, capacity, elder engagement in planning, and metro status. We use three measures of planning and engagement. The first is the planning index described above. The second is a measure of elder engagement in the planning process. This dummy variable measures whether communities either actively engage seniors in the planning process or more passively solicit a needs assessment. Two-thirds of the sample reported “engagement of older adults in local planning and decision making processes” and one-third reported “a process that solicits input from older adults to identify their needs,” while only one-fifth reported doing both. The third variable, also a dummy, measures multigenerational approaches and is based on the survey item that asks communities to report whether “programs have been developed specifically to provide intergenerational activities,” as we believe these might drive communities to do more planning and provide more services.
For need, we distinguish between population-based and poverty-based measures. We hypothesize that communities will provide more services and engage in more planning if they have more seniors in the population. Using data from the Decennial Census (2000 and 2010) and the 2006–2010 American Community Survey, we include population aged seventy-five years and older, as this is when seniors start to need additional service supports provided by local government (Edwards 2010). We also include growth in senior population (seventy-five years old and over), as these communities might recognize the need to develop services and plan for seniors. An additional measure of need is the population aged sixty-five and over living alone, as these lone senior households may be more dependent on service delivery to remain independent (Brown and Glasgow 2008).
We contrast population-based measures of need with poverty-based ones. To test if elder services are differentially provided in communities with higher poverty, we include poverty rate of seniors sixty-five and older. Seniors are considered the deserving poor (Katz 1989), so we expect that communities with higher poverty rates among seniors will provide more services and engage in more planning for their needs. We recognize there may be competing demands between seniors and other community members (Myers 2015; Warner and Baran-Rees 2012). Thus, we also include percentage of children (under age eighteen) in the population, child poverty rate, percentage of households receiving public assistance, the Gini coefficient of income inequality, and percentage of the population that is white. We expect that communities with more children, more poverty, greater inequality, and more diversity will provide fewer services to elders.
We test whether service levels and planning vary in response to different physical characteristics. As proxies for the built environment we include population density, percent single-family homes in housing stock, and median age of housing (drawn from the American Community Survey 2006–2010). Communities that lack density and that have a large percentage of older single-family housing may be less physically suited to support seniors who wish to age in place, and will need to provide more services.
Research on innovation in local government service delivery and policy diffusion points to the importance of financial capacity, professional leadership, public engagement, and planning (Warner and Morken 2013; Lehning 2012; Nelson and Svara 2012; Warner and Hefetz 2008). Our capacity controls include population size as we expect larger cities to provide more services and engage in more planning. We also measure population growth, as communities with development pressure may be better able to plan for changes in the built environment than those places without growth. Fiscal capacity includes federal aid, state aid, and total local government expenditures drawn from the 2007 Census of Government. We expect communities with higher total expenditures and those receiving more aid will provide more services. We also control for council manager governments as the literature finds that governments with professional management are more likely to provide services and engage in planning (Hefetz, Warner, and Vigoda-Gadot 2014; Nelson and Svara 2012). We also include the log of per capita income as a community measure of capacity.
Finally, we control for metropolitan status. We differentiate metropolitan core counties and core cities (those designated by the US Census as principal cities (US Census Bureau 2013a) from suburbs, which lie outside of the boundaries of the principal city but still within core counties (US Census Bureau 2013b). Rural communities include all municipalities and counties outside of metropolitan areas. We expect that metro core cities and counties will have higher levels of services and of planning. Table 2 provides key model variables by metro status. The data show that suburbs and rural communities in our sample have higher percentages of elders (6.9 percent and 8.2 percent, respectively) than metro core places (6.3 percent), with growth rates of seniors highest in suburbs (32 percent). However, rural areas and suburbs provide fewer services. Suburbs and rural communities also have lower levels of engaging elders in planning (67.6 percent and 56.4 percent, respectively) as compared to metro core areas (78.3 percent). Elder poverty is highest in rural areas. Single-family housing is highest in suburban and rural communities and lowest in core metro areas. State aid is higher in metro core and rural areas than in suburbs, which reflects the higher costs of service delivery in these areas (Warner 2006; Xu and Warner 2016). Suburbs also enjoy higher income. Despite higher elder populations and less favorable built environments, we expect suburbs and rural communities to provide fewer services than metro core cities and counties.
Select Variable Means by Metro Status (Percent “Yes” for 1/0 Variables).
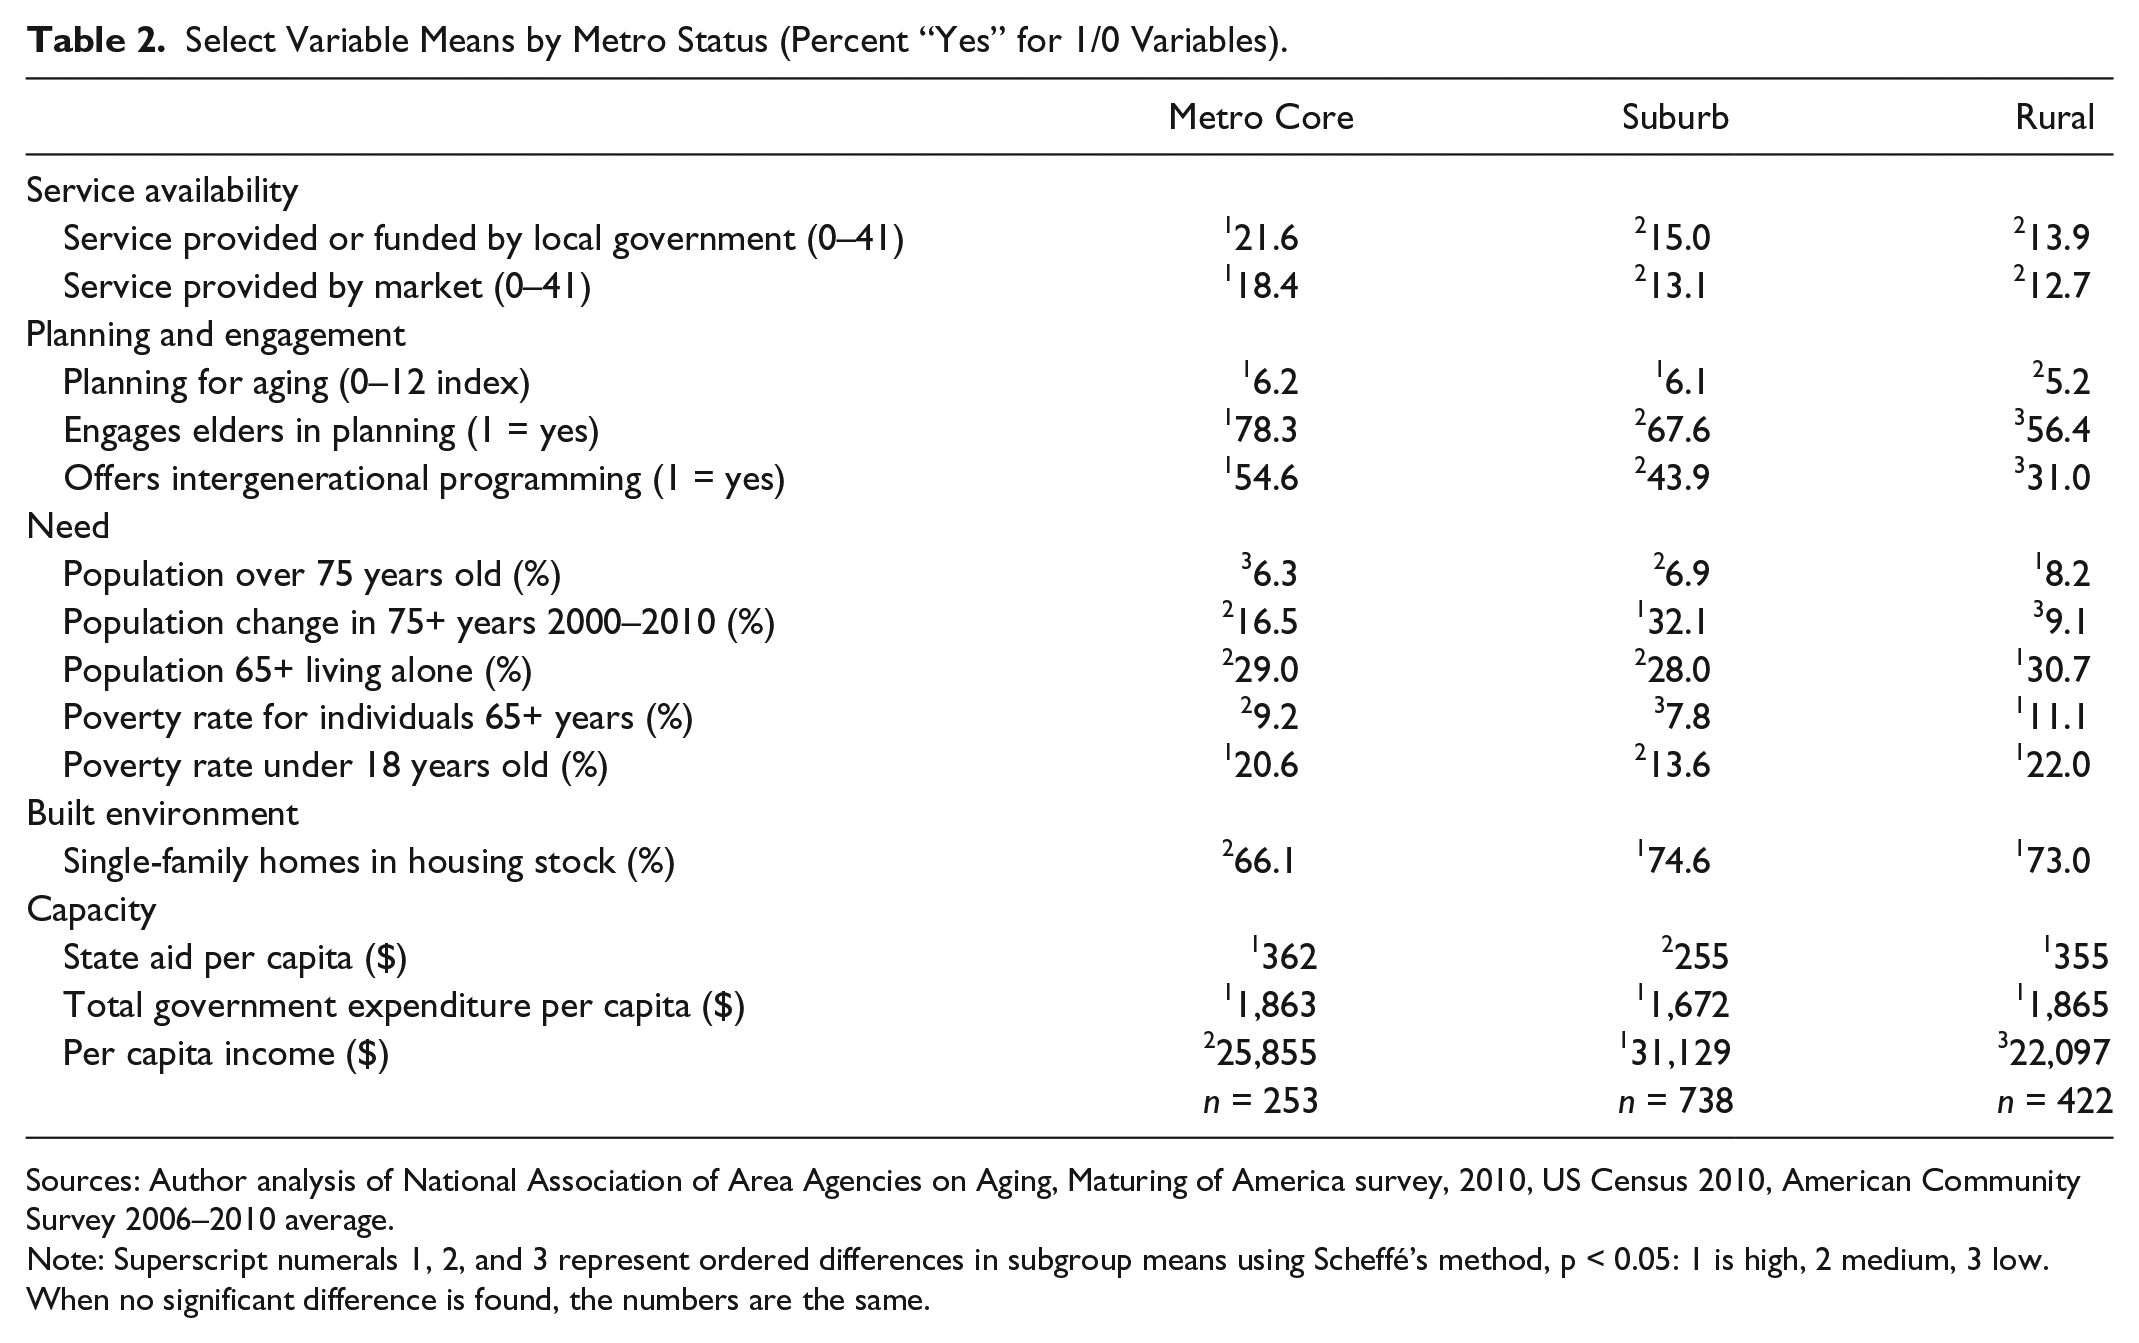
Sources: Author analysis of National Association of Area Agencies on Aging, Maturing of America survey, 2010, US Census 2010, American Community Survey 2006–2010 average.
Note: Superscript numerals 1, 2, and 3 represent ordered differences in subgroup means using Scheffé’s method, p < 0.05: 1 is high, 2 medium, 3 low. When no significant difference is found, the numbers are the same.
Model Results
We ran three OLS regression models, 3 one for each of our dependent variables: Government Provided or Funded Services, Market Provided Services (either for profit or nonprofit), and the Planning for Seniors Index. Table 3 shows the results for the two service provision models. We see that planning is positively correlated with the level of government provided services, and engagement of seniors and offering intergenerational programs are positively correlated with levels of service delivery in both the government and market models.
Service Provision Models.

Significance at the 0.001 level; **significance at the 0.05 level; *significance at the 0.1 level.
The impact of planning for seniors (e.g., strategic and comprehensive plans and zoning and building codes that support aging in place) is positively correlated to the provision of services in the government funded or provided service model. Municipalities that have all six planning actions in place (i.e., a score of 12 on the Planning for Seniors Index) have about 4.5 more services provided by government than those that do not have any of these planning, zoning, or building code provisions in place. 4 Communities that engage elders in planning processes have three to four more services funded or provided by government. The results demonstrate a clear correlation between service delivery and engaging older adults in planning and decision-making processes.
Across both models, communities that support intergenerational activities also have higher levels of service provision: about five more government-provided services and six more market-provided programs. One of our concerns was whether resource tradeoffs exist between serving elders and serving children. These results suggest that intergenerational programming may strengthen support for senior services.
Our need variables tell an interesting story. In the government provided or funded model, elder population is not linked to service delivery, and municipalities with higher proportion of children, higher income inequality, and more white people provide lower service levels. This suggests there is a trade-off between needs of children, the poor, and elders when government-funded services are considered. With market provision of services, however, we find no such tradeoff between children and elders. Markets respond to demand: communities with greater percentage of population over age 75 and more people over 65 living alone have more market provision. However, the poverty rate of seniors has a negative effect, suggesting that effective demand is important.
Regarding capacity, the most consistent result across the models is population size. Larger places have more services available both through government and market provision. Federal aid is not a significant driver of senior service provision in either model, though state aid is significant in the government provided and funded service model. Many federal dollars for senior services are funneled through the states to counties and Area Agencies on Aging and would show up under state aid in our models. Local government expenditure is positively correlated with government provided and funded services. We find no impact of federal aid, state aid, or local government expenditure on the level of market delivery. However, our measures of aid and expenditure are not targeted to programs for seniors, as the Census of Government Finance does not disaggregate by programs related to seniors. Communities with higher per capita income have higher levels of government provided or funded services.
These results raise concern about capacity, effective demand, and market service response. Markets respond to demand; the higher levels of market provision in communities with more population older than seventy-five is an indication of this. But effective demand requires funds, and the lower market service delivery in communities with higher elder poverty raises concerns that the market response may be lowest in communities where services are needed most. Or, it may be a problem with markets failing to see new demand in these places. Planning can help markets see new needs, and our model results show that it is elder engagement in the planning process, not the existence of the plans themselves, that helps explain differences in market service levels. We also find that market delivery is higher in communities with professional managers. Taken together, these results suggest that professional leadership and elder participation in planning may matter most in stimulating a market response.
Built environment variables were not significant in either service provision model. While the poor physical design of a place may be a problem, our modeling indicates that it has not stimulated either a market or a government service delivery response. Metro status shows some interesting results as well. While descriptive statistics by metro status (Table 2) show a clear metro core dominance in service provision, only suburbs show a significantly lower response in our models. Suburbs can benefit from government service spillovers in the metropolitan region, but more distant rural areas must provide services if their residents are to have access.
We ran a separate model to see what factors explain higher levels of planning for elders. See Table 4. Our variables on elder engagement and on intergenerational programming both show a strong positive correlation to planning, as expected, with each being associated with more than one additional planning action. Planning for elders also shows a positive relationship to percentage population older than sixty-five living alone.
Planning for Elders Model.
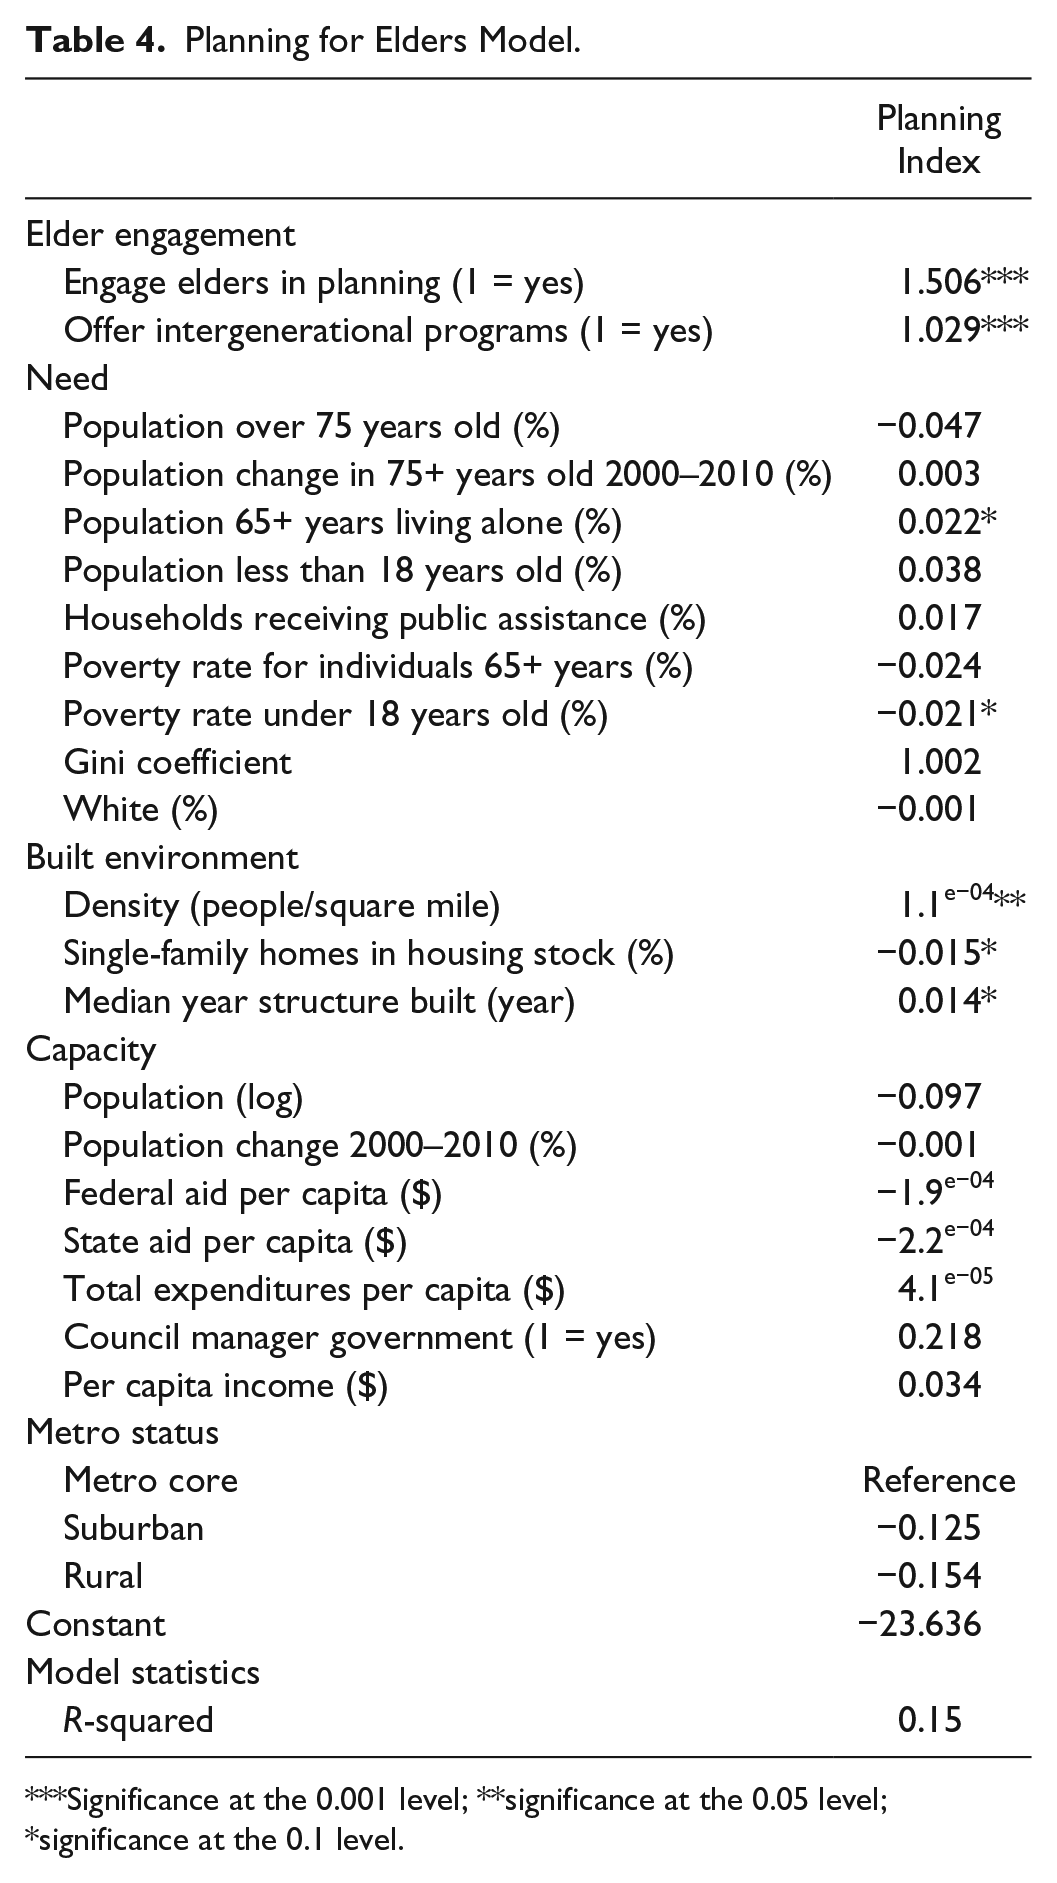
Significance at the 0.001 level; **significance at the 0.05 level; *significance at the 0.1 level.
In the planning model, several of the built environment variables become significant. Communities with more population density and a higher percentage of older adults are more likely to have higher levels of planning. However, communities with more single-family housing have lower levels of planning. Planning is not differentiated by any of the capacity variables or metro status. This suggests that planning in rural and suburban communities is not as low as descriptive statistics suggest, after controlling for other variables.
Discussion
Our models of community service delivery for aging in place show that engagement of seniors in planning helps explain higher levels of service delivery by both the public and private sectors. Half of WHO’s (2002) recommendations for age-friendly communities relate to civic engagement and participation. Some engagement may be the result of program requirements, and while our models cannot parse the nature of elder engagement or its intensity, they do corroborate the importance of elder participation in motivating both a market and a public sector response (Lehning 2012, 2014; Ståhl et al. 2008).
Capacity plays divergent roles in the two models. Government provided or funded services are higher in communities with more state aid, local expenditure, and per capita income, as expected; research demonstrates that local governments need capacity to operate programs (Lehning 2012; Warner and Morken 2013). Market provided services are higher in communities with a council-manager government suggesting that professional leadership may help in managing market based service provision (Heftez, Warner, and Vigoda-Gadot 2015; Hefetz and Warner 2012; Nelson and Svara 2012).
However, we find lower service delivery where elder poverty is greater. Private market provision is lower in poorer municipalities, making public provision of services, and therefore planning, even more important in communities where the private market does not respond (Warner 2006). 5 One challenge facing planners is how to promote market response to the needs of a growing aging population. Planners have a long history of using planning and zoning tools to entice developers to provide affordable housing and public space (Homsy 2016; Lassar 1989). Stimulating market-based services is a new challenge, but one that can be addressed with economic development incentives and technical support. For example, New York City is using its Business Improvement Districts network to support outreach to neighborhood businesses to recognize a new market among aging New Yorkers (Li 2014). Area Agencies on Aging are also an important resource for planners to work with to address a broad range of service needs across the region.
Participation in intergenerational programs many provide an avenue to motivate a community response for increased senior services. Although we see some evidence of a tradeoff between meeting elder needs and other needs (poverty, children) in the service delivery models, we find a strong positive relationship between the presence of intergenerational programs and increased services for older adults and increased levels of planning for aging. Our research provides more generalizable evidence of a benefit noticed previously in case studies (Kaplan et al. 2004; Vincent 2012). Finding ways to create more fully accessible environments for seniors and children might help build larger constituencies for both physical and service-related planning for both generations.
Conclusion
Our research presents the first large-scale analysis at the community level of service delivery for seniors. While our findings confirm the importance of planning, public engagement, and local leadership found in prior studies (Lehning 2012, 2014; Warner and Rukus 2013), we do not find the link between service delivery and the community’s built environment that has been called for in the APA Aging Policy Guide (et alAPA 2014). It could be that better measures of plan content and more fine-grained indicators of the built environment, if available, would reveal a link. Future research should employ case studies to explore how such links can be crafted. What our work has shown is the need for a more comprehensive, community level paradigm for theorizing this relationship.
We believe that a new model linking services and physical design is needed. While the physical environment affects the level of independence of older persons (World Health Organization 2002, 2007), we argue that community services can help bridge the gap to full functionality. The World Health Organization (2007) uses an individual functionality curve to present the concept of a disability threshold, below which people fall at different rates as they age. We extend this model from the individual to the community level and we look across all ages. As illustrated in Figure 2, a large gap exists between the ability of physical design to create fully enabling environments for older residents (as well as for those in early life). Although good physical planning (i.e., inclusive design) helps meet the demands of an aging population, there are limits to how much physical design alone can do. Services are a critical complement to creating an inclusive community. Services may be especially important in places that lack development pressure and thus lack the opportunities for planning to leverage major changes in the built environment. Many rural and suburban communities fit this profile, and in these locations, services could help ensure full functionality of aging adults.
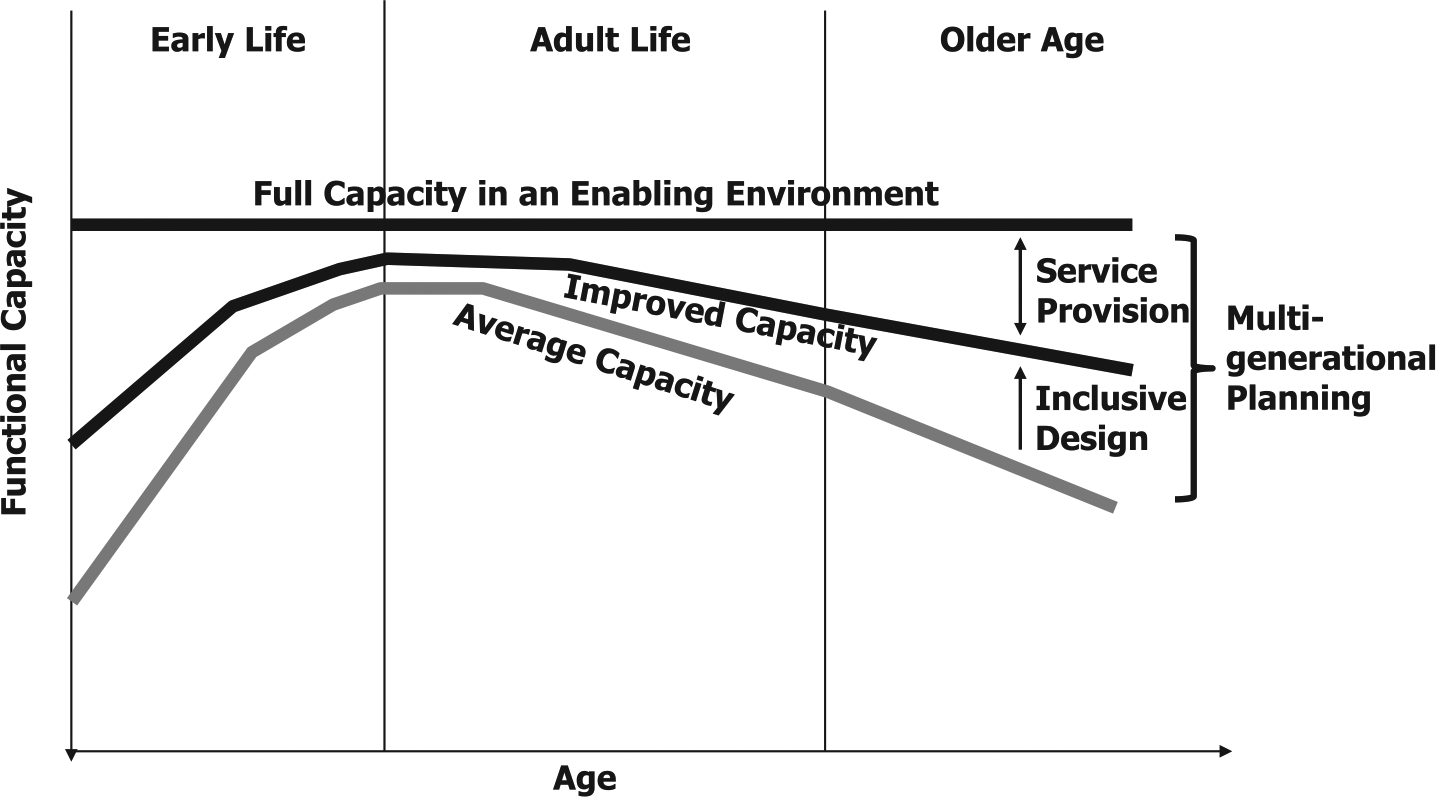
A framework for multigenerational planning: The link between design and services.
The challenge for planning is how to better integrate service delivery and physical planning so that residents can enjoy full functionality across the life course. As our study shows, US communities fall short in this area. While service delivery responds to changing demographics, neither the public nor the market models find higher service levels in places that have less favorable built environments. In our service delivery models, none of the built environment variables correlate with greater service delivery for seniors. In our planning models, communities with a greater proportion of single-family houses engage in less planning for elders. These results have policy implications and provide productive areas for future theoretical and empirical inquiry.
Given the slow pace of land use change and the need to compensate for an inadequate built environment, planners will need to be more innovative with land use tools, such as zoning and building codes, to shape a more age-friendly physical environment over the long term while focusing on the delivery of services in the near term. Future research that develops more precise measures of the built environment in communities across the country would enhance both our understanding of the role of the built environment and the impact of planning tools in leveraging change to create communities more supportive of aging in place. Finally, planners must push to engage elders in planning as this sends important market signals, which can help communities meet the needs of an aging population.
Footnotes
Acknowledgements
We would like to thank Sandy Markwood of National Association of Area Agencies on Aging for allowing us to use the Maturing of America survey data; Evelina Moulder of the International City/County Management Association for sharing the data with us; Esther Greenhouse, gerontology consultant; Kristin Aldred Cheek, PhD candidate at Cornell University; and the anonymous reviewers for their helpful critiques.
Declaration of Conflicting Interests
The author(s) declared no potential conflicts of interest with respect to the research, authorship, and/or publication of this article.
Funding
The author(s) disclosed receipt of the following financial support for the research, authorship, and/or publication of this article: This research was supported in part by US Department of Agriculture, National Institute for Food and Agriculture Grant no. 2011-68006-30793.