
Abstract
Previous behavioral studies on urban structure have been limited by the scale, accuracy, or promptness in obtaining statistical data used for delimiting retail center boundaries and hierarchical analysis. Using a large amount of GPS-enabled taxi data from Guangzhou, China, this research attempts to delimit the boundaries of retailing centers and explore their hierarchical characteristics. The identified retailing centers are verified with economic census data, and the retailing hierarchical structure is identified through assessing trip summation, travel distance, and travel time. Among these indicators, trip summation reveals hierarchical characteristics best. The urban retailing hierarchical structure also reveals the centrality of urban Guangzhou.
Introduction
The era of urbanization has prevailed in recent decades with highly developed levels of global urbanization and the tendency toward urban expansion. In 2014, 54 percent of the global population lived in urban areas (UNDESA 2015) and about 12.5 percent lived in twenty-eight megacities. Therefore, urban elements such as architecture, activities, social groups, and their relationships with the structure of urban areas are important for optimizing spatial models of land use and planning for urban resource use and for solving city problems (Bourne 1982). Research on urban structure that aims to recognize the stages of urban development to support urban planning and management has been carried out since the early twentieth century.
Centrality is an important concept in urban studies. It involves a behavioral tendency toward concentration in central areas (Latham et al. 2008). Studies based on traditional urban geography assume that a city definitely has a specific structure with a central system. Postindustrialism challenges the studies of positivism with other theories, such as the Los Angeles model. Dear, Schockman, and Hise (1996) and Soja (1989) presented the reterritorialization characteristics of the urban process, arguing that city form was becoming fragmentary with a breakdown of the original structure of the city, including an absence of a specific center. It was thought that past center-driven urban development no longer applied to the new era (Dear and Flusty 1998; A. J. Scott and Soja 1996). Whether centrality exists is still arguable. Research in this regard has been limited by its large scale and data accuracy.
In the study of centrality and urban structure, there are a variety of theoretical models, such as central place theory (Christaller 1966), concentric zone model (Burgess 1925), and sector theory (Hoyt 1933), covering many aspects such as urban morphogenesis, retail space, residential space, and so on. Commercial space at shopping centers is one important component of urban structure. Based on central place theory, the geography of retailing has focused on the research of urban structure for a long time (Gregory et al. 2011). According to the theory, a central place serves the need for goods and services in surrounding areas. The central business district (CBD) is a typical example of centrality (Latham et al. 2008). When studying centrality, the urban retailing hierarchical system is always mentioned. Berry (1963) classified urban retail structure by identifying the center, ribbons, and specialized areas. The nucleated center includes the central business district, regional center, community center, and neighborhood center. Filion and Bunting (1991) identified inner-city retailing centers more specifically, dividing them into the CBD, specialty products, and retail clusters.
While geographers pay much attention to the retailing hierarchical structure, the measurement of a hierarchical organization is mainly based on the identification of centers, most often the identification of the CBD. The earliest approach for identifying the center was the calculation of annual revenue of shops along the street, identified by the United States Census Bureau. Other widely accepted indicators include the central business height index (CBHI) and the central business intensity index (CBII; Murphy and Vance 1954). These became classic methodologies and sparked a wave of CBD definitions (e.g., P. Scott 1959; Mattingly 1964). Multiple methods have been used in recent research, including the commercial index method, the index method, the jobs density exploration method, and so on (e.g., Redfearn 2007; Greene 2008; Cladera, Carlos, and Moix 2009).
The development of transportation systems increased personal mobility. Thus, identifying retailing hierarchical organizations and center boundaries presented some problems. Some assumptions of central place theory about the nearest distance became unrealistic as the boundary identified by using census data calculates not the real boundary but the administrative boundary. Aiming to solve those problems, behaviorism was first used in retailing geography in the 1960s when consumer behavior was taken into account (Rushton 1971). Connections between consumer behavior and the formation of urban retailing centers revealed that consumers’ multipurpose shopping behavior, socioeconomic attributes, and cognitive structures had a powerful effect on the structure of retailing centers (Berry 1958). Spatial structure and the hierarchical organization of retailing centers began to be analyzed from the perspective of consumer demand and multipurpose shopping behavior.
Research on what happens when retailing centers change from a single supply into multiple sites of supply and consumption, revealed that purchasing power increases and consumer behavior becomes diverse and complex. Therefore, consumer data also becomes vital in retailing research. Quantitative studies using residents’ questionnaires and economic census data tend to be limited to the number of samples, thus the conclusions are sometimes controversial. In the early twenty-first century, thanks to breakthroughs in data-mining technology, the availability of a large amount of space–time data has provided a new perspective for the study of urban retail structure. The hierarchical characteristics and the boundaries of urban retailing centers can be identified based on mobile phone locations and GPS-enabled taxi data (Ratti et al. 2006; Mao et al. 2010; Long, Zhang, and Cui 2012; Gao, Wang and Gao 2013; Pan et al. 2013). New methods of urban retail research have increased substantially, potentially bringing new answers to old questions in the geography of retailing. New understandings on the form of urban land use, as well as urban dynamics characteristics, have been generated (Arribas-Bel 2014; Liu et al. 2011; Kitchin 2014; Yue et al. 2014). For instance, Liu et al. (2011) found a “concentric” urban structure in Shanghai, China, by investigating the temporal variations of both pickups and drop-offs of a taxi trajectory data set. Zhong et al. (2014) utilized bus smart card data to analyze the conversion of Singapore’s urban spatial structure, and this research demonstrated that Singapore was changing from a single-core city into a multi-core city. The above research provides valuable insights into the delimitation of urban retail structure. Compared to traditional methods of research, such research methodologies based on big data are more dynamic, accurate, and realistic. Big data is significant for reflecting on complex and multiple behaviors and helps geographers understand rapidly changing urban structure. However, the characteristics of cities and regions vary with differing cultures, transportation systems, and planning institutions (Hall 2009).
The big data method takes little account of socioeconomic factors, so that answers to classical research questions sometimes remain controversial. Given the advantages and disadvantages of the big data methodology in urban structure research expressed above, other study methods need to be explored, such as combining big data and economic census analysis.
With its unique economic and political environment, urban China has its own development track. Because of the reform and opening-up policy, rapid development was experienced in the 1990s. Along with economic and social transition in the twenty-first century, urban China has faced structural reshaping. Does it have some notable city centers? Are there any hierarchical characteristics in these city centers? A rapidly changing structure calls for a more dynamic research method. This study applied the big data method to the study of Chinese urban structure to identify the spatial structure of the city and to guide urban resource use. The case study of urban China showcases the application of urban structural theory to a rapidly developing country. In addition, the comparison of the big data method and the traditional method helps to validate the big data application. This article uses Guangzhou, the third biggest city in China, as a case study to investigate urban structure from the perspective of retailing centers by using GPS-enabled taxi data. New research methods using big data have been used to study city structure from the perspective of consumer behavior. Economic census data was used to validate the results from the perspective of supply. The exact boundaries of retailing centers and their hierarchical characteristics are analyzed in the article to give a complete picture of the urban structure of Guangzhou. Finally, applying big data to the study of urban structure is discussed, in terms of its aims to discover a new direction and provide better support for urban spatial studies.
Data and Methods
Data Source
The central areas of Guangzhou, China, were chosen as the research areas. The research used the GPS positioning data of taxis on May 2 and from May 11 to May 17, 2009, for analysis. May 2 was the second day of the International Labor Day holiday in China.
The GPS-enabled taxi data came from the Guangzhou Commission of Transport, a municipal administration governing the operation of taxi, bus, and other road transportation. The data covered all of the taxi companies in Guangzhou. The GPS-enabled taxi data records the license plate number, latitude and longitude, and vehicle condition of a taxi every 20 seconds, which effectively supplies information about its specific locations and whether the taxi is empty or not. A cycle of “pickups–passenger–drop-offs” is considered as one vehicle “trip,” with the first location of the “pickups” status of the vehicle set as “origin” and the last location of the “drop-offs” status set as “destination.” About 3,184,800 trips were extracted from the GPS-enabled taxi data.
The research also used data from The Second China Economic Census of Guangzhou (Economic Census Leading Group Office of the State Council 2008), which surveyed the scale and distribution of secondary and tertiary industry. The economic census data covered all of the legal business entities and individual enterprises in Guangzhou, with “community” as the statistical unit. Statistics in eighty-seven categories of industry were calculated, with a total number of 2,784 communities in Guangzhou.
The economic census data included the annual revenue and the number of employees in retail, accommodation, catering, and residential services. Entertainment and other service sectors were studied as well to calculate their scale in every community.
Research Method
This research first delimited the boundary of the retailing centers in the research area, and then explored the hierarchy of the identified retailing centers. The flowchart of retailing centers boundary delimitation is shown in Figure 1. First, the kernel density estimation method was implemented in the entire region to produce a density map. Second, high-density areas were identified. Third, high-density areas were categorized into two types based on traffic characteristics on the relevant roads. Pedestrian street retailing centers have car traffic control around their core areas, which lead to an annular hotspot. On the other hand, main road retailing centers without car traffic control tend to form a linear hotspot. Fourth, the boundaries were delimited for each type of identified retailing center.
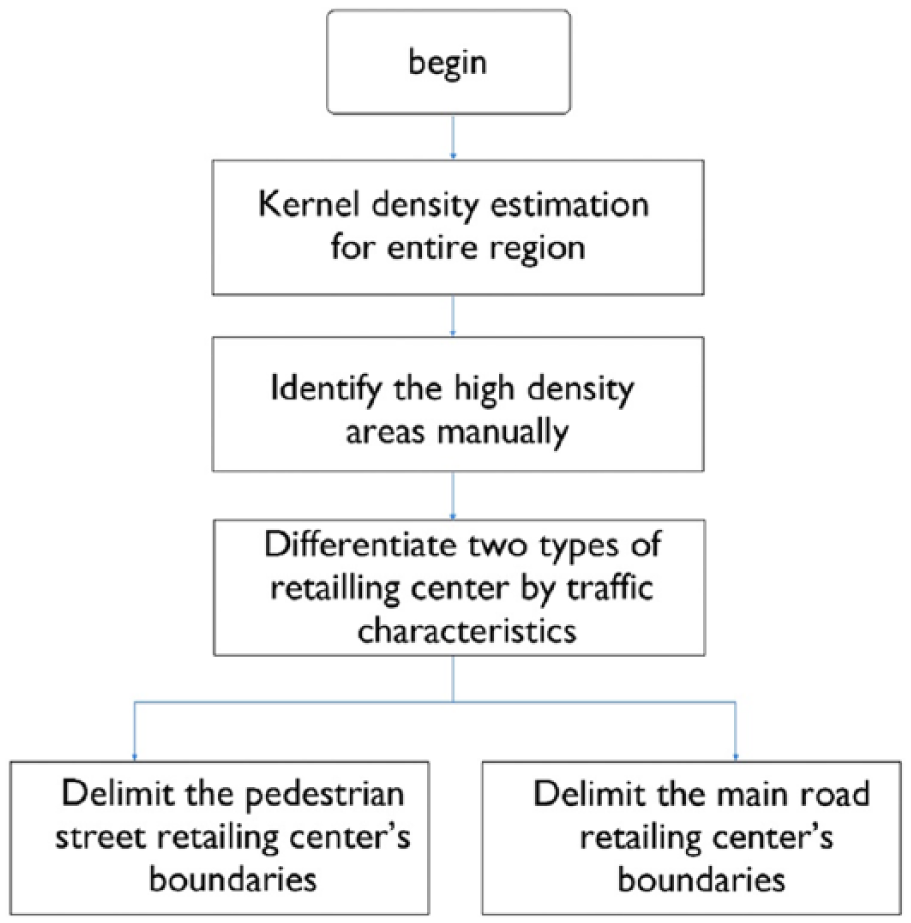
The workflow of retailing center boundary delimitation.
With the development of GIS technology, point data showing socioeconomic activities began to be used for the spatial analysis of cities (Gatrell et al. 1996; Thurstain-Goodwin and Unwin 2000). GPS-enabled taxi data is also a kind of point data. Compared to other data sources, point data can accurately reflect urban spatial morphology because of its accuracy and volume. Therefore, many statistical methods have been adopted to attribute the concentration of activities to area units as “urban districts” and to thus derive their density. The core of the city can be highlighted in terms of dominance of the economic activities located there (Yu, Ai, and Shao 2015).
The kernel density estimation (KDE) method is an efficient spatial statistics tool in spatial density evaluation having the advantage of detecting main distribution properties from large volumes of point data. Yu, Ai, and Shao (2015) carried out analysis and delimitation of central business districts using KDE. In their research, they compared three widely used methods in spatial density analysis (quadrat analysis, Voronoi-based analysis, and the KDE method) and pointed out that KDE is a very efficient tool as it considers the decay impact of services. The general form of a kernel density estimator is expressed as
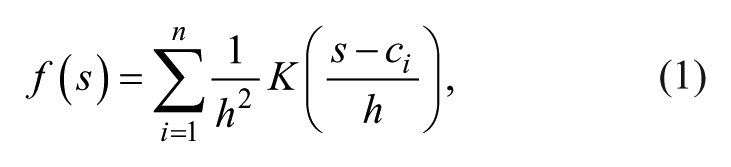
where f(s) is the estimated density value at location s, n is the total number of event points under consideration, h is the search radius or search bandwidth, s – ci is the distance between event point ci and location s, and K is the kernel function. The KDE method requires two parameters, namely, the radius h and the kernel function K. The radius h is a sensitive parameter and it is also the most important variable in the KDE method. A larger radius can generate a smooth surface, and a smaller radius can produce a rugged surface to highlight the variation of spatial distribution.
Two methods are proposed in this article to delimit the boundaries of two types of retailing centers, respectively.
The method for delimiting the pedestrian street retailing centers’ boundaries
Since it is often surrounded by an annular transportation system called a “distribution loop” (Li 1999; Qin, Zhao, and Zhou 2003), the CBD boundary can be distinguished by recognizing the distribution loop around the peak of the kernel area. The method of distribution loop recognition is as follows (Figure 2).

The detection of the “distribution loop” of a pedestrian street retailing center.
First, consider the actual width of roads, and set a 20-m-wide buffer area around the road axis within each identified retailing center. Second, count the number of GPS destination points within the buffer area. Then, the GPS density (d) is the number of GPS destination points (n) divided by the length of the road (l):
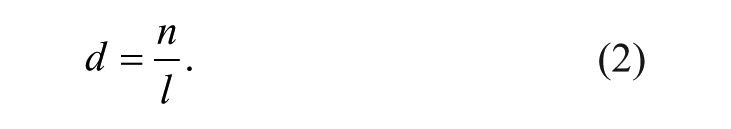
Third, the roads with high GPS density values (i.e., d > d80%) form a part of a distribution loop, where d80% is the 80th percentile of the highest value of all the GPS densities within this retailing center. Fourth, adjust the incomplete distribution loop according to the morphology and road grade, in case some roads with low grade are to be a part of the distribution loop.
The method for delimiting the main road retailing centers’ boundaries
For the other type of retailing centers, in which stores and shopping malls are found along the street, the traffic flows mainly cluster on only one or two main streets and the “distribution loop” is not clear. It is assumed that the locations passengers alight are usually nearest to retailing centers, and within 50 m of the retailing center boundary. In addition, there is a phenomenon where the GPS destination point density on main roads attenuates from the core area of the retailing center to the periphery. Therefore, the boundary of this type of retailing center can be identified as follows (Figure 3).
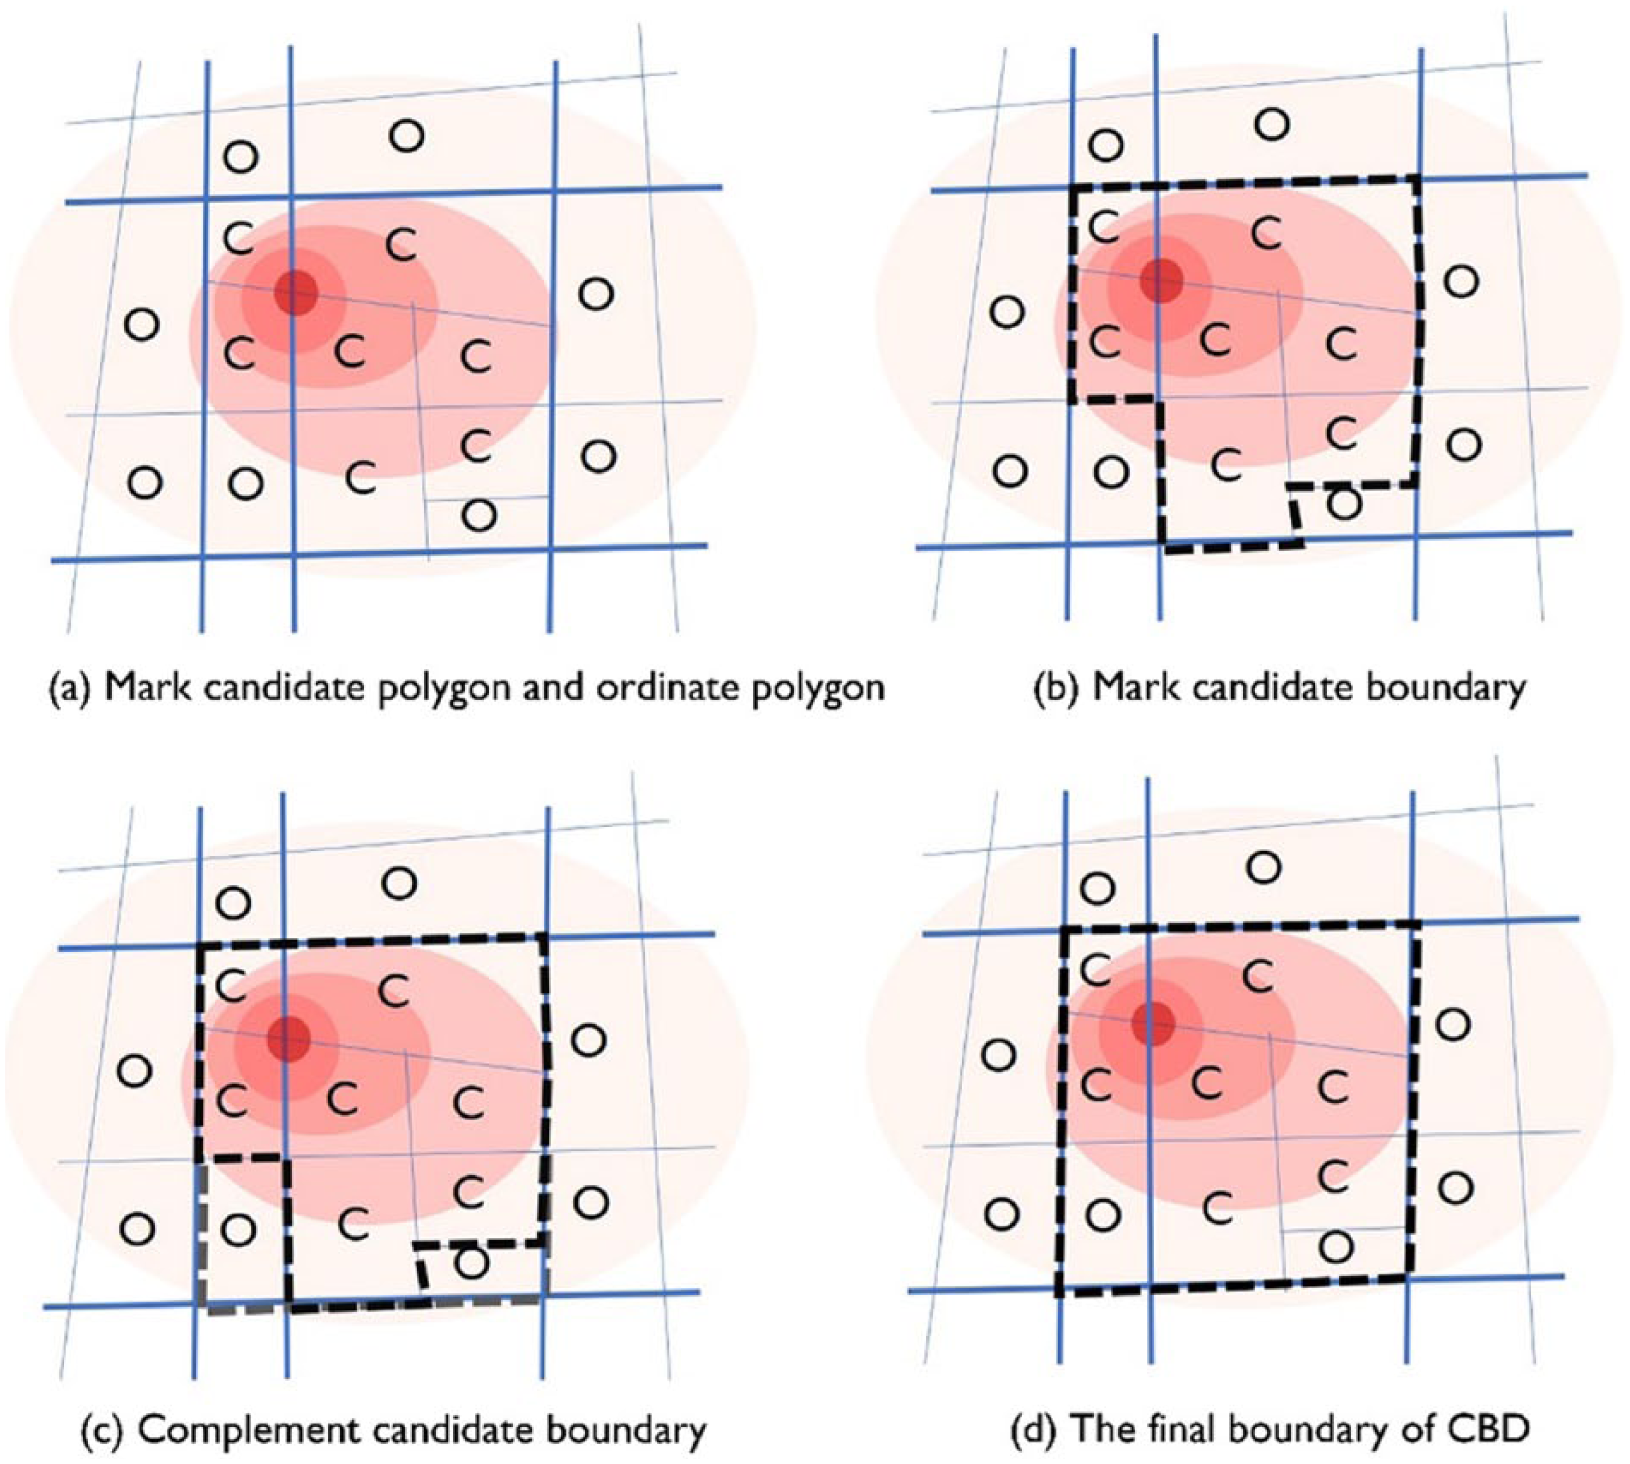
Delimiting the main road retailing centers’ boundary.
First, cut the region into polygons by the road network, and do an overlying analysis on the kernel density map and the polygons. If a large portion (i.e., 50 percent) of a polygon is within the high kernel density area, then it is marked as a “candidate polygon”; otherwise, it is marked as an “ordinate polygon.” Here, high density means that the density value should be within the highest 20 percent of all the GPS densities within the retailing centers. Second, the common edge of a “candidate polygon” and an “ordinate polygon” is marked as the “candidate edge.” Third, connect all the “candidate edges” to form a “candidate boundary.” Fourth, complete the “candidate boundary” according to the morphology and road grade, in case the “candidate boundary” is incomplete or some roads with a low grade are to be a part of the final boundary.
Delimiting Retailing Centers Based on the Kernel Density of Destination Points
In this article, the KDE method is used to analyze the destination points of trips extracted from the GPS-enabled taxi data. Cluster areas of destination points were identified by different cluster densities and the clusters with high densities were considered to be “hotspot” areas. There are many articles about how to set the search radius when using the KDE method. Gatrell et al. (1996) proposed that urban spaces of varying sizes can be analyzed by using different search radii, thus allowing density contours to be drawn. Borruso (2003) proposed that kernel density estimation is able to analyze different kinds of urban spaces by using different search radii and that it is also able to describe the characteristics of urban spaces. For example, a road density contour map can describe the extent of the urban area in a city, and city street density can define the built-up area in a city. Thurstain-Goodwin and Unwin (2000) identified the central area of the London region by setting the search radius as 300 m. Liu et al. (2011) analyzed the evolution of the road network in the Guangzhou–Fushan Metropolitan Area using the KDE model. The central area of the municipal district was identified with a search radius of 2,500 m. There are also some other approaches, such as the visual analytics approach (Maciejewski et al. 2008; Doraiswamy et al. 2014) for spatiotemporal hotspot analysis with similar data sets. This article makes reference to the literature referred to above and considers the scale of the research to identify retailing centers in the central urban area of Guangzhou.
Stability of Hotspot Areas Based on GPS-Enabled Taxi Data
The destination points of trips extracted from the GPS-enabled taxi data of May 11 to May 17, 2009, were first used to test the stability of the hotspot areas identified by the KDE method on May 2. After some preliminary tests for evaluating and selecting the proper search radii for the KDE model, the search radius was set as 500 m and the raster unit was set as 50 m. The clustering results in Figure 4 show that hotspot areas were very similar. In addition, the total areas of the red region on May 2 (holiday), May 16 (Saturday), and May 17 (Sunday) were less than other days because there is less commuting and business travel on holidays and on weekends. Previous researchers also support the assumption, indicating that consumption behavior always took place on weekends (Ley 1983). Using the concentration and stability of hotspot areas over the days above meant that identifying retailing centers with the data of May 2 was reliable and realistic.

Kernel density estimation of destination points within 500 m research radii of May 2 and from May 11 to May 17, 2009.
Delimiting the Retailing Centers Based on GPS-enabled Taxi Data
In this step, two different search radii (1,000 and 500 m) were chosen respectively to implement the kernel density estimation for the travel hotspots and commercial structure analysis. This is because taxis usually stop on roads with intensive passenger flows, such as on main roads around retailing centers. According to the Principles of Urban Planning (National Council of Urban Planning Practice Management 2012) in China, the standard interval of main roads is from 700 to 1200 m, while the standard interval of secondary main roads is from 350 to 500 m. Most of the road network was built up during China’s rapid urbanization period according to this standard. Main roads connect citywide functional zones and secondary main roads connect smaller areas. This enables retailing centers at different levels to be identified efficiently. When setting the search radius at 1,000 m according to the standard interval of main roads, high-level retailing centers can be effectively recognized, and when setting the radius at 500 m according to the standard interval of secondary roads, lower-level retailing centers can be identified.
First, the search radius for kernel density estimation was set as 1,000 m and the raster unit as 50 m to analyze destination points of the GPS trajectory data on May 2 (Figure 5). The results show that there were two obvious destination points’ clusters, namely, Beijing Road and Tianhe. In addition, the clusters located at Huanshidong and Shangxiajiu were also notable enough to be recognized.
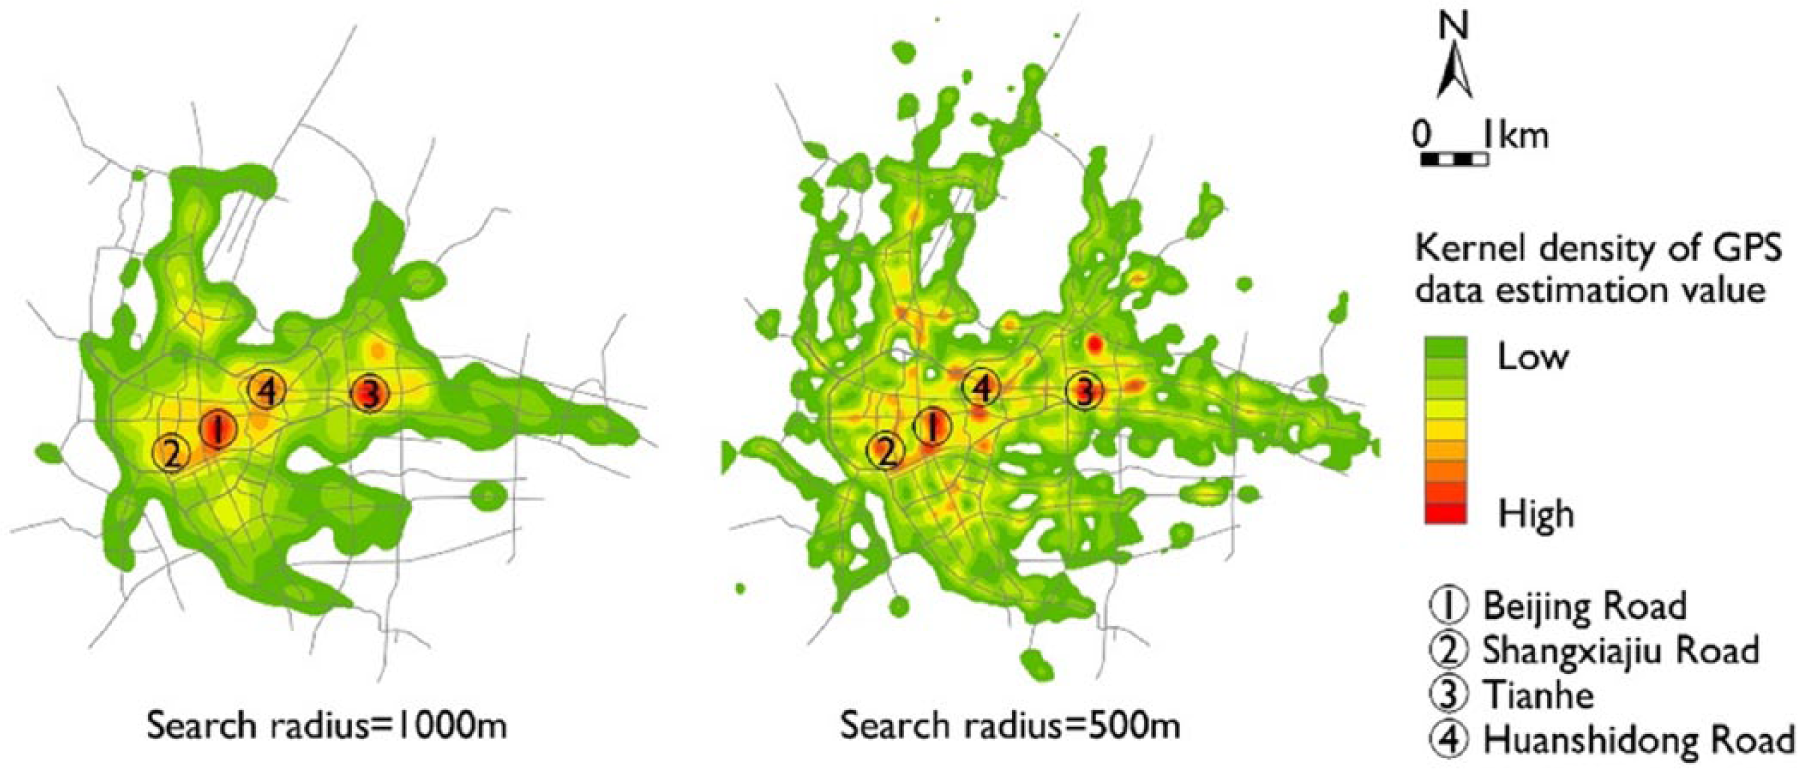
Kernel density estimation of GPS destination points with different search radii (1,000 and 500 m) on May 2, 2009.
Second, the search radius was set as 500 m and the raster unit as 50 m to implement the kernel density estimation again. The results show that the identified hotspots were becoming dispersed and the more accurate locations of hotspot centers could be recognized, which implies that low-level retailing centers can be identified. The results also reflect a certain hierarchical discrepancy of different retailing centers. According to the peak of kernel density, Beijing Road, Tianhe, and Huanshidong are high-level retailing centers and other areas with a lower peak of kernel density are low-level retailing centers.
Delimiting the Retailing Centers’ Boundaries Based on GPS-Enabled Taxi Data
Based on the different traffic characteristics on the relevant roads of each retailing center, we divided the centers into two types of pedestrian retailing centers and main road retailing center.
Using the method of “distribution loop” detection, the boundary of a pedestrian retailing center can be identified by expanding the distribution loop to include its neighboring roads. For some types of retailing centers like Beijing Road, traffic control systems similar to a “distribution loop” around these retailing centers already exist; therefore, the above-mentioned method is effective enough to identify their boundaries.
In Figure 6A, the core area of Beijing Road is located in the peak region of kernel density, namely, the area lying south of Zhongshan Four Road, north of Xihu Road, west of Beijing Road, and east of Damazhan Road. Because this area is mainly within the pedestrian street part of Beijing Road, vehicles cannot access it. Therefore, the peak of GPS clusters are outside the area, and the exact locations are Zhongshan Four Road and Xihu Road. A larger overview identifies a “distribution loop” from Zhongshan Road to Danan Road outside the Beijing Road. Accordingly, Guangwei Road–Zhongshan Four Road is identified as the northern boundary of the Beijing Road retailing center, while Danan Road is the southern boundary, Qiyi Road the western boundary, and Wende Road the eastern boundary.
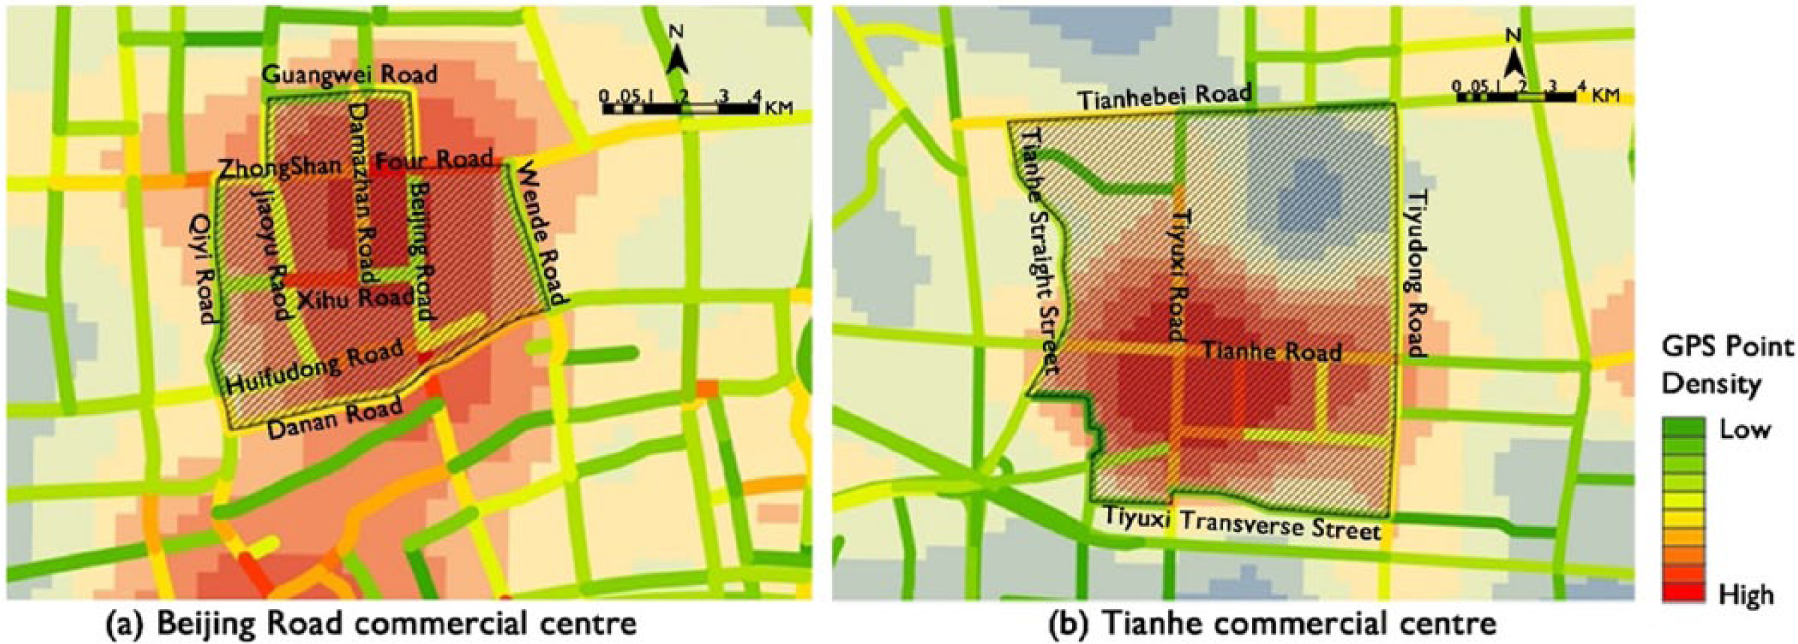
The GPS destination points density and the boundary identification of Beijing Road retailing center and Tianhe retailing center.
Differing from the Beijing Road retailing center, Tianhe retailing center mainly comprises integrated shopping malls along the main roads and has no outdoor pedestrian streets. There is no “distribution loop” at the periphery. However, GPS destination point density on the main roads (Tianhe Road and Tiyuxi Road) attenuates from the core area of the retailing center to the periphery. Based on the attenuation of GPS destination point density and the integrity of the district, the northern boundary of the Tianhe retailing center is the Tianhebei Road and the southern boundary is the Tiyuxi Transverse Street. The western boundary is the Tianhe Straight Street and the eastern boundary is the Tiyudong Road (Figure 6B).
Because pedestrian street retailing centers and main road retailing centers have strikingly different peripheral traffic organization, this study delimited the 15 retailing centers in Guangzhou and divided them into two types (see Figure 7).
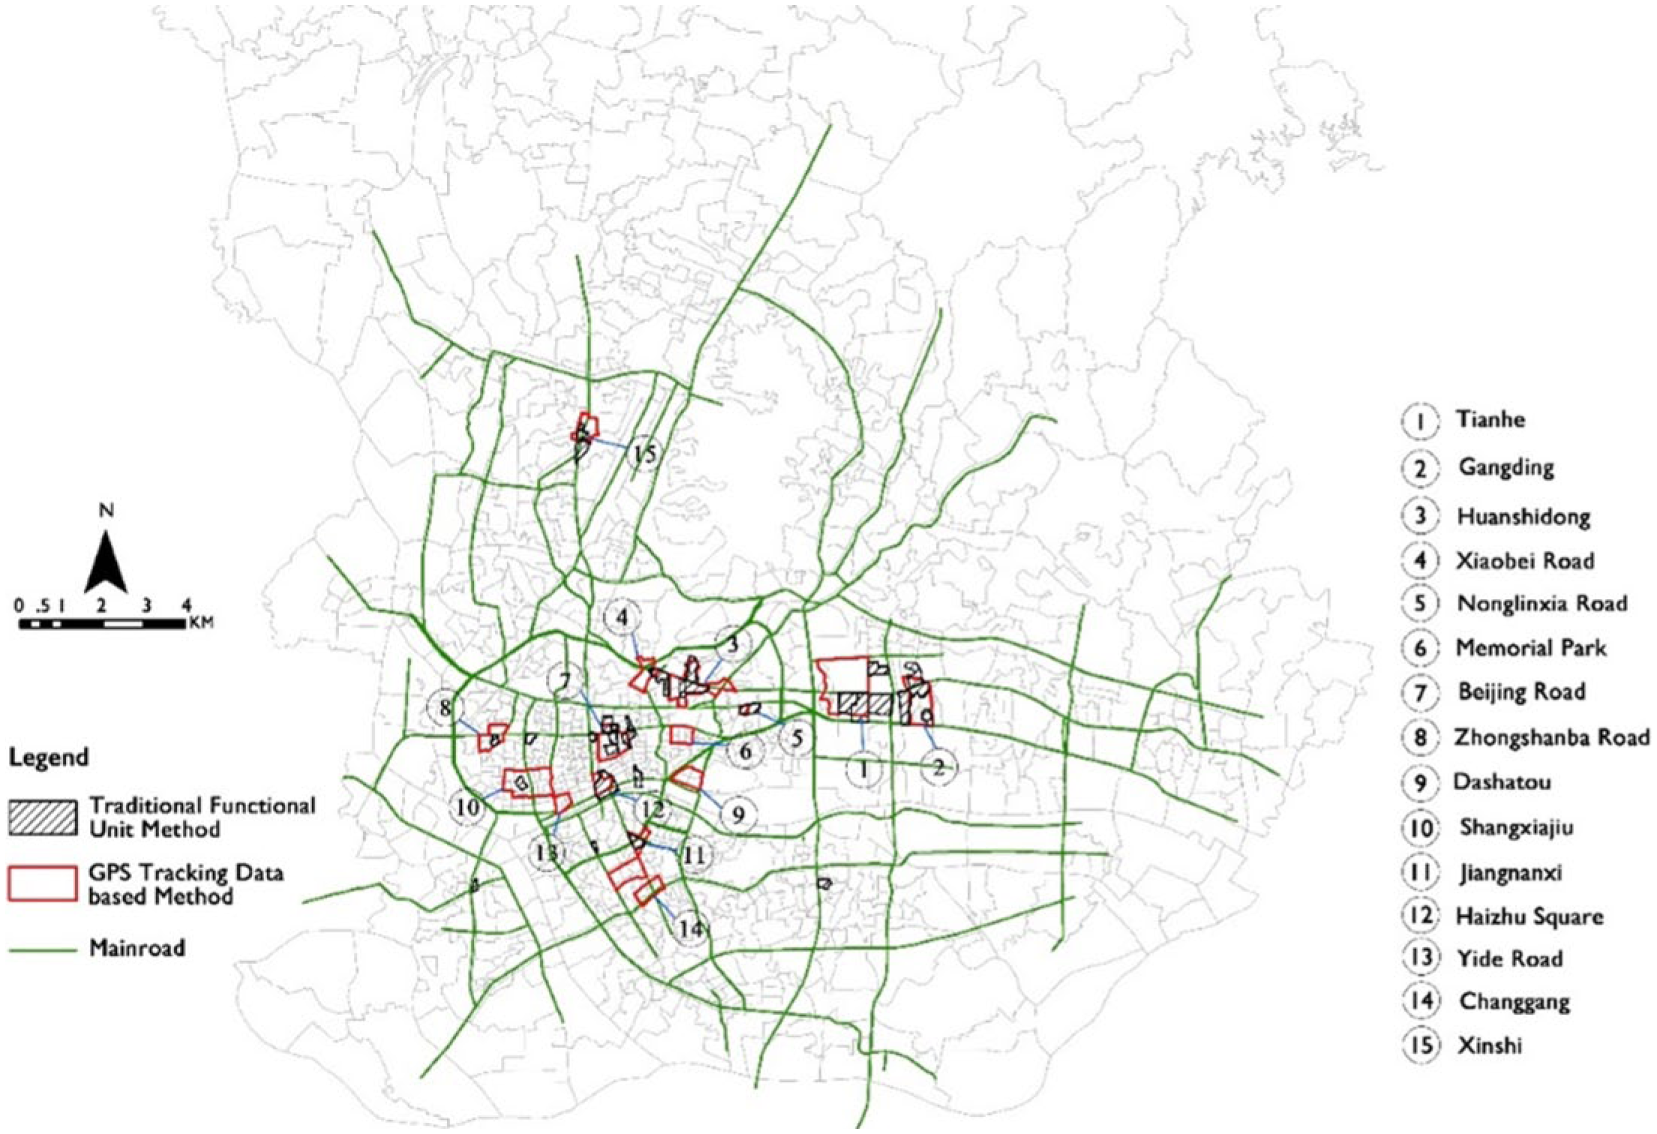
Results of the GPS-enabled taxi data–based method and the traditional functional unit method based on economic census data.
To summarize, the characteristics of pedestrian street retailing centers is as follows. The peak of GPS destination point density appears on the periphery of clusters, around the area of the retailing center. The main roads next to pedestrian streets are the main evacuation routes, which form the “distribution loop” on the periphery of retailing centers. Therefore, the “distribution loop” forms the boundary of retailing centers.
The characteristics of retailing centers along main roads are as follows. The peak of GPS destination point density coincides with the peak of the kernel density estimation results, representing the core area of retailing centers. The main roads passing through this area are the main evacuation routes, and the “distribution loop” on the periphery is not obvious. The boundary of these retailing centers is mainly identified based on the attenuation of the GPS destination point density on the main roads.
Comparison of the Results Based on GPS-Enabled Taxi Data and Economic Census Data
By comparing the two results for retailing centers as well as boundary identification, a high correlation between these two methods was found (Table 1). Eleven of the 15 retailing centers identified by the GPS-enabled taxi data method were also successfully identified by the traditional functional unit method. Thus, using GPS-enabled taxi data to identify retailing centers is effective and convincing to a large extent, and it is reliable to use the KDE method as an analytic model in taxis’ GPS-enabled taxi data application. Active commercial activities were found in the four retailing centers that were missed by the traditional identification method. For example, Yide Road is a wholesale commercial street with more than a hundred-year-old history. Changgang Road is a community retailing center serving the university and community nearby. Hence, GPS-enabled taxi data is more effective in identifying small commercial activities and for not missing retailing centers.
Consistency Analysis of the Results Using the Two Types of Data.
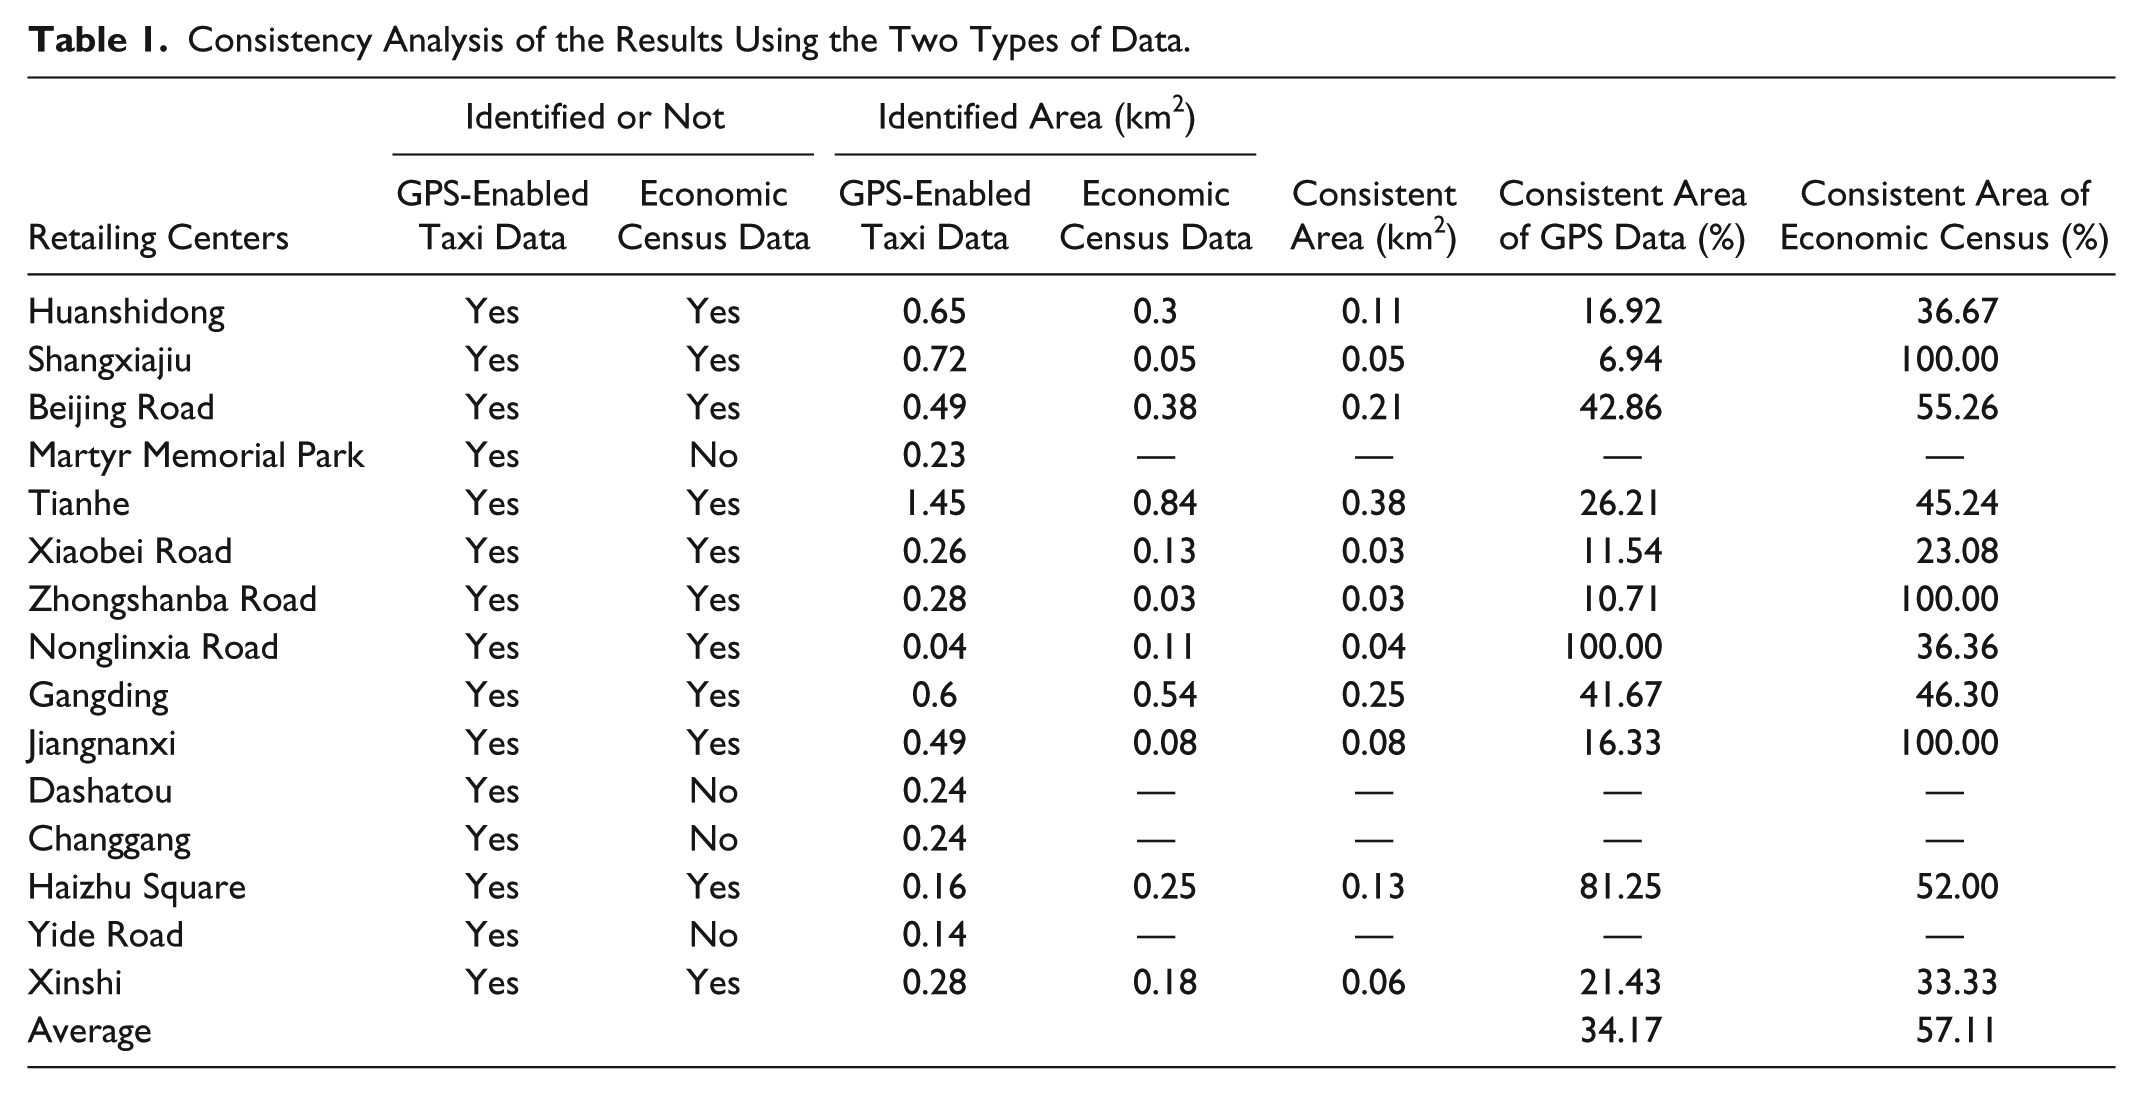
The area of each identified retailing center based on the GPS-enabled taxi data was larger than that identified by using the traditional functional unit method. The overlay area accounts for 34.17 percent of the total area based on the GPS-enabled taxi data, and accounts for 57.11 percent of the total area based on the traditional functional unit method. The area classified by the two methods differs because the boundary based on the traditional method is formed from the administrative boundary of the community, which is influenced, more or less, by government policy. In comparison, the boundary identified by the GPS-enabled taxi data is more accurate because it mainly relies on consumer behavior, which excludes the political element.
Hierarchical Characteristics of Retailing Centers
Based on the identified retailing centers and their boundaries, the retailing center hierarchy in Guangzhou was first analyzed using economic census data. Second, the traffic attraction features of different retailing centers were also analyzed using traffic volume, travel distance, and travel time, to explore if the hierarchy existed simultaneously.
Exploring Retailing Hierarchy Characteristics Based on Economic Census Data
Multiple measures are used to explore retailing hierarchy characteristics from the aspects of scale and function, and the most common factor is total sale and function diversity (Carruthers 1967; Davies 1970; Wu and Dai 2001). However, some geographers indicate that multipurpose shopping and function diversity contributes more in high-class retailing centers than low-class retailing centers, so its accuracy in calculating hierarchical structure is doubtful (Kohsaka 1984). Therefore, this article analyzes retailing structure from the viewpoint of total scale, by calculating the annual revenue. The annual revenue data in the economic census is at the community level and includes multiple industries such as retailing, entertainment, and other service industries. Based on boundary identification of retailing centers, the annual retailing revenue of communities that belong to one retailing center are summarized as the total annual revenue of the retailing center. Furthermore, by counting the mean and quartile of total annual revenue, the retailing centers are divided into city-level and district-level based on the third quartile.
The results show that Tianhe and Beijing Road are two of the top retailing centers, with annual revenue of 9,635 million yuan and 8,247 million yuan, respectively. The third quartile of these retailing centers is 5,522 million yuan so that Tianhe, Beijing Road, Xinshi, and Huanshidong are identified as the retailing centers at the city level, while other retailing centers are defined as district level. Compared to other retailing centers, the annual revenue of these four centers is almost two times higher than others. For example, the annual revenue of Haizhu Square, the fifth highest retailing center, is only 3,091 million yuan.
Exploring Retailing Center Hierarchy Characteristics Based on GPS-Enabled Taxi Data
This article analyzed the hierarchical characteristics of retailing centers from the aspect of trip summation, travel distance, and travel time.
First, statistics of the destination points of trips extracted from GPS-enabled taxi data show that the trip summation of retailing centers is hierarchical and is in accordance with the retailing center hierarchy system based on the economic census data. The trip summation can be divided into three levels: Tianhe is at the first level with peak trip summation. Huanshidong, Beijing Road, and Shangxiajiu are also at the first level. The trip summation of these four retailing centers is more than five thousand times per day. Jiangnanxi and Gangding are at the second level and their daily trip summation is about four thousand times per day, which is much less than that of the retailing centers at the first level. The rest of the nine retailing centers are at the third level, with a daily trip summation of less than three thousand times. For most retailing centers, the daily trip summation is about two thousand times.
Second, the frequency of trips was counted by analyzing the trip summation to retailing centers every 500 m. Then, a comparison of the travel distance distribution of all trips was undertaken using average travel distance, furthest travel distance, and attenuation of travel distance.
The average travel distances of all the trips to retailing centers were mostly from 2.7 to 3.7 km. Xinshi has the furthest travel distance, while the average travel distances of Tianhe, Gangding, Shangxiajiu, Huanshidong, and Beijing Road were all more than 3 km. According to the analysis above, the average travel distance index mainly reflects the taxi’s travel distance, which is most likely restricted by the travel mode.
The furthest travel distance has an obvious hierarchy. Tianhe had the furthest travel distance of 14 km, followed by Shangxiajiu, Gangding, and Beijing Road, with the furthest distance of 12 km. Xinshi and Huanshidong were at the third level, with the furthest distance of 10.5 km.
How trip frequency changed with travel distance to establish a fitting function was analyzed. The result shows that the exponential function has a high degree of fit with an R² of more than 95 percent. The formula is as follows:

where y is the trip frequency to retailing centers, x is the travel distance, and a and b are coefficients. To better explain the characteristics of this formula, the exponential function was modified using a logarithm. Thus, the function was changed into a linear equation. Its formula is as below:

In the formula, b is the slope factor, and a is the intercept factor.
As can be seen from Figure 8, trip frequency attenuates with travel distance. There is a large difference in the intercept factor, which has a significant impact on the curve’s shape. Retailing centers with a larger trip summation have a higher trip frequency and further travel distance, thus forming a larger radius or range. Among the 15 identified retailing centers, Tianhe, Huanshidong, and Beijing Road were the top three. However, the attenuation of retailing centers’ attractions is similar as both lines are nearly parallel. That might be because the relatively high taxi price restricts passengers’ travel distance. Although people are always willing to pay more for transport to more expensive shopping destinations, the results show little difference.
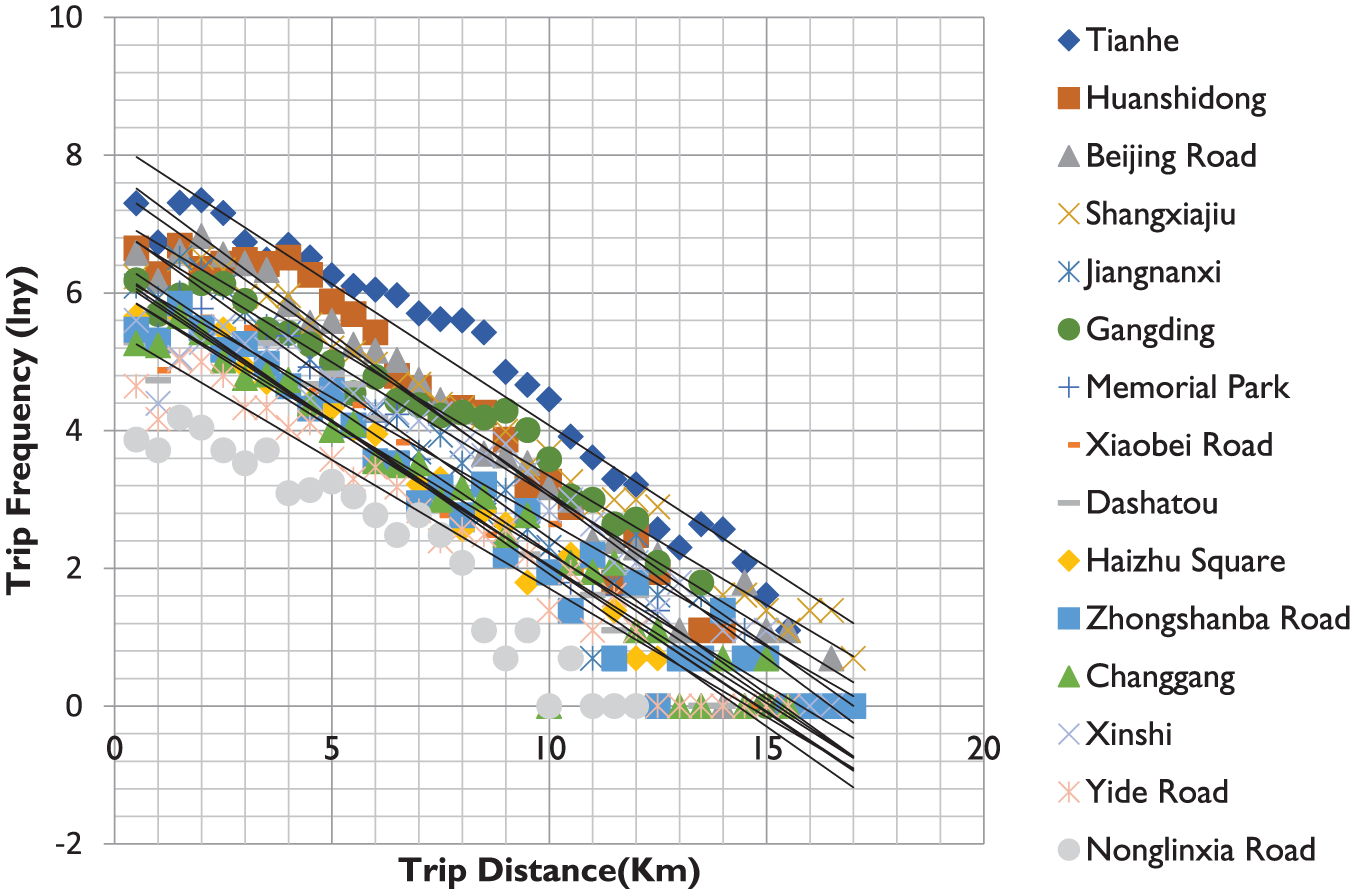
Fitting function of how trip frequency changes with travel distance.
In comparison, the hierarchical characteristic of retailing centers is more apparent from the perspective of trip summation rather than from travel distance, particularly average travel distance. That may be because, along with the increase in travel distance and travel time, the means of transport always change as well (Sheffy 1985). Consumers tend to choose bikes or walk to a nearer distance and use the subway at a further distance. The group choosing a taxi or car is likely to be travelling in a certain range of travel distance. Therefore, although the hierarchy of retailing centers differ, the average travel distance and the attraction attenuations are quite similar in this study based on GPS-enabled taxi data.
Finally, trip summations varying with time were counted by the trip summation to retailing centers every hour based on the arrival time of the taxis. Because the share of trip summation between 0:00 and 7:00 is fairly low (Tong, Xiang, and Zhu 2012), this article chose to summarize trip summation from 7:00 to 24:00 and then the normalization processing was carried out.
Trip summation varying with time
The variation of trip summation during 7:00–24:00 had a regular pattern in all the retailing centers (Figure 9). There were five peak travel periods from 10:00 to 11:00, 13:00 to 15:00, 17:00 to 18:00, 19:00 to 21:00, and 22:00 to 23:00, which means most people visited retailing centers in these periods. Trip summation during 10:00–11:00 in the morning was usually low, while it varied with the characteristics of retailing centers in the afternoon and at night.

Trip summation varying with time.
Hierarchical characteristics of peak travel periods
The peak trip volume of Tianhe, Shangxiajiu, Beijing Road, Memorial Park, and Dashatou was from 13:00 to 18:00 in the afternoon and there was an obvious decrease at night. Among the above, Tianhe, Beijing Road, and Shangxiajiu commercial areas had higher trip volumes at night compared to during 7:00 and 13:00 in the morning, while the trip volume of Memorial Park and Dashatou at night was almost the same as the trip volume in the morning (Figure 9A). However, other retailing centers’ trip volumes at night were either higher than, or the same as, that in the afternoon (Figure 9B).
One possible conjecture based on the results is that the variation in trip summations is relevant to the hierarchical characteristics of commercial areas. For higher-level retailing centers, trip volume at night is less than that in the afternoon because of a larger attraction scope and longer travel distance. For low-level retailing centers, the peak of trip volumes at night or in the morning mainly results from the residents’ before and after outdoor activities. This kind of retailing center is found in residential areas and is convenient for shopping because of short travel distances. Hence, Beijing Road, Tianhe, and Shangxiajiu are identified as being in the first class through the analysis of the hierarchical characteristics of peak travel periods.
Generally speaking, the article has determined the hierarchy system through the overall consideration of trip summation, average travel distance, furthest travel distance, attenuation of travel distance, and the temporal variation of trip summation. Tianhe, Beijing Road, and Shangxiajiu gain the top rank in both trip summation and travel distance. Furthermore, their trip summation variance with time is similar to high-level retailing centers. Thus, in the hierarchy system based on taxis’ GPS trajectory data, these three retailing centers are classified as “city level.”
Comparison of the Results Based on GPS-enabled Taxi Data and Economic Census Data
Among all the retailing centers, Tianhe and Beijing Road are undoubtedly the two top retailing centers that have been identified by two types of data (Table 2). Beijing Road has been the “downtown” of urban Guangzhou for more than one thousand years. Tianhe developed rapidly because of political and financial support from local government in the twentieth century. This result is confirmed by the point of interest (POI) data of Guangzhou (Chen 2016). It is obvious that Tianhe and Beijing Road are two important cores of Guangzhou and, hence, a dual core structure exists in urban Guangzhou. Another retailing center that ranks highly in the economic census data is Huanshidong, which was also identified by trip summation and furthest travel distance statistics. However, its various trip summation data differed from that of common retailing centers at the city level. That may be because the Huanshidong retailing center serves both long-distance consumers and communities nearby. Generally speaking, results based on the economic census and GPS-enabled taxi data were similar to a large extent. Thus, it can be said that taxi GPS tracking data is reliable to a certain degree in identifying a retailing hierarchical system.
Retailing Hierarchical Structure Based on Two Methods.
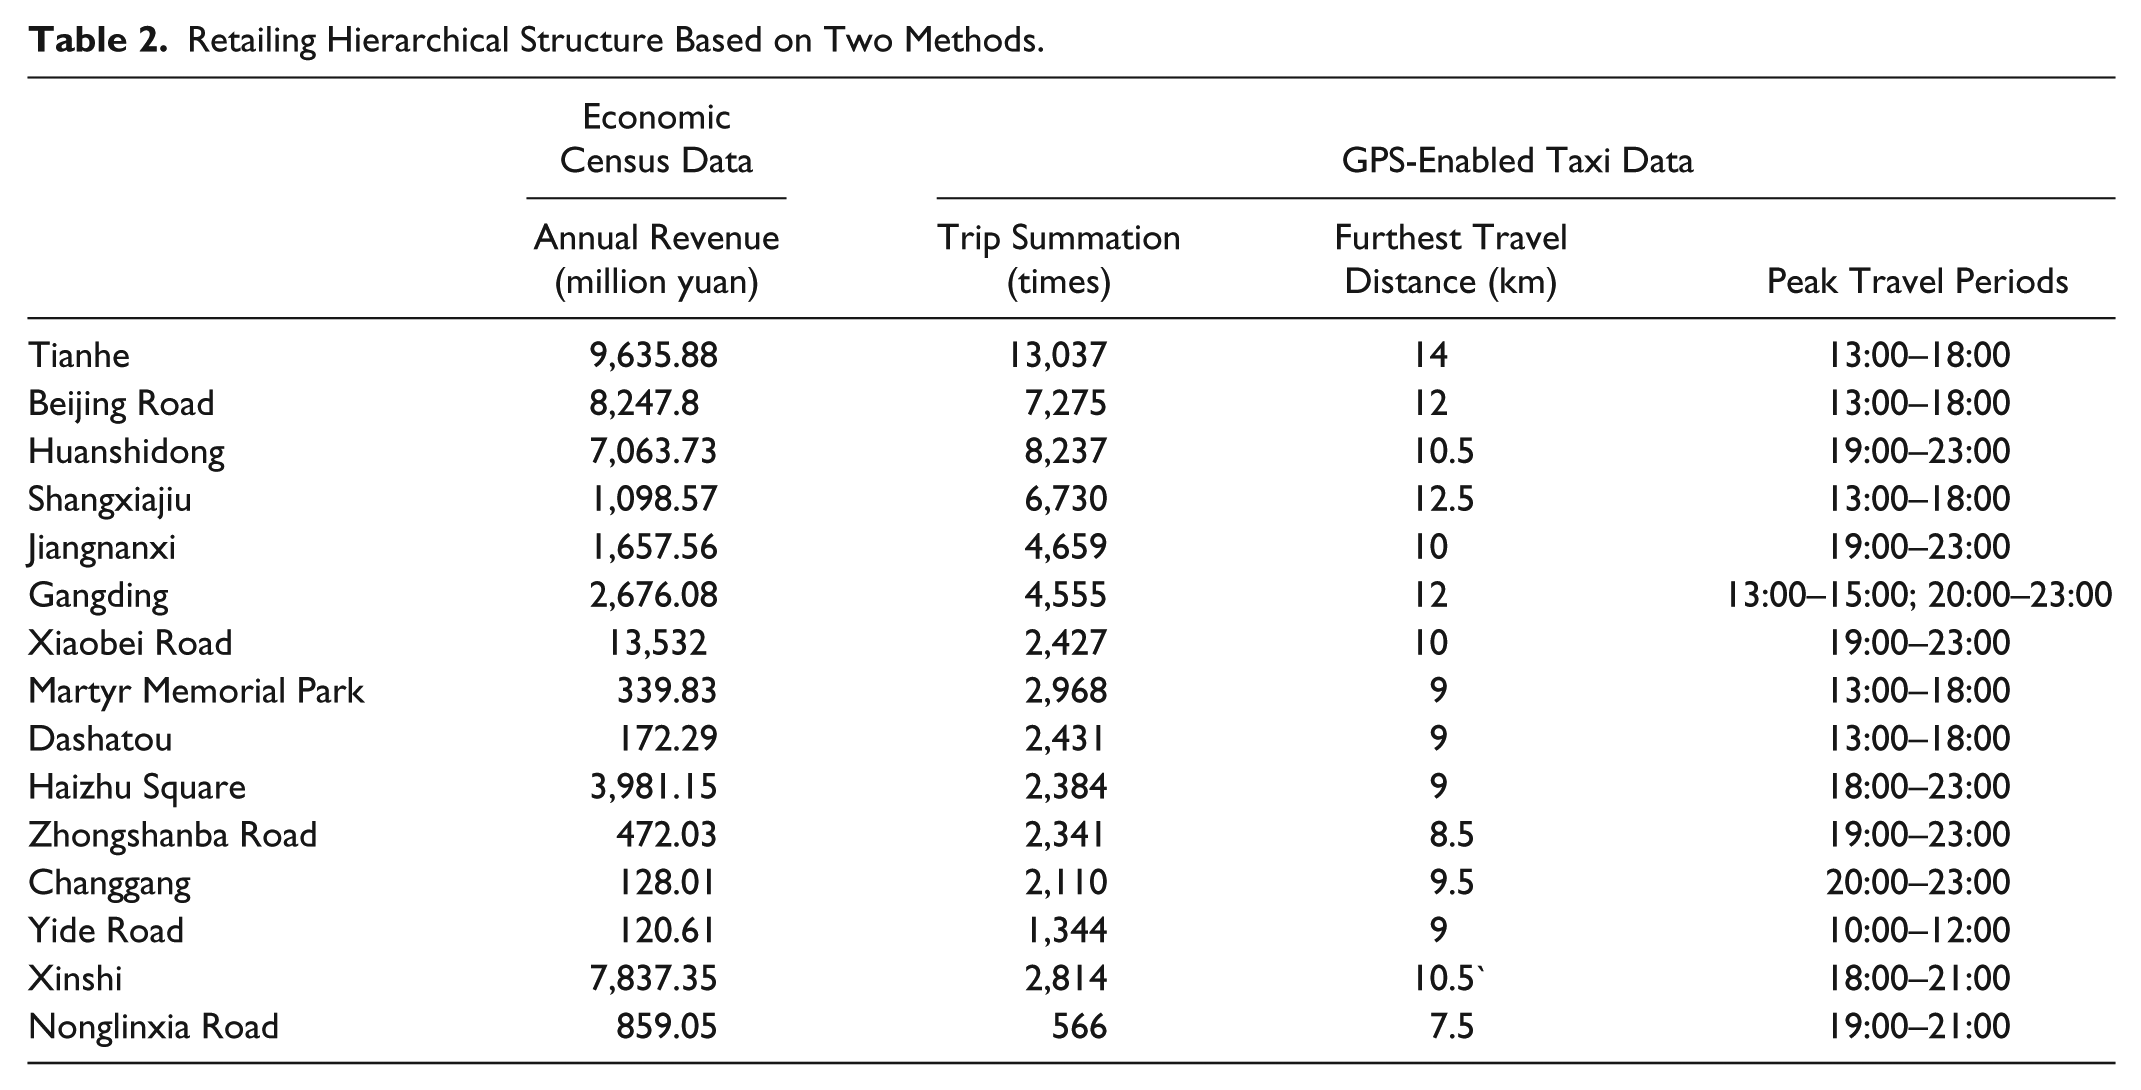
There are also some exceptions. For example, Shangxiajiu is a high-grade retailing center based on GPS-enabled taxi data, but not based on economic census data: this may be caused by the low-end commercial pattern in Shangxiajiu. As a historic retailing center, Shangxiajiu did not upgrade its commerce like Beijing Road. Nowadays, Shangxiajiu is famous for its historic architecture, typical food, and traditional culture instead of its shopping function. Most people tend to go there for leisure activities more so than for shopping. Therefore, although GPS-enabled taxi data shows customers’ preferences in visiting Shangxiajiu, its commercial activities are actually no longer prosperous. Thus taxi GPS tracking data has its limitations in grading retailing centers when special customers’ preferences occur around commercial activities. What is also remarkable is that the travel distance of Xinshi is notably high, inconsistent with the results based on trip summation, travel time, and economic census data. One possible explanation is that Xinshi retailing center is much further from the core area of Guangzhou than other retailing centers. The low intensity of land use and urban construction means a longer average distance between the residential district and commercial area and a lower density of underground stations. Because of this, customers prefer using taxis rather than underground stations or walking.
Conclusion and Discussion
This article has used the KDE method to delimit two different types of retailing centers in Guangzhou. Based on the model, the hierarchical characteristics of retailing centers were calculated using the three factors of trip summation, travel time, and travel distance.
The identification of retailing centers boundaries based on two methods (GPS taxi data and economic census data) indicates that GPS data can identify retailing centers effectively. Comparing the three indicators used in the hierarchy calculation, trip summation can best reflect the hierarchical characteristics of retailing centers, while travel distance seems not so effective.
The urban retail hierarchical structure is found in Guangzhou. Among fifteen identified retailing centers, Tianhe, Beijing Road, and Huanshidong are classified as city-level, while other retailing centers are classified as district-level. These retailing centers serve surrounding areas to a different extent. The three city-level retailing centers identified in this article are all in the central area of Guangzhou, which reveals the centrality of Guangzhou and proves that the attraction of certain central places still exists.
As a global city, although urban mobility and dispersion has increased rapidly, the centralization effect of the central area is more significant than the diffusion effect in Guangzhou. The reasons are as follows. First, the phenomenon of regional urbanization and extensive suburbanization may not have occurred in Chinese cities, as urban residents still tend to aggregate in the central urban area. Second, the diffusion of urban functions mainly reflects residential and industrial factors, but not retailing, entertainment, and business factors. People in Guangzhou live more and more suburban lives while competitive industrial subcenters arise. However, many public service and retailing facilities still remain in the central urban area, adding to its attractiveness.
From the perspective of big data application, the research presented in this article proves that analysis based on GPS-enabled taxi data is reliable in most cases as demonstrated through the examination of economic census data. The GPS tracking data can effectively reflect patterns of consumers’ travel behavior when shopping. However, some biases still exist in the classification of an urban hierarchical system. That is, because of the impact of political and social factors, such as density of land use, customers’ preferences cannot be ignored. Overall, GPS data is easier to access than economic census data and it also contributes to the study of dynamic urban structures through their real-time reflection of retailing centers. This article supplements the current research from the consumption side and solves the most important problem of data deficiency when examining complex traffic movements around retailing centers.
A limitation of the research was that only the GPS data of taxis was used. Passengers travelling by bus, subway, and other transportation means were not considered. This kind of bias may not be evident when delimiting one retailing center’s boundary. But when analyzing the relation between retailing centers, the bias is difficult to ignore. Therefore, we can only explain consumers’ shopping trip behavior for the proportion of the population who use taxis, instead of travel characteristics that encompass the whole of the retailing center system. With GPS tracking data from multiple sources in the future, the results could better reflect the characteristics of retailing centers and urban spatial structure.
Footnotes
Declaration of Conflicting Interests
The authors declared no potential conflicts of interest with respect to the research, authorship, and/or publication of this article.
Funding
The authors disclosed receipt of the following financial support for the research, authorship, and/or publication of this article: This research was supported by National Natural Science Foundation of China (41522104,41531178), and Natural Science Foundation of Guangdong, China (2017A030313228, 2014A030312010).