
Abstract
Out-of-vehicle time is a well-known major burden of transit travel. Although transit stations’ characteristics likely affect people’s perceptions of out-of-vehicle time and decisions to use public transit, our understanding of how transit users evaluate stations is limited. This study uses reviews of Los Angeles Metro Rail stations from Yelp.com to conduct descriptive analyses of stations’ numeric ratings and to identify the factors users consider important based on content analyses. It also explores spatial and temporal variations in the ratings and factors frequently considered by users, demonstrating how social media content can be used to inform transportation planning.
Introduction
Information and communications technologies (ICTs) increasingly inform people’s travel-related decisions (Bou Mjahed et al. 2017). In addition to using real-time transit arrival and traffic information, many people rely on social media and online reviews when making travel-related decisions, considering such user-generated content more trustworthy and genuine than other information sources (Gretzel and Yoo 2008). However, despite the increasing popularity and impacts on people’s travel behavior of social media, only a few transportation studies have focused on this topic (Bou Mjahed et al. 2017; Mondschein 2015; Schweitzer 2014).
This study aims to fill this gap by examining social media content regarding the users’ evaluations of transportation systems. It uses data from online reviews of Los Angeles Metro Rail stations posted on Yelp—one of the most popular business and public service review websites. By analyzing more than 830 online reviews for fifty-four stations posted between 2007 and 2015, the study aims to measure the perceived quality of metro stations and identify which station attributes influence user ratings. Using the Jaccard index, it also analyzes the details of user complaints about rail stations and offers specific guidelines about how to address them.
Although scholars and practitioners have devoted substantial efforts to evaluating transit service quality, they mainly focus on measuring and monitoring the quality of transit networks and in-vehicle service, rather than the quality of transit stations or stops (Eboli and Mazzulla 2008; Verbich and El-Geneidy 2016). However, transit riders spend a considerable amount of time waiting for trains and transferring (Boarnet et al. 2017), so it is important to understand how they evaluate stations. Whereas most past studies use a cross-sectional research design and focus only on a limited number of stations, this study explores both spatial and temporal variations in ratings and the factors users consider important.
In addition to filling important gaps in the literature, this study demonstrates the potential of social media as a useful data source in transportation planning. Gathering user-generated content from social media is much less expensive than conducting traditional user satisfaction surveys. Online reviews also provide up-to-date information from a wider range of transit users. Therefore, this study urges planners to consider how to more effectively use social media information and encourage more users to publish online reviews of transportation systems.
Literature Review
It is important for planners and transit agencies to measure transit service quality and understand how users evaluate services, as these are essential steps in identifying how to improve transit user experience. Therefore, scholars have conducted extensive research on users’ evaluation of transit services (Dell’Olio, Ibeas, and Cecin 2011; Eboli and Mazzulla 2008; Verbich and El-Geneidy 2016). However, most of these studies examine the quality of on-board services (e.g., safety on board) or user satisfaction with transit networks (e.g., reliability, frequency), giving less attention to the features of transit stops/stations and surrounding neighborhoods. Consequently, only a few studies investigate the attributes of transit stations in a comprehensive way.
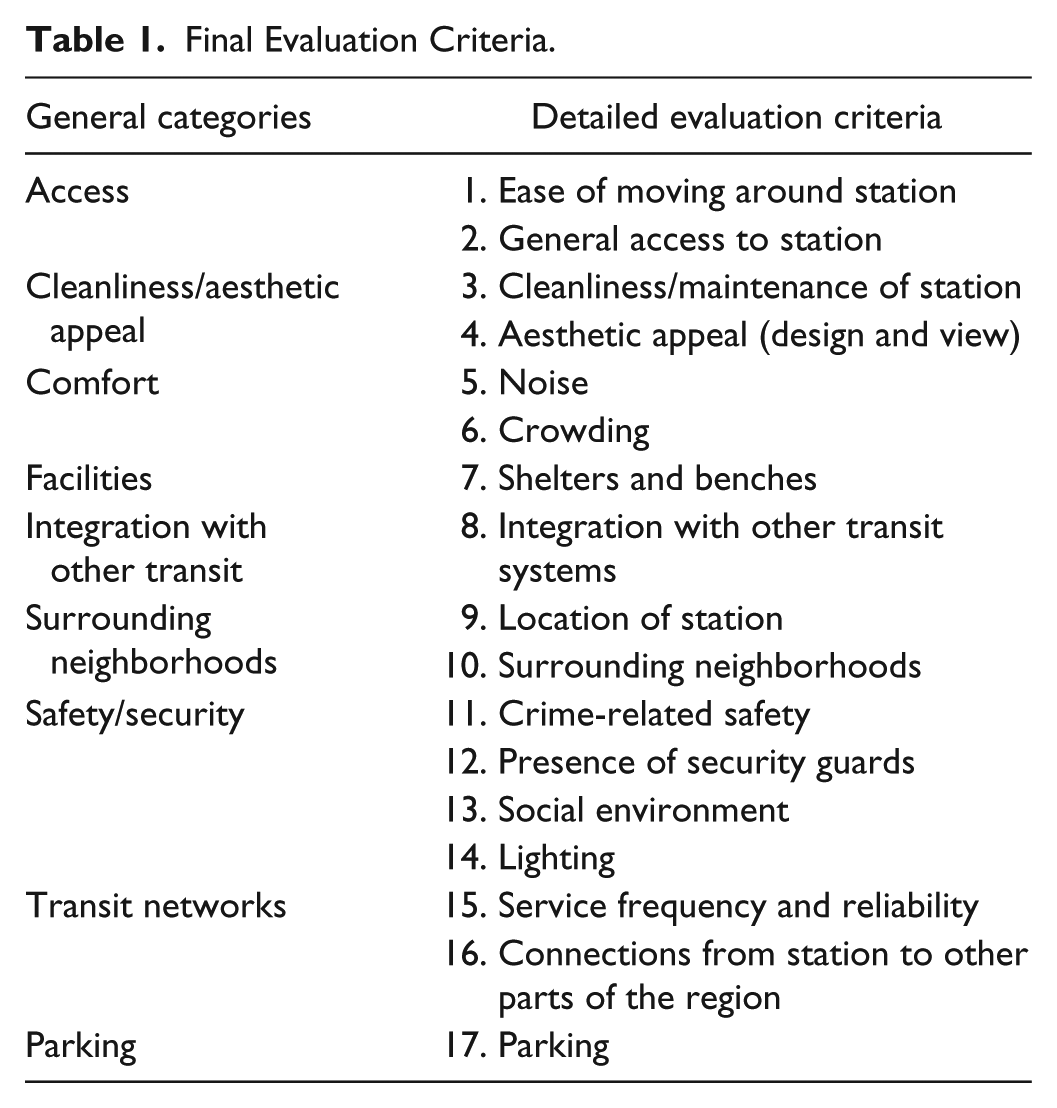
Prior studies find that the overall evaluation of transit services or stations is influenced by a wide range of factors (Hernandez, Monzon, and de Oña 2016; Lois, Monzón, and Hernández 2018). The station-level factors examined in these studies can be divided into nine categories: (1) access, (2) cleanliness and aesthetic appeal, (3) comfort, (4) emergency response, (5) facilities, (6) information and staff, (7) integration with other transit systems, (8) surrounding neighborhoods, and (9) safety/security. Most studies find users’ safety/security to be of primary importance, but there is little agreement on the other factors’ relative importance in users’ overall evaluation. Lois, Monzón, and Hernández (2018), for example, report that a station’s information availability and safety/security play dominant roles in predicting users’ general satisfaction levels, while Iseki and Taylor (2010) highlight the relative importance of transit service reliability and safety.
In terms of methodology, the existing literature has two major limitations. First, most prior studies employ user surveys to investigate people’s evaluations of or satisfaction with transit services and so are based on a set of attributes predetermined by researchers. In one of the most common approaches, survey participants are given a list of attributes related to transit service quality and asked to rate their satisfaction with or the relative importance of each (Hernandez, Monzon, and de Oña 2016; Iseki and Taylor 2010). Another common method is stated preference surveys, asking users to select among several hypothetical options to derive the service attributes they consider important (Dell’Olio, Ibeas, and Cecin 2011; Eboli and Mazzulla 2008). However, both approaches leave little room to identify context- or user-specific evaluation criteria.
There are also very few studies on spatial or temporal variations in assessments of transit service quality (Eboli, Forciniti, and Mazzulla 2018). This is partly because most studies are based on one-time survey data collected from a limited number of transit stops/stations. However, service quality is likely to vary across stations/stops in different locations (i.e., neighborhoods), and these differences must be examined to address transportation equity issues. The literature on transport and social exclusion implies that socially disadvantaged areas or population groups are likely to experience poorer transportation service quality (Litman 2003; Lucas 2004). However, empirical evidence on spatial disparities in the quality of transit stops/stations is lacking, as most studies concentrate on disparities in access to jobs and other opportunities (Páez et al. 2010; Scott and Horner 2008; Shin 2018). Moreover, it is unclear how people’s evaluations of transit stations change over time, although they can be influenced by transit stations’ physical deterioration or improvements (by transit agencies or governments).
To bridge these gaps in the literature, this study uses online reviews of LA Metro Rail stations posted on Yelp. Using social media content helps to overcome the aforementioned limitations because online reviews offer unstructured user-generated content, including ratings and narrative reviews of the service quality at each station in the study area at different points in time. Online reviews are used in various fields of study, such as management/marketing and public health, to examine consumers’ perceived service quality (López et al. 2012; Ranard et al. 2016; Ye, Law, and Gu 2009); this study adopts these methodologies to analyze users’ Yelp reviews of rail stations.
Data and Method
Study Context: Los Angeles Rail Systems
Figure 1 shows all Los Angeles’ rail stations (n = 70) in existence over the entire study period (2007–2015). 1 After the LA Metro’s first phase (i.e., the Blue Line) opened in 1990, the other five lines were constructed over a twenty-five-year period. However, despite this considerable investment in rail systems, rail transit ridership in Los Angeles remains low. According to the 2011–2015 American Community Survey Five-Year Estimate, about 84.5 percent of the Los Angeles metro area’s residents commute by car, while less than 1 percent commute by rail—far fewer than in other large metro areas. In 2016, the average weekday ridership of the LA Metro Rail was about 0.36 million (Website of LA Metro 2016).
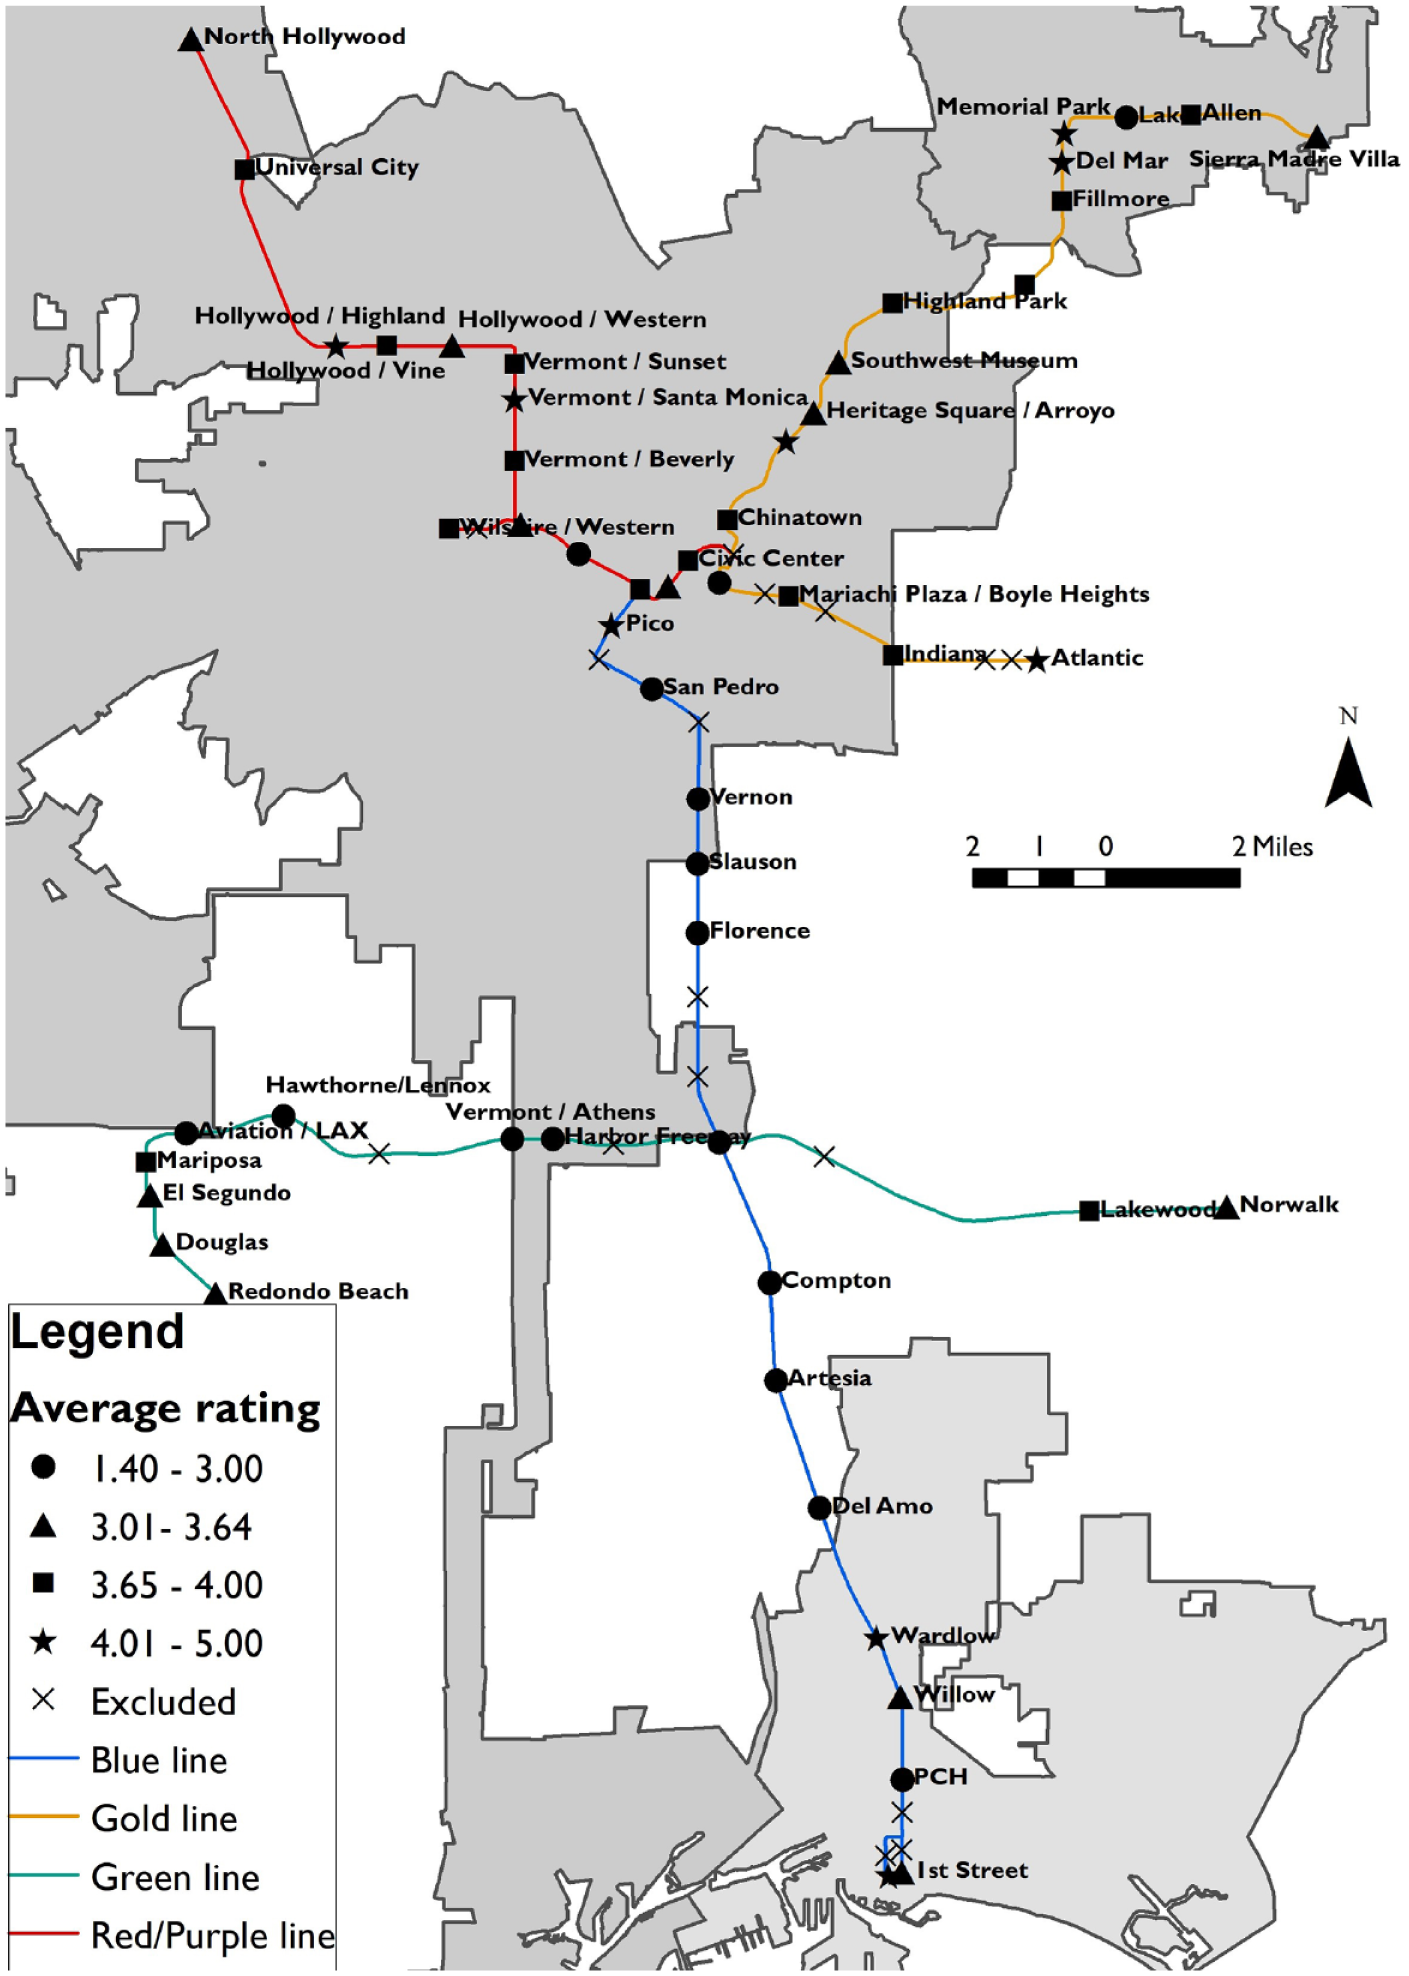
Distribution of rail stations and station-level average ratings (recalculated by author based on the final samples).
Among the most plausible explanations for low ridership is the region’s urban spatial structure: Los Angeles is highly sprawled and auto-oriented compared with other large metro areas (Kawabata and Shen 2006; Schuetz, Giuliano, and Shin 2018). Beyond downtown areas, most LA Metro Rail stations are distant from one another and cover a larger geographic area, making it difficult for many to access them by foot. Therefore, despite the ongoing extension of rail networks, accessibility to both work and non-work destinations remains much more limited by public transit than by car (Kawabata and Shen 2006; Shin 2018).
Moreover, anecdotal evidence and media reports suggest that social stigma is attached to using public transit in Los Angeles (Hess 2012). In other words, the region’s residents may perceive public transit or transit riders more negatively than is the case in East Coast cities, which might discourage Los Angelinos from using transit. While a recent study uses Twitter to demonstrate the stigma associated with public transit (Schweitzer 2014), the study area is not restricted to Los Angeles and it does not differentiate the types of transit. Therefore, rigorous evidence of users’ perceptions of rail transit in Los Angeles remains lacking.
Finally, prior studies document how crime or fear of crime are related to public transit in Los Angeles (Loukaitou-Sideris 1999; Loukaitou-Sideris, Liggett, and Iseki 2002). Studies show that, although transit stops and stations are not specifically less safe than other parts of Los Angeles, there is a great disparity between actual crime rates and public perceptions of transit-related crime (Loukaitou-Sideris 1999). Spears, Houston, and Boarnet (2013) also demonstrate that safety concerns remain a major predictor of transit use in the study area.
Method
Yelp is an online rating platform that allows consumers to post reviews and share their experiences of businesses and public services. For each business/public service, Yelp provides a rounded average rating, along with individual users’ ratings (one to five stars, from least to most favorable) and narrative reviews. To extract all ratings and reviews of LA Metro Rail stations on Yelp.com, I searched for rail stations in the Los Angeles region using several keywords, including “LA Metro,” “rail,” and “rail station.” I then searched for any station not found with the keywords using their individual names. The result was a database of all reviews and ratings for LA Metro Rail stations from August 2007 to December 2015.
I chose Yelp for my study due to its popularity: it receives hundreds of millions of visitors (identified by IP address) per month. It also has several strengths compared with other social media platforms that previous studies investigated. First, whereas Twitter set a 140-character limit per posting during the study period, Yelp set a 5,000-character limit, allowing Yelp reviewers to give much more detailed descriptions explaining and justifying their evaluations. Second, Yelp reviewers provide a star rating (from one to five), so it is straightforward for researchers to ascertain each individual’s overall evaluation. As most reviewers mentioned both positive and negative aspects of the station, determining their overall feelings about a station as a whole is more difficult without individual-level numeric scores. Finally, unlike other social media platforms on which users can choose with whom their postings are shared, all ratings and reviews posted on Yelp are publicly available.
I excluded reviews that are not station-specific (about 16% of total reviews), because they focus on evaluating specific lines (e.g., Red Line), or the LA Metro system as a whole, rather than individual stops. To reduce the influence of outlier reviewers, only metro stations with at least four reviews were included. I also excluded Union Station because it is also served by intercity passenger rails (i.e., Amtrak, Metrolink). As a result, the final sample included 833 reviews on fifty-four LA Metro Rail stations (out of seventy). For each of these stations, I recalculated the average rating based on the final samples (see Figure 1). The number of available reviews varied by station, averaging at around fifteen. 2
I conducted content analyses of narrative reviews using the HyperRESEARCH program. To develop a framework to categorize the factors affecting users’ evaluation of stations, I first listed common factors in the literature. I then developed my own framework by adding attributes (i.e., those missing from previous studies but frequently mentioned in my data) or removing attributes (i.e., those considered in previous studies but not frequently mentioned in my data) from the literature-based list until reaching thematic saturation (Holton 2007; López et al. 2012). 3
The final list comprises nine general categories of evaluation criteria, each of which is further classified into detailed factors (see Table 1). Surprisingly, several factors considered crucial in previous studies, including emergency response and the presence of information and/or staff, were not frequently mentioned and so were omitted from my framework, thus demonstrating the importance of customizing evaluation frameworks. Using this evaluation framework, I then hand-coded all the reviews. For each factor, I also differentiated compliments and complaints, depending on whether or not a factor was mentioned in positive terms.
Final Evaluation Criteria.
To analyze spatial variations in the assessment of rail stations, I joined this dataset with census block group-level data (2011–2015 American Community Survey Five-Year Estimates) based on stations’ locations. I then calculated the area-weighted median household income for each station’s neighborhood (i.e., a half-mile radius from each station). Of the fifty-four stations included in my analyses, about 28 percent are located in low-income neighborhoods. 4
Results
Descriptive Station Rating Statistics
Table 2 reports information on the analyzed reviews. The average rating for individual LA Metro Rail stations was 3.38 stars, or 3.56 stars after weighting by the number of reviews per station. To better show the ratings’ distribution among reviews, the stations’ average percentages of one-star and five-star reviews are included in Table 2. Previous studies analyzing online reviews suggest that distribution of online review numeric ratings is highly polarized—that is, reviewers tend to give one or five stars to businesses (Lafky 2014). However, ratings of LA Metro Rail stations show a much less polarized distribution than Yelp’s overall rating distribution (provided by the Yelp website at https://www.yelp.com/factsheet).
Yelp Ratings of LA Metro Rail Stations, 2007–2015.

The unit of analysis is a station, not a review.
Average station ratings weighted by each station’s frequency of reviews.
p < .1. **p < .05. ***p < .01.
Analyzing the data by station neighborhood type paints a more detailed picture. On average, stations in low-income areas received about half the number of reviews of stations in non-low-income areas and also had a lower rating (statistically significant at the .05 level). This indicates that users’ perceptions of stations’ overall quality are significantly lower for stations in low-income areas. The results also show that these relatively low averages were not driven by extreme reviews: although there were fewer five-star reviews and more one-star reviews of low-income area stations compared with non-low-income area stations, such differences were not statistically significant.
Table 2 also shows changes in ratings over time. The average number of reviews per station increased over time, reflecting the growing popularity of Yelp. Interestingly, the average rating for LA Metro Rail stations included in my analysis also increased, from 3.08 to 3.47, although there were, on average, no significant changes in the average proportions of one- and five-star reviews over time. This trend did not vary by neighborhood type: the average frequency of reviews per station and ratings continued to increase over time in both types of neighborhood. As a result, there was no significant reduction in the average rating difference between low- and non-low-income neighborhoods over time, although the average number of reviews per station increased more rapidly in non-low-income area stations.
Factors Affecting Users’ Evaluation of Stations
Table 3 shows the results of my hand-coding of reviews using the evaluation criteria framework mentioned earlier. To differentiate users’ feelings about a factor’s importance from their satisfaction with that factor, I separately report the ten most frequently mentioned factors for compliments and for complaints, together with the ten factors that most frequently feature in either form of feedback (i.e., combined frequency for complaints and compliments).
Ten Most Commonly Mentioned Factors in Compliments, Complaints, and Both Combined in Yelp Reviews of LA Metro Rail Stations.
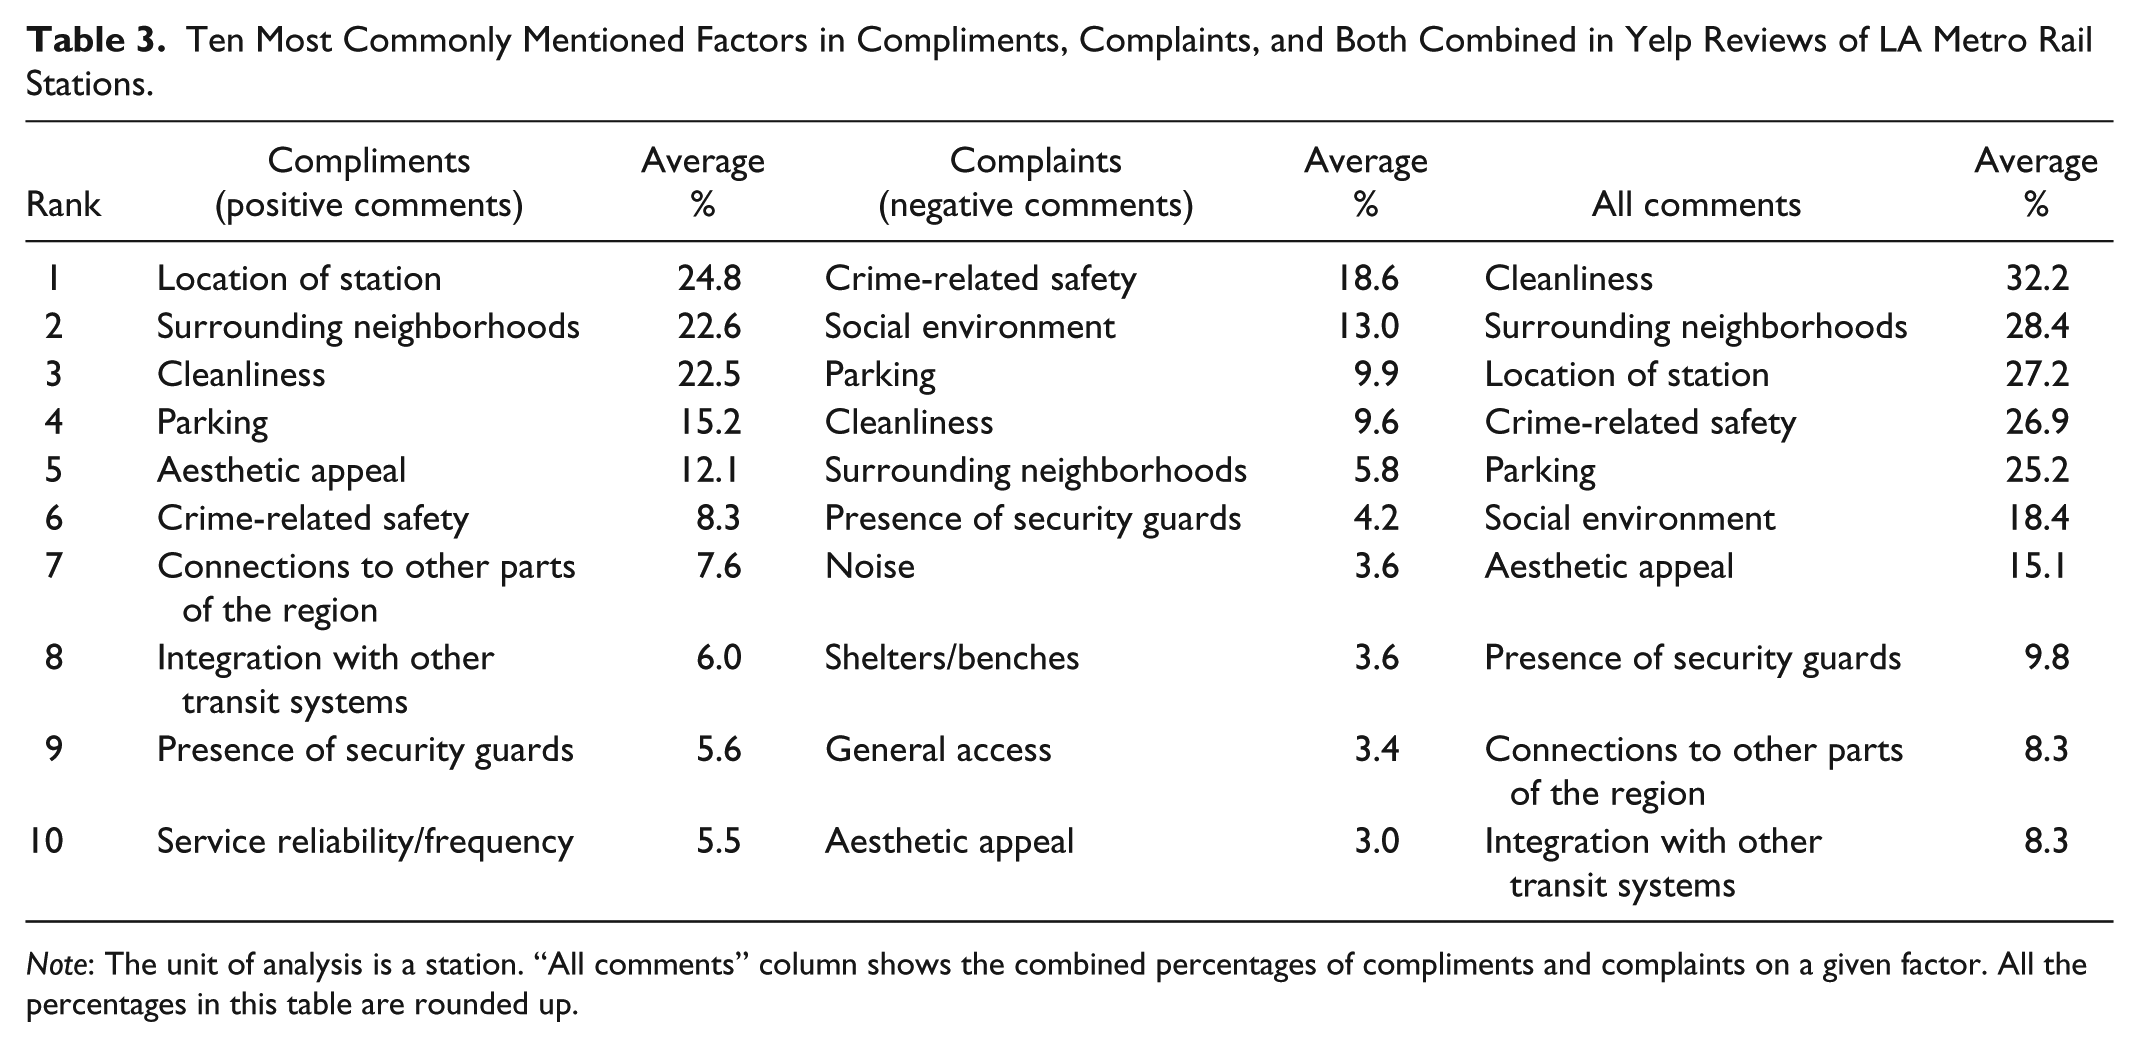
Note: The unit of analysis is a station. “All comments” column shows the combined percentages of compliments and complaints on a given factor. All the percentages in this table are rounded up.
I used the average percentage of reviews mentioning a given factor to find out the importance of each factor to users. 5 In descending order, the most important factors for station users were cleanliness, surrounding neighborhoods, location, crime-related safety, and parking. On average, about one-third of Yelp reviews for each station included a comment on cleanliness; based on my list of most frequently mentioned compliments and complaints, despite the considerable percentage of people who complained about a station’s cleanliness, more users complimented a station based on its sanitary conditions. Parking and surrounding neighborhoods were also among the top five mentioned factors in both compliments and complaints. It is notable that two factors not commonly identified in previous studies—parking and station location—were among the top five most important evaluation criteria according to my results.
Of the ten factors most frequently mentioned in complaints, three were related to safety/security, making this the most common issue. Many reviewers specifically reported on a station’s social environment, and the absence or presence of police contributed to their sense of security. In addition, many users reported dissatisfaction with parking, cleanliness, surrounding neighborhoods, and factors related to station comfort/amenities, including noise, shelters, and aesthetic appeal.
Figure 2 shows the differences in reported evaluation factors between stations located in low-income areas and those located in non-low-income areas. The top ten factors were almost the same regardless of neighborhood type, although there were some differences in the ranking of different factors. For example, by average frequency of mentions, parking was ranked first for non-low-income area stations, but tenth for low-income area stations, whereas crime-related safety was ranked first for low-income area stations but fifth for non-low-income area stations.
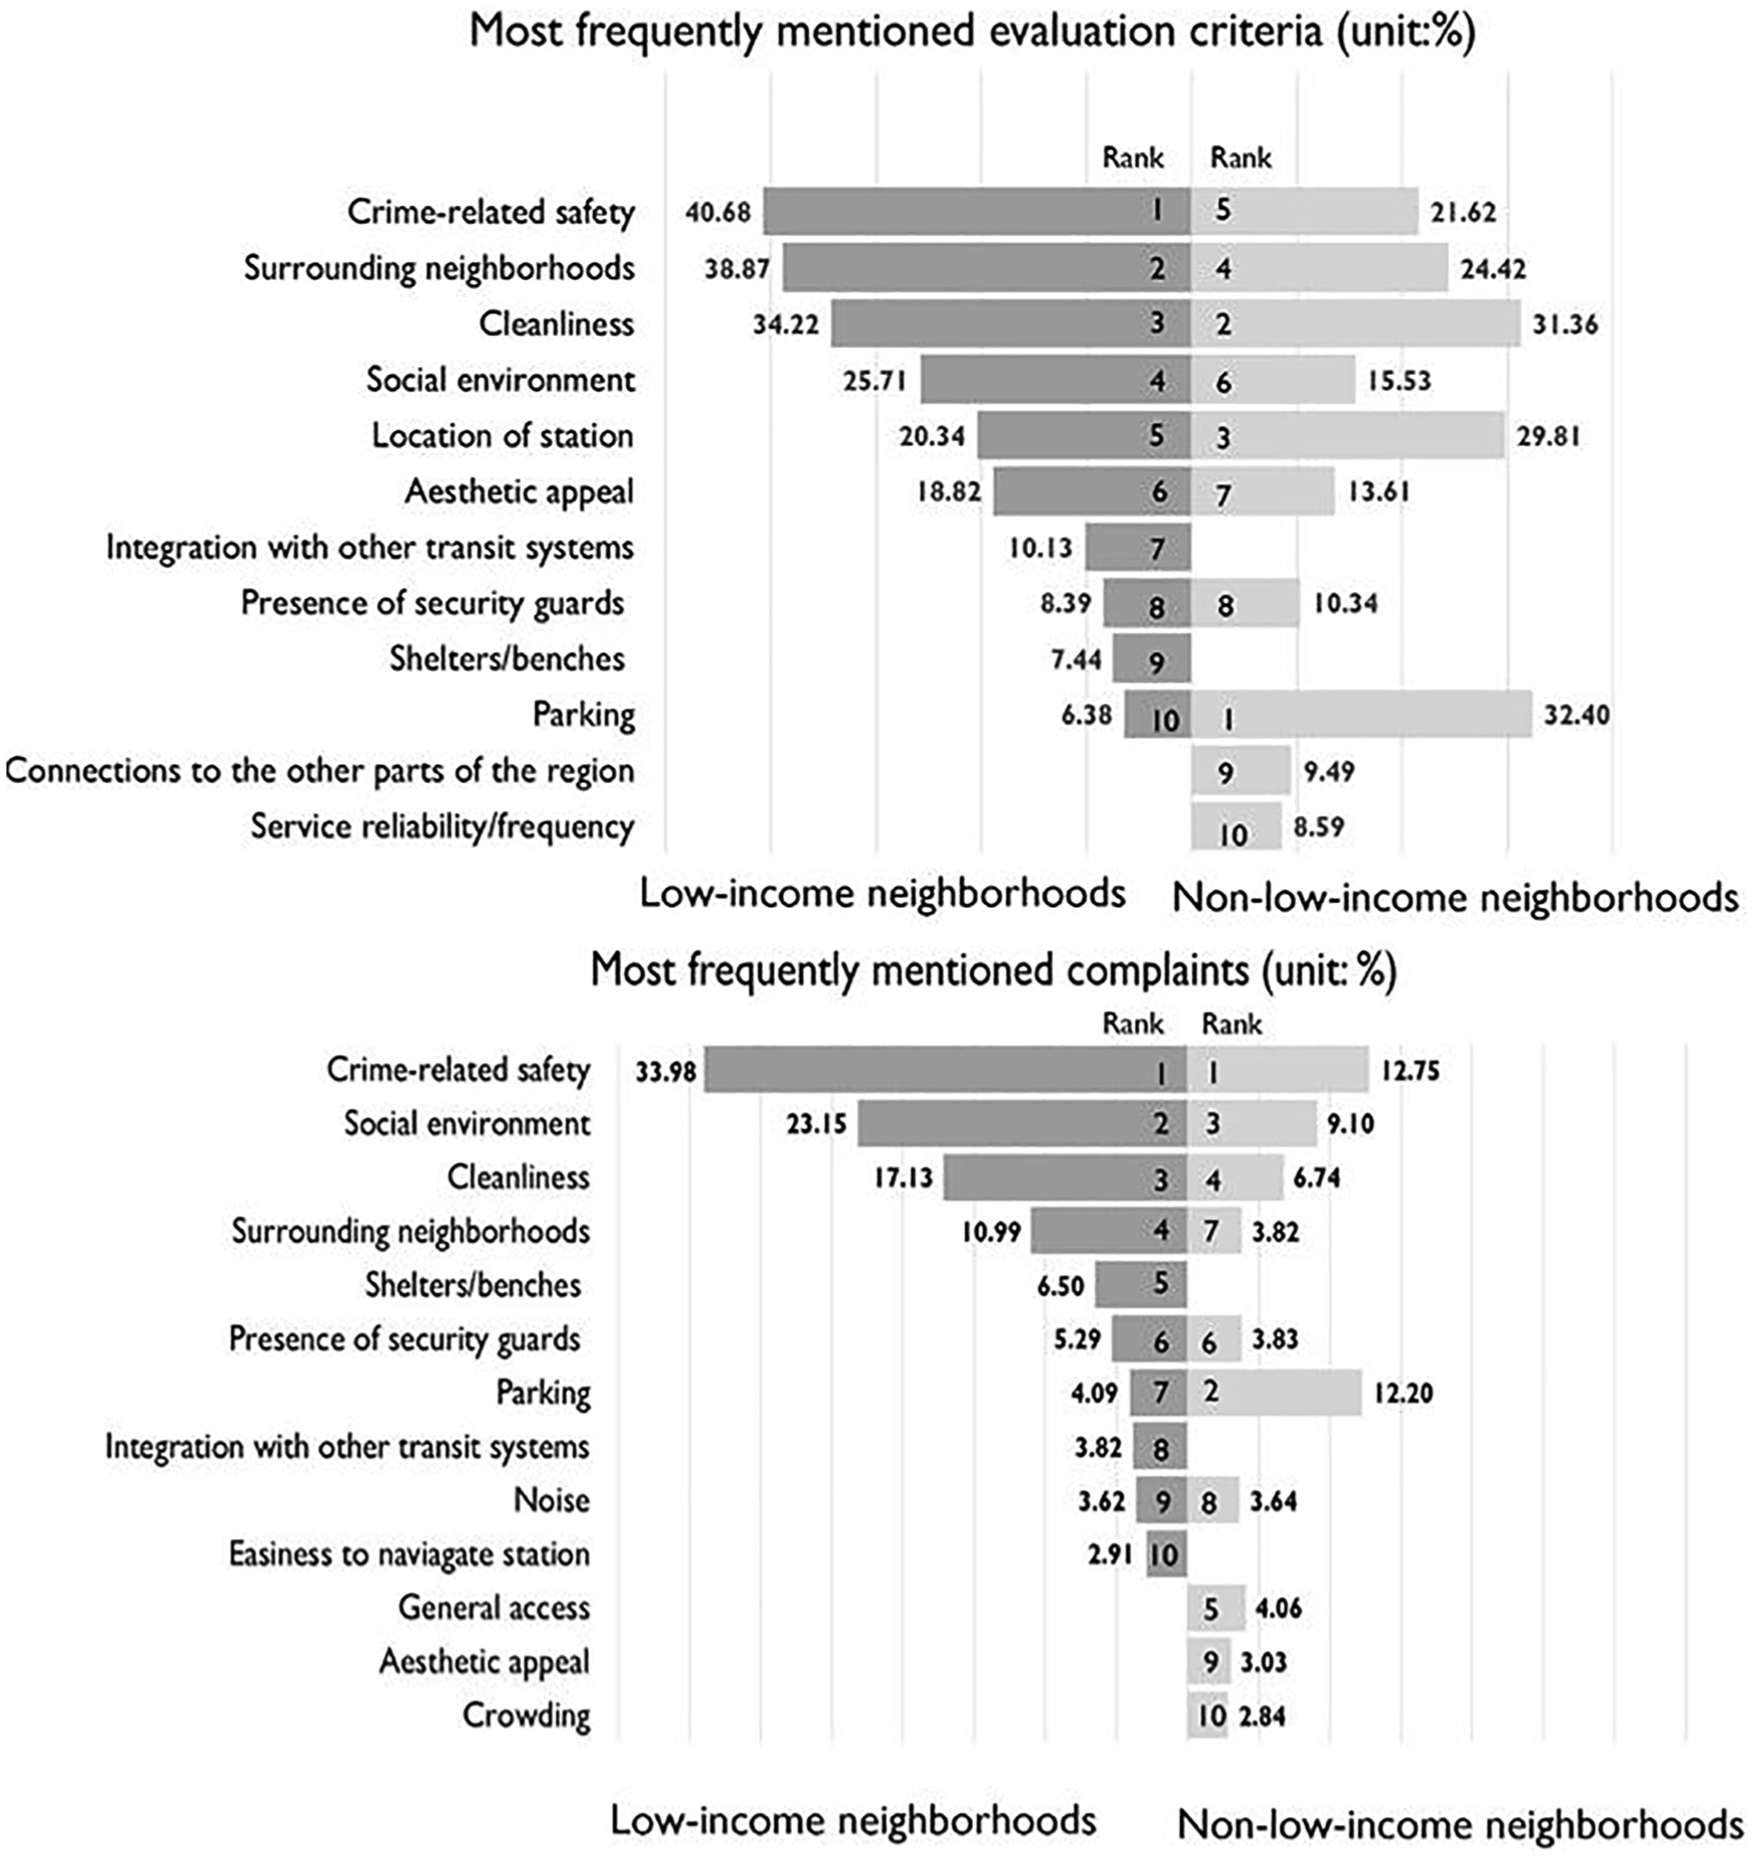
Most frequently mentioned evaluation criteria (above) and complaints (below) by neighborhood type.
Figure 2 also shows factors on which complaints are most common for each neighborhood type. Of the ten most frequent complaint factors, seven were found for both low-income and non-low-income area stations. On average, stations in both low- and non-low-income areas received relatively high proportions of complaints regarding safety-related factors and cleanliness, together with surrounding neighborhoods, parking, and noise. However, there were also some differences between the two neighborhood types: in addition to general station access, complaints about parking were more commonly reported for non-low-income stations. This perhaps reflects the greater distance between stations (due to lower density) and the higher share of automobile access to stations in non-low-income areas.
It is noteworthy that, for most factors, the average percentages of reviews with negative feedback were much higher for stations in low-income areas compared with the percentages for those in non-low-income areas. This likely explains the low average rating for stations in low-income neighborhoods. For example, reviews with negative comments regarding a station’s social environment were more than twice as common in low-income areas (23.15%) than in non-low-income ones (9.10%).
I also compared factors affecting users’ evaluation of stations in two different time periods: 2007–2011 and 2012–2015 (Figure 3). There was almost no change in the lists of major evaluation criteria and common complaint factors over time: crime-related safety, surrounding neighborhoods, cleanliness, and parking were all listed in the top five evaluation criteria and complaint factors for both time periods. Reviews in the later period more frequently mentioned noise, station location, and crowding as the major complaint factors. It is noteworthy that, unlike other major complaint factors, cleanliness-related complaints were much less frequent (although still ranked fourth by frequency) in 2012–2015 (8.51%) compared with 2007–2011 (12.52%).

Most frequently mentioned evaluation criteria (above) and complaint factors (below) over time.
Jaccard Analysis of the Most Common Complaints
Results reported in the previous section allowed me to identify general areas of complaint but did not provide details. To form a better sense of complaint sources (e.g., what made people complain about sanitary conditions at rail stations), so as to guide planners on how to address those issues, I identified the words most frequently used to describe major complaint factors. As the Jaccard similarity coefficient is frequently used in text mining to measure the association between words (Becker et al. 2012; Mondschein 2015), I also adopted this index. Specifically, J indicates the ratio of the number of sentences including both words X and Y to the number of sentences, including either word X or Y:

Therefore, a higher Jaccard index indicates a higher association between the two words. After selecting two to three representative words for the three selected major complaint factors (i.e., parking, cleanliness, and crime-related safety), I used the KH Coder to generate a list of terms frequently associated with those words. I then ranked these terms based on their Jaccard similarity coefficients. Table 4 shows the top twenty associated words (ten nouns and ten adjectives) and Jaccard indexes for each major complaint factor. In general, the associated words identified by the KH Coder are intuitive. For example, “free” was the term most associated with “parking”; about 12 percent of the sentences that included the terms either “parking” or “free” contained both of those terms.
Jaccard Similarity Coefficients for Major Complaints (Nouns and Adjectives Only).
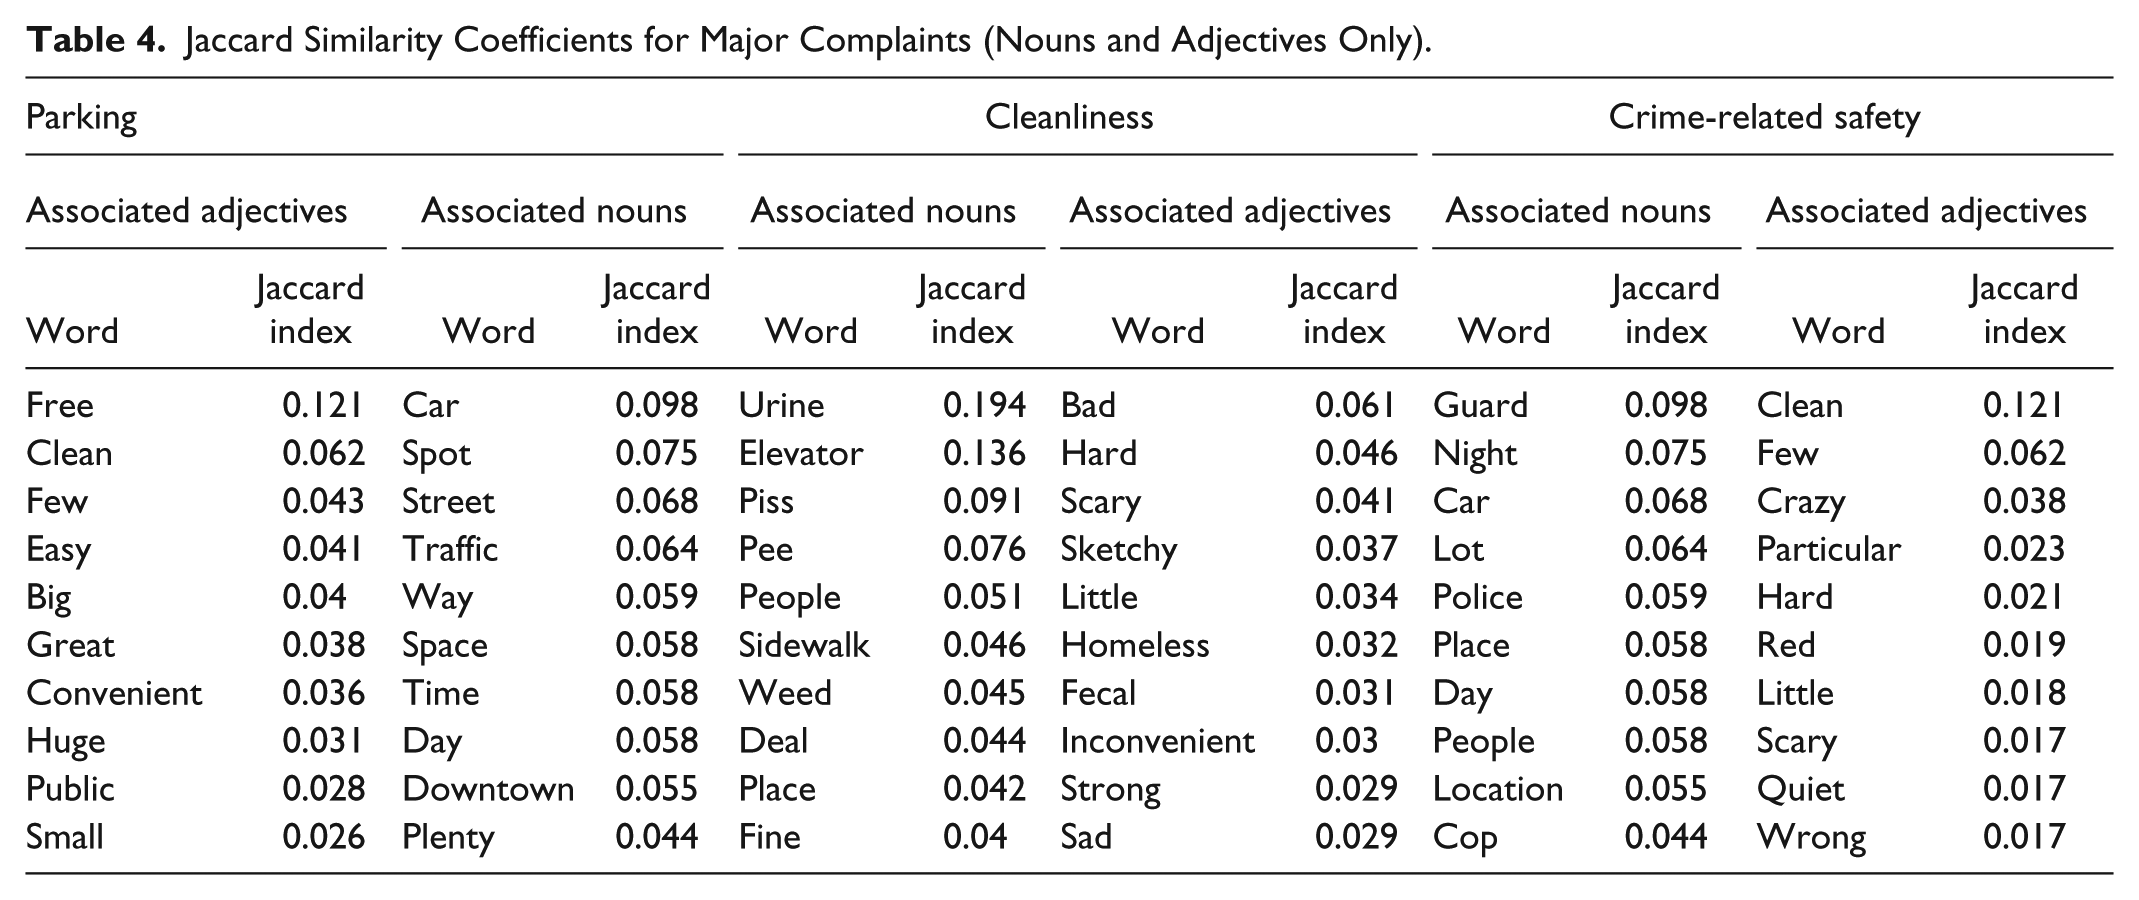
In terms of parking, most reviewers described it based on three key aspects: (1) availability (“plenty,” “few,” “big,” “huge,” “small”), (2) price (“free”), and (3) access (“easy,” “public,” “convenient”). In addition to parking structures, reviewers also described the “street” parking situation around stations. From words like “day” and “time,” we can infer that parking availability varies by the time of day; many reviewers reported limited available parking at stations during morning peak hours. Moreover, terms such as “downtown” and “traffic” suggest that many people traveling downtown tend to park their cars at rail stations due to poor parking at and traffic around their destinations.
For cleanliness, the associated nouns present a vivid picture of rail stations’ conditions. Most of these associated words express the source of uncleanliness, including “urine,” “piss,” “pee,” and “weed.” Moreover, some associated nouns, such as “elevator” and “sidewalk,” indicate where cleanliness is usually problematic; many reported that hygiene issues prevented them from using elevators at rail stations. Terms related to safety (e.g., “scary,” “sketchy”) were also among the top ten adjectives associated with sanitation, suggesting a close relationship between these two areas. Finally, words such as “people” and “homeless” imply a close association between the social environment and perceptions of sanitation.
Nouns associated with crime-related safety describe the safety issues at rail stations in detail. The prevalence of words like “guard,” “police,” and “cop” implies that visible safety measures play significant roles in users’ perceptions of safety. In addition, words like “crazy” and “people” suggest that the social environment influences users’ safety concerns. During the hand-coding process, I also noticed that many reviewers, especially female passengers, reported feeling unsafe when encountering homeless people, vagrants, drug dealers, panhandlers, and so on at rail stations. In addition to determining the sources of reviewers’ safety concerns, the Jaccard indexes suggest the associated places. For example, terms such as “car” and “lot” indicate negative perceptions of station parking lot safety, in line with the findings of Loukaitou-Sideris, Liggett, and Iseki (2002) on crime incidences at Los Angeles rail stations.
Additional Analyses Results
Sampling Bias in Yelp Data and Socioeconomic Differences in User Evaluations of Rail Stations
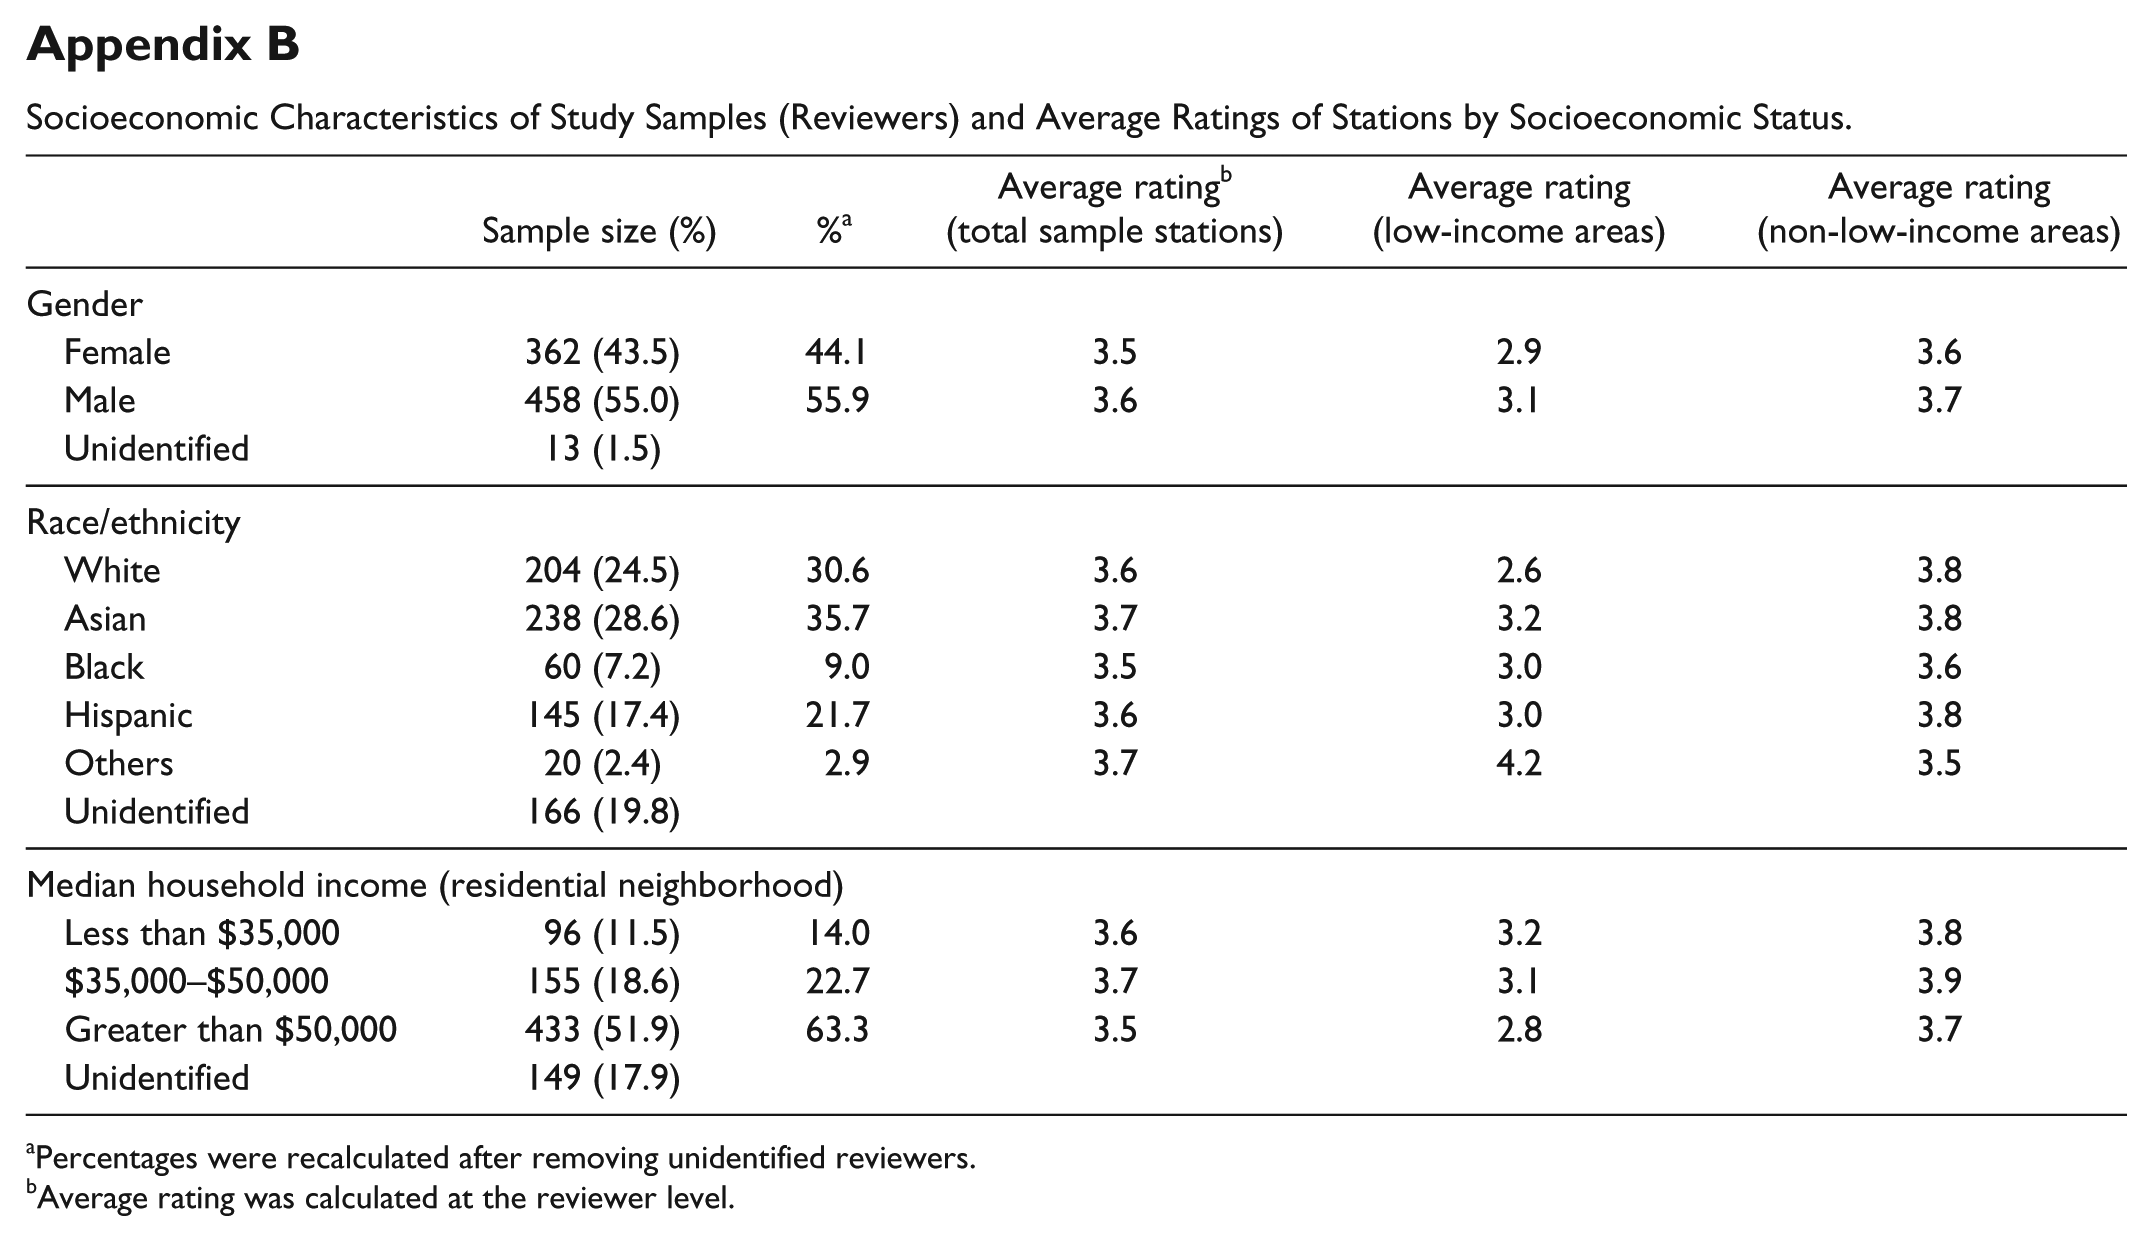
It is well known that social media data suffer from sampling bias (López et al. 2012; Mondschein 2015). According to the Yelp website (https://www.yelp.com/factsheet), Yelp users in the United States are, on average, younger and wealthier than are typical U.S. citizens (although no sociodemographic information on individual users is provided). In addition to income and age, social media data samples are likely to be biased along racial/ethnic lines, with higher representation of whites (Davis et al. 2019). To address this issue, I examined (1) whether the characteristics of rail station reviewers on Yelp differ from those of general rail riders, and (2) if so, how this affects the study’s findings.
To infer social media users’ socioeconomic and demographic characteristics, scholars have developed various methods, such as human/automated facial recognition and data matching. I adopted the methodology recently developed by Davis et al. (2019) by extracting reviewers’ sociodemographic information from their narrative reviews. Specifically, I accessed Yelp reviews that those reviewing rail stations posted about other businesses and searched for key phrases related to race/ethnicity (e.g., “Mexican,” “Chinese”) and residential locations (e.g., “close to my house/home/place”) in the text of these reviews (see Appendix A for details). I then read the reviews containing these key phrases closely to check whether these reviews reveal any information on reviewers. Surprisingly, about 70 and 82 percent of reviewers directly revealed information on race/ethnicity and residential neighborhoods, respectively, in at least one of their reviews to justify their ratings. 6 Using this information in combination with profile photos and first names, I inferred most reviewers’ gender, race/ethnicity, and residential neighborhoods. As for the residential neighborhoods, after geocoding the business close to each reviewer’s residence based on the business street address, I joined these geocoded addresses with a census tract shape file. The median household income of their neighborhoods (i.e., census tracts) was then used as a proxy for reviewers’ income.
The summary statistics of these inferred socioeconomic characteristics of reviewers (see Appendix B) support the previous findings that social media data samples are biased. Specifically, as compared with general rail riders (LA Metro 2012), there were more Asians and whites, but fewer Hispanics and blacks among the sample. Moreover, Yelp reviewers are more likely to be wealthy, which is also in line with their racial composition. However, I did not find any gender bias in the Yelp dataset: the percentages of male versus female reviewers reflect their actual percentages among general rail riders.
Considering that people in different socioeconomic classes likely use and evaluate different stations, descriptive analyses of ratings were conducted by neighborhood type (i.e., low-income vs. non-low-income neighborhood); this offers a better understanding of how ratings and evaluation of the same type of stations varied by reviewers’ characteristics. As reported in Appendix B, wealthier or white reviewers tended to give slightly lower ratings for low-income area stations compared with low-income reviewers or ethnic minorities, implying that the former group may have higher standards for rail station evaluations. These results suggest that the sampling bias in social media data can downwardly bias the overall ratings of stations. However, it is important to note that low-income area stations tended to receive lower ratings compared with high-income area stations even after considering reviewers’ socioeconomic characteristics. In addition, the five most frequently mentioned evaluation criteria and complaint factors were similar across income or race/ethnicity (see Online Appendices C and D).
Meanwhile, the analyses show that the average ratings for low-income area stations were similar regardless of the reviewers’ gender. Regarding major complaints, both male and female reviewers identified crime-related safety as their primary concern at low-income area stations, although the average percentage of reviews mentioning this factor was higher among women. There was very little variation in the top five evaluation criteria and complaint factors by gender, with the exception of some factor rankings (see Online Appendix E). For example, female reviewers reported more concern about the social environment at low-income area stations compared with male reviewers.
Station Audits
Another concern regarding social media data is the validity of information, given the potential manipulation of reviews, although the Yelp website does have its own automated filtering mechanisms to detect false/fake reviews. To additionally check the validity of Yelp reviews, the field audits of fourteen stations 7 and their surrounding areas were conducted by two auditors (one male, one female). These audits were conducted between February 4 and March 5, 2019, and each station and its surrounding areas were observed during both morning peak hours (7:00 a.m.–9:30 a.m.) and night off-peak hours (7:00 p.m.–11:00 p.m.) on weekdays. The audit instrument (see Online Appendix F) and methods were developed based on Fan, Guthrie, and Levinson (2016) and Table 1. The two auditors were in total agreement on about 75 percent of codes.
I used these audit results to investigate whether the descriptions in Yelp reviews coincided with what the auditors observed. Although the audits were conducted several years after the reviews analyzed in this study were posted, there were no major differences between the audit results and Yelp review contents, which reinforces the latter’s validity. In other words, for a given rail station, the attributes about which Yelp reviewers frequently complained also tended to receive relatively low scores from the auditors.
Moreover, the auditors, on average, gave lower scores for almost all attributes, including crime-related safety, cleanliness, and surrounding neighborhoods, for low-income area stations compared with non-low-income area stations, based on both objective and subjective measures (see Online Appendix F). This is similar to the results based on Yelp data and suggests that the relatively low average ratings of low-income area stations reflect not only subjective perceptions but also objectively poor quality or maintenance status of such stations. The Jaccard indexes also show that reviewers tended to use both subjective and objective descriptors to portray the problems in low-income area stations, although the patterns varied by problem type. Specifically, reviewers more often relied on objective descriptors to describe sanitary conditions and subjective descriptors to critique safety/security issues in low-income area stations.
Discussion and Conclusion
Discussion of the Findings
Planners have long been eager to more effectively hear citizens’ voices. This study shows that online review websites offer a platform connecting planners and citizens. The rich information on station service quality that people voluntarily report on Yelp provides valuable insights into how users evaluate transit stations. Interestingly, there were not many extremely negative reviews, and, on average, people tended to leave more compliments than complaints about LA Metro Rail stations. Although these findings somewhat contradict earlier findings (Schweitzer 2014), this may be due to people’s different perceptions of rail transit versus bus transit, or the higher average socioeconomic status of rail users when compared with bus riders; further examination is needed.
Attributes listed in the top compliments also had greater influence than complaints on major evaluation criteria. For example, station location and aesthetic aspects were among the most important evaluation criteria, as Yelp reviewers frequently praised them. However, the other most frequently referenced evaluation criteria, including cleanliness and safety-related attributes, mostly featured as both major compliments and complaints. Meanwhile, the most prevalent complaints concerned crime-related safety and the social environment. This supports previous findings on user perception of transit service quality and other evidence on fear of crime at Los Angeles transit stations (Iseki and Taylor 2010; Loukaitou-Sideris 1999). Other common complaints included parking, cleanliness, and the amenities of surrounding neighborhoods. While these identified evaluation criteria and complaint factors generally support previous findings, this study reveals several important evaluation criteria missing from previous literature, such as parking and the social environment, that reflect the study area context. Additional analyses also confirmed that there was very little variation in major evaluation criteria and complaint factors across reviewers’ socioeconomic characteristics, although future studies need to address how station ratings and evaluations are affected by reviewers’ age.
This study’s findings also add new evidence of disparities in transit service quality by neighborhood type to the literature on transport and social exclusion. On average, stations located in low-income neighborhoods received lower ratings and fewer reviews than those in non-low-income areas, and these patterns did not change over time. My content analysis of Yelp reviews demonstrates that these lower ratings for low-income area stations were not likely due to problems unique to these stations; safety/security-related factors and cleanliness, for example, were among the most common complaints about stations in both types of neighborhoods. However, the percentage of reviews containing complaints was, on average, much higher for stations in low-income areas, thus decreasing their average rating. Consistently, the overall physical and social conditions (both subjective and objective) of low-income area stations were measured as relatively poor in the field audit.
Whereas stations’ average ratings and number of reviews significantly increased over time, there was little temporal change in the factors influencing users’ ratings or major complaints. Regardless of the time period, crime-related safety, the social environment, cleanliness, and parking were the most prevalent complaints. However, as the study period was relatively short and includes years when social media was less popular, further studies over a longer period are needed.
Implications for Transportation Planning
The findings of this study reveal that some station attributes require special attention from planners to improve metro users’ experiences and increase transit ridership. For example, station location was among the most important evaluation criteria, although not among the top ten complaints (presumably reflecting that existing metro stations are favorably located). This implies the need for careful consideration of users’ demands and convenience when selecting new station locations. In addition, the complaints frequently mentioned by reviewers indicate areas for improvement, including safety/security, cleanliness, and parking. Considering that the average rating for stations in low-income areas was lower regardless of the time period (i.e., 2007–2011 vs. 2012–2015) and reviewers’ socioeconomic characteristics, additional efforts should be made to reduce spatial disparities in these aspects of transit station quality.
The Jaccard indexes provide more specific guidelines on how to address major problems. For example, increasing the presence of security guards, especially at night and in station parking lots, can help to reduce negative perceptions of safety in stations located in any type of neighborhood. For stations in non-low-income areas, where parking is the most important evaluation criterion, providing sufficient parking in convenient locations should be prioritized to satisfy users and attract more choice riders. The Jaccard indexes also show that the social environment entails security concerns and cleanliness issues; homeless people’s use of stations for purposes other than travel seems to be a major threat to other metro users. Therefore, cooperation between transit agencies and social service institutions is essential to increase transit ridership while offering appropriate care and transit access to homeless populations.
Finally, this study demonstrates the potential of using social media as a planning tool. Online reviews are publicly available to planners who aim to understand user evaluations of transportation systems, including transit stations, in many regions around the world. However, despite their usefulness, there are not enough online reviews for every station. Therefore, interventions such as campaigns and promotions should be used to encourage more people, especially users in low-income areas, to review transportation facilities using social media. Planners also need to endeavor to build best practices for analyzing and using social media content.
Supplemental Material
Supplementary_material – Supplemental material for What Can We Learn from Online Reviews? Examining the Reviews of Los Angeles Metro Rail Stations
Supplemental material, Supplementary_material for What Can We Learn from Online Reviews? Examining the Reviews of Los Angeles Metro Rail Stations by Eun Jin Shin in Journal of Planning Education and Research
Footnotes
Appendix
Socioeconomic Characteristics of Study Samples (Reviewers) and Average Ratings of Stations by Socioeconomic Status.
| Sample size (%) | % a | Average rating b (total sample stations) | Average rating (low-income areas) | Average rating (non-low-income areas) | |
|---|---|---|---|---|---|
| Gender | |||||
| Female | 362 (43.5) | 44.1 | 3.5 | 2.9 | 3.6 |
| Male | 458 (55.0) | 55.9 | 3.6 | 3.1 | 3.7 |
| Unidentified | 13 (1.5) | ||||
| Race/ethnicity | |||||
| White | 204 (24.5) | 30.6 | 3.6 | 2.6 | 3.8 |
| Asian | 238 (28.6) | 35.7 | 3.7 | 3.2 | 3.8 |
| Black | 60 (7.2) | 9.0 | 3.5 | 3.0 | 3.6 |
| Hispanic | 145 (17.4) | 21.7 | 3.6 | 3.0 | 3.8 |
| Others | 20 (2.4) | 2.9 | 3.7 | 4.2 | 3.5 |
| Unidentified | 166 (19.8) | ||||
| Median household income (residential neighborhood) | |||||
| Less than $35,000 | 96 (11.5) | 14.0 | 3.6 | 3.2 | 3.8 |
| $35,000–$50,000 | 155 (18.6) | 22.7 | 3.7 | 3.1 | 3.9 |
| Greater than $50,000 | 433 (51.9) | 63.3 | 3.5 | 2.8 | 3.7 |
| Unidentified | 149 (17.9) | ||||
Percentages were recalculated after removing unidentified reviewers.
Average rating was calculated at the reviewer level.
Acknowledgements
Jaeyeong Nam’s research assistance is much appreciated. The author thanks Dr. Kijung Shin for providing technical assistance. The author also thanks the three anonymous reviewers and the editor for their constructive feedback. An earlier version of this article was presented at the 2018 Association of Collegiate Schools of Planning Annual Meeting, where the author received helpful comments.
Declaration of Conflicting Interests
The author(s) declared no potential conflicts of interest with respect to the research, authorship, and/or publication of this article.
Funding
The author(s) disclosed receipt of the following financial support for the research, authorship, and/or publication of this article: This research was funded by Yale–NUS College (Grant Number: R-607-264-334-121).
Supplemental Material
Supplemental material for this article is available online.
Notes
Author Biography
References
Supplementary Material
Please find the following supplemental material available below.
For Open Access articles published under a Creative Commons License, all supplemental material carries the same license as the article it is associated with.
For non-Open Access articles published, all supplemental material carries a non-exclusive license, and permission requests for re-use of supplemental material or any part of supplemental material shall be sent directly to the copyright owner as specified in the copyright notice associated with the article.