



Abstract
Land-use control is local and highly varied. State agencies struggle to assess plan contents. Similarly, advocacy groups and planning researchers wrestle with the length of planning documents and ability to compare across plans. The goal of this research is to (1) introduce Natural Language Processing techniques that can automate qualitative coding in planning research and (2) provide policy-relevant exploratory findings. We assembled a database of 461 California city-level General Plans, extracted the text, and used topic modeling to identify areas of emphasis (clusters of co-occurring words). We find that California city general plans address more than sixty topics, including greenhouse gas mitigation and Climate Action Planning. Through spatializing results, we find that a quarter of the topics in plans are regionally specific. We also quantify the rift and convergence of planning topics. The topics focused on housing have very little overlap with other planning topics. This is likely a factor of state requirements to update and evolve the Housing Elements every five years, but not other aspects of General Plans. This finding has policy implications as housing topics evolve away from other emphasis areas such as transportation and economic development. Furthermore, the topic modeling approach reveals that many cities have had a focus on environmental justice through Health and Wellness Elements well before the state mandate in 2019. Our searchable state-level database of general plans is the first for California—and nationally. We provide a model for others that wish to comprehensively assess and compare plan contents using machine learning.
Introduction
“No one reads” exclaimed planning theorist, Seymour Mandelbaum in a 1990 commentary in the Journal of the American Planning Association. He was involved in a public debate about how planners failed to create plans that readers could interpret. The subject was Philadelphia’s 176-page Center City Plan. Sure, neighborhood activists and developers skimmed the plan or read selectively, but few people read the full plan, and far fewer understood the synthesis of its parts. Three years later, Mandelbaum noted that his plea was overly ambitious. “I thought initially that I might be able to help people directly read The Plan for Center City. Ultimately, however, I settled on a more modest goal: encouraging a conversation among planners about both reading and writing plans” (Mandelbaum 1993). The call spurred a “fundamental shift” in planning theory (Hamin 2006). Nearly two decades later, Ryan (2011) flatly noted that “the literature on plan reading is not abundant.” Ryan (2011) urged planners to “formally read through plans, not simply . . . grasp their essential ideas, but also to perceive [them] as a statement on the social and political values of its time.” Such comparative understanding across plans is necessary to further the field of planning as well as improve upon its practice.
If planning researchers still struggle to read plans, imagine how difficult it is for the public. Worse, the challenge has grown and the stakes along with it. Rarely are plans less than 200-pages long, like the one Mandelbaum (1990) critiqued. Many General Plans are more than 2,000 pages in length. Ultimately, adopted plans commit the local government to long-term zoning, financing, and development goals that shape the fortunes and health of the jurisdiction. Thanks to steady advocacy for community engagement (Arnstein 1969; Burby, 2003; Innes and Booher 2018; Sandercock 1998), never have more people been more invested in the planning process. It can take many years for communities to make their General Plan due to the numerous community meetings, charettes, and public hearings required to formulate a plan. Representative engagement is critical to more equitable outcomes (Campbell 1996, 2016; Loh and Kim 2020), but how will people make informed suggestions? If a community wants to improve upon innovative policies, they must first understand the suite of options that neighboring communities have piloted to success. To do so, people must read many plans, not only their own.
Now that plans are digitized and available online, new techniques make harvesting and exploratory, comparative quantitative analysis of such high-dimensional texts possible. Machine Learning researchers began to develop methods to comprehensively “read” and compare the content of many large text documents using Natural Language Processing (NLP). Like spatial statistical regression techniques that many planners are familiar with, NLP can be used to understand correlations. Instead of correlating across space, NLP correlates words across texts. As the linguist John Firth famously noted in 1957, “You shall know a word by the company it keeps.” Topic modeling, a subfield of NLP, focuses on the automated understanding of written and spoken language by generating a matrix of co-occurrence scores between target words and their context words using the hypothesis that words that repeatedly co-occur represent a particular topic in the text. Context is usually taken to mean a window of n words to the left and right of the target word in question. Although this field of computational learning began in the 1940s (Jones 1994), linguistic processing was only introduced to legal texts in the last decade (Ginsburg, Foti, and Rockmore 2013). More recently, the combination of spatial methodologies and computational linguists have helped trace the propagation of ideas in national constitutions from country to country (Rockmore et al. 2018). To the authors’ knowledge, NLP has not yet been applied to plans.
This research offers the first application of NLP on planning documents. Essential principles of plans (e.g., a focus on fair housing) are topics (clusters of words that co-occur) and we can quantify where plans address these topics and where they do not. Understanding differences across many plans and planning contexts can help state agencies and advocacy groups identify what is being planned, where, and how. Identifying broad trends across plans can also help planning scholars understand the trajectory of the field and target research and pedagogy efforts. Already, a number of comparative plan analyses ask, “Are we planning for equity?” (Loh and Kim 2020) and “Are we planning for sustainable development?” (Berke and Conroy 2000) by using qualitative coding on a relatively small sample size of planning documents. Using 461 California city general plans, topic modeling allows us to broaden these questions to ask, what topics do plans address, and what do they omit? We also quantify how policy emphases track together or diverge. For example, topic modeling allows the research team to quantify the language that surrounds “climate mitigation” based on how probable it is that transportation planning is immediately discussed. Furthermore, we demonstrate how topic fits can be represented spatially to understand regional differences across planning approaches. As cities grapple with homelessness and affordable housing, are there different approaches in larger cities compared with rural towns? Are there hotspots of plan innovation that tackle issues like forest fires or health policy? We conclude by noting the strengths of NLP methodology as well as the shortcomings. In sum, this research ushers in new techniques for plan evaluation and answers the calls (Mandelbaum 1990; Ryan 2011; Talen 1996) for plans to be thoroughly, comparatively read. Last, advanced machine learning and language probability are prerequisites for crafting predictive text algorithms, opening new opportunities, and considerations for writing plans.
Method
California Background
We focus on California because of its diverse geography and unique emphasis in planning topics. The state of California contains mountains, coasts, deserts, forests, America’s largest cities, and highly productive farmland. California requires every city and county to have a General Plan (Gov. Code § 65300). By statute, the Housing Element must be updated every five years, but the rest of the general plan does not need to be fully updated until two or more elements have been revised. Despite this requirement, as of 2015, more than half of the local jurisdictions have general plans that are more than fifteen years old (California Governor’s Office of Planning and Research [OPR] 2017). Furthermore, California’s Environmental Quality Act (CEQA) requires that local governments analyze—and where feasible mitigate—greenhouse gas (GHG) emission impacts (Gov. Code §15183). In addition to the seven required elements (land use, housing, circulation, conservation, noise, safety, and open space, Gov. Code §65302), SB1000 (2017) requires every new General Plan to include Environmental Justice (Gov. Code § 65040). The objective of this new requirement is to ensure that development does not burden low-income and historically disadvantaged communities. We will show how topic modeling allows us to identify cities that have addressed environmental justice before the state mandated such a focus.
Although General Plans are required to assess and plan according to state mandates, the state does not have a means of comprehensively assessing plan contents. No state does. Instead, the Governor’s OPR assesses the content of plans through an annual survey of planners. Many planners do not know the contents of their General Plan. For example, more than 50 city planners of the 270 who responded to the 2017 survey were unsure if their General Plan addressed “equity” (Governor’s OPR 2017). With a response rate of 64 percent on the annual planning survey, and such uncertainty, how can the state move development and planning standards forward? This research seeks to address such practical concerns alongside larger theoretical dialogs about the field of planning.
Database creation and text extraction
Although plans are publicly available, they are not aggregated in one place, nor do they follow a single format. We attempted to collect PDFs of California’s 482 city General Plans by visiting city webpages. There were sixty-one cities that did not have available online PDFs of their General Plan and were, thus, not included in this study. We collected plans in 2017, and omitted plan updates or additions after this time period. Elements of General Plans are often updated in isolation, and care was taken to retrieve the most updated element. We noted the year the plan was adopted as well as when each element was updated.
The readPDF function of the R tm package v0.7-6 was used to extract the text from the PDFs (Feinerer 2018). All PDFs collected represented the data as XML encoded text (as opposed to embedded images, which is frequently the case with older PDF documents), so no transcription errors were introduced by the text extraction process.
Text analysis
Many planning researchers are familiar with qualitative coding. The goal of NLP is to automate the coding process and enable a larger number of plans to be analyzed. We performed the following modes of textual analysis on the corpus, each of which is described independently below: Word Frequency Analysis, Bigram Analysis, Term Frequency–Inverse Document Frequency (TFIDF) ranking, Sentiment Analysis, and Topic Modeling. All analysis was performed on both the raw, extracted corpus and on a lemmatized version of the corpus. Lemmatization was performed using the TreeTagger tool developed by Schmid (2019). TFIDF ranking was performed on the raw version of the corpus prior to the performance of any additional cleaning. The texts underwent additional cleaning prior to the performance of all other forms of analysis to reduce the dimensionality of the vocabulary and semantic variation. This cleaning included the removal of English “stopwords” (obtained from Lewis et al. 2004), digits, single-letter words, and punctuation. In addition, all characters were converted to lower case.
Word Frequency analysis was used to understand the primary focus of plans as noted in the number of words that are repeated. Word frequency was tabulated by calculating a Term Document Matrix (TDM) of the entire corpus using the R “tm” package, where every column in the matrix represented a unique word from the complete corpus vocabulary and every row in the matrix represented a city general plan. Each corresponding cell in the TDM was then assigned a value corresponding to the number of times that the referenced term from the corpus vocabulary appears in the referenced general plan document. Sums of each column thus provide the total occurrence of each word across the entire corpus, thereby facilitating calculation of weighted frequencies as presented in the resulted section. Word frequencies as presented in the data were not corrected for Zipf’s law or any other established frequency distribution curve (Zipf 1949). Frequencies represent actual frequency by document and relative frequency across the entire document.
Topic Modeling: The goal of topic modeling is to identify co-occurring words that represent themes. In this manner, de novo qualitative coding is possible without pre-defining the topics of interest. This method allows for a truly exploratory approach to understanding the themes across the California general plan corpus. A model of the semantic topics present in the corpus was created using the R lda package (Chang 2015). The lda package uses an algorithm called Latent Dirichlet Allocation (LDA) to determine which topics are present across an entire corpus and to subsequently calculate the likelihood of any given topic being present in each individual text in the corpus. LDA is a proven method for computationally modeling the semantic space of a corpus (Blei et al. 2003). Topic modeling is a process in which the computer first establishes clusters of words that frequently co-occur in the corpus (the topics) and then maps the presence of these clusters in individual documents across the corpus. For example, when the computer examined the General Plan corpus using LDA, it found that the following words frequently occur together in many individual plans: fund, housing, low-income, affordable, program, project, agency, develop, medium-income, unit, rehabilitation, assistance, grant, source, rental, fee, loan, provide, adopt, home
as do the following cluster of words: air, ozone, ppm, particulate, pollutant, citrus, nitrogen, dioxide, height, quality, monoxide, sulfur, hour, attainment, well, oxide, ambient, combustion, carbon, background, respiratory.
It is important to note that the computer has no idea what these clusters mean. It has simply deduced that a mathematically predicable combination of these particular words co-occur together frequently across plans. Extending this co-occurrence according to Firth’s assertion that, “You shall know a word by the company it keeps,” we deduce that there must be a semantic “Topic” that has a particular meaning communicated to the reader through the repeated co-occurrence of the words in each Topic Cluster (Firth 1957). The LDA algorithm assigns each topic a random numeric label. In our model, the two clusters identified above appear as Topic 4 and Topic 16. A knowledgeable reader of General Plans might label them “Affordable Housing” and “Air Quality,” respectively.
While LDA is an untrained and un-supervised modeling algorithm, it is a parametric process that requires users to define values for three hyperparameters prior to execution. These include indicating the number of topics to be modeled and two parameters that describe the overall shape of curves describing the distribution of words across topics and topics across documents. The number of topics modeled by LDA is frequently determined heuristically by humans through an iterative process of estimating the number of topics, examining output, adjusting the number of topics, and running a new model, examining that output, and so on. This process almost certainly drives toward overfitting the model—a process resulting in a derived model that by definition reveals only what the user already knows and expects it to find. As an alternative, we opted to mathematically determine the number of topics based on the convergence of three distinct methods of calculating the overall word-level complexity of the corpus. These included the methods described by Rajkumar Arun et al. (2010); Cao Juan et al. (2009); and Romain Deveaud, SanJuan, and Bellot (2014). This analysis determined the optimal number of topics in the model to be sixty. Of course, a corpus of general plans from other states may have fewer or greater number of planning topics depending on the regulatory framework of planning in that state.
The LDA algorithm also requires the input of two additional prior values typically referred to as “alpha” (α) and “beta”(β). An important feature of LDA is that a single word can belong to more than one topic. For example, “diversity” could be present in a topic focus on “agricultural diversity” as well as a topic focused on “cultural diversity.” The α parameter is a curve that represents the expected distribution of topics across documents. It indicates whether one expects to find the majority of topics represented in the majority of individual texts, or whether one expects to find each topic in only a few individual texts. The β parameter indicates whether one expects to find the majority of words in a lot of topic clusters or if each individual word is likely to appear in only a few topics. Because the City General Plans represent a significantly constrained corpus in which each document is expected to address the same set of topics from within the same contextual space, both parameters were set to describe a semantic space that assumed a relatively even distribution of words across topics and topics across documents. Specifically, we established the β distribution of .1 and an α distribution of .5.
Topic Correlation: One of the outputs of the Topic Modeling process is a matrix that associates every word in the corpus with the statistical likelihood represented as a continuous value between zero and one (as calculated by LDA) of that word being present in a corpus when every topic is being discussed. To better understand the relationship of the topics to each other, a hierarchical clustering algorithm was run to calculate the k-means distance between topic clusters based on the continuous values of word probabilities across each topic. This method enables us to see how closely related planning topics are to one another. For example, we can see how transportation planning topics relate to conservation focused topics.
Topic Dendrogram: This calculation reports what would happen if we were to recursively merge topics two-by-two, each time choosing the two topics that appear most often together in a same document. So whereas the correlation plot relates topics by their word probabilities similarity, using information from the topic words data table, the topic cluster dendrogram relates topics by their co-occurrence in documents, using information from the doc topics table. For example, two topics, say one about recycling and one about air quality, will have differences in the kind of words that are likely to be used to discuss them, but will tend to appear together in a corpus which contains documents about siting waste management facilities. In this example, the recycling and air quality topics would not be strongly related in the topic correlation plot, but would likely be linked together in the topic cluster dendrogram. The lowest level of the dendrogram is where the first merges are performed, and the highest level shows what topic would be merged last. Each merge results in a combined topic that incorporates all topics under it. In the resulting tree-like structure, the lower levels of the tree were merged first and indicate stronger topic co-occurrence than at higher levels.
The result of the combined topic model analyses are continuous representations of planning themes for each city. We explore regional planning patterns in topics by spatially joining topic probability fit spatially with cities. The resulting bubble chart visualizations are created in GeoDA software, and use 2010 city population data for the size of the population.
Model validation
To validate topic modeling results, each plan was reviewed to confirm the date that each plan was created and the title of each element within the plan, while cross-checking topic model fit with plan contents for plans that were outliers in the fit models. Further, the element titles in every plan were noted to see if the plan section heading correlated with topic contents. The top five plans for each fit were also manually scanned for contents and explanatory rationales to verify findings. We relied on planning expertise and knowledge of novel plan updates through the Governor’s OPR to further verify and make sense of findings. For example, the topic that corresponded to Environmental Justice had the best fit with a city that recently enacted a stand-alone Environmental Justice Element. Such findings helped validate the LDA topic model and fit within each topic. Research partnerships with the California Environmental Justice Alliance and California Rural Legal Assistance also provided feedback on findings and helped guide next steps in the research.
Data and Model Access: Publicly available archival versions of all project data outputs can be found at https://doi.org/10.25338/B8X318.
Results
First, we explore patterns in the corpus of California’s city General Plans as a whole before looking at topical and regional patterns. Figure 1 notes that 43 percent of California’s city plans were adopted within the last ten years, with 20 percent adopted more than twenty years ago. While the adoption of general plans for California cities spans years from 1963 to very recently, most have updated required elements. For example, the Housing Element must be updated on a five to eight year cycle (Gov. Code §65588). Figure 2 notes, however, that nearly 20 percent of plans have not been revised and updated in the last ten years, and some since the late 1980s. As Figure 2 highlights, many small cities have struggled to update their General Plans due to the cost and personnel time needed. Because plans are “ideological artifacts” (Ryan 2011) that crystalize the social, economic, and political forces of their time in written language, the results from the analysis represent a swath of time, covering many changes in planning theory and practice. Future research will be needed to tease out the evolution of specific concepts and planning language over time as well the city of origin and diffusion to other places. For now, this research focuses on forming a holistic view of the contents in California’s general plans and how topics articulate with one another across the corpus.
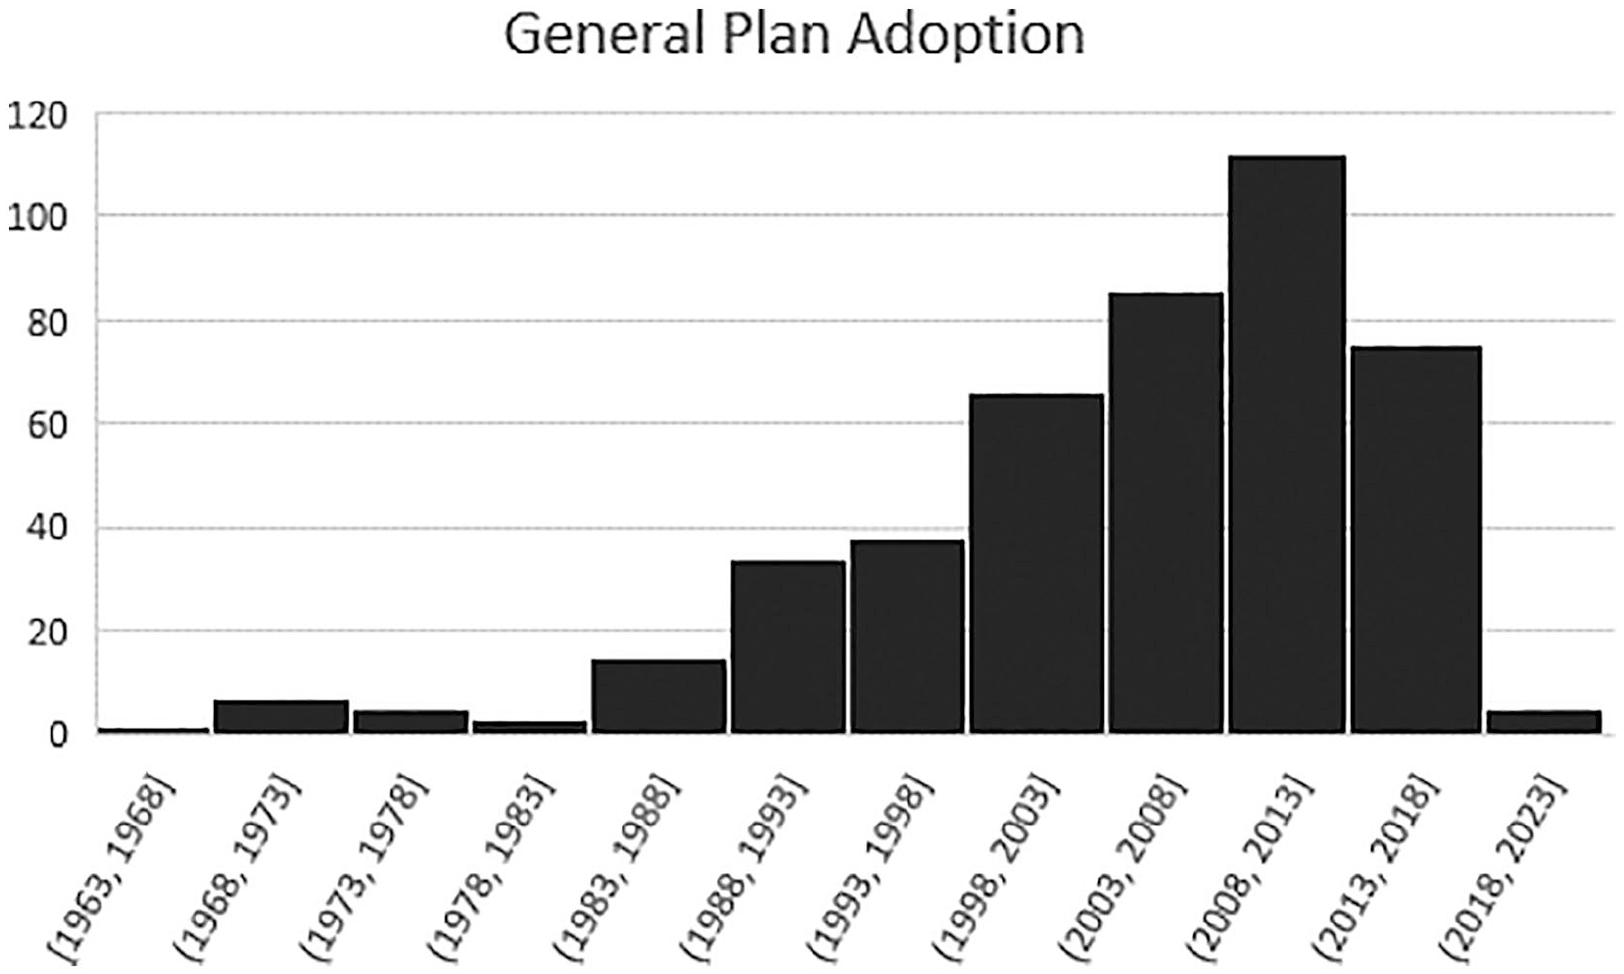
Adoption of City General Plans.
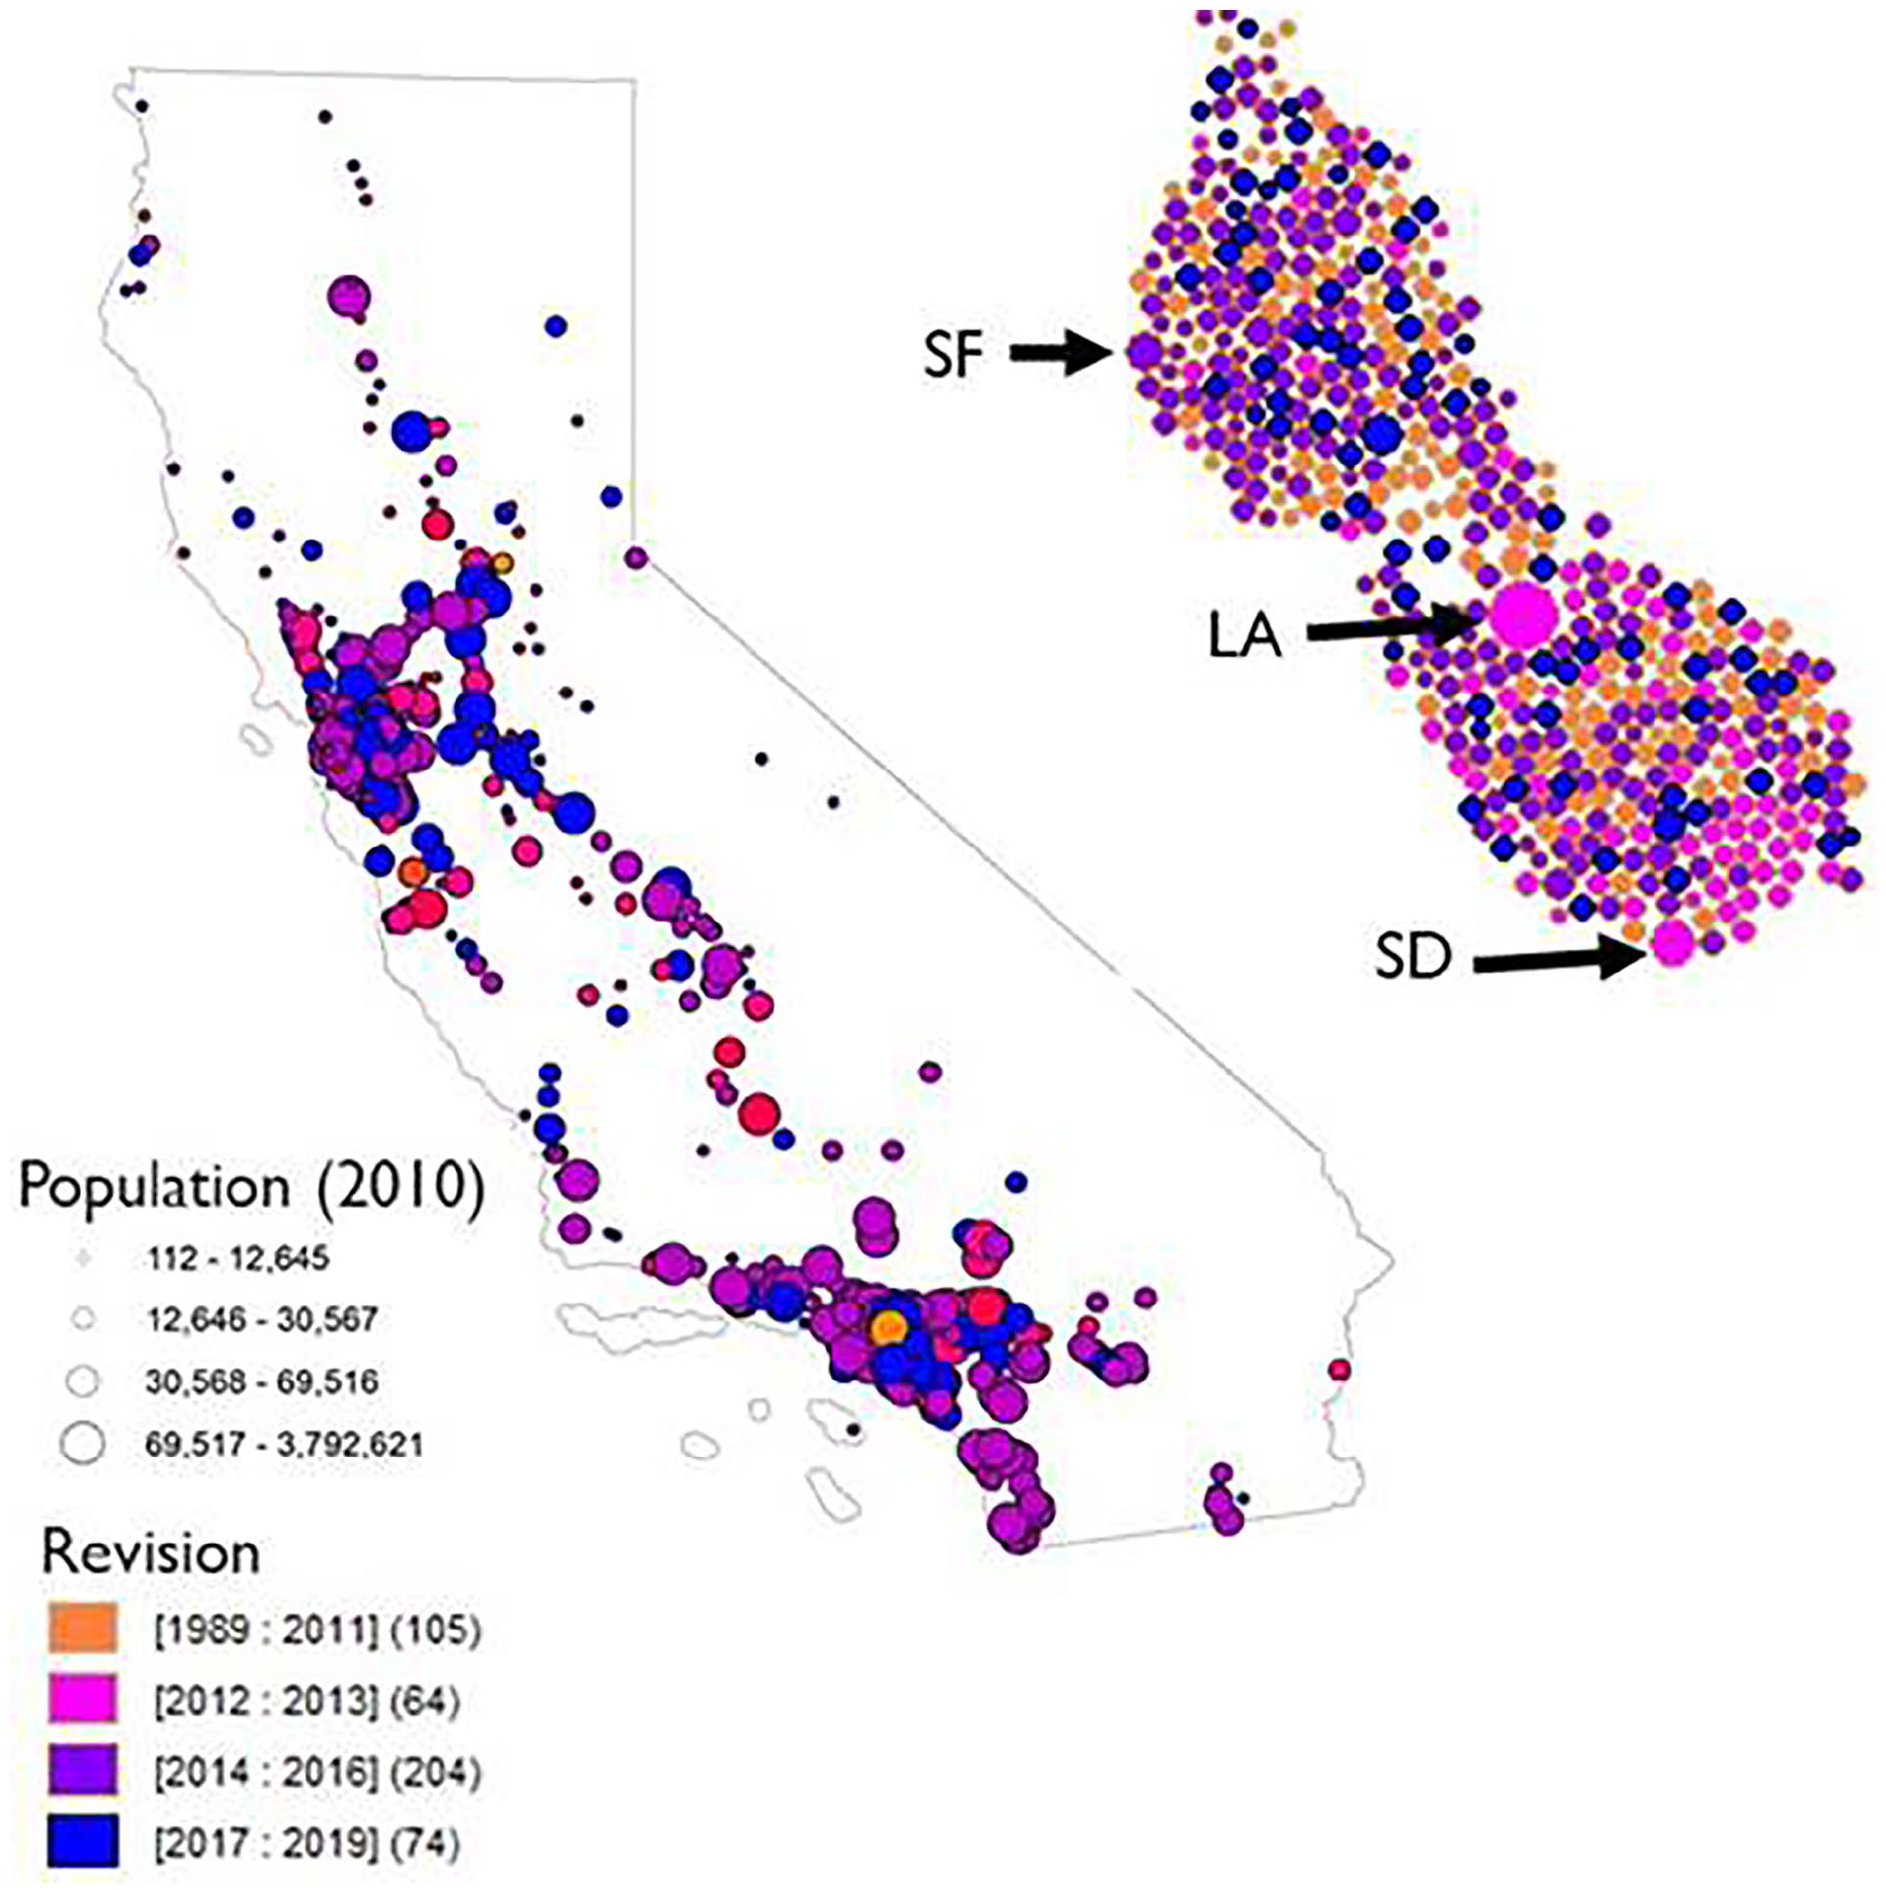
Last year of revision to a city General Plan. The cartogram in the upper right shows each city without any overlap. The size of the city is based on 2010 census population information. Major cities are labeled for reference: San Francisco (SF), Los Angeles (LA), and San Diego (SD). In the cartogram, LA appears further north, this is because Los Angeles County is home to 108 cities, many to the south of the City of Los Angeles.
A word cloud of the most frequent words in plans shows a focus on affordability, housing, and community in California’s city plans (Figure 3). Because housing policy has been at the forefront of California political discourse, it is not surprising to see this focus in city General Plans. One might also expect to see a shift over time in the most frequent words used in the planning corpus as discourse changes, this is particularly true for the language that qualifies low-income, affordable housing and public housing projects where the discourse is politically fraught and in flux (Mandelbaum 1984). Indeed, many of the most common words in plans do not correlate neatly with planning areas of expertise (Brinkley and Hoch 2018), but more likely speak to areas of plans that need added contextualization, such as “density” and “use.” The added contextualization ensures that words are repeated often as a shared language is formed. The limits of the word frequency approach in analyzing plan content are self-evident. Next, we turn to topic modeling to better understand the frequencies of planning topics, clusters of co-occurring words.
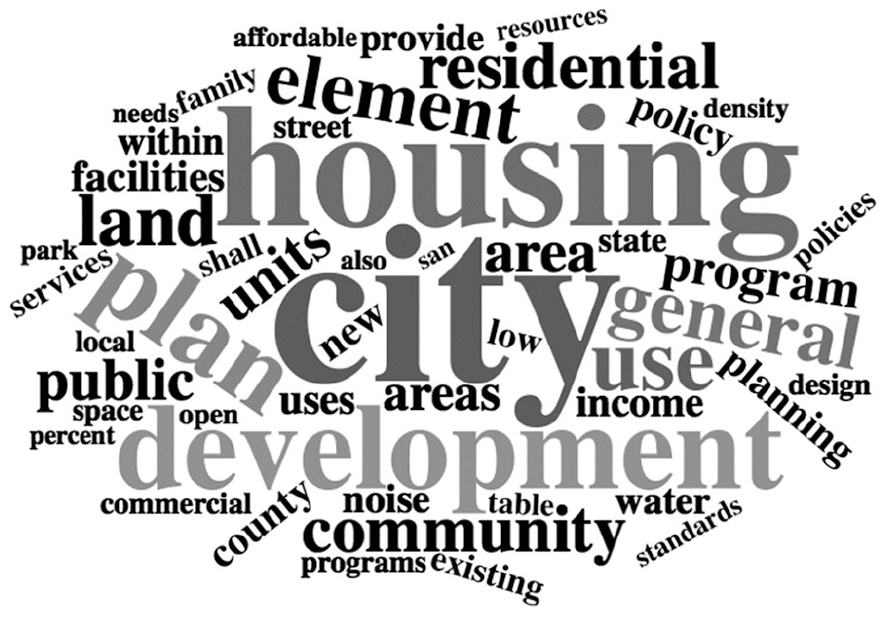
Word cloud of most frequently occurring words in City General Plans. Notice that “greenhouse gas emissions” and “transportation” are not among the top topics.
Using mathematical modeling to fit the number of topics across the corpus, we find that California city general plans contain sixty topics, going well-beyond the eight required elements. This finding highlights the range and complexity of what California plans cover. To understand, we reviewed the headings for elements within all plans. Results show that while all General Plans are required to have eight elements, many General Plans name these elements in different fashions making the identification of policy focus areas difficult across plans. For example, the required “Circulation” element is often titled “Transportation.” Cities also differ in the number of elements in each plan. Some cities provide the bare minimum of the eight elements required by the state, while cities, like the City of Davis, California, host twenty-one elements. The differences in naming and number of elements alone could not explain the number of topics across the corpus. Further, the title of the element in a General Plan leaves much open to interpretation. For example, which element should contain a discussion of energy infrastructure: “land-use” or “housing”? Wildavsky (1973) quipped that “if planning is everything, maybe it is nothing.” Our findings suggest that planning, at least in California, encompasses sixty statistically discrete topics.
California planning is not everything; there are many topics that are left out of these sixty topics, including a focus on racial equity. For example, although redlining is a prominent historical feature that has broadly shaped plan outcomes (Hernandez 2009; Hillier 2003; Nardone et al. 2020), only 20 out of 461 California city plans mentions this term (Brinkley et al. 2020), and most often only once or twice. While there are many plans that address “racism” in planning, only one (La Mesa, California) uses the term.
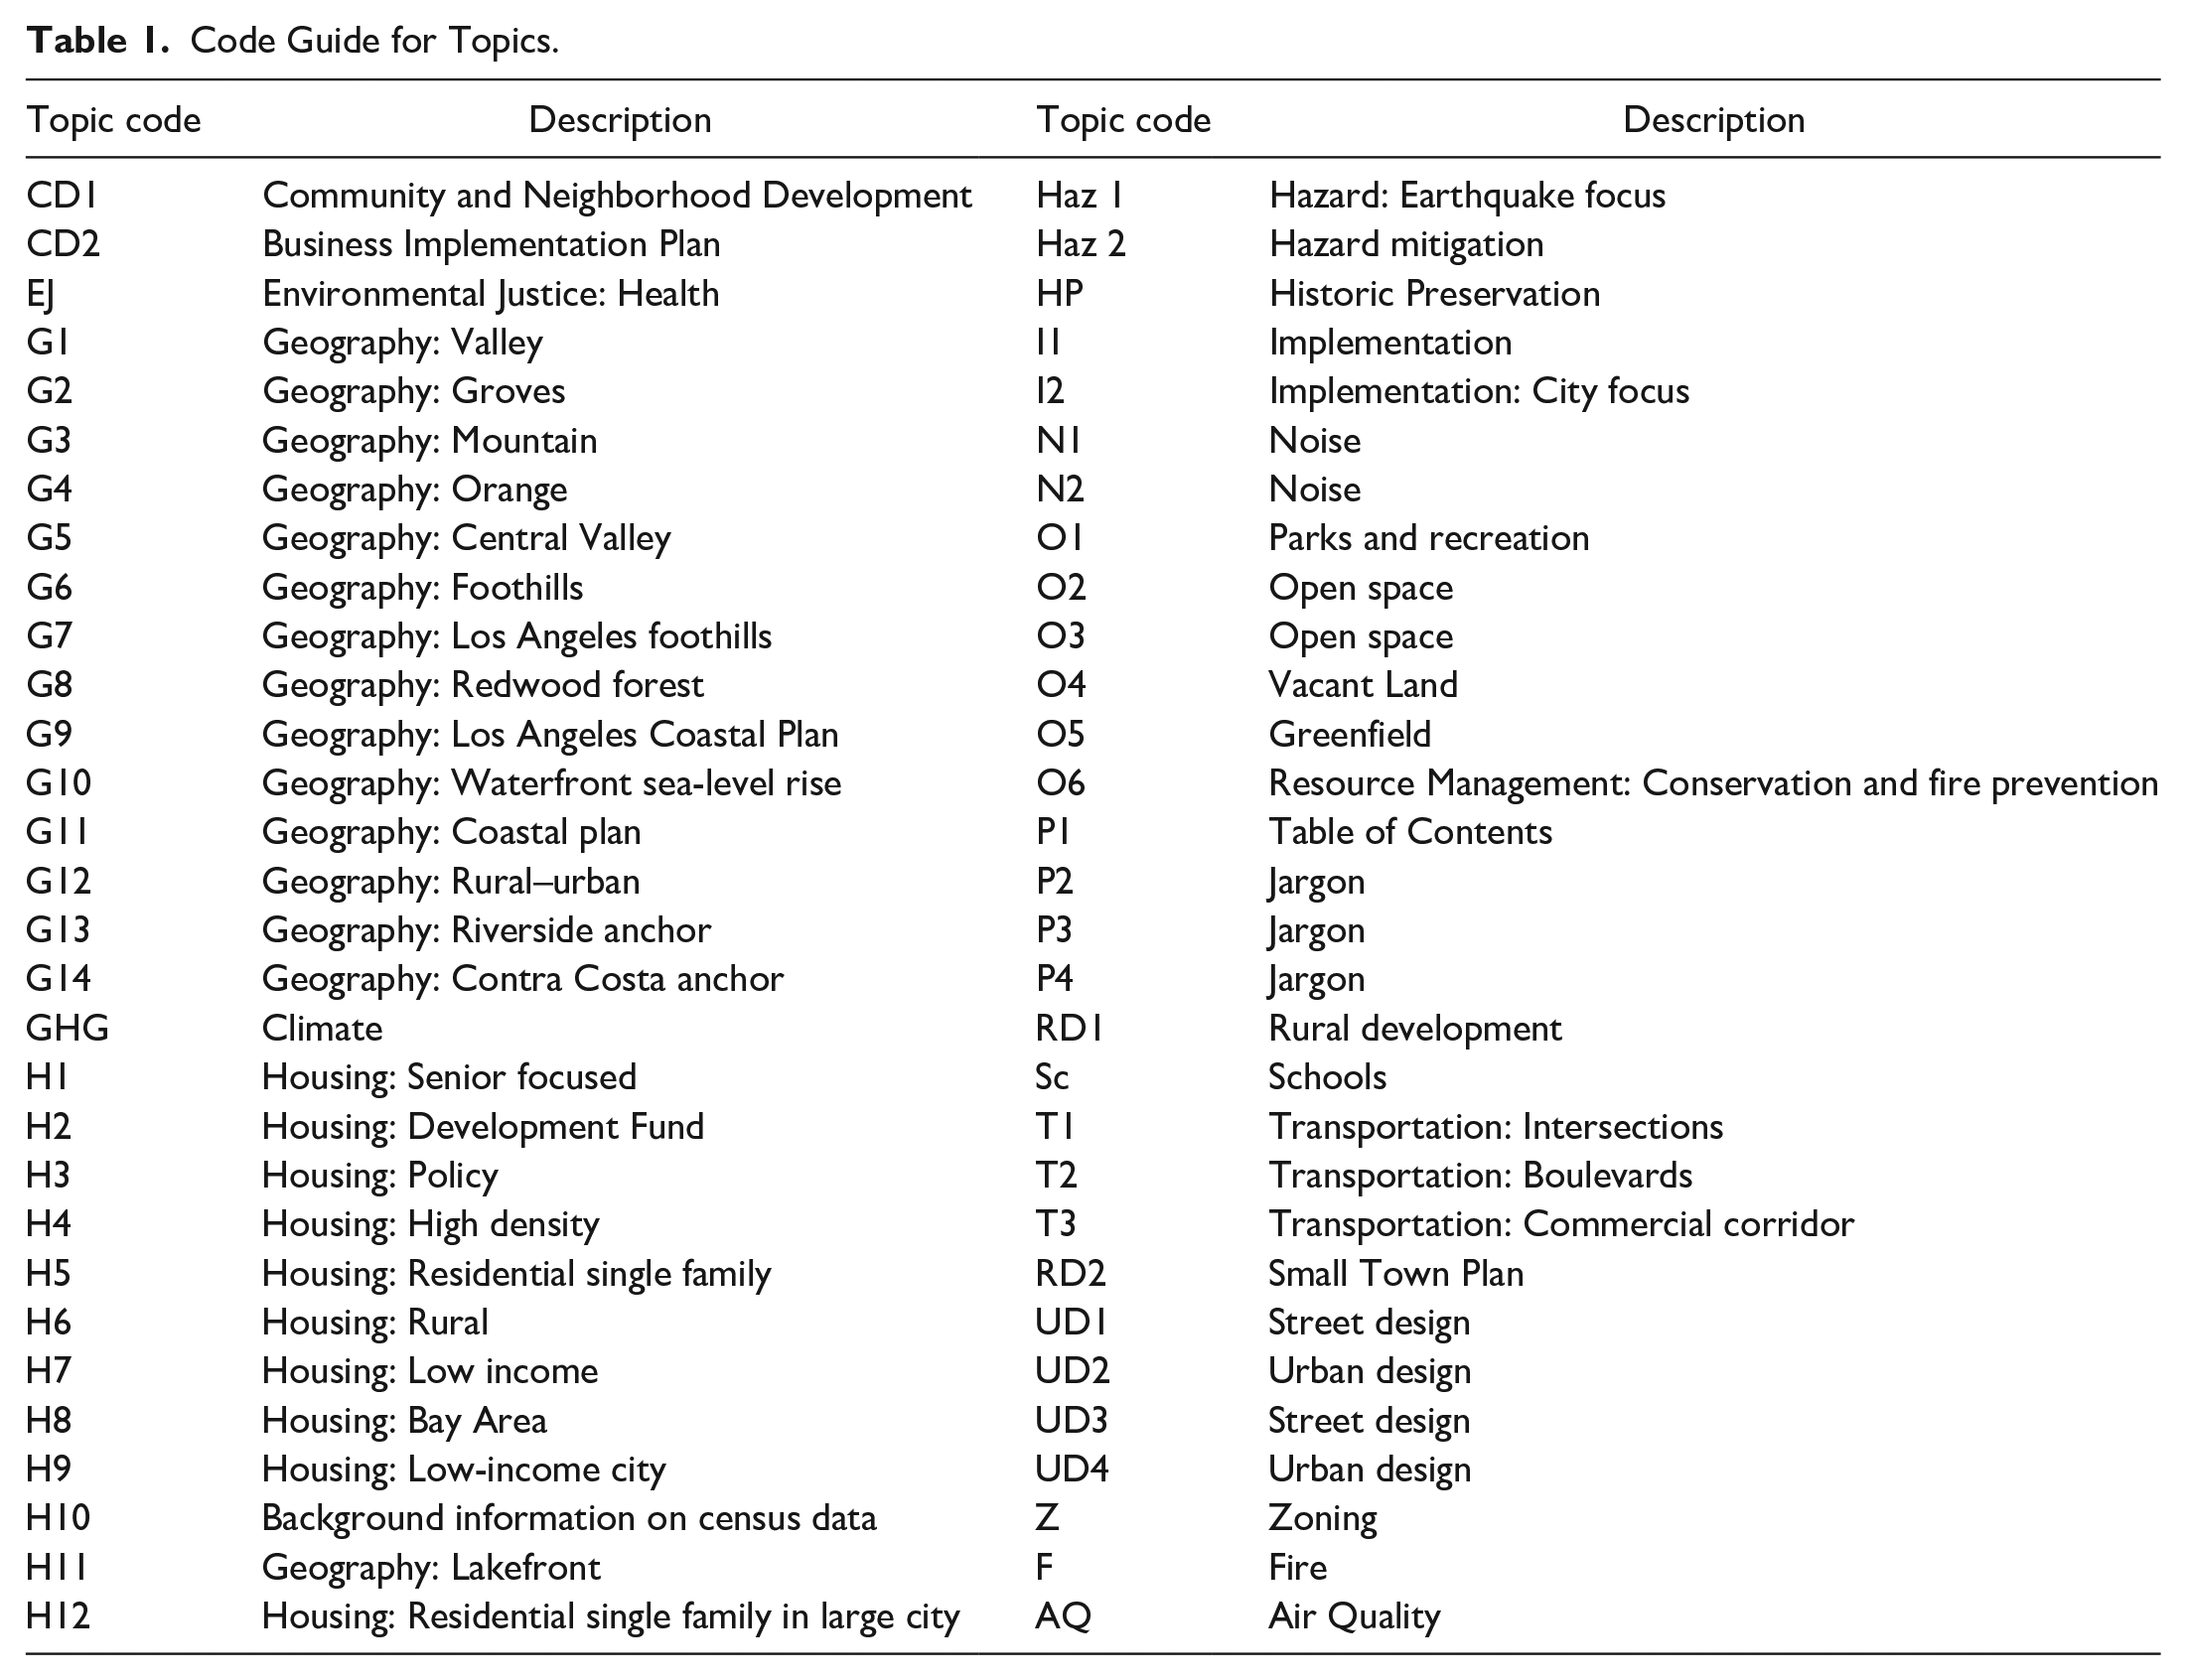
So what is the main focus in California plans? Topic distribution across the corpus in Figure 4 shows that the housing-related topics make up about 25 percent of the corpus compared with other topics. Next, geographically specific topics make up another 25 percent of the topics in the corpus (Figures 4 and 5), indicating a strong need to specifically tailor plans to geographic regions. Some reasons for geographic anchors could be regional economies. Some cities anchor their plans around specific counties, such as Contra Costa (G14) or Riverside (G13). Geographic context is also needed in natural resource planning. The topic focused on the Central Valley (Figures 4 and 5, G5) plans for the desert habitats and water use, whereas locations with redwood forests (G8) focus on preservation and fire prevention in the forest context. Similarly, waterfront plans come in three flavors: northern California coastlines (G9), bays (G10), and southern California coastlines (G11). The northern coastlines topic is focused on providing seal habitat, highways, and recreation in the context of fire mitigation. The topic related to bays (G10) is more focused on sea-level rise and waterfront developments around marinas. The southern coastal topic (G11) is focused on beach recreation, housing, and traffic planning. The topic focused on rural–urban development (G12) is most common in rural cities, and is the topic most focused on agriculture, soil, and urban growth. The rural–urban topic also discusses some of the key drivers of urban growth, such as airports, rail stations, and school siting decisions. Urban growth boundaries and historic downtown planning are commonly mentioned as methods for preserving a vibrant, small town in this topic. Planners who are particularly interested in policies specific to certain economic bases (farming) or landscapes (mountains) could select plans that fit such topics and read for specific policies that fit regional contexts using this topic modeling approach. Last, about half the corpus is devoted to the many other topics, ranging from noise to school siting. Quantification of just how wide-ranging, regionally specific, and housing-focused Californian General Plans are helps underscore the emphasis across plans as well as the required broad expertise and local knowledge needed in crafting plans.
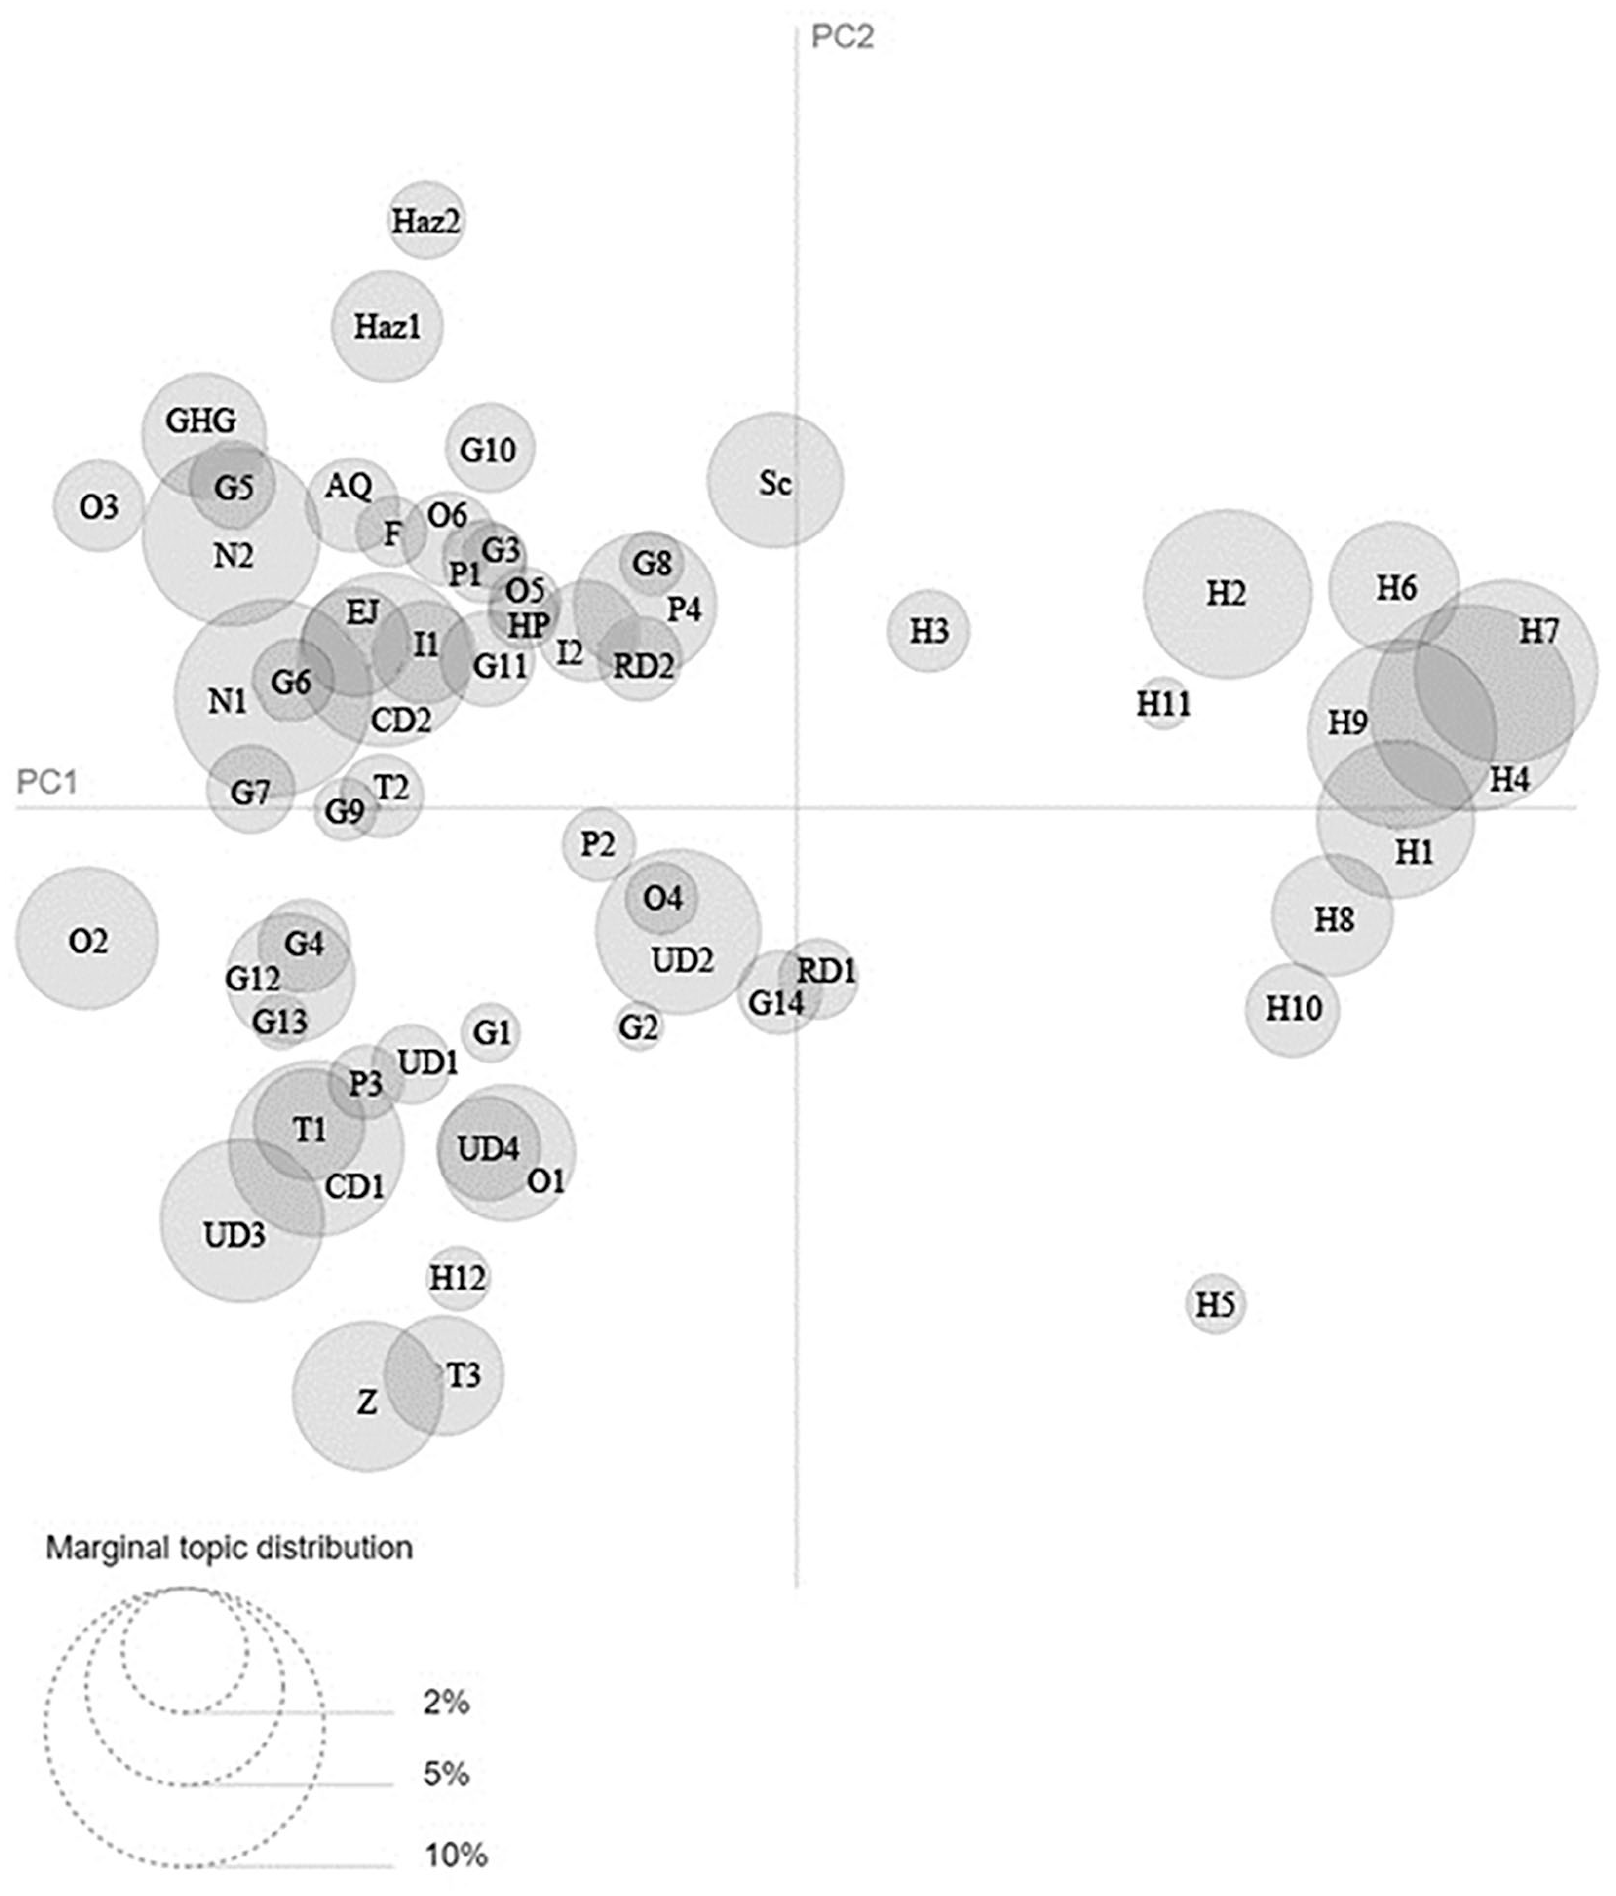
Inter-Topic Distribution Map. The marginal topic distribution notes the percentage that the topic makes up in the corpus of all 461 California general plans. Instead of representing the divergence of topics as a phylogentic tree in one dimension, this map allows us to see how topics relate in two-dimensional-space-based principal components, PC1 and PC2.
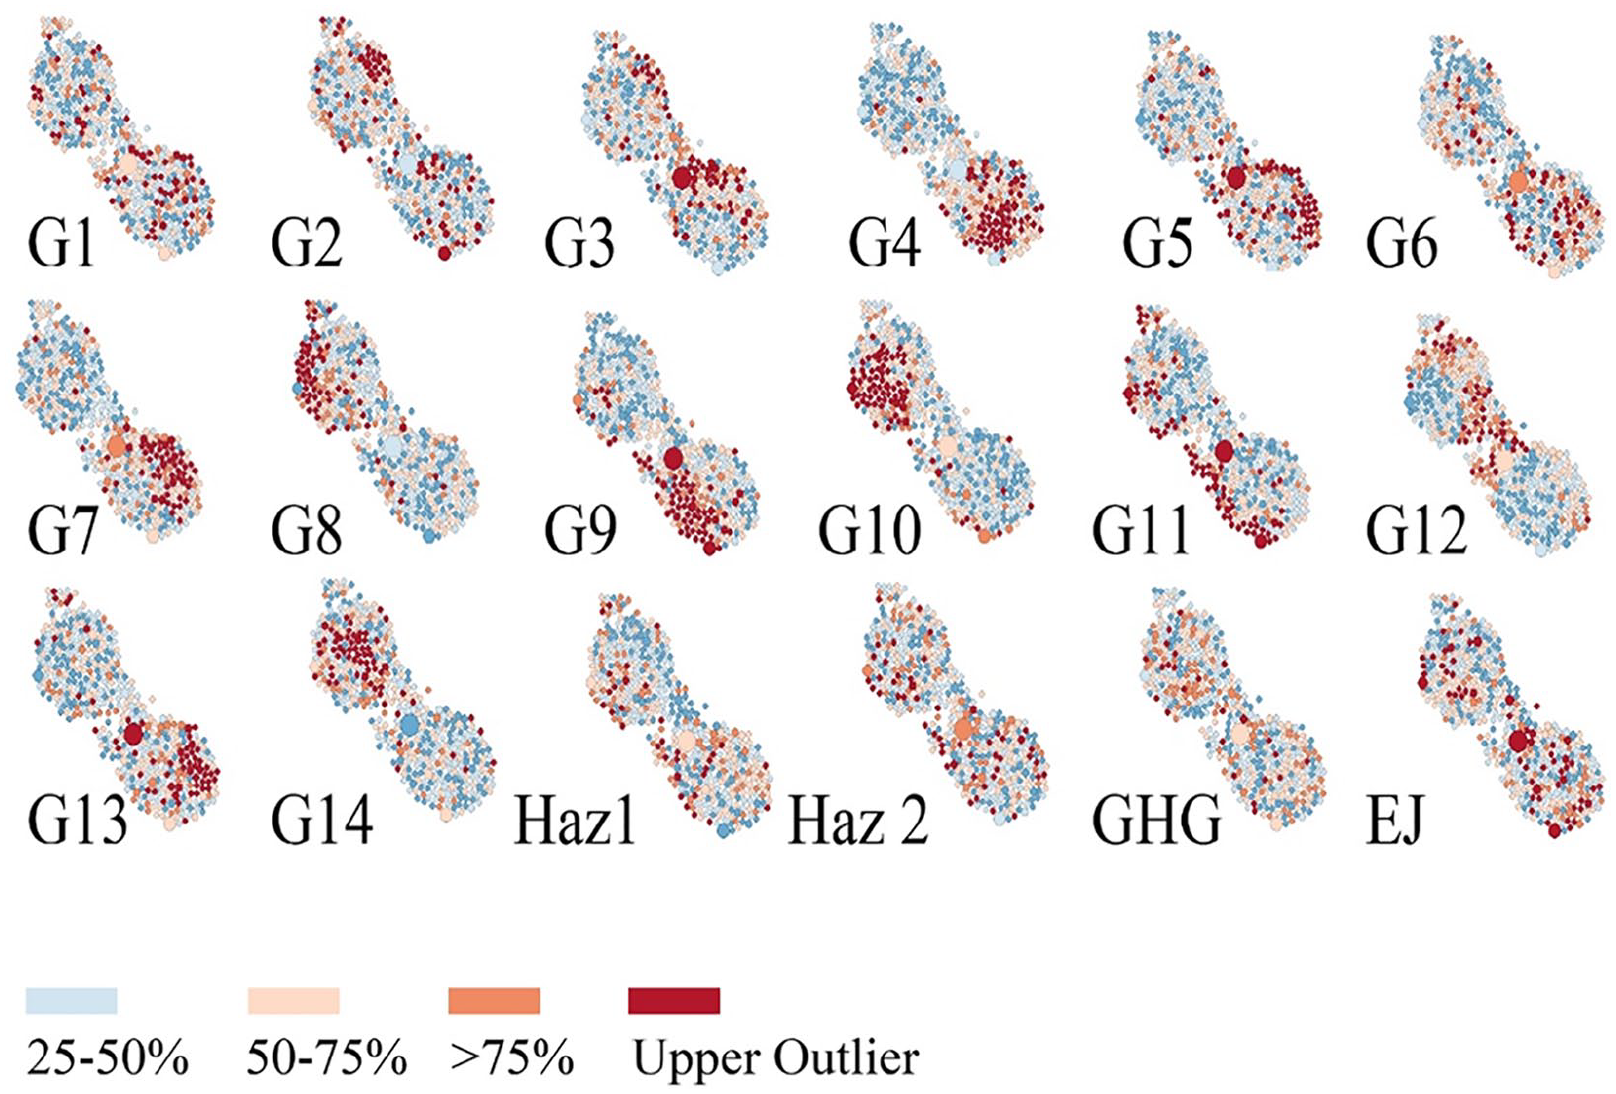
Spatial topic model fit for geographically specific topics, hazard elements, greenhouse gas emissions, and environmental justice. Refer to Figure 2 for orientation to major California cities.
Understanding how the contents of plans articulate with one another helps state agencies, advocates, and planners see where discourse is disjointed, and were changes in one topic may exert ripple effects. It is easiest to understand how topics relate to one another through correlation. No topics were strongly anti-correlated (<–.5). The most strongly correlated topics were those pertaining to Hazard Planning and Fire (.62). The four next most strongly correlated topics all related to housing (.58, .57, .54, .52) which are better explored through the intertopic distance map (Figure 4). No other topics correlated above .5.
The intertopic distance map (Figure 4) shows that housing-related topics are distinct from other topics, which tend to use similar language or recombine cross-cutting themes. For example, open space topics often discuss hazard mitigation with attention to fire prevention and management in parklands (Figure 4). We believe that housing topics are so distinct from other topics in the corpus as a result of their many updates and evolution over time. Because the state mandates Housing Element updates every five years, but the rest of the general plan is not updated, the language shared with the rest of the plan is divergent. Practically, this may result in cities creating Housing Elements that do not jive with other aspects of the plan, such as siting new roads or inclusion of parks and open space as housing is developed. Our use of topic modeling has helped quantify this divergence in discourse. For researchers and state agencies, this added context about plans may help explain instances where plan evaluation incorrectly predicts positive outcomes. For example, if housing policy is drifting further from environmental justice goals or GHG emission reduction policy, one would expect progress in one policy arena and failure in the other as housing is planned and environmental justice issues lag behind in language and action.
The housing cluster contains seven closely related topics, four more that are related, and one, focused on single family housing, that is, more distantly related (Figure 4). Each topic within the cluster provides a different flavor of housing. For example, the word “homeless” is represented in seventeen topics, nine of which are in the housing cluster. The word “affordable” is most common in the housing topics, with the exception of being tellingly absent in two topics focused on single family housing (H5 and H12, Figures 4 and 6). Similarly, these two housing topics are the only housing topics that do not mention “homelessness.”
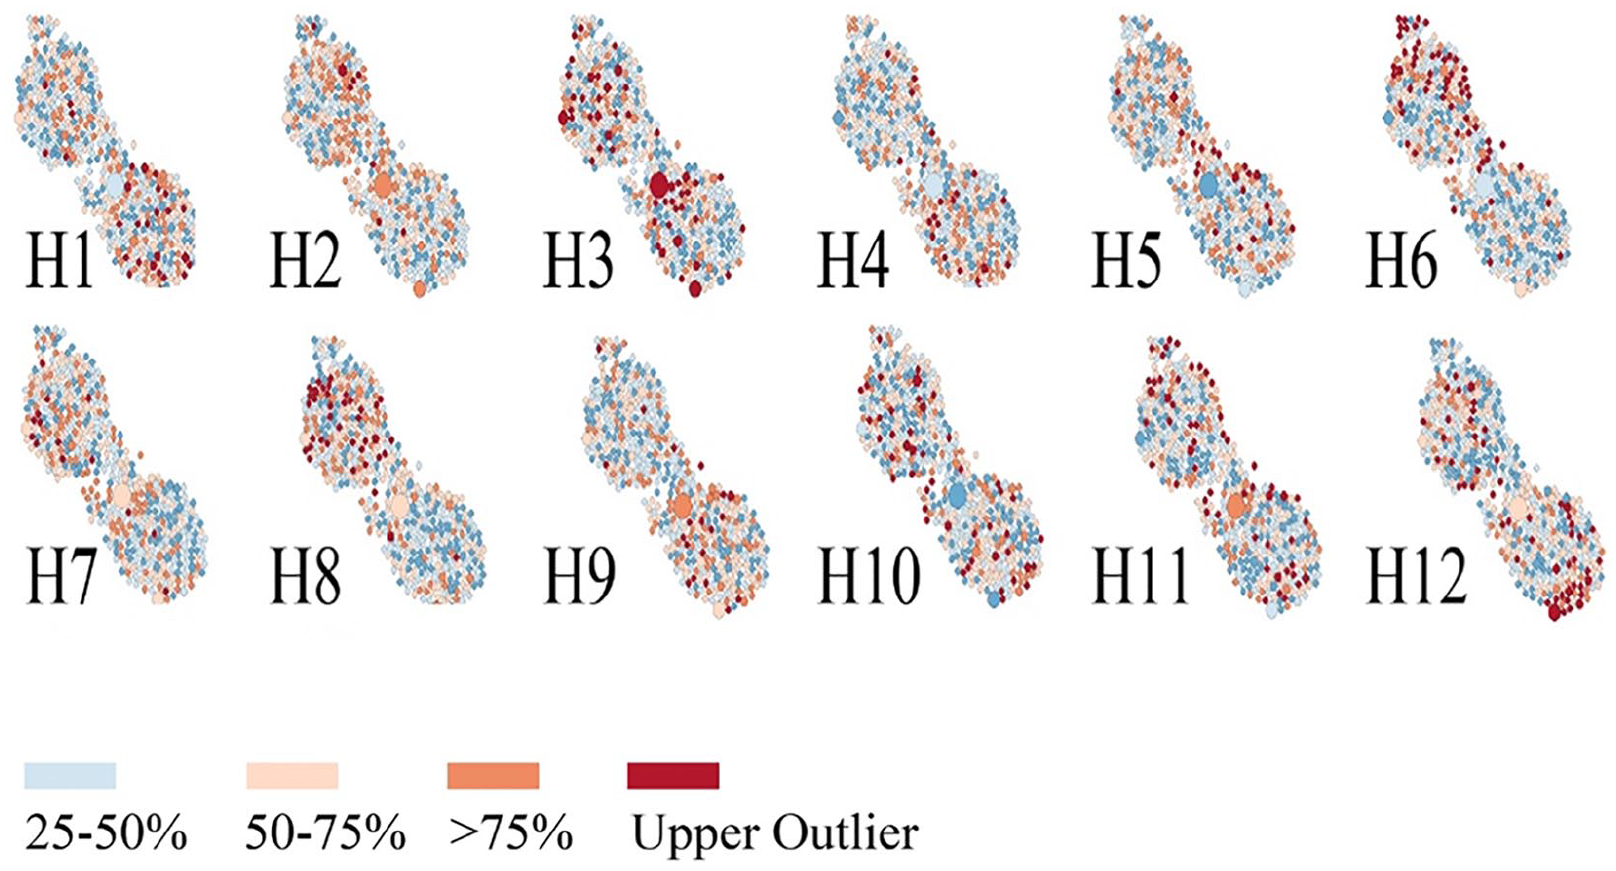
Spatial topic model fit for housing topics. Refer to Figure 2 for orientation to major California cities.
Spatial visualization of topic fit provides an easy method to classify plans that do or do not address particular housing topics (Figure 6), presenting a powerful tool for advocates. For example, fair housing advocates could highlight the cities that are selectively planning for single family homes and fail to meet regional housing needs allocations for low-income families. Two topics address single family homes: H5 clusters in smaller rural towns in eastern California (Figure 6) while H12 clusters in Southern California and is focused on developments around amenities, such as golf courses. While the Housing and Community Development agency has recommended legal action for several cities that have failed to build affordable housing, NLP tools can help capture such failure at the plan-level, ensuring better oversight and predictive future building.
Where large-scale housing projects may be successful in larger cities, rural areas appear to rely on smaller scale interventions. While topic H3 is spatially correlated with larger cities like San Francisco and Los Angeles, Topics H6 and H8 spatially cluster in northern California (Figure 6). All three topics discuss low-income housing options, but H6 covers mobile homes while H3 is focused on waterfront developments. This differentiation reveals an important distinction between how urban and rural areas plan for or identify affordable housing options. The difference in housing needs and methods of addressing affordability indicate that nuance is needed in providing technical planning support that caters to each context.
The emission and mitigation of GHGs is a focus in California planning due to CEQA regulations and is discussed across topics related to air quality, climate planning, and environmental justice. The air quality topic (AQ, Table 1) details what is emitted and is the only topic to cover “contaminants,” “monoxide,” and “ppm.” Air quality is associated with the noise and hazard of highways, a topic also covered in Noise and Safety Elements. These topics and their elements are often combined in California plans and overlap in focus with attention to transportation planning of highways (Figure 4). There is no spatial correlation of topics related to noise, but air quality is a required element in the Central Valley and spatially locates there.
Code Guide for Topics.
The mitigation of GHGs is discussed in a topic focused on climate planning (GHG), which covers energy transitions, waste infrastructure, and public transit. The cities with the best fit for the climate plan (GHG, Figure 5) are closest to the state capitol, Sacramento, perhaps indicating policy diffusion spatially. Following topic fit over time as plans are updated could help confirm such policy diffusion while yielding new insights about how to spur policy adoption.
Climate is also discussed in a topic focused on Environmental Justice (EJ, Figures 4 and 5), a term concerned with the socioeconomic impacts of pollution and mitigation strategies. Our topic model fits well with the only two cities (Jarupa Valley and National City) that have stand-alone Environmental Justice Elements in their general plans. The Environmental Justice topic also corresponds well with “Health and Wellness” elements found in several larger city general plans that address public health, food systems, and bicycle transportation. Most representative is Los Angeles “Plan for a Healthy LA.” Similar Health and Wellness elements are found in La Mesa, East Palo Alto, Lemon Grove, and Perris. Our research demonstrates that these cities are leading the charge on incorporating Environmental Justice Element requirements through their focus on health and more could be learned from a deeper comparison in future work. Where advocates seek to build planning efforts, NLP can help identify case studies of cities that have piloted policies. Similarly, state agencies provide example cities and model policies; NLP helps identify how widespread or early such “novel” planning focus already is.
While transportation planning is nominally represented by three topics in a cluster, terms are spread throughout the corpus. For example, while the word “bicycle” and “biking” are found in one (T3) of the three topics in this cluster, the word “highway” occurs across twenty-six topics, and “parking” is in thirty-three topics. The transportation topics tend to deviate based on the context of what the highways are traversing, be it farmland, coastal beaches, or mountains. This finding is of importance for state agencies in thinking about how discrete general plan elements are updated. If transportation is a topic that is spread across a variety of land uses, perhaps a better planning schema would be to infuse particular place-based topics with transportation. Similar concerns have been raised about Environmental Justice and whether it should be a stand-alone element or throughout the general plan document.
Furthermore, the combination of urban design and transportation planning in city general plans provides a practical lesson in co-teaching such topics in planning education. Four urban design topics (UD1–UD4) focus on smaller roadways and how they fit with neighborhood landscaping, school routes, and commercial areas. For example, the words “bicycle” and “pedestrian” are most common in an urban design-focused topic (UD3). The urban design topics also discuss how civic centers, land uses, and buildings that relate to one another can be connected via transit-oriented development. The Urban Design topics are the only topics to use the word “streetscape” and discuss form-based codes. Although “urban design” and “transportation planning” are often thought of as distinct subfields in planning schools (Brinkley and Hoch 2018), their use in practice has considerable overlap.
Where the urban design topics focus on physical form, the community and economic development topic focuses how to drive the local economy. Art is featured prominently as a tool for economic development in topic CD1, while business improvement districts and “Community and Economic Development” is favored in CD2. Planners and advocates who wish to make the case that community and economic development is important, although not state-mandated, can clearly identify how many plans and which plans address this topic. In this sense, NLP provides a quick method for identifying case studies to compare against planning theory and implementation outcomes.
The open space cluster consists of five varieties of open space: wildlife habitats (two), parks, vacant land, and greenfields. Two topics (O3 and O6) mention wildlife with specific reference to several species of animals and their habitats. While these topics are focused on preservation and recreation areas, they also mention fire mitigation and management. Another open space topic (O1) is focused on inner city parks as open space and their programming as it relates to community activities, such as public school events. Parks and Recreation and Historic Preservation are tightly connected topic clusters. Given that these topics are not required by the state, the reason for their clustering could be due to cities having more funds or ability to plan for such features as open space, historic preservation, and park facilities. As a result, these topics spatially correlate with larger, wealthier cities. Another topic in the open space cluster pertains to vacant land (O4) which is being re-envisioned as purpose-serving open space either for water management or recreational areas. This topic is closely related to urban design (UD2) likely as a result of common language around creating greenways and making new connections across land uses. The last topic in this category discusses open space slated for development (O5) and is the topic that contains the most mentions of the term “greenfield.” The word “responsibility” is the second most-relevant term for this topic highlighting the weight communities place on preserving or developing greenfields. Conservation advocates who emphasize equity would do well to understand how related (or unrelated) conservation topics are in relation to city socioeconomic characteristics as well as topics related to environmental justice. Such considerations across plans will help in understanding where park planning induces gentrification (Anguelovski 2016) and where conservation is “just green enough” (Wolch, Byrne, and Newell 2014).
In many plans, the hazard section is comprised of boilerplate language, providing uniformity across many cities. The Haz1 topic in this cluster contains words related to various events such as flood, fire, and earthquake, while the other topic (Haz2) pertains to response agencies at local, state, and federal levels. In general, Haz1 spatially locates along the coastline, and discusses earthquakes and evacuation routes (Figure 5). With an increase in extreme weather events, the language in these topics may shift from boilerplate to dynamic considerations of managed retreat and resilience planning for the most vulnerable neighborhoods and community members. NLP is an excellent tool to track such planning policy language change over time and space.
If one considers the mention of demographics across topics, age is an easy denominator. The term “child” is predominantly featured in the housing section (presumably as plans discuss the average number of children per household) as well as the Health and Wellness sections of plans in the Environmental Justice topic. The schools topic (Sc) lies between the housing topics and the rest of the corpus in the intertopic map (Figure 4), indicating its important function at the nexus of housing policy and community development/social planning. While General Plans and city councils do not have jurisdiction over public school siting or policy, the importance of this topic is evident as it relates to the housing market and other development needs. “Youth” is mentioned most in the topic on schools, but is also featured in five other topics: parks and recreation topics (O1), community and neighborhood development (CD 1), climate plans (GHG), urban design (UD4) in considering school routes, and housing (H12). The needs of seniors are most commonly featured in topics concerned with senior housing but are also discussed in community development, parks and recreation, and urban design for streetscapes. The policy emphasis areas are important for advocates who may want to make the case for greater emphasis in other parts of the plan.
Conclusion
The overall goal of this project is to build capacity, with resources (accessible data and planning frameworks) that inform the decision-making processes among public agencies and the constituents they serve. In doing so, this research helps to question the current formatting of General Plans. Are the required elements enough? Should elements, such as transportation, stand-alone as a chapter in the General Plan, or connect more explicitly with other related topics, such as school siting, housing, and urban design? Similarly, is it a problem that housing is so separate from other topics and not better integrated? Could this be an indicator of why California has a housing crisis? Below, we describe how future work can explore the underpinning drivers of the observations we presented here as well as the future of NLP in planning studies and practice.
Discussion of Findings
Our searchable state-level database of general plans (Brinkley et al. 2020) is the first for California—and nationally. This landmark geo-coded database can provide a platform for research and advocacy beyond the objectives of this study, advancing knowledge for scholars and communities on planning, public engagement, policies for public health, and GHG mitigation strategies. We anticipate that this approach will become a model for other states. Plans are lengthy, and even planning officials can be unsure about General Plan content as evidenced by California’s annual planning survey. A simple search function across plans can help even non-planners find key words of interest.
Exploratory and more targeted NLP research into plan contents will also help advocates, state agencies, and the planning field. While California offers the ability to compare rural with urban, forest with coast, and mountain with desert, the addition of cities from other states will help planners better understand how a variety of regionally, temporally, and culturally based policies meet the needs of constituents across the nation. Indeed, the topic profile for cities in Texas may be markedly different than that of California, reflecting unique state-level planning cultures. Understanding such differences across plans will undoubtedly inform planning practices.
Although the painstaking effort of collecting plans at the city-level would be easier with centralization in data and formatting, our findings also highlight the need for sensitivity in state mandates. For example, the California Building Standards Commission recently enacted a requirement that all new homes built after 2020 will have solar roofs. Such a mandate may be effective in sunny Southern California, but less effective in forested northern areas where rooftop solar panels will be shaded (Simons and McCabe 2005). As the topic models reveal, nearly 25 percent of the General Plan language is specific to regions. No doubt, effective climate planning policy varies by region. Computational linguistics can help rapidly assess plans for regional variations in topical focus areas, helping states to identify novel local policies that can be further amplified within their suitable regional context.
Our findings should be of immediate interest for California planning advocates. For example, by 2030, California’s population is projected to reach 44.1 million. Annual growth rates are expected to be just under 1 percent, similar to growth experienced in the first decade of this century. As our topic model shows (Figure 4), plans for affordable housing are not evenly shared across communities and the housing topics appear to be drifting away, at least linguistically, from the rest of the planning corpus. Furthermore, the State has noted that forty-seven cities are out of compliance with housing supply law required in the Housing Element; the state is suing the largest of these cities, Huntington Beach in Orange County, with threats to follow suit on other cities who do not update their Housing Elements (Dillon 2019). Should the state choose to use our database to gather information on not only how much housing is planned in each city and county, but the context around such plans, officials could more accurately guide housing planning and provide support for model plans that fit within their regional contexts. Future plan evaluation can correlate individual housing topics with plan outcomes to help inform advocacy efforts.
Such considerations are pressing for hazard planning with increasing extreme weather events such as drought, fire, and sea-level rise. The 2018 Camp Fire was the deadliest and largest fire in California history, killing eighty-six people and burning more than 150,000 acres in the Sierra foothills (CalFire 2019). As the Butte County General Plan notes, there has been a sharp increase in housing built throughout the foothills since the 1970s as a response to the comparatively “low cost of living” enjoyed there compared with the central city of Chico (Butte County 2018). Arguably, pushing development into the foothills contributed to the large death toll. Subsequently, the fire has displaced 50,000 people, and added to the housing crisis in nearby towns and cities. If states are to responsibly manage natural resources in the face of climate change while cities and counties control land use, states will need to understand what is in local plans and how to support more equitable regional land-use planning. Here, the rift between housing topics and hazard planning (Figure 4) is concerning. For example, if most cities in forested areas have fire mitigation strategies near housing, but one does not, pointing this out could help rectify the oversight and trace the lineage of deviations to plan authors, population characteristics, unique environmental contexts, or socio-political ideologies. The combination of computational linguistics to identify policies and spatial regression to map their impacts will provide considerable predictive modeling for future development scenarios for both state, nonprofit, and commercial use.
Future Methodological Considerations and Limitations
Greater Processing Power
Beyond the findings in this exploratory research, we conclude with a discussion of the benefits and shortcomings of a NLP approach to plan evaluation. Ryan (2011) urged planners to “formally read through plans, not simply . . . grasp their essential ideas.” NLP is not a substitute for formal reading, but it can help provide context over a large dataset to target in-depth reading. Most notably, the length of planning documents and the breadth of topics makes systematic assessment difficult for planners, state agencies, and community advocacy groups. There are few studies, and most compare tens of plans (Berke and Conroy 2000: thirty plans; Conroy and Berke 2004: forty-two plans; Brody 2003: thirty plans). In their meta-analysis of plan evaluation, Berke and Godschalk (2009) note only sixteen plan evaluation studies over a twenty year period from 1997 to 2007. Studies range in comparison from seven to ninety plans with an average of forty-six plans analyzed, and most evaluations focused on hazard mitigation (seven of sixteen; Berke and Godschalk 2009). Our conceptual research demonstrates a capacity tenfold greater. While qualitative coding can be done on large sample sizes, the academic labor required is incredible. More recently, a team of thirty authors qualitatively coded climate action plans from 885 European cities (Reckien et al. 2018). With NLP, it would be possible to replicate such an undertaking more regularly.
Such processing power is needed to answer some very longstanding questions in planning. Talen (1996), Baer (1997), Laurian et al. (2010), and many others have despaired over the lack of empirical research on plan contents. If reading the plan and qualitative coding was barrier, NLP makes it all too easy to churn out empirical research. Indeed, planners are already using NLP techniques to understand large bodies of public discourse that inform plans (e.g., Han, Laurian, and Dewald 2020). The research we present here is the first to apply NLP techniques to planning documents, but we believe the surge in research that uses NLP to correlate plan contents with trends is inevitable.
Finding What You Weren’t Looking For
Topic modeling is a powerful exploratory technique with some unique advantages to qualitative coding. Although it does not provide a ready-made answer, it points the researcher toward interesting areas of the dataset. For example, Berke and Conroy (2000) evaluated thirty plans using six pre-coded sustainability themes and their attending techniques to understand how plans addressed sustainable development. They found that plans did not address their pre-coded themes evenly, nor did the highest scored plans correlate with cities that produced sustainability outcomes. Such findings have led researchers to wonder “do plans matter?” (Knaap, Hopkins, and Donaghy 1998) while plan evaluators make such flat statements as “that plans work in urban development is a claim that lacks theoretical and empirical backing” (Lai 2018). With NLP, it is possible to explore other possibilities more rapidly and thoroughly. In the Berke and Conroy (2000) example, especially because of the small sample size, NLP might have identified any number of topics that correlate with successfully implemented sustainability policies. What could be more surprising is that some of the correlates in planning language found by NLP may not address sustainability directly in topical focus. For example, Liao, Warner, and Homsy (2020) track 651 U.S. local governments’ adoption of thirty-four sustainability actions from 2010 to 2015 and find that local governments with higher levels of sustainability actions articulate social equity goals, engage the public, and promote interdepartmental coordination. Perhaps “social equity” and “engagement” are topics that Berke and Conroy (2000) should have looked for, but did not due to the researcher-led assumptions that went into their qualitative coding methodology. NLP allows researchers to cast a wider net in coding planning topics. But, as with any research, the findings are dependent on the researcher’s assumptions and coding interpretations.
Machine learning does not remove the researcher or researcher-induced errors. A topic is a set of word probabilities. Interpretation depends on planning expertise. Like contextual readings of plans, interpretations are subjective. Planning researchers will need to be mindful of various interpretations and to avoid spurious correlations as they make meaning between plan contents and other variables, such as community socioeconomic characteristics or social media discourse surrounding plan making.
Furthermore, NLP does not remove the need to read plans. To validate the NLP model in this study, we read plans. Moreover, the frequency of a term’s use or presence of a topic does not necessarily represent import. Sentiment analysis helps note where a term is used positively or negatively, but reading a plan and understanding the context outside the plan will help to understand if a highway is planned through Chinatown. NLP is not meant to substitute for such contextualized reading, but can help categorize a corpus of plans and their contents to target further reading of plans.
Where the approach taken in this research is exploratory, a more targeted NLP approach could be used to read plans for specific topics and see how well the pre-defined topics fit with what is in plans and planning outcomes. For example, algorithms could be trained on state mandates for plan focus areas, and plans could be analyzed based on how well their content matches state recommendations. This information would help state agencies identify where plans fit, but outcomes do not follow. One would hope that this information would help shape more supportive state guidelines. In their enthusiastically titled research “Plans Can Matter!” Burby and Dalton (1994) review 176 land-use plans across five states and note that state mandates are important to implementing natural hazard planning. Do plans adopt state-mandate language for other topics and with similar positive outcomes?
To this end, variation in topic fit may not be bad. Deviation from state policy could be an indicator of policy diffusion and evolution. In constructed phylogenies of legal text (Rockmore et al. 2018), the supposition is that imitation is a form of flattery for good ideas, and deviation represents innovation over time to alternate approaches. Some imitation, however, may result, not from repetition of good ideas or topical foci, but from planning firms using boilerplate language. In such cases, the similarities in plans are less about regional differences in planning needs or community values. Controlling for which planning firms aided in plan creation is one way to work around this issue. Furthermore, future work could trace the change in planning language over time, revealing larger patterns in how planning norms change, and at what pace.
Planning pedagogy
In comparing the topic domains from this research with well-developed areas of planning knowledge (Brinkley and Hoch 2018), there is substantial overlap. Noticeably, emerging disciplines within planning, such as climate planning and food systems planning, are represented in topic contents. Future work could tease out the combined influences of food system planning expertise (Pothukuchi and Kaufman 2000), education (Hammer 2004), and advocacy databases, such as Growing Food Connections (Raja, Raj, and Roberts 2017) that fed into food systems planning topics. Similarly, researchers could follow topics related to climate planning (Bassett and Shandas 2010; Boswell, Greve, and Seale 2010; Wheeler 2008) to both extract policy information on plans that are in practice and compare them with current research, theory, and implementation.
Conversely, some required elements of general plans do not pertain to planning areas of expertise. Noise and Air Quality are two prime examples of state-mandated General Plan sections that do not fit with current planning expertise. Because such elements have been required sections of California plans for more than twenty years, it is difficult to assess whether new state requirements, such as Environmental Justice, will prompt the creation of new planning expertise. In this sense, the comparison of the evolution of planning disciplines (Brinkley and Hoch 2018) with California plans is inconclusive as to whether the practice of planning influences the study or vice versa, an important subject as planning schools seek to prepare students to respond to practice demands.
Reading Between the Lines
A wider reading of plans for the conspicuous absence of topics may reveal a much longer and winding history for some planning topics in study and practice. Reading for the absence of terms and topics will require planning expertise that, arguably, both planning researchers and the algorithms they direct have woefully lacked. As noted, the California corpus of city plans has included a focus on environmental justice well before the state mandate. Yet, many plans lack the historical framing of racial equity problems that they are now mandated to proactively solve. Only one city plan out of 461 uses the word “racism.” As planners have worked to involve various “interest groups,” such as women and planners of color (Solis 2020), a keener focus on representation in planning pedagogy, plan making, planning topics, and resulting outcomes of justice are on the rise. This is tentatively good news. After all, machine learning algorithms “learn” only what we teach them.
More than ever, there is need for caution in the face of hubris when deploying machine learning techniques; namely, because they can amplify researcher bias. As the adage goes, “to err is human, to really screw things up takes a machine.” As Figure 2 highlights, many small cities have struggled to update their General Plans due to the cost and personnel time needed. It is the long-term goal of this research to make general plans easy to search, compare, and, as a result, revise. In the not too distant future, it might be possible to feed a predictive text algorithm with the right mixture of regional context, population characteristics, and state mandates to generate a plan. Even if such a plan “read well,” would it reflect the needs of the community? Perhaps such automated drafting can provide a rough draft for community discussion and editing, or perhaps the predictive nature of algorithms will not be able to keep up with the innovation of collective human efforts. Now that we can quickly read across many plans, we will naturally have more questions about how to cultivate their evolution—and our own by their design.
Footnotes
Acknowledgements
This research was possible because of dedicated undergraduate research students, Jose Flores and Muthia Faziah, who helped assemble the data. Their enthusiasm and success after graduation as community developers paints a bright future for planning. We also thnk the 2019 Santa Fe Institute summer fellows and program leaders for feedback on early conceptual models.
Declaration of Conflicting Interests
The author(s) declared no potential conflicts of interest with respect to the research, authorship, and/or publication of this article.
Funding
The author(s) disclosed receipt of the following financial support for the research, authorship, and/or publication of this article: This research was supported with a grant from the National Institute of Environmental Health Sciences of the National Institute for Health.
