



Abstract
Opportunity assessments have served as crucial tools for advocacy and policy-based action to address variability in spatially distributed urban opportunity. However, despite the vast body of theoretical and normative frameworks for discerning the effects of space, the current practices of opportunity mapping do not provide grounded assessments of differences that disproportionately affect the poor and racial minorities. We analyze seventeen opportunity assessments from the last twenty years and find issues of construct validity, implicit racial bias, and limited interpretability of outputs. More importantly, symptomatic outcomes of historical marginalization are conflated with problems of material access in poor and minority neighborhoods.
Introduction: Opportunity and Spatial Justice
Scholarship from multiple disciplines views neighborhoods as central determinants of life chances (Jencks and Mayer 1990; Sampson 2008, 2012; Small and Newman 2001; Wilson 1987). Empirical investigations have documented a range of social and economic outcomes (Galster 2012; Galster and Killen 1995) brought forth by the influence of uneven geography of residence on individual aptitudes, education outcomes (Chetty et al. 2018; Chetty, Hendren, and Katz 2016), the physical and mental health of children and adults (Diez Roux and Mair 2010; Gray et al. 2018; Tampubolon 2009), and labor force participation (Cheshire 2012; Darcy and Gwyther 2011; van Ham et al. 2014). Academic interest in these associations has spurred a large body of literature on “neighborhood effects.”
The neighborhood effects literature, in turn, has spurred scholarship on methods to identify “neighborhood” spatial units and assess variability across city regions. Historically, advocacy and analyses that use assessments of spatial isolation and segregation have been compelling, especially within the realm of housing policy. These assessments have led to several hallmark consent decrees and quasi-experiments, including the Gautreaux Consent Decree (1976), Moving to Opportunity (MTO) for the Fair Housing Demonstration Program (1994), and the Thompson Consent Decree and resultant Baltimore Housing Mobility Program (2012). In more recent times, the Department of Housing and Urban Development’s (HUD) short-lived Assessment of Fair Housing (AFH) protocol (2015) attempted to promulgate analysis and accountability by institutionalizing spatial opportunity assessment as one way to account for housing fairness.
The practice of evaluating and mapping relative differences in access and deprivation within urban geographies is called “opportunity mapping” or “opportunity assessments.” Based upon the precedent set by Thompson v. HUD (1995), local governments, community nonprofits, and research institutions extensively make and use opportunity assessments for advocacy, policy analysis, planning, and, more generally, as a reflective tool. However, contemporary “opportunity assessments” have evolved into collections of regularized practices that inform proposals for soliciting HUD and other local funding. The newer opportunity assessments build on but are different from former assessments in that they are considered a formal planning technique and are marketed and consulted upon as a product, similar to environmental assessments. While the stated goal of opportunity assessments has always been racial and spatial fairness, the current process and methods of opportunity quantification and mapping often have the effect of stigmatizing the very social groups they purport to emancipate (Chapple and Goetz 2011; Goetz 2017).
We believe that for opportunity assessments to be truly relevant in the pursuit of racial and economic justice, we must engage in a bottom-up conceptualization of opportunity by evaluating the types of goods, institutions, and services essential for the social groups we intend to serve. Moreover, there is scope for opportunity assessments to serve as more than collections of data by being more sensitive to poverty and racial marginalization and assisting in organizing and advocacy. Therefore, in this paper, we systematically analyze the conceptual and operational dimensions of current practices to highlight critical issues and provide a reflective agenda for future spatial assessments. To do so, we use select plan quality evaluation criteria (Berke and Godschalk 2009) and assess seventeen opportunity maps prepared at different scales in various parts of the United States. Our research provides three critical contributions to scholarship. First, we provide crucial evidence for some of the well-established critiques of opportunity mapping while refuting some others. Second, we provide nuanced insights into issues that have resulted in problems pointed out by other scholars. The most notable may be the issue of conflating symptomatic outcomes of historical marginalization with problems of material access in poor and minority neighborhoods. Finally, we provide a crucial exploratory framework for research on spatial, analytical, and planning practices that future researchers can build on.
Literature Review
Definitions of Spatial Opportunity
The Chicago School of Sociology established “neighborhoods” as influential spatial units in determining social and economic outcomes in the United States (Burgess 1925; Park and Burgess 1925; Wirth 1938). Evaluations of concentrated poverty, prolific during the civil rights movement, consolidated characteristics associated with white, affluent neighborhoods as the hallmarks of spatial opportunity. By contrast, these studies relegated low-income and minority neighborhoods as lacking social role models and peer influences necessary to overcome the “culture of poverty,” thus resulting in negative intergenerational consequences (Lewis 1968). These initial theories of the deeply entrenched structural nature of neighborhood differences evolved into “neighborhood effects,” studied extensively in sociology and epidemiology (Arthurson 2002; Sampson 2012; van Ham et al. 2014).
Newer definitions of the “opportunity” include a more complex understanding of the interactions of spatial opportunity bundles with historical disadvantage, parental mediation, compounding effects of life decisions, individual attributes, and particularly the ability to convert “access” into a personal advantage (Galster and Killen 1995; Galster and Sharkey 2017). Jason Reece at the Kirwan Institute for the Study of Race and Ethnicity, which pioneered and prepared a large number of opportunity maps and assessments in the United States, defines opportunity as “a place that provides access to quality schools, healthy food and recreational options, stable and supportive housing, sustainable employment, and strong social networks.” Conversely, according to Reese, “opportunity-deprived communities lack access to steady employment, essential services, and good schools, and often live in unsafe environments” (Reece et al. 2013, 1). While most scholars and practitioners understand that heterogeneity and intersectional personal, familial, and community attributes, and stages in the life cycle, change perceived opportunity (Lung-Amam et al. 2018), they essentially agree with Reece’s definition of opportunity neighborhoods.
Linkages Between Practice and Policy
Results from early mobility experiments and programs, including Gautreaux (1976) and the MTO demonstration (1994), provided the impetus for assessing spatial geographies within cities as bundles of opportunity. The current practice of opportunity mapping, predicated on the results from these experiments, gained momentum following Thompson vs. HUD (1995). john powell, serving as an expert witness for Thompson in the class action suit, presented a series of maps indicating locations of good school districts, jobs, transportation, and high-quality neighborhoods in the city of Baltimore, contrasted with the residential locations of racial minorities (Reece et al. 2013). The settlement led to the Baltimore Housing Mobility Program, new incentives for affordable housing, civil rights reviews, and several other initiatives.
Regional equity paradigms reinforced by HUD’s Sustainable Communities Initiative (SCI; 2010), which sought to integrate housing and transportation to access affluent neighborhoods, provided further impetus to analyzing spatial differences in city regions. Later, the Affirmatively Furthering Fair Housing (AFFH) rules (2015) developed during the Obama government highlighted the importance of a regional scale for housing equity concerns and evaluation of spatially distributed opportunity. Thus, the practices of centering on spatial dimensions of fairness and equity have been reinforced over time by judicial action and housing policy. Furthermore, evolving housing policy directions have also influenced the nomenclature and methods of spatial opportunity assessments.
Critical Reflections on Practice
The practice of opportunity mapping has received many critiques in the past decade, and we present some of the significant ones here. Scholars have noted that universalized conceptions of opportunity are reductionist and fallacious (Goetz 2017). As discussed earlier, what people seek and need in spatially distributed goods and services vary based on multiple complex attributes. In the absence of a means to capture this heterogeneity, opportunity assessments remain limited in their usefulness (Lung-Amam et al. 2018).
Knaap (2017) notes that opportunity mapping has relied extensively on grouping variables concerning disparate phenomena, like real estate market conditions, poverty variables, and housing variables, into topical domains with little theoretical justification. Thus, opportunity mapping is rife with issues of construct validity. In addition, attempts to operationalize “opportunity” rely on a diverse patchwork of empirical evidence, with an overreliance on readily available secondary datasets. Furthermore, the current index construction methods tend to oversimplify assumptions and deem variables to have linear, equal, and independent relationships to opportunity categories.
Low-income and racially marginalized communities, the groups intended to be served by spatial assessments, often rely on organizing, activism, and place-based development through community institutions to assert access and rights and negotiate political spaces. Yet, unfortunately, opportunity assessments have perpetually stigmatized these same groups as being associated with lower opportunity and fail to acknowledge their community assets and place-making efforts as crucial vehicles of spatial opportunity (Chapple and Goetz 2011; E. G. Goetz 2017).
While many scholars have noted limitations in the practice of opportunity mapping, in scholarship, we do not see a systematic investigation of the quality of opportunity mapping documents. Thus, while we seek to fill that gap, our primary purpose in this scholarship is to evaluate whether the current practices in opportunity mapping fulfill the original goal of evaluating space—the pursuit and restitution of racial and economic justice through spatial justice.
Research Questions and Rationale
This paper critically examines opportunity maps to assess the linkages between theories, mapping procedures, and policy perspectives for ameliorative action. We do this to question how well a technical process interfaces with a deliberative and political one and to think about how some of the trade-offs and decisions made in the opportunity mapping process have significant consequences in pursuing spatial justice. We explore these issues through the following two research questions:
Data and Method
Our initial research on the effects of spatial contexts in perpetuating structural inequalities led us to opportunity assessments as tools for discerning and quantifying spatial variability. When we started our research, the HUD’s AFFH data documentation (2017) also included tools for constructing opportunity indices for local jurisdictions seeking Community Development Block Grant (CDBG) funds. These new compliance requirements further piqued our interest, and we began studying opportunity assessments around the country. Many institutions, including municipal, county, state agencies, research institutions, and nonprofits, initiate and prepare opportunity mapping exercises internally or through consultants.
In most cases, the stated objective is the pursuit of spatial fairness. In their current form, opportunity assessments include analyses of latent constructs of opportunity in the form of educational opportunity, economic opportunity, housing, and neighborhood quality, all of which are quantified and constructed visually on maps of cities and city regions. Thus, these documents are more like studies and focus on aggregating data of spatial variability in a local context. The assessments typically include a report and a set of maps. In this study, we evaluate the documents and the maps, which we together refer to as “opportunity assessments.”
Data Collection
Initially, we collected and studied nineteen opportunity assessments by searching for “opportunity maps” or “opportunity assessments” using the Google search engine. We attempted to include diverse geographic scales (city, county, state) and spatial geographies throughout the United States through these searches. Later, we came across other types of assessments that used similar data aggregation and spatial analysis methods but did not use the term “opportunity” in their titles. For instance, the document “Mapping Child Wellbeing in Duval County” is, in fact, a comprehensive spatial opportunity assessment for children in Duval County, Florida. In addition, the Kirwan Institute changed the nomenclature of its assessments from older “opportunity mapping” to newer “regional equity assessments,” in line with their changing purpose. Also, other methods of evaluating spatial fairness, such as equity maps (Talen 1998) and neighborhood wellness indexes (for instance, see the city of Champaign’s Neighborhood Wellness Index 2006), are similar to opportunity assessments in the way they aggregate data and present spatial differences.
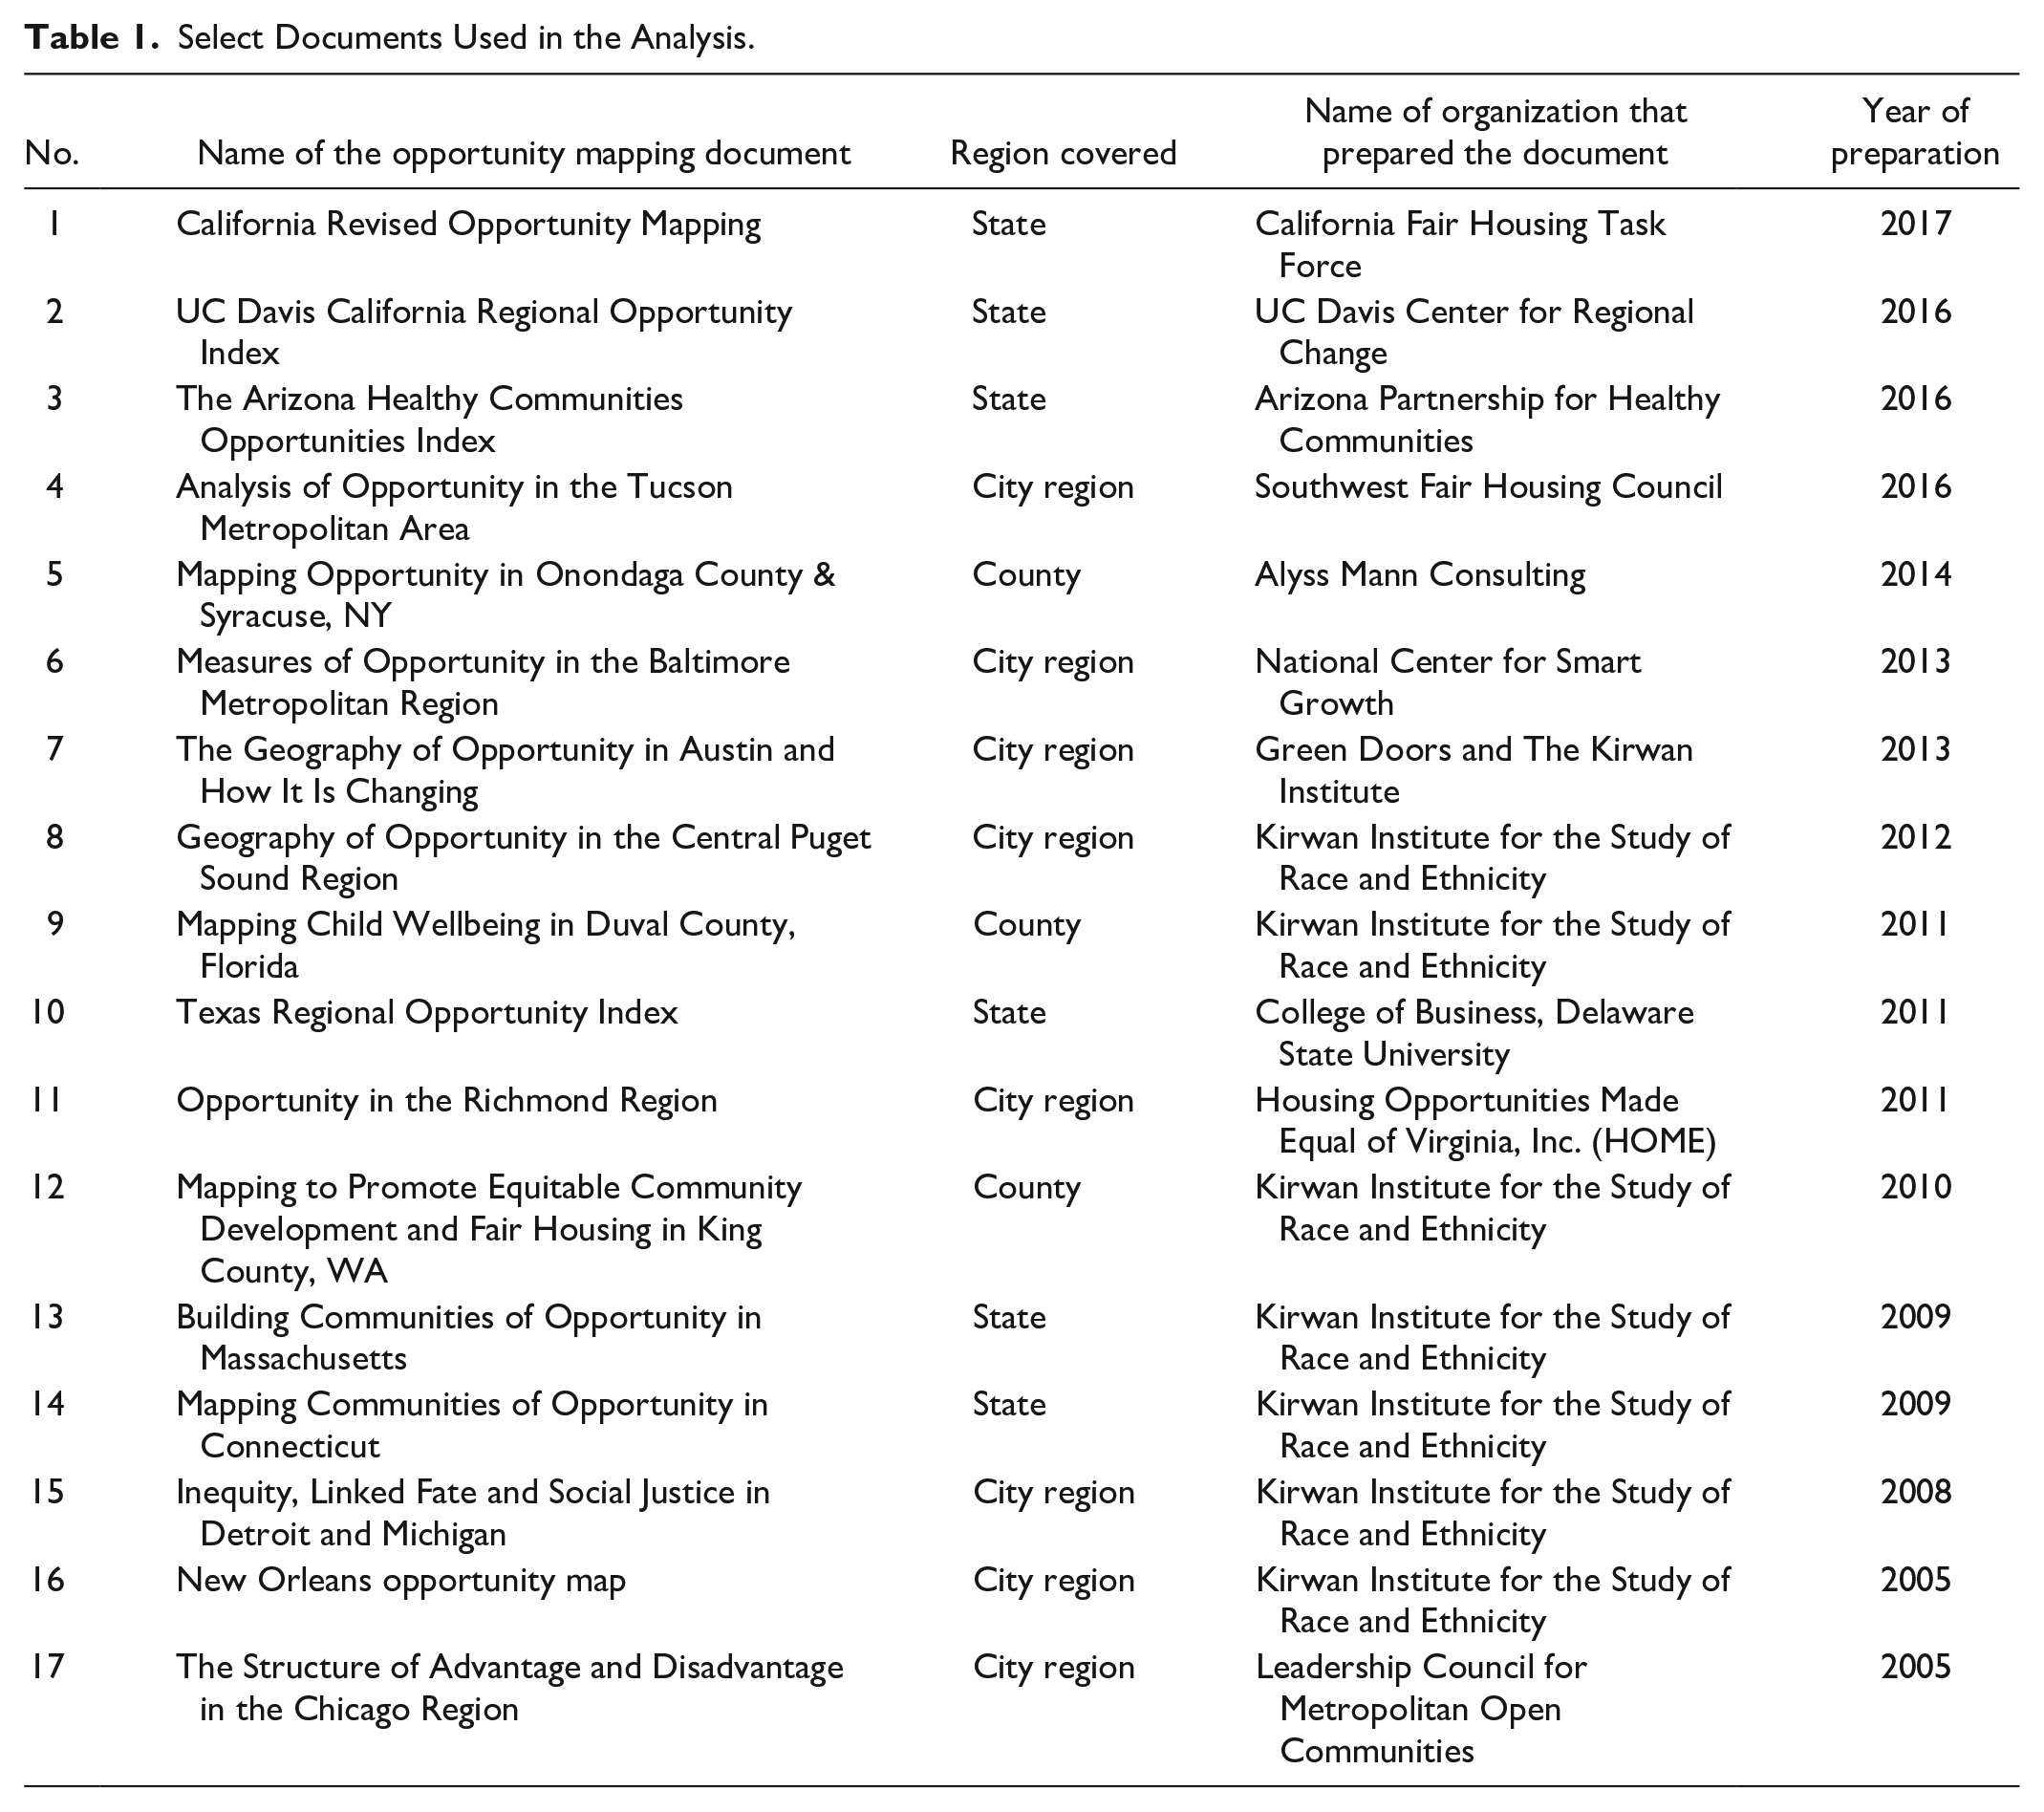
To narrow our selection, we included documents that contained the term “opportunity” either in the title or in the contents for this research. Furthermore, all documents selected for the study construct latent categories of opportunity, operationalized by secondary data, and purport to identify spatial disparity demonstrating historicized conceptions of opportunity and isolation. We also selected documents created in the last twenty years to evaluate more current trends in opportunity assessment. We present the final list of documents analyzed in this study in Table 1.
Select Documents Used in the Analysis.
Data Analysis Strategy
To assess the selected opportunity mapping documents, we considered plan quality analysis (Berke and Godschalk 2009) as a potential method. Researchers have used quality evaluation of plans for a range of mandated and non-mandated plans (including visions, blueprints, land use guides, and strategic problem-solving documents) to improve the quality of thought and professional practice (Baer 1997) and to strengthen the influence of plan-making (Berke and Godschalk 2009). In our case, we consider opportunity assessments as “non-mandated partial plans” that provide a situational analysis of spatial opportunity to serve equity concerns of other plan documents that include analytical outputs of these assessments. In a similar study, Zapata and Bates (2017) treated grant proposals to the Sustainable Communities Regional Planning Grants (SCRPG) program as plans to evaluate their quality.
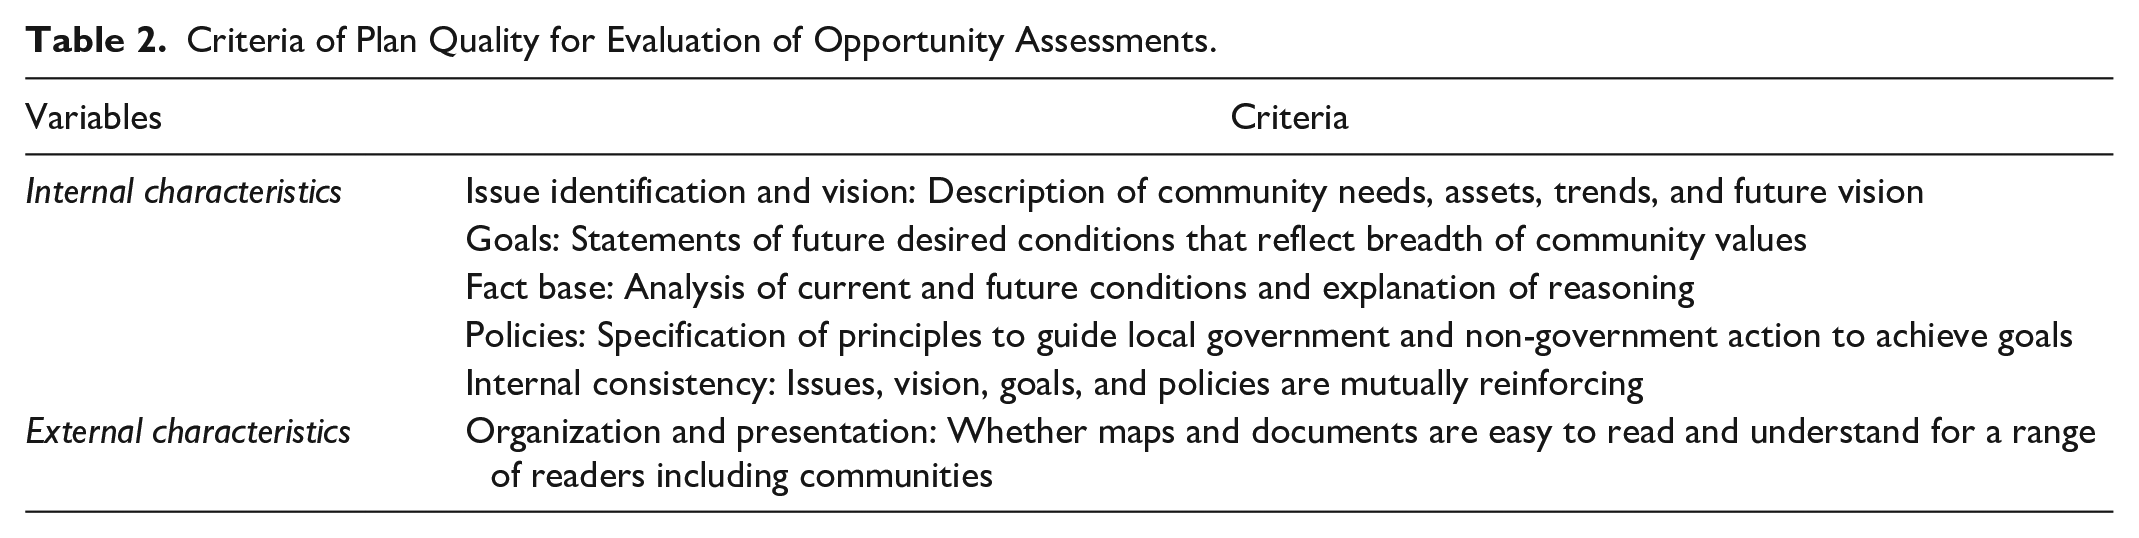
We used select criteria from Berke and Godschalk’s categories of plan quality evaluation (Berke and Godschalk 2009, 5) to evaluate the opportunity assessments (see Table 2). As we consider opportunity assessments as non-mandated partial plans, we excluded specific internal and external criteria on plan implementation.
Criteria of Plan Quality for Evaluation of Opportunity Assessments.
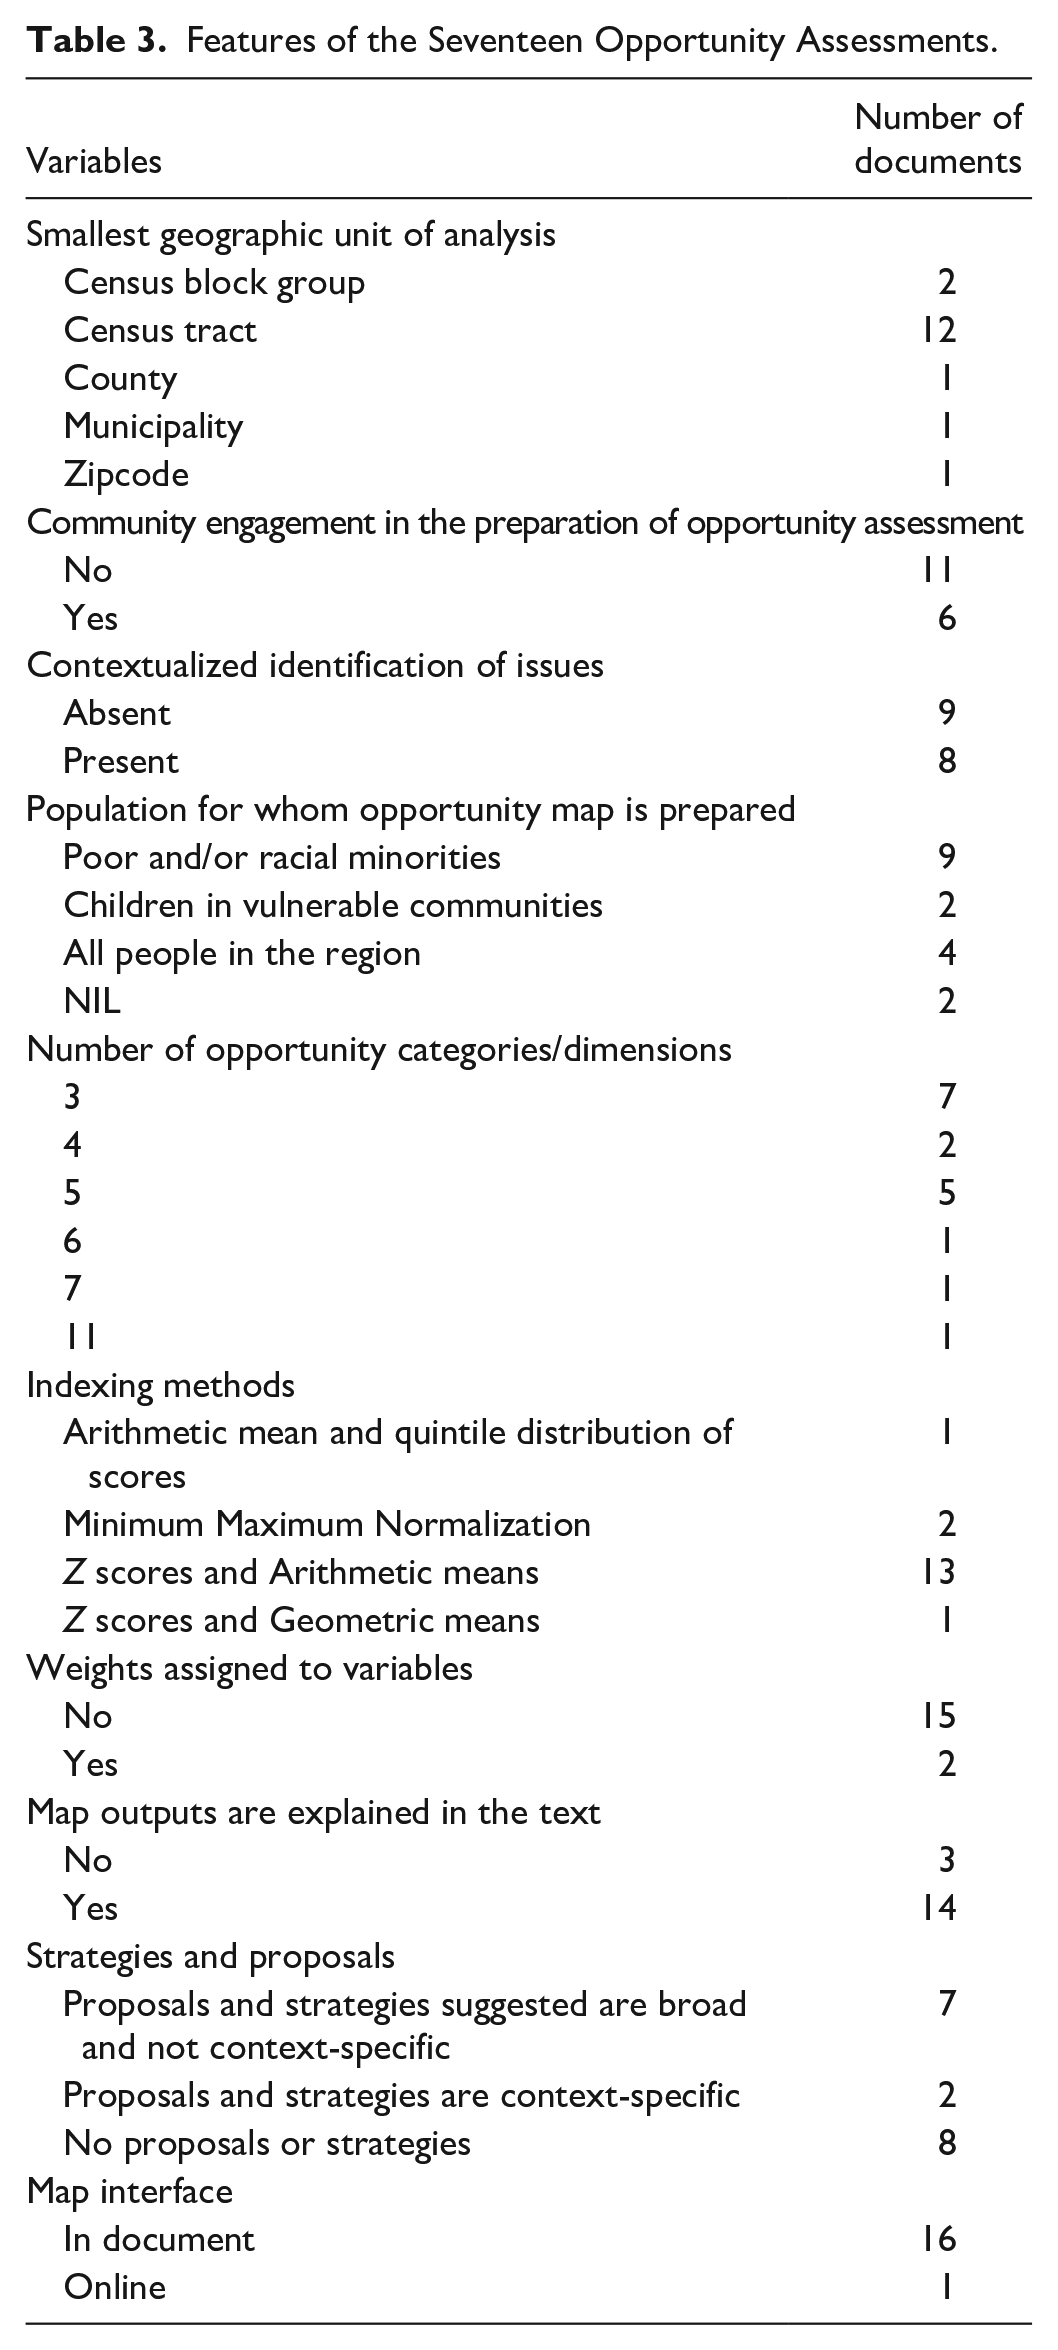
To evaluate the documents, we first conducted a content analysis of the opportunity mapping documents. Then, we coded them using MAXQDA based on the plan evaluation criteria and generated criteria-wise memos for further analysis. Table 3 includes a summary of the features of the seventeen documents.
Features of the Seventeen Opportunity Assessments.
Findings: Quality Evaluation of Opportunity Assessments
Although different agencies have funded, initiated, and prepared the selected opportunity assessments for various purposes, the documents used in the sample have either used or built upon the Kirwan method of evaluating space. The Kirwan Institute for the Study of Race and Ethnicity, which has prepared seven of the seventeen documents studied in this research, proactively promotes opportunity assessments and raises resources for communities to undertake them. A list containing details of the client, funding institutions, and institutions that authored the opportunity assessments included in this study is available along with the research data online. In the following sections, we present analyses of the evaluation based on the selected plan quality criteria.
Issue Identification and Vision: Description of Community Needs, Assets, Trends, and Future Vision
Berke and Godschalk (2009) note that a description of community needs, assets, trends, and a well-articulated future vision provides a solid foundation for high-quality plans. Therefore, to assess the quality of issue identification, we first looked for contextualized descriptions of the local context that led to spatial disparity. Next, as racial and spatial equity has historically been the objectives of these assessments, we checked whether the documents explicitly stated that they served disadvantaged groups. Finally, we analyzed documents for the types of agencies involved in the different stages to evaluate whether these institutions represented marginalized groups.
At the outset, there is no clear correlation between the types of agencies that make opportunity assessments and the inclusion of marginalized voices or the treatment of issue identification. However, some documents are more sensitive to local context and historical and institutional racism than others. In addition, the methods of issue identification vary widely. For instance, the Duval County and the Austin, Texas documents (both prepared by external agencies) explore changes in neighborhood characteristics by using data from two recent periods. In comparison, the Richmond opportunity assessment made by HOME Inc. Virginia, a local housing nonprofit, describes the contextual influences that have reinforced unequal access in its predominantly black city region. It notes, in our backyard, the poor have been concentrated into small areas . . . Heavily concentrated in eastern portions of the city of Richmond and Henrico County, these are the same neighborhoods that have been starved for credit and the ability to accumulate wealth for generations. (“Opportunity Map of the Richmond Region” 2011, 10)
The report also includes a detailed assessment of prevailing socio-economic conditions in poor neighborhoods.
Eleven documents mention that low-income individuals or minorities were the focus of the opportunity assessments. These documents use terms such as “African American population,” “children in families of color,” “low-income” groups and “racial and ethnic populations,” “most vulnerable populations,” or simply “poor and minorities” to indicate communities of interest. For instance, the Texas Regional Opportunity Index states that “the motivation for this research is to promote the further utilization of public services by those who are income-eligible to foster asset-building within low- and moderate-income families; and hence, economic stability” (“Texas Regional Opportunity Index” 2011, 5). However, we found evidence of minority groups’ representation in only five of the documents. For instance, in the Puget Sound document, the Fair Housing Sub-Committee comprising seventy-six member institutions was involved throughout the process. By checking the websites of these seventy-six institutions, we identified that six of them belonged to housing nonprofits and legal aid agencies that represented the needs of racially marginalized groups. We are cognizant that the presence of institution names in the report does not automatically indicate their involvement in the process design. The extent of participation and engagement in non-mandated planning practices is an area that merits further inquiry.
Goals: Statements of Future Desired Conditions That Reflect the Breadth of Community Values
The documents articulate a range of goals for preparing the opportunity assessments, and these sometimes reflect the motivations of the agencies who initiate or fund the mapping process. For instance, the Fair Housing Task Force in California notes, “it is the task force’s intent that the mapping tool be used in conjunction with new (LIHTC) regulations to help incentivize more housing opportunities for families to live in high-resourced neighborhoods” (“Revised Opportunity Mapping Methodology for California” 2017, 2). The goals in the documents also reflect ties to funding and broader planning processes that incorporate the opportunity assessments. However, the documents also note that the opportunity assessments would influence decision-making in a variety of ways. For instance, in Puget Sound, fair housing advocates intended to use the assessments for informing their regional strategies on affordable housing and development along the transit corridor. In King County and New Orleans, the researchers indicated that the documents would help inform the relocation of communities in ecologically vulnerable locations.
Fact Base: Analysis of Current and Future Conditions
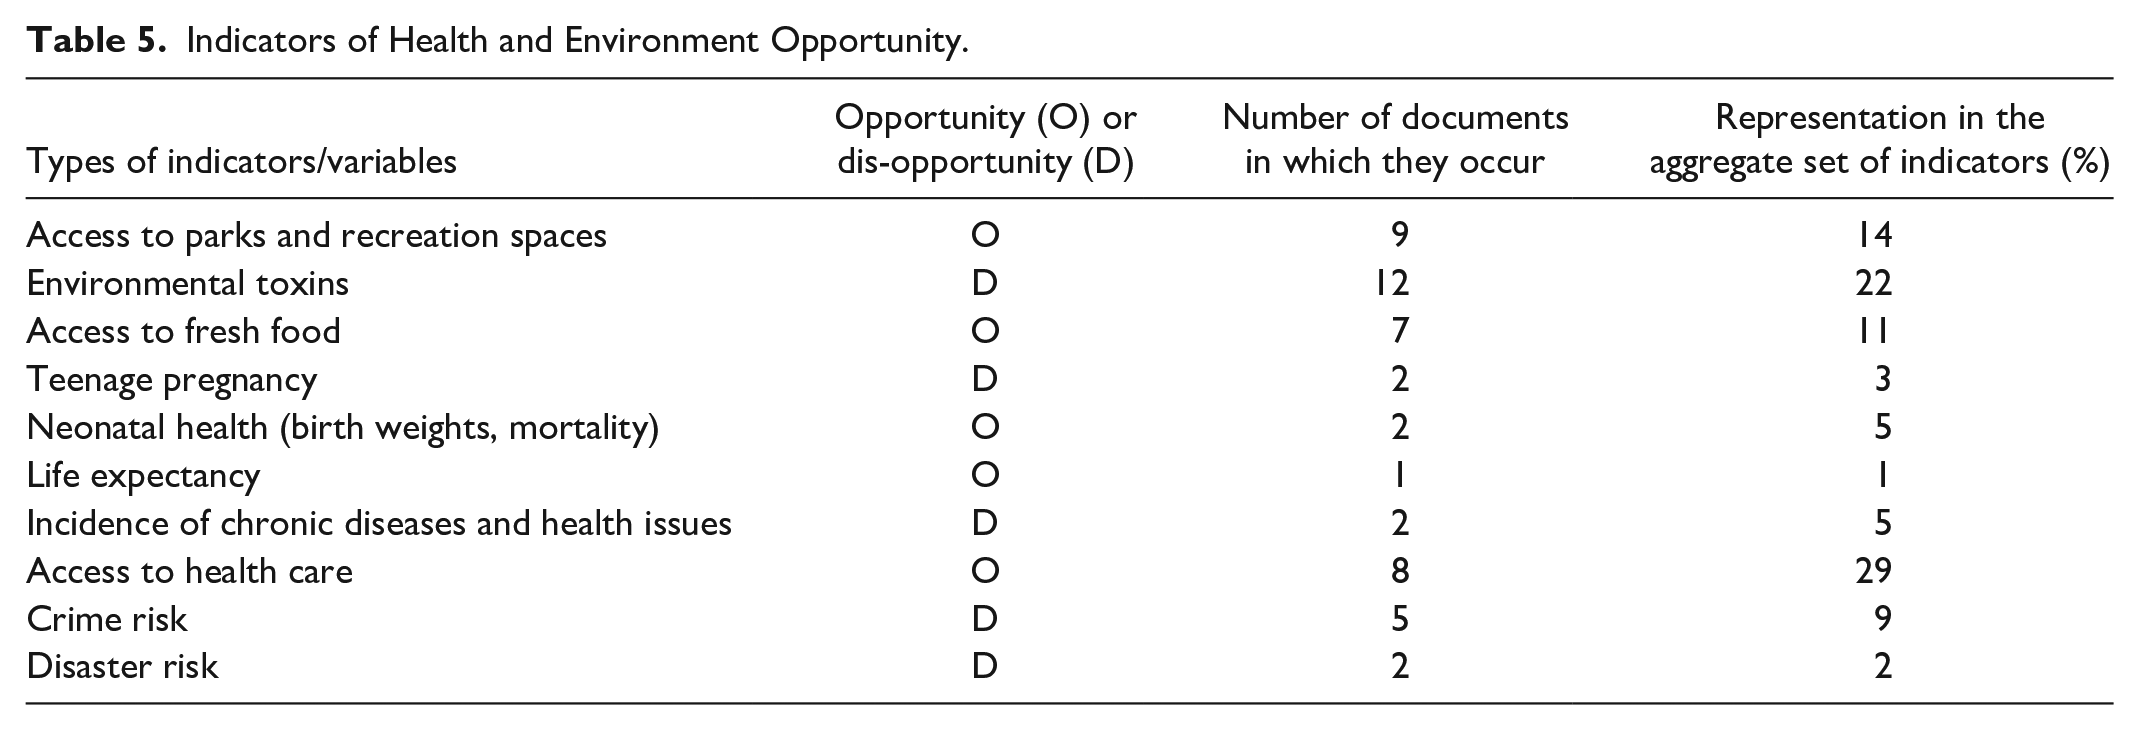
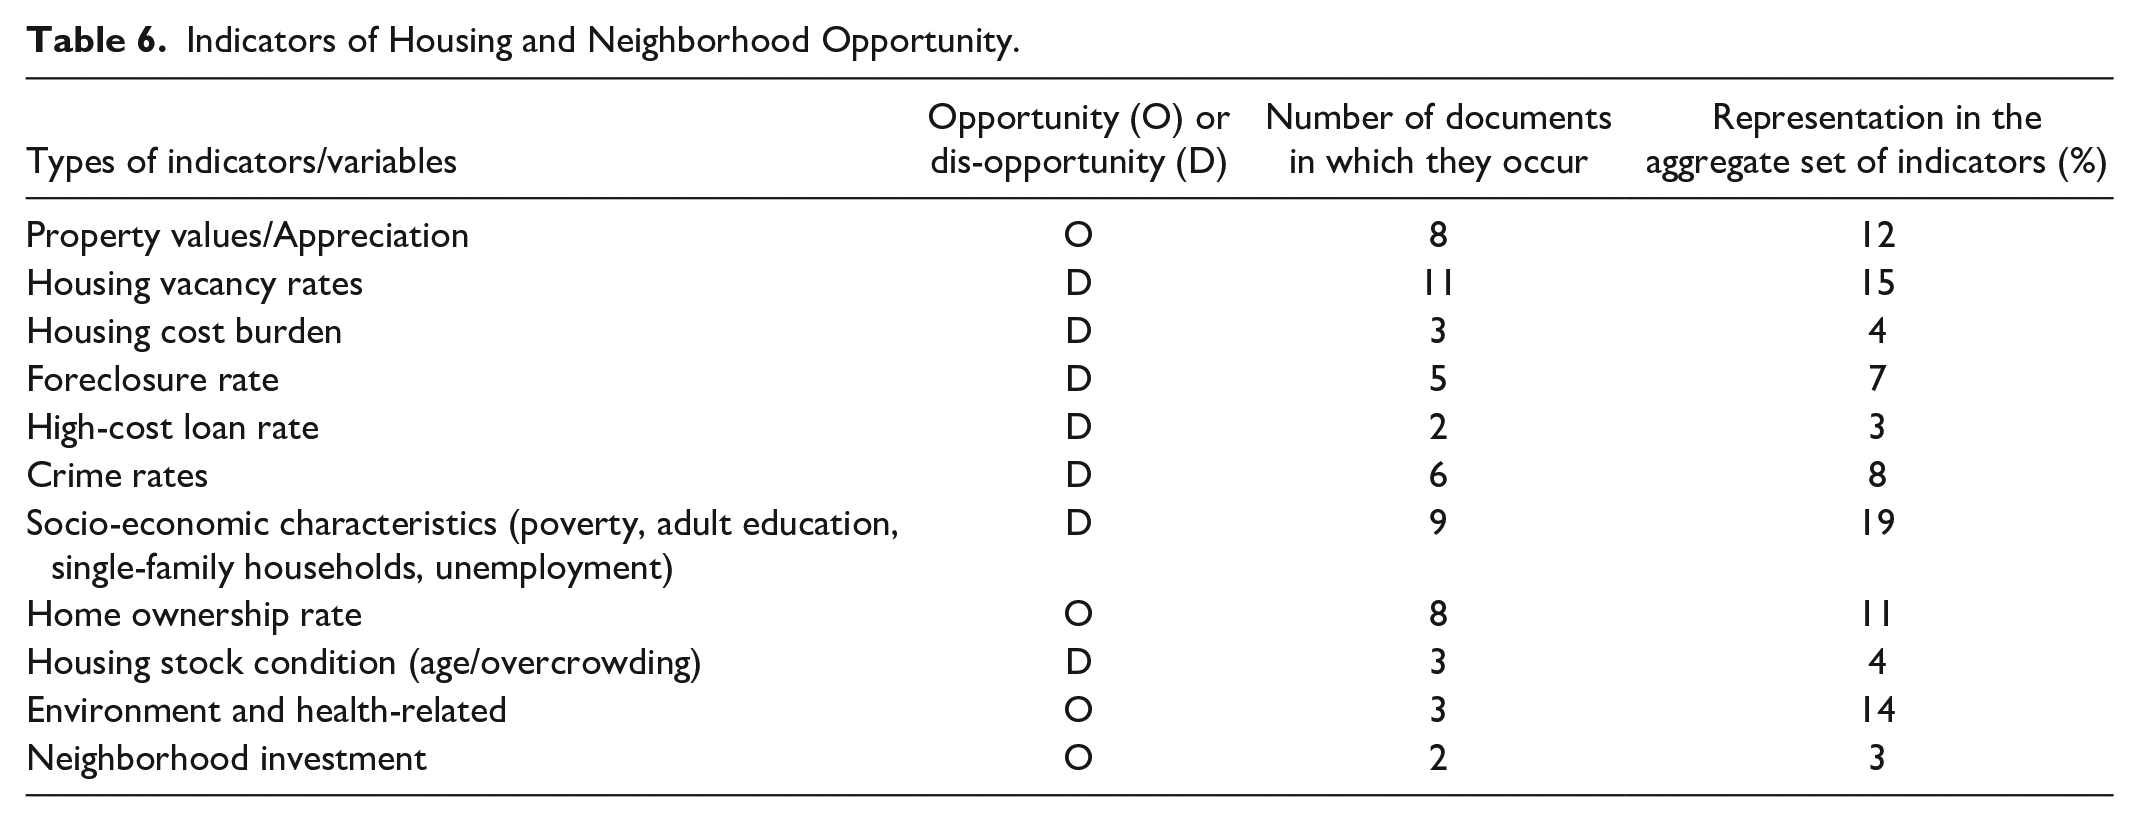
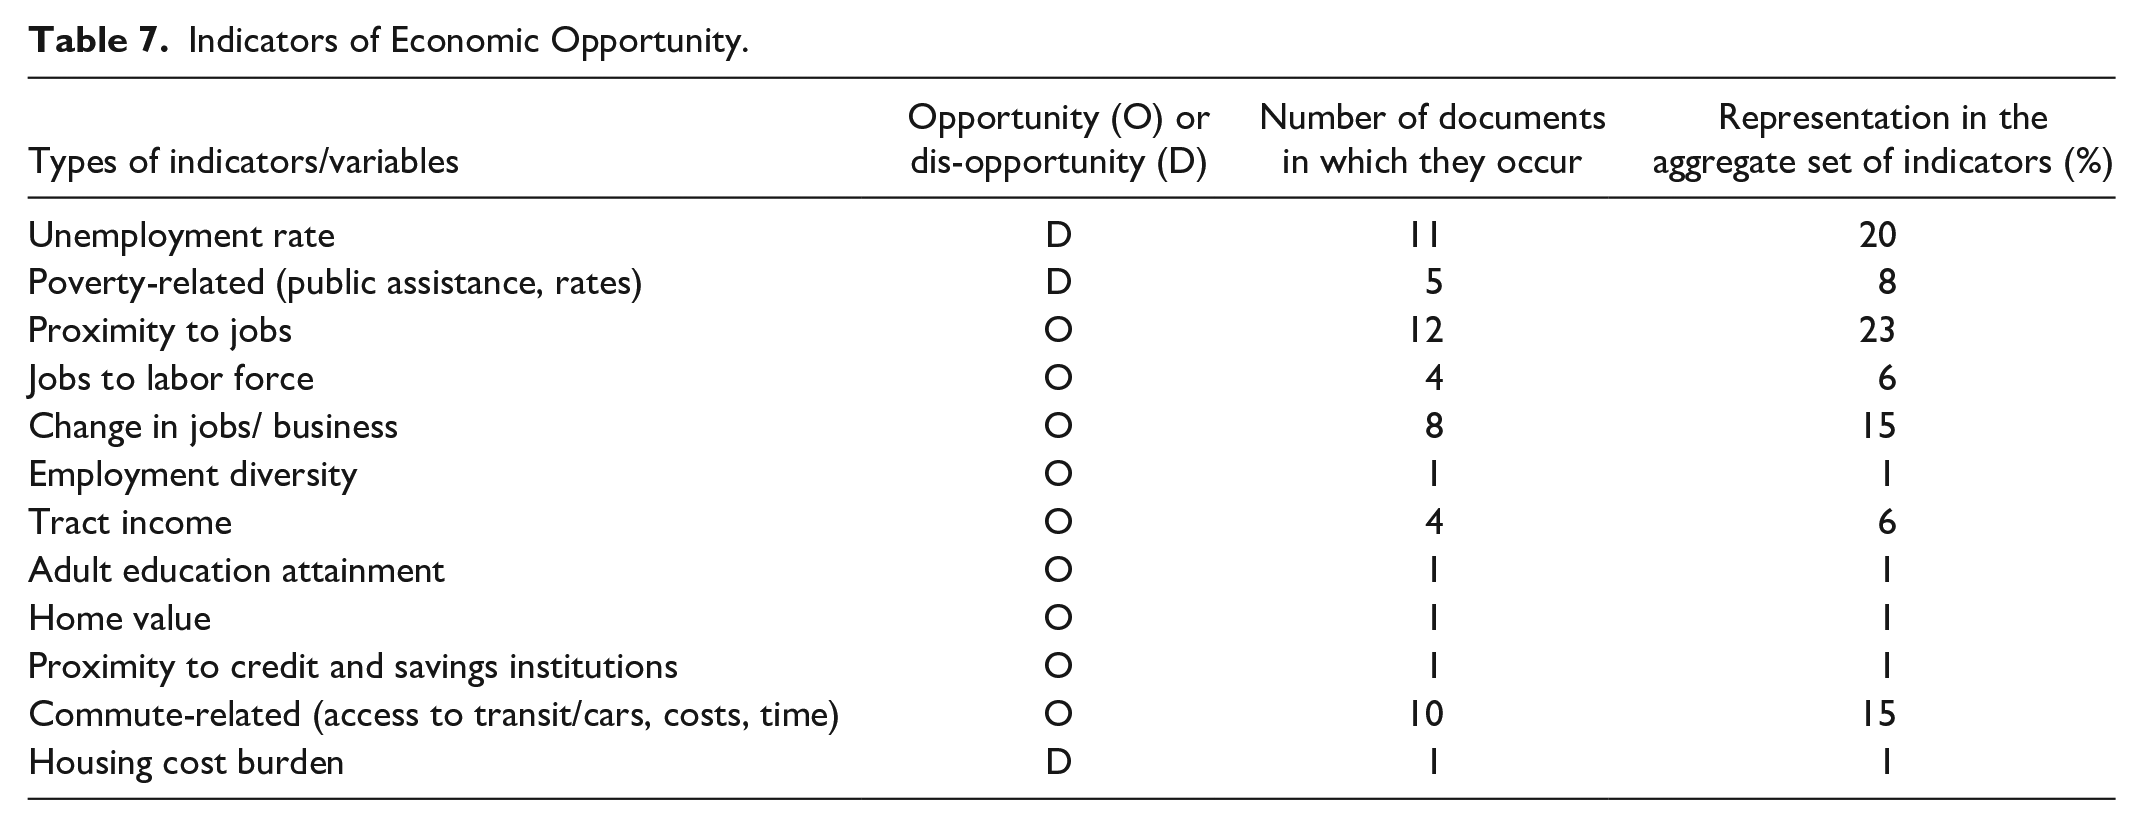
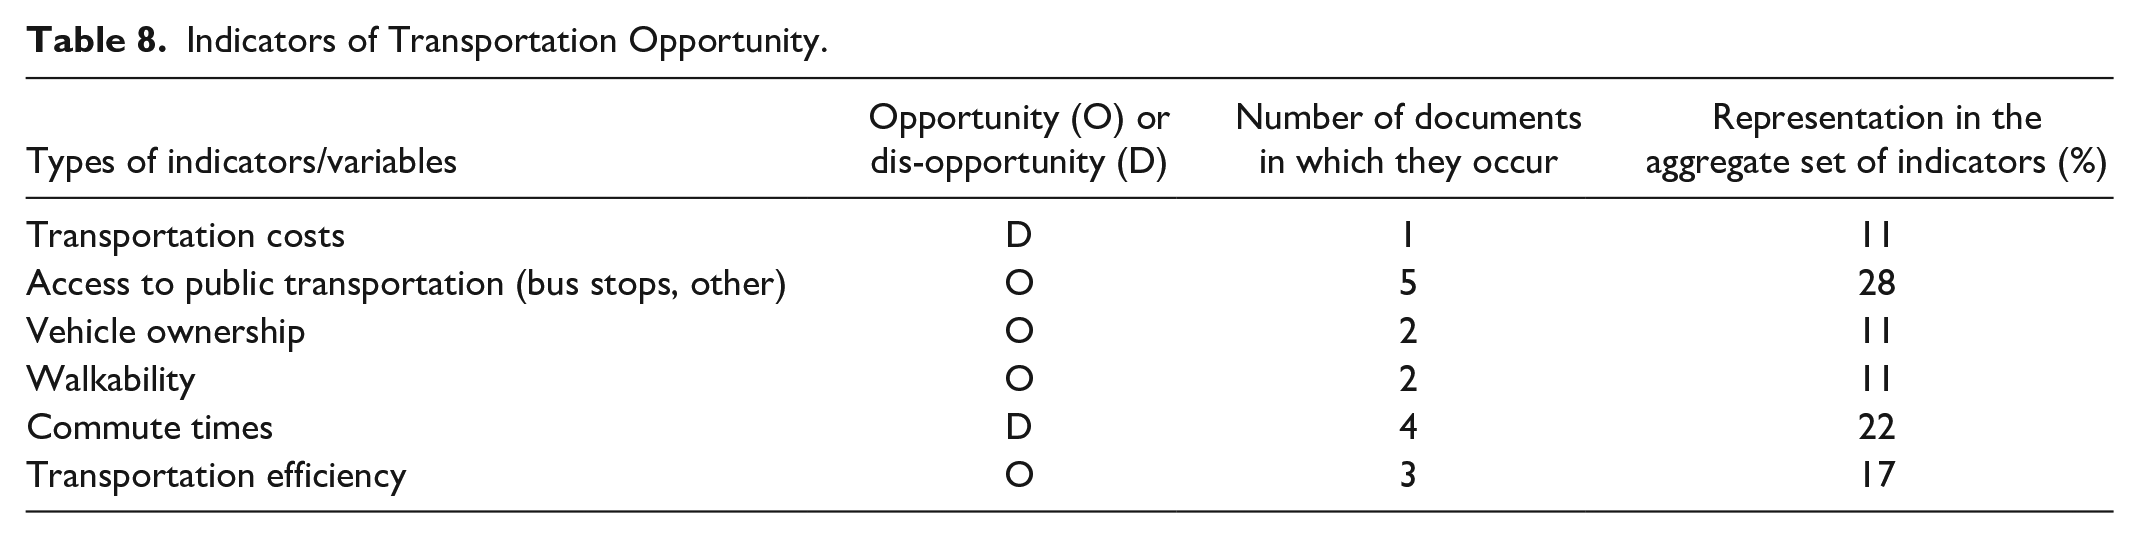
The fact base is the most important feature of opportunity assessments. We found between three and five categories of opportunity and an overall opportunity index in the documents studied. This section includes tabulations of the broad types of variables used for each opportunity category, whether they increase or reduce opportunity, and the number of documents they occur. In addition, we aggregate all the variables used in the sample documents under each opportunity category and assess the frequency with which each type of variable occurs in the aggregate.
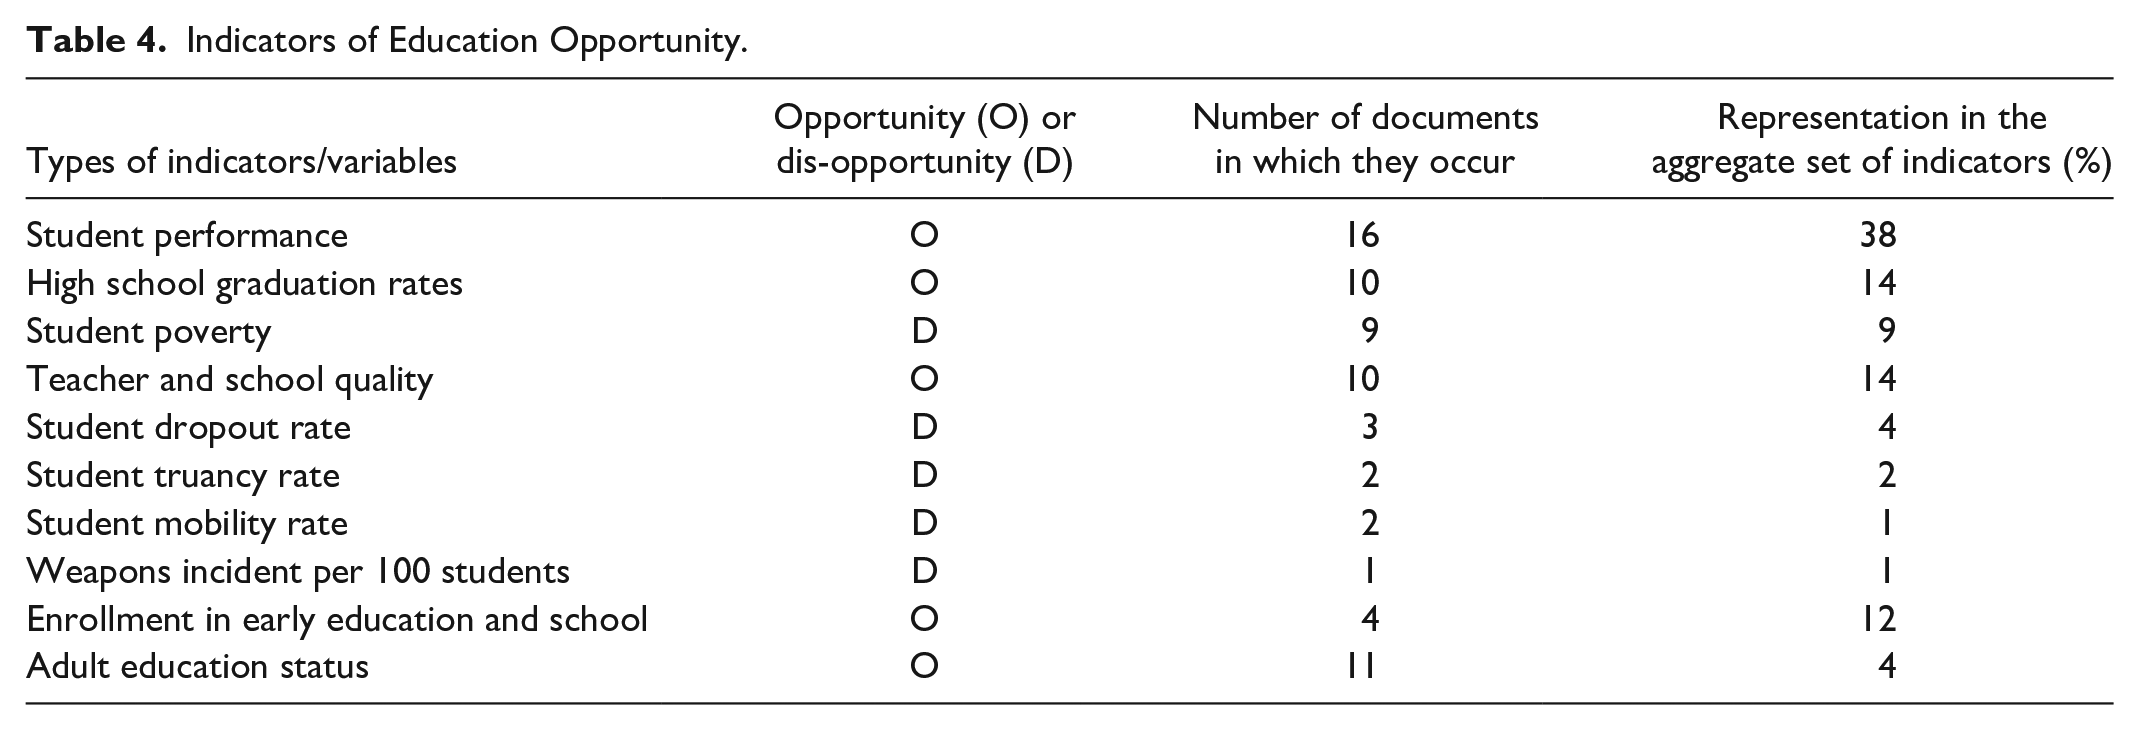
Education opportunity—Almost all the documents construct education opportunities. State public school report cards are the key source of data for this category. The details of the variables used are in Table 4.
Indicators of Education Opportunity.
Health and environmental opportunity
Indicators of Health and Environment Opportunity.
Housing and neighborhood opportunity
Indicators of Housing and Neighborhood Opportunity.
Economic opportunity—This measure includes poverty, unemployment, and access to jobs. The details of the variables used are in Table 7.
Indicators of Economic Opportunity.
Transportation opportunity—This measure includes access to transit, cars, commuting costs, and commute times. The details of the variables used are in Table 8.
Indicators of Transportation Opportunity.
Some of the documents include other categories not commonly found in the other documents. For instance, the Texas Regional Opportunity Index includes “credit and debt access,” “health insurance,” and “income and financial stability” because its stated goal is to foster asset-building within low- and moderate-income families. Similarly, the Arizona Healthy Communities Index includes “vulnerable socio-economic characteristics” and “multi-sector opportunities” consisting of access to affordable housing, food assistance, and transit access.
As researchers have pointed out in the past, the selection of indicators is problematic for several reasons. First, generic conceptions of opportunity and the availability of secondary data drive the inclusion of variables. Second, many of the chosen indicators, such as unemployment, poverty, and home value, are highly correlated and overrepresented. Third, and more importantly, there is an implicit racial and class bias in opportunity construction. For instance, many of the assessments imply that students dependent on subsidized lunches reduce opportunity for everyone (see, for instance, the Duval County and the revised California assessments). Conversely, some of the assessments conclude that higher home values, homeownership rates, and median incomes increase opportunity for everyone in a neighborhood (see, for instance, the Baltimore opportunity assessment).
Policies: Specification of Principles to Guide Local Government and Nongovernment Action to Achieve Goals
In theory, well-articulated policy proposals and specifications of contextualized strategies could provide pathways for the translation of spatial assessments into ameliorative action. Historically, spatial assessments of access and deprivation have resulted in programs that promote the residential mobility of low-income and minority households. However, newer discourses and critiques of these policies (Imbroscio 2012) call for place-based and community-based approaches to enhance opportunities and life chances (Goetz 2018).
Many researchers have pointed out that opportunity assessments are biased toward dispersal and mobility paradigms. Although methodologically the assessments valorize some types of neighborhoods over other neighborhoods, we found that in the proposals and policies to guide action, ten of the seventeen opportunity assessments suggest a mix of strategies, advocating for interventions in favor of enabling both residential mobility and place-based community development. For instance, the Puget Sound document suggests, “sustainability advocates should work to strengthen the opportunity webs in these neighborhoods and to open up other neighborhoods rife with community assets and private investment to more families” (“Equity, Opportunity, and Sustainability in the Central Puget Sound Region” 2012, 10). The Massachusetts document advocates for “supporting both in-place and mobility-based strategies to affirmatively provide pathways to opportunity . . .” (Building Communities of Opportunity in Massachusetts 2009, p. 53). Three of the documents primarily indicate mobility as the response to isolation from spatial opportunity. The Connecticut and New Orleans maps suggest that the opportunity maps will be used to site affordable housing in higher opportunity areas. Some documents also have implicit leanings and demonstrate a limited understanding of residential choice constraints for poor and historically marginalized groups. For instance, the Onondaga, New York document notes, despite having a choice of where to live, more (Latino and Black) households receiving Tenant-Based Rental Assistance in 2013 live in areas with low or very low housing opportunity, economic opportunity, and educational outcomes than live in areas of high or very high opportunity. (“Mapping Economic, Educational, & Housing and Neighborhood Opportunity in Onondaga County & Syracuse, NY” 2014, 3)
The types of principles for change included in these assessments are primarily in the form of broad policy directions. However, the involvement of local agencies and interest groups in the process makes a difference in the level of detail included in the policies and proposals. For instance, in the King County assessment, Kirwan’s broad-brush proposals are as follows: “Investing in and empowering neighborhood capacity and institutions supports places. This includes equitable neighborhood redevelopment, support of neighborhood anchors, increasing employment opportunities for living-wage jobs, and equal provision of local services, including high-performing schools” (“Mapping to Promote Equitable Community Development and Fair Housing in King County, WA” 2010, 13). In comparison, the Duval County assessment prepared for the Jacksonville Children’s Commission identifies low-income neighborhoods served by the commission, evaluates gaps in their coverage, and suggests more specific intervention in uncovered neighborhoods as follows: “For example, one way to help children in low opportunity areas is through participation in afterschool programs, a service currently provided by Jacksonville Children’s Commission” (“Mapping Child Wellbeing in Duval County, Florida” 2011, 37).
While the broad recommendations currently included in the opportunity assessments are helpful, we believe that these documents can be more specific in identifying disadvantaged communities that require prioritization by mapping stakeholders and community assets in those communities and articulating more tangible areas of intervention that could transform spatial access. Furthermore, these documents could identify systemic impediments for access to housing in the better neighborhoods they deem to be “rife with assets, investments, and opportunities.”
Internal Consistency: Issues, Vision, Goals, and Policies Are Mutually Reinforcing
The documents studied here articulate goals to enhance access to opportunity and showcase spatial variation in opportunity. In addition, the recommendations and broad policy principles advocate for enabling access to opportunity neighborhoods. Therefore, one may conclude that these documents achieve internal consistency. However, as we have pointed out, in their current form, opportunity assessments are limited in their utility as there are several problems in the way they identify issues, construct fact bases, and articulate policies to guide the achievement of goals.
Organization and Presentation
As described earlier, opportunity assessments include reports and maps. New-generation opportunity maps are now hosted on Arc GIS online. The interface allows users to map spatial opportunity interactively by selecting desired indicators of opportunity (see, for instance, Sweeney et al. 2019). While the visuals are relatively easy to read, the opportunity constructs with index values are somewhat abstract, making it difficult for stakeholders and community groups to undertake concrete action in specific neighborhoods based on the assessments and maps alone. However, these documents are influential in directing resources to neighborhoods. For instance, the Puget Sound document notes, “if a group is trying to prioritize investments along a corridor, it should factor in the opportunity score in addition to infrastructure like sidewalks, sewers, water, roads . . . ” (“Equity, Opportunity, and Sustainability in the Central Puget Sound Region” 2012, 18). Therefore, it is essential to rethink the types of outputs produced through opportunity assessments.
Discussion
Opportunity mapping has been used pervasively for activism, legal scrutiny, and advocacy in the United States. However, a range of challenges persists in the research and practice of opportunity mapping. By undertaking plan quality evaluation and studying opportunity assessments prepared at different geographical scales across the country, we itemize some of the limitations and inconsistencies of these crucial reflective and planning tools.
In the past, various institutions have prepared opportunity assessments for different reasons, including soliciting federal funding. As a result, the assessments have varied goals and differential levels of involvement by institutional stakeholders. The stated objective of opportunity assessments is to construct a fact base and discern spatial variability in the distribution of urban opportunity that could influence social and economic life chances, particularly for poor and racial minorities who have been the subjects of historical and systemic oppression and isolation from opportunity. However, our analyses show that despite promises to engage with the needs of marginalized residents, community stakeholders are not always involved in the initiation, conceptualization, and implementation of opportunity mapping processes, nor is their input captured regarding the usefulness of outcomes from such processes.
In the absence of community voices and clear ideological standpoints, opportunity assessments often miss out on essential indicators that could precisely point out spatial deficiencies. Moreover, not all of the constructed measures of opportunity find theoretical justification or empirical evidence in past scholarship. For example, the most well-consolidated evidence in the study of neighborhood effects is the adverse outcome of exposure to crime and environmental pollution for individuals and children. Although some of these indicators can be challenging to collate consistently and across jurisdictions, their omission limits our ability to conceptualize effective interventions. Meanwhile, other relationships that lack adequate evidence are assumed to be true. For instance, in evaluating economic opportunity, Galster and Sharkey (2017) note that the availability of jobs specific to low-income and marginalized communities and their skills sets are more important than an absolute number of jobs in determining the causal effects of neighborhoods on the labor force participation. In addition, the spatial mismatch between jobs within a central city versus a suburb is more relevant for large cities than in smaller locations. Moreover, travel-time thresholds for jobs make little sense without the context of income, class, and housing cost burden (“About the Index| H+T Index” 2017; Tegeler and Chouest 2010).
Another significant limitation of the index construction methods employed in the current practice is that collapsing multiple values and only mapping the relative differences between spatial units skew our understanding of the severity of contextual issues. For instance, in the New Orleans document, “Environment and Health” opportunity includes indicators on flood risk, mold, and endotoxin exposure after Hurricane Katrina and access to parks and public spaces in a single index (“New Orleans Opportunity Mapping” 2005, 4). Both acute exposures to toxins and flood risk require different types of remedial measures, possibly by different institutions. Grouping them with access to parks and public spaces may make the problem appear less severe in a neighborhood that requires immediate attention.
In our assessment, one of the most critical concerns with the current way of measuring opportunity is that all of the opportunity assessments tend to group variables indicating material differences across space, with variables indicating symptomatic outcomes of intergenerational deprivation. For instance, the quality of resources available to education institutions, particularly public schools, has been strongly correlated with student performance (Jargowsky and Komi 2009). However, student performance outcomes—especially in high-poverty neighborhoods—are outcomes of many factors, including exposure to environmental toxins, violent crimes, poor role models, resource constraints, intergenerational disadvantage, and parental mediation (Makarewicz 2018), all of which are incredibly complex phenomena. While the assumption of reverse causality in constructing “education opportunity” is problematic, the more significant issue is that the resultant values of the opportunity measure do not provide direction for tangible interventions. Meanwhile, a potentially helpful measure like “expenditure per student,” which could lead to advocacy efforts on access to equalizing funds, is found in only one of the seventeen documents. The use of poverty variables and other socio-economic characteristics of people pervade all of the opportunity measures. Unfortunately, such a practice defines concentrated disadvantage as dis-opportunity for everyone and exacerbates relative differences across spatial contexts. More importantly, the quantified outputs do not help practitioners evaluate and prioritize interventions in resource-constrained neighborhoods. Thus, the conflation of measures indicating material differences with symptomatic outcomes of intergenerational disadvantage complicates our understanding of variability in spatial geographies. Moreover, as spatial opportunity structures often operate at divergent temporal and geographic scales, the observed heterogeneity at the neighborhood level may lead to false conclusions.
As the findings in the “policies” section show, opportunity maps do not always provide context-specific actionable ideas or projects for ameliorative action, although they have the potential to do so. At best, opportunity assessments remain static snapshots of access and deprivation across city regions, but at worst, they may reinforce those same patterns if market decisions predicated on these assessments further marginalize neighborhoods marked as low-opportunity.
Conclusion
Opportunity mapping documents are ubiquitous and well understood as tools for assessing spatial geographies. Therefore, we believe that improving these documents’ processes, methods, and outputs could considerably enhance the quality of local dialogue and action for racial and spatial justice. Hence, we conclude by proposing five agenda items for practitioners and researchers to consider while preparing opportunity assessments:
(1) Context matters—While a generic understanding of entrenched social structures and racial discrimination is helpful, contextualized understanding of the sociopolitical processes that led to disparities across space is essential for interpreting current conditions and related rationales for policy-based action.
(2) View space from below—The overarching objective of opportunity mapping is spatial justice. Therefore, the most deprived communities should guide where we position our lenses to examine spatial deficiencies. While opportunity analyses are currently made “about” resource-constrained neighborhoods and communities, what constitutes opportunity “for” them must be central to the discourse and analyses. Working with advocacy institutions can provide direction and structure to the process by foregrounding issues of importance to disadvantaged communities.
(3) Measure the quality of goods, institutions, and services (and not people)—We must be cognizant of the geographic, political, and temporal scales of decision-making to assess whether neighborhoods are the appropriate unit for measuring the effects of those decisions in the form of spatial opportunity. Moreover, asking the question, “what types of ameliorative actions are possible by measuring opportunity in the proposed ways?” early in the process may help us examine the validity of our category specifications.
(4) Construct indexes with care—Some types of information are simply not found in readily available secondary datasets. Conversations with stakeholders and vulnerable communities are irreplaceable for creating measurements that matter in these cases. These conversations can then guide researchers on how to use big data and other available datasets effectively.
(5) Make opportunity mapping legible—Along with asking “opportunity for whom,” we must ask “who constructs the opportunity measurement” and “who will act on the outcomes of the opportunity measurement.” In other words, the measurements must make sense to agents capable of committing resources and advocating for change.
These five principles are easy to incorporate in a range of contexts for preparing opportunity assessments. Careful people-centered processes such as those described by Lung-Amam et al. (2018) provide essential guidance for moving forward. Creating processes that better reflect local history, integrate marginalized stakeholders, center the power of place, measure carefully and with humility, and result in transparent and legible public documents is the first step toward not just visualizing injustice but enacting justice as a matter of policy.
We are cognizant of three limitations of this study. First, evaluation studies of this nature and, more generally, content analysis methods rely on intercoder reliability metrics to convey analytical rigor. Owing to team attrition and the extended time frame of the research, only one of the researchers coded all the documents. Hence, these metrics are missing in our study. Nevertheless, we believe that our scholarly contributions are significant. Second, we started the study in 2018 and concluded it in 2020. Therefore, some of the opportunity assessments may have become outdated. Finally, we recognize that a few qualitative interviews with institutions that initiated or prepared the opportunity assessments could have strengthened our research. However, here we rely primarily on texts and maps available in the public domain. Nonetheless, we consider that this scholarship makes crucial contributions for reimagining the practice of opportunity mapping and provides new exploratory frameworks for future researchers to evaluate and expand.
Supplemental Material
sj-7z-2-jpe-10.1177_0739456X221088984 – Supplemental material for Examining Spatial Opportunity for Local Action: From Theory to Practice
Supplemental material, sj-7z-2-jpe-10.1177_0739456X221088984 for Examining Spatial Opportunity for Local Action: From Theory to Practice by Sowmya Balachandran and Andrew Greenlee in Journal of Planning Education and Research
Supplemental Material
sj-xlsx-1-jpe-10.1177_0739456X221088984 – Supplemental material for Examining Spatial Opportunity for Local Action: From Theory to Practice
Supplemental material, sj-xlsx-1-jpe-10.1177_0739456X221088984 for Examining Spatial Opportunity for Local Action: From Theory to Practice by Sowmya Balachandran and Andrew Greenlee in Journal of Planning Education and Research
Footnotes
Declaration of Conflicting Interests
The author(s) declared no potential conflicts of interest with respect to the research, authorship, and/or publication of this article.
Funding
The author(s) received no financial support for the research, authorship, and/or publication of this article.

Supplemental Material
Supplemental material for this article is available online.
Author Biographies
References
Supplementary Material
Please find the following supplemental material available below.
For Open Access articles published under a Creative Commons License, all supplemental material carries the same license as the article it is associated with.
For non-Open Access articles published, all supplemental material carries a non-exclusive license, and permission requests for re-use of supplemental material or any part of supplemental material shall be sent directly to the copyright owner as specified in the copyright notice associated with the article.
