



Abstract
This study is the first to examine detailed faculty demographics and impacts of elite hiring networks in the planning academy. Institutional prestige significantly shapes faculty placements. Nearly half of planning faculty graduated from Berkeley, Massachusetts Institute of Technology (MIT), University of California, Los Angeles (UCLA), Cornell, and University of North Carolina (UNC)-Chapel Hill. Faculty are predominantly hired in similar or lower ranking programs with little upward mobility, after accounting for demographics and program factors. While race and gender did not have a significant relationship to placements, the findings demonstrate how status-based inequities are perpetuated through elite programs and constrain faculty representation.
Introduction
The planning academy seeks to hire and retain diverse students and faculty. Yet, the existing pipeline to train and hire underrepresented faculty leaks and contributes to the overrepresentation of white, 1 male faculty (Chen and Hune 2011; Hart 2016; Layton et al. 2016; Moreno et al. 2006; National Center for Education Statistics [NCES] 2020; Turner, Gonzalez, and Wood 2008). Existing studies have noted racial/ethnic disparities among planning faculty (Association of Collegiate Schools of Planning [ACSP] 1989-88 Committee 1990; ACSP Task Force on Global Planning Education 2019; Hibbard et al. 2011; Innes 1993; Lowe et al. 2016, 2018; Wubneh 2011). These studies attribute factors for uneven representation, including a racist or discriminatory climate, insufficient funding, or unclear expectations. This is the first study to examine detailed faculty demographics and hiring in the planning academy.
Studies on faculty hiring have examined disciplines in science, technology, engineering, and mathematics (STEM), business, and history (Clauset, Arbesman, and Larremore 2015; Larson, Ghaffarzadegan, and Xue 2014; Pinheiro, Melkers, and Newton 2017; Whittaker and Montgomery 2014). These studies highlight how disciplines use tight, elite hiring networks that perpetuate inequities. Sociologist Val Burris (2004) theorized the “academic caste system,” in which the person’s graduated university prestige heavily predicts the prestige of the institution where they will be hired (Barnett et al. 2010).
I fill a gap in planning literature by collecting and analyzing detailed demographic information and educational backgrounds of all 865 tenured or tenure-track faculty in U.S. accredited programs in 2020. These cross-sectional data are used to understand three research questions: First, what programs are key to produce and place graduates in other planning programs? Then, I describe an academic caste system, characterized by a few elite schools placing many students and little upward mobility between ranks. The second question is if there is evidence of an academic caste system in planning programs by assessing horizontal, downward, or upward hiring between program tiers. Third, logistic multivariate regressions assess whether graduated program has a statistically significant relationship to a person’s hired institution and at the top ten ranked planning schools, after accounting for demographic or educational factors.
Understanding elite hiring networks and placements is key to promote sustained institutional change. Student engagement with diverse people promotes long-term positive perceptions (Milem, Umbach, and Liang 2004; Sáenz, Ngai, and Hurtado 2007). Diverse faculty also bring epistemological approaches and innovations in planning knowledge beyond Eurocentric biases and inequities (Bernal and Villalpando 2002; Posselt et al. 2020). Finally, hiring diverse faculty will meet the needs of diversifying students and cities, as the field continues to become more aware of systemic racism (Taylor et al. 2020; Williams 2020).
The Academic Caste System
Burris’s (2004) academic caste system theory builds on Weber’s (1968) theory of social status, in which prestigious hierarchies depend on: (1) the privileged group adopting a distinctive lifestyle, and (2) closed interactions between the higher and lower tier groups that lead to uneven resource distribution. Burris (2004) focuses on program prestige as social status, and prestige is measured by program exchange of PhDs.
Prestige results in affirming or reproducing status divisions and leads to advantages that contribute to the closed social networks between higher and lower ranking programs. This advantage begins with students recruited at prestigious programs, in which top programs have more resources to host events or advertise in conference programs (Barnett et al. 2010) and/or financial resources or social capital to recruit and subsequently flood the academic market with their graduates (Kawa et al. 2018). Prestigious departments then hire graduates from similar ranking programs (Burris 2004; Mai, Liu, and González-Bailón 2015; Terviö 2011). Hiring committees also use personal contacts to select candidates from a similar ranked program to eliminate risk and uncertainty in hiring (Mai, Liu, and González-Bailón 2015; Terviö 2011).
Graduated program prestige then affects where a person is hired. In line with the academic caste theory, elite programs rarely hire graduates from lower-ranking programs because it would jeopardize their status (Burris 2004). Students from higher ranking institutions are hired at lower ranking institutions relative to where they graduated (Burris 2004; Nevin 2019; Terviö 2011), which helps elite schools accumulate social capital because their graduates monopolize faculty positions at more institutions. Widespread employment in the field leads to additional honors that strengthen prestige, including publications in high-ranking journals, positions in professional associations, or invited lectures (Burris 2004).
The academic caste system challenges meritocracy in the academic job market in several ways. First, prestige of where a person graduated from is more important than faculty productivity (Burris 2004). Second, prestige of departments has shown to be stable over time, regardless of faculty turnover and changes to department faculty productivity (Burris 2004; Masuoka, Grofman, and Feld 2007). This stability is partially attributed to well-connected senior faculty who are less likely to suddenly migrate to another program (Barnett et al. 2010). Third, these trends occur across disciplines, which show the persistence of the academic caste system.
Hiring in Other Disciplines
Studies in other fields have examined hiring and demographic trends and consistently have shown that a few universities produce a substantial number of faculty. The top five programs in sociology, political science, and history produced 32 percent, 34 percent, and 39 percent of faculty, respectively (Burris 2004). Others found that 25 percent of institutions produced 71 to 86 percent of tenure-track faculty in computer science, business, and history departments (Clauset et al. 2015); 15 schools placed 53 percent in anthropology (Kawa et al. 2018); and 20 percent of programs placed 60 percent in library information science (Shu, Yan, and Song 2016).
Elite universities share several characteristics. They are oftentimes private U.S. universities (Masuoka, Grofman, and Feld 2007; Shu, Yan, and Song 2016). 2 For example, Kawa et al. (2018) described a high level of reciprocity in hiring between the following ten anthropology programs: University of Chicago, Harvard, University of California (UC) Berkeley, Michigan, Stanford, Princeton, Columbia, Penn, New York University (NYU), and Yale—eight are private universities. Second, key universities are consistent across time. For instance, Columbia, Harvard, and University of Chicago were among the top ten programs to place graduates at PhD-granting political science departments over a seventy-year period (Masuoka, Grofman, and Feld 2007). These patterns even shape new disciplines, such as computer science (Wiggins, Adamic, and McQuaid 2008).
These inequities in the academic market can reproduce the inequities that these disciplines seek to remedy because the academy excludes faculty who can push for research and disciplinary innovations. There is substantial research about the challenges that racial minorities, female, and first-generation students face in the leaky pipeline that persists across academic rank and limit selection, promotion, and/or retention (Baldwin et al. 2012; Flaherty 2018; Gardner and Holley 2011; Griffith 2010; Smith 2013). Subsequently, gains in student representation alone will not lead to long-term changes. Baldwin et al. (2012) found that racial minority PhDs have increased over a twenty-year period—yet these students graduate from lower ranking schools. The pipeline particularly leaks when examining intersectional identities (Liu et al. 2019). The proportion of white men increases as they advance—from students to campus presidents (Chen and Hune 2011)—while other identities decrease. For instance, Chen and Hune (2011) found that increased Asian American and Pacific Islander female students resulted in little progress in those who are hired, obtain tenure, and eventually are promoted to administrative positions relative to white female faculty or Asian American and Pacific Islander men.
While studies highlight hiring networks based on institution, many do not include faculty demographics because of the methodological challenges of obtaining self-identified race/ethnicity. Planning studies have assessed racial/ethnic and gender demographics but have yet to combine literature on institutional hiring networks. This study is the first to combine hiring networks and faculty demographics in planning.
Literature on Academic Planning Workforce
Planning has acknowledged faculty representative disparities through research and ACSP committees (see Greenlee et al. 2022 for a summary). For example, Niebanck (1988) observed few female faculty and faculty of color. In the 1980s and 1990s, faculty of color comprised 14 percent of faculty (ACSP 1987-1988 Committee 1990), and Thomas (1996) counted 25 Black faculty in accredited programs. Planning programs have bridged the gap in female enrollment over time, but still lag in racial/ethnic minority enrollment (Lowe et al. 2016; Thomas 1996). 3 White faculty comprised about 68 percent and 67 percent of full-time planning faculty in 2008 and 2019, respectively (Planning Accreditation Board [PAB] 2019; Wubneh 2011). 4 Female faculty comprised 33 and 37 percent of full-time faculty in 2009 and 2017 (Lowe et al. 2018). 5
Studies have offered explanations for these disparities. First, Planners of Color Interest Group (POCIG) climate studies in 2008 and 2018 show discrimination and microaggressions across rank, from students to faculty (Greenlee et al. 2022; Wubneh 2011). Black and Latinx students reported feeling tokenized or invisible (García et al. 2021). Faculty of color also perceived that planning journals and funding agencies were biased against research on race/ethnicity; consequently, they published in non-planning journals, pushing their research contributions to the margins (Wubneh 2011). 6
Second, studies focused on the academic pipeline. Hill (1990) noted that planning programs needed to financially support master’s students to enter the pipeline earlier. In the first study on doctorate education in 1975, issues with the pipeline were identified including declining financial support, unreliable mentoring, and late recruiting efforts (Innes 1993). After graduating, issues persist. First- and second-year female faculty and faculty of color experience burdens of participating on projects or committees because they are presumed to have perspectives that are otherwise missing from underrepresented groups (Hamin et al. 2000). Yet, these studies do not consider hiring networks as additional explanations for why representational disparities continue. (Sanchez’s (2013) Planetizen article was the only descriptive analysis identified on hiring.) In addition to discrimination and retention issues, underrepresented groups may experience additional hurdles related to the planning hiring market.
Urban planning may differ from other disciplines for several reasons. First, accredited programs are primarily offered as graduate programs, and students do not need a bachelor’s degree in planning. Planning programs then present fewer barriers to entry than other fields. Second, planning programs are in a diversity of colleges or schools, such as geography, public affairs, or architecture (Anselin, Nasar, and Talen 2011). Third, most accredited planning programs are at public universities. Among forty-six PhD-granting planning programs, ten are private universities, two are Historically Black Colleges and Universities (HBCUs), two are public teaching universities, and thirty-two are public research universities. Consequently, planning may not follow other disciplines—while faculty of color comprised almost a third of full-time planning faculty members in 2008, they comprised less than a fourth across all U.S. degree-granting institutions (Wubneh 2011).
Data Collection and Methodology
The study sought to answer the following questions:
Which programs are key in producing and placing graduates in other planning programs?
What evidence is there of horizontal, downward, or upward hiring between program tiers?
After controlling for demographic and educational background, does the graduated program of study predict hiring at the top ten ranked planning schools?
Data Collection
I used the seventy-nine accredited U.S. PAB programs as the population, which had a total of 865 tenure-track or tenured faculty members—the unit of analysis. Emeritus faculty, professors of practice, adjunct professors, professors of teaching, and research professors were excluded (Burris 2004). While doctoral programs are not accredited, forty-two offered PhD programs in planning, and others had other doctoral programs in other fields such as public affairs or urban studies.
Data were manually collected between July and December 2020 by examining faculty profiles, curriculum vitae, dissertations, and websites by at least two coders to reduce error. A list of tenured and tenure-track faculty was created for each accredited program with the following: bachelor’s degree, bachelor’s degree institution, master’s degree(s), master’s degree(s) institution(s), doctoral degree, doctoral institution, rank, gender, race/ethnicity, and nativity. Programs of study were categorized into four areas: social science, humanities, STEM, and environmental studies. 7 Number of department faculty was a control variable.
Several approaches were used to triangulate the race/ethnicity variable. First, many faculty self-identified their race/ethnicity on online materials (e.g., faculty website, publications, online interviews, curriculum vitae [CV]). In addition, country of origin and country where the bachelor’s degree was earned was used to impute race/ethnicity for faculty members not born in the United States. In combination with these two approaches, photos, membership in POCIG, and/or or curriculum vitae advertised in a previous POCIG CV book identified non-white faculty. Nativity was collected using the country of the bachelor’s degree granting institution (ACSP Task Force on Global Planning Education 2019). Racial/ethnic identity was imputed for the population for the following: U.S.-born Black/African American; not U.S.-born Black; U.S.-born Latinx; not U.S.-born Latinx; U.S.-born Asian American; not U.S.-born Asian; Indigenous (American Indian, Native Hawaiian, Pacific Islander, and other Indigenous groups); and white. 8 While there may be errors in identifying faculty race/ethnicity and nativity, similar methods are used by faculty hiring committees when searching for candidate demographic factors.
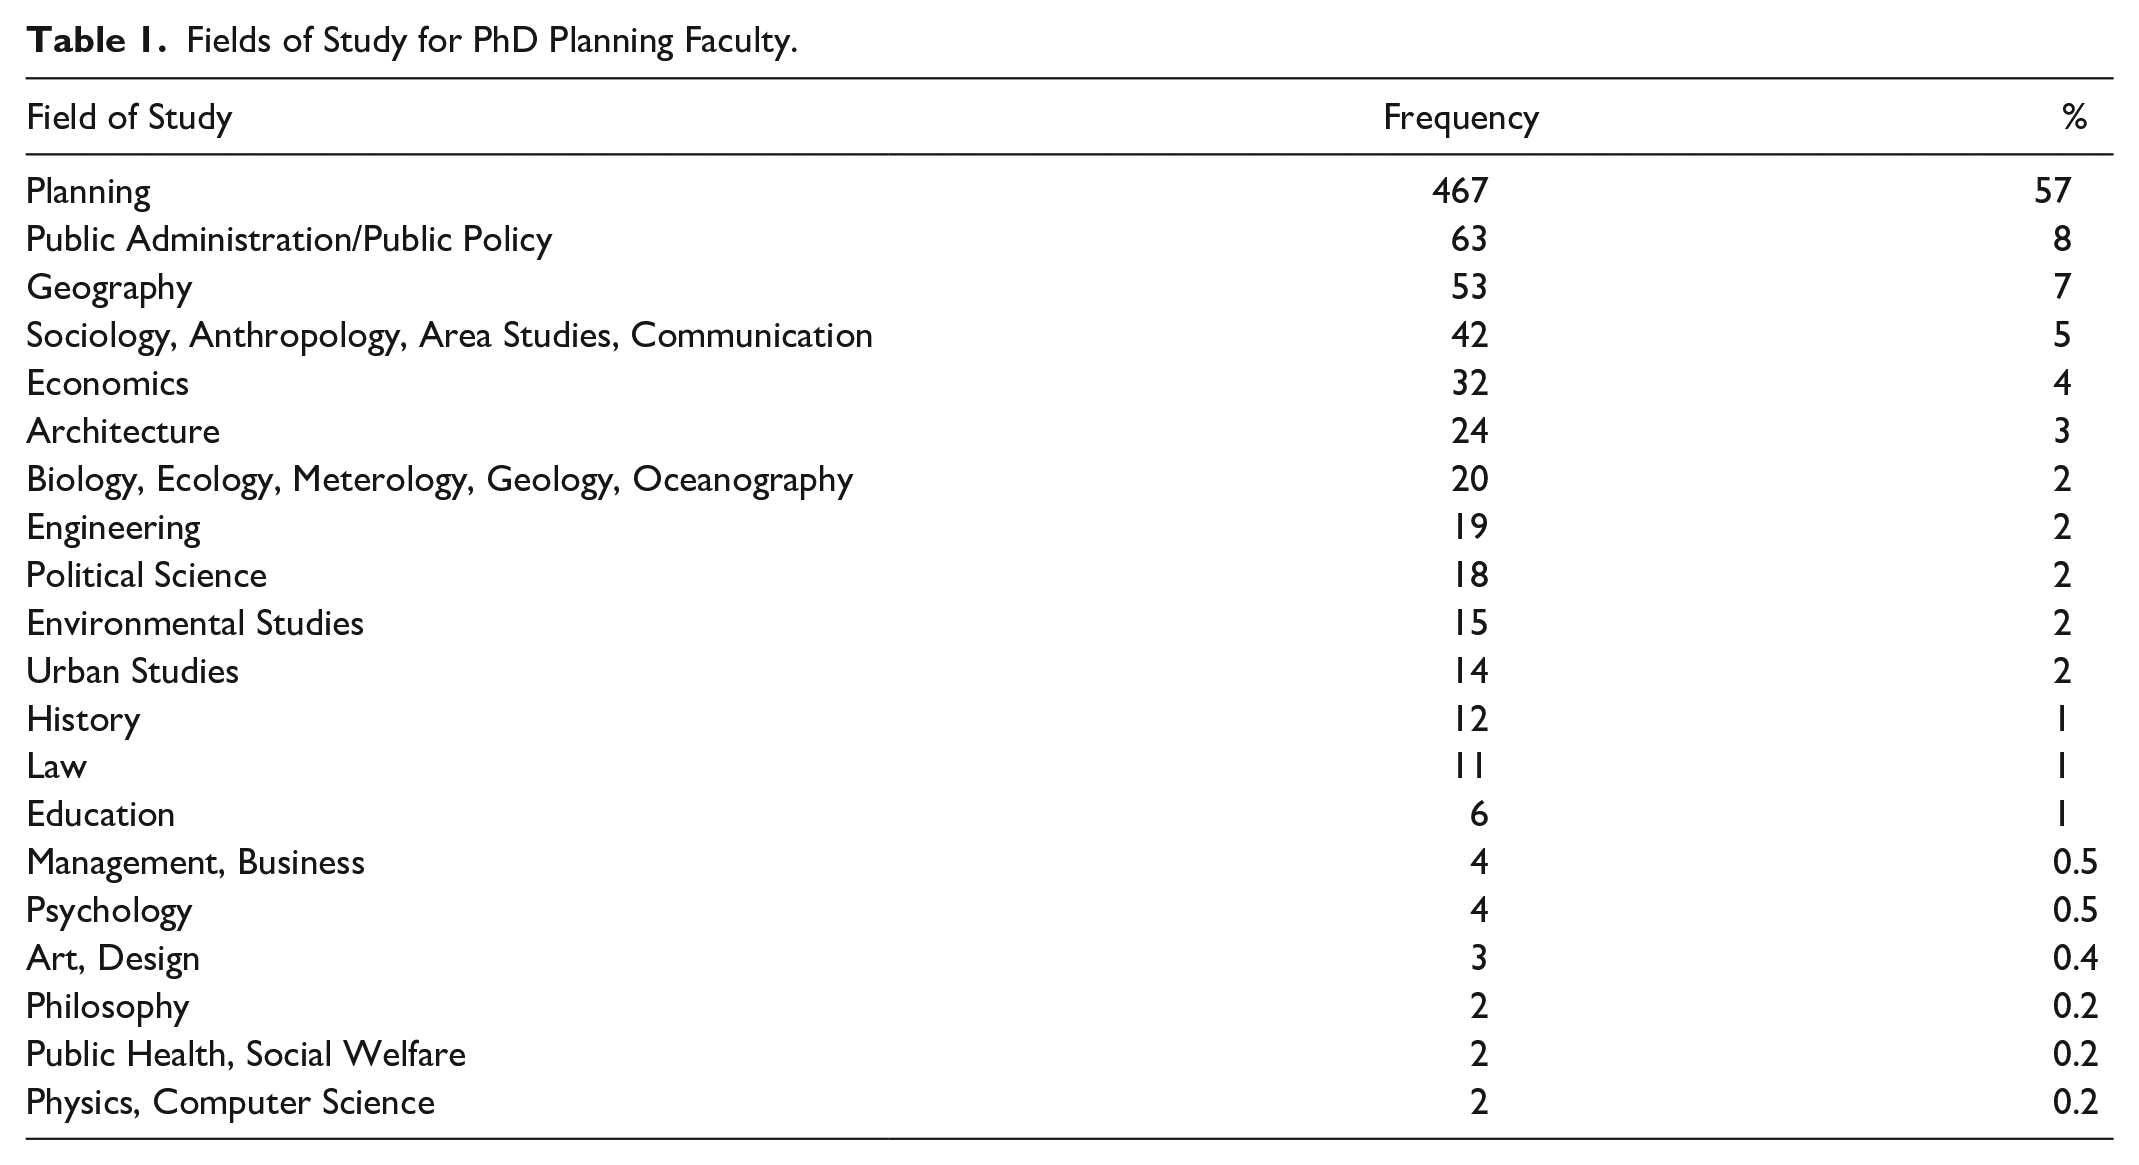
The most common bachelor’s degree was architecture (17%), followed by sociology/anthropology/area studies/communication (11%), engineering (8%), planning (8%), and economics (8%). About half received a social science bachelor’s degree (50%), followed by humanities (31%). The majority had a master’s degree (785 or 91%), and about 41 percent of master’s degrees were in planning, followed by M. Arch (14%) and MPA/MPP (5%). Forty-nine faculty did not have a PhD (6%) and studied landscape architecture or architecture. Most PhDs studied planning (57%), followed by public administration or public policy (8%; Table 1). 9
Fields of Study for PhD Planning Faculty.
About 75 percent of all faculty have tenure, and more than half are female (Table 2). White faculty comprise 65 percent of all faculty and have the highest percentage tenured (80%) among racial/ethnic groups. Native-born Asian American faculty have the lowest percentage tenured (53%), followed by Indigenous faculty (56%) and native-born Latinx faculty (57%). About a fourth were not born in the U.S. Faculty earned their highest degree on average more than eighteen years ago (SD = 11.86), and programs had on average eleven faculty (SD = 6.25).
Demographics of Faculty at Accredited Planning Programs.

Institutional Ranking
Sanchez’s (2017, 2019) planning program h-index was used to create program ranked tiers for the final research question. 10 This score measures individual researchers’ impact over a career while accounting for a few highly cited article outliers (Bornmann, Mutz, and Daniel 2008; Hirsch 2005; Norris and Oppenheim 2009). The h-index is widely used to measure institutional or program rankings (Huang 2012; Lund 2019; Meyers and Quan 2017; Smith et al. 2018). 11 Here, median h-index was used to assess tiers of programs from which a person graduated from and was hired (Lund 2019). The top ten institutions ranked by median H-indices were grouped together and included twelve programs because three programs had a medium h-index of fifteen (MIT, GA Tech, SUNY-Buffalo). I controlled for years since highest degree and program size, given their associations with h-indices and program prestige in other fields (Bornmann and Marx 2011; Burris 2004; Sanchez 2019). Appendix 1 lists planning programs by median h-index, if the program has a PhD program, and the year that the doctoral program began where applicable.
Analytical Models
The following variables were collected or calculated (Table 2):
Graduated program institutional rank (dummy variable, 1 = top 10 institutions, 0 = non-top 10 institutions)
Gender (1 = female)
Race/Ethnicity and Nativity
Academic Rank (tenured or tenure-track)
Years since obtained degree (from 2021; Sanchez 2019)
Program of study for Bachelor’s, Master’s, and Doctoral Degrees
Number of faculty in program
Logistic regression models were used to estimate hiring in the top 10 institutions:
y = b0 + b1;
y = b0 + b1+ b2;
y = b0 + b1+ b2 + b3;
y = b0 + b1+ b2 + b3+ b4;
where y equals getting hired in a top ten or non-top ten program; b1 is graduating from a top ten or non-top ten program, b2 includes faculty demographics (e.g., race/ethnicity, nativity, and gender), b3 are other faculty and program control variables (such as academic rank, years since highest degree, and number of faculty in the program), and b4 includes the educational programs of study. The first model tests the association between graduated and hired institutional program ranks. The second model assesses if association of the graduated program tier is statistically significant, after accounting for individual demographics. The third model examines the association between graduated program and hired program after adding in other faculty and program covariates. The final model includes fields of study (bachelor’s, master’s, doctoral) to assess if these covariates have a statistically significant association with hired institutional tier, over and above other faculty demographics and program characteristics.
Findings
RQ 1. Important Universities Producing Planning Faculty Members
Figure 1 displays universities that produced planning faculty with PhDs. Larger nodes indicate that the university graduated more planning faculty. Bivariate analyses reveal a few key institutions that place many faculty in accredited programs. UC Berkeley doctoral graduates account for 11 percent of all planning faculty, followed by MIT (7%), UCLA (6%), and Cornell (5%). Consequently, these are the largest nodes in Figure 1. Five universities comprised a third of placements at planning programs (Berkeley, MIT, UCLA, Cornell, and UNC Chapel Hill). At the other end of the spectrum, fifty-five universities placed one student and twenty-three institutions placed two students.

Network and placement of faculty with PhDs by graduated institutions.
Thicker lines indicate dense networks between universities—or universities that hire from each other’s graduates. For example, Berkeley and UCLA have a thick line connecting the nodes because they frequently hire each other’s students. There are also closed loops for some of the institutions (e.g., Berkeley, MIT, UCLA, Cornell), which signify that these institutions hired their own graduates. Thinner lines indicate weaker connections between institutions, with few hires from each other’s institutions. No line indicates that zero graduates were hired between universities.
Universities include institutions that do not have accredited planning programs to highlight the interdisciplinary nature of planning faculty. Consequently, planning faculty included in Figure 1 may have graduated from these institutions but earned a non-planning degree (e.g., public administration, geography). For example, fifty-one planning faculty earned a PhD in Geography and are included in Figure 1.
Additional bivariate analyses on academic rank can identify what institutions place recent doctoral graduates as assistant professors. For example, while Cornell is of the top five universities with placed students, only three graduates are current assistant professors. When examining assistant professor placement, Berkeley, MIT, and UCLA remain in the top three. However, UT-Austin becomes one of the top four institutions with eleven hired assistant professors, followed by Ohio State (10). As other programs place more assistant faculty, program rankings may gradually change. For example, since Sanchez’s (2013) study, MIT increased from fifth to second in placing graduates, while Cornell dropped from second to fourth in placements; beyond the top five institutions, there were other shifts. USC was not ranked in the top ten programs in 2013; here, it is ranked eighth in placements.
RQ 2. Mobility between University Tiers
The second question sought to understand if planning has an academic caste system. An academic caste would include a (1) core group of prestigious programs central to placing students, and (2) downward hiring at lower ranking universities with few cases of upward hiring between institutional tiers (Burris 2004). Downward hiring and closed upward hiring would then reify status divisions between institutions and programs. The previous section already identified central programs to placing students.
To assess mobility between program tiers, Appendix 2 displays hiring patterns among the forty-two PhD-granting planning programs, ranked by number of graduates who are faculty members in accredited planning programs. Here, I focus on PhD-granting programs because they are more likely to produce faculty who shape planning through research. The top five institutions place 42 percent of all faculty at accredited programs; they also place 47 percent of faculty at PhD-grant programs compared to 32 percent of accredited planning programs without a PhD planning program. Figure 1 highlights strong connections between the top programs as visualized through a thick line that, for example, connects Berkeley, UCLA, MIT, Cornell, and Penn. This placement difference highlights the exclusivity particularly among PhD-granting programs.
Figure 2 illustrates percentage of faculty who are hired in top five programs (“top tier”), remaining top twenty programs (“middle tier”), and non-top twenty programs (“bottom tier”), relative to the ranking of the program from which they graduated. Nearly half of top tier faculty are hired in the middle tier, and a third of top tier faculty are hired in the bottom tier. Nearly half of faculty from the middle tier are also hired by bottom tier programs.
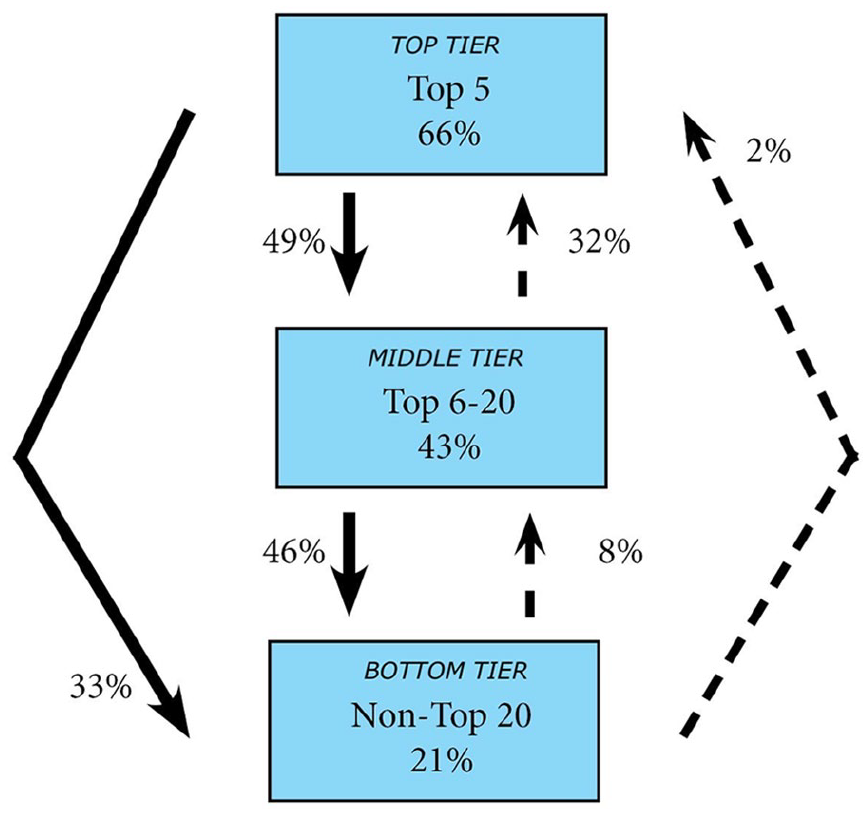
Percentage of upward, horizontal, and downward faculty relative to graduated program tier.
There are limits to upward mobility, depending on the tier of the institution. Faculty in bottom tier are rarely hired by top twenty institutions. Fourteen faculty graduating from the bottom tier were hired in the middle tier, and two were hired in the top tier. However, there is some evidence of mobility between top five and top twenty universities. Nearly a third of faculty (or twenty-six faculty members) placed at the top tier were hired from the middle tier—eight of these faculty graduated from Harvard. The tiers also reproduced a rigid mobility by hiring from the same tier. About 66 percent of top tier programs hired from each other, 43 percent middle tier programs hired each other’s’ graduates, and 21 percent bottom tier programs hired from the same tier (see also Appendix 2). In alignment with the academic caste theory, downward hiring is common between tiers but with limited upward mobility.
RQ 3. Factors Predicting Hiring at Prestigious Schools
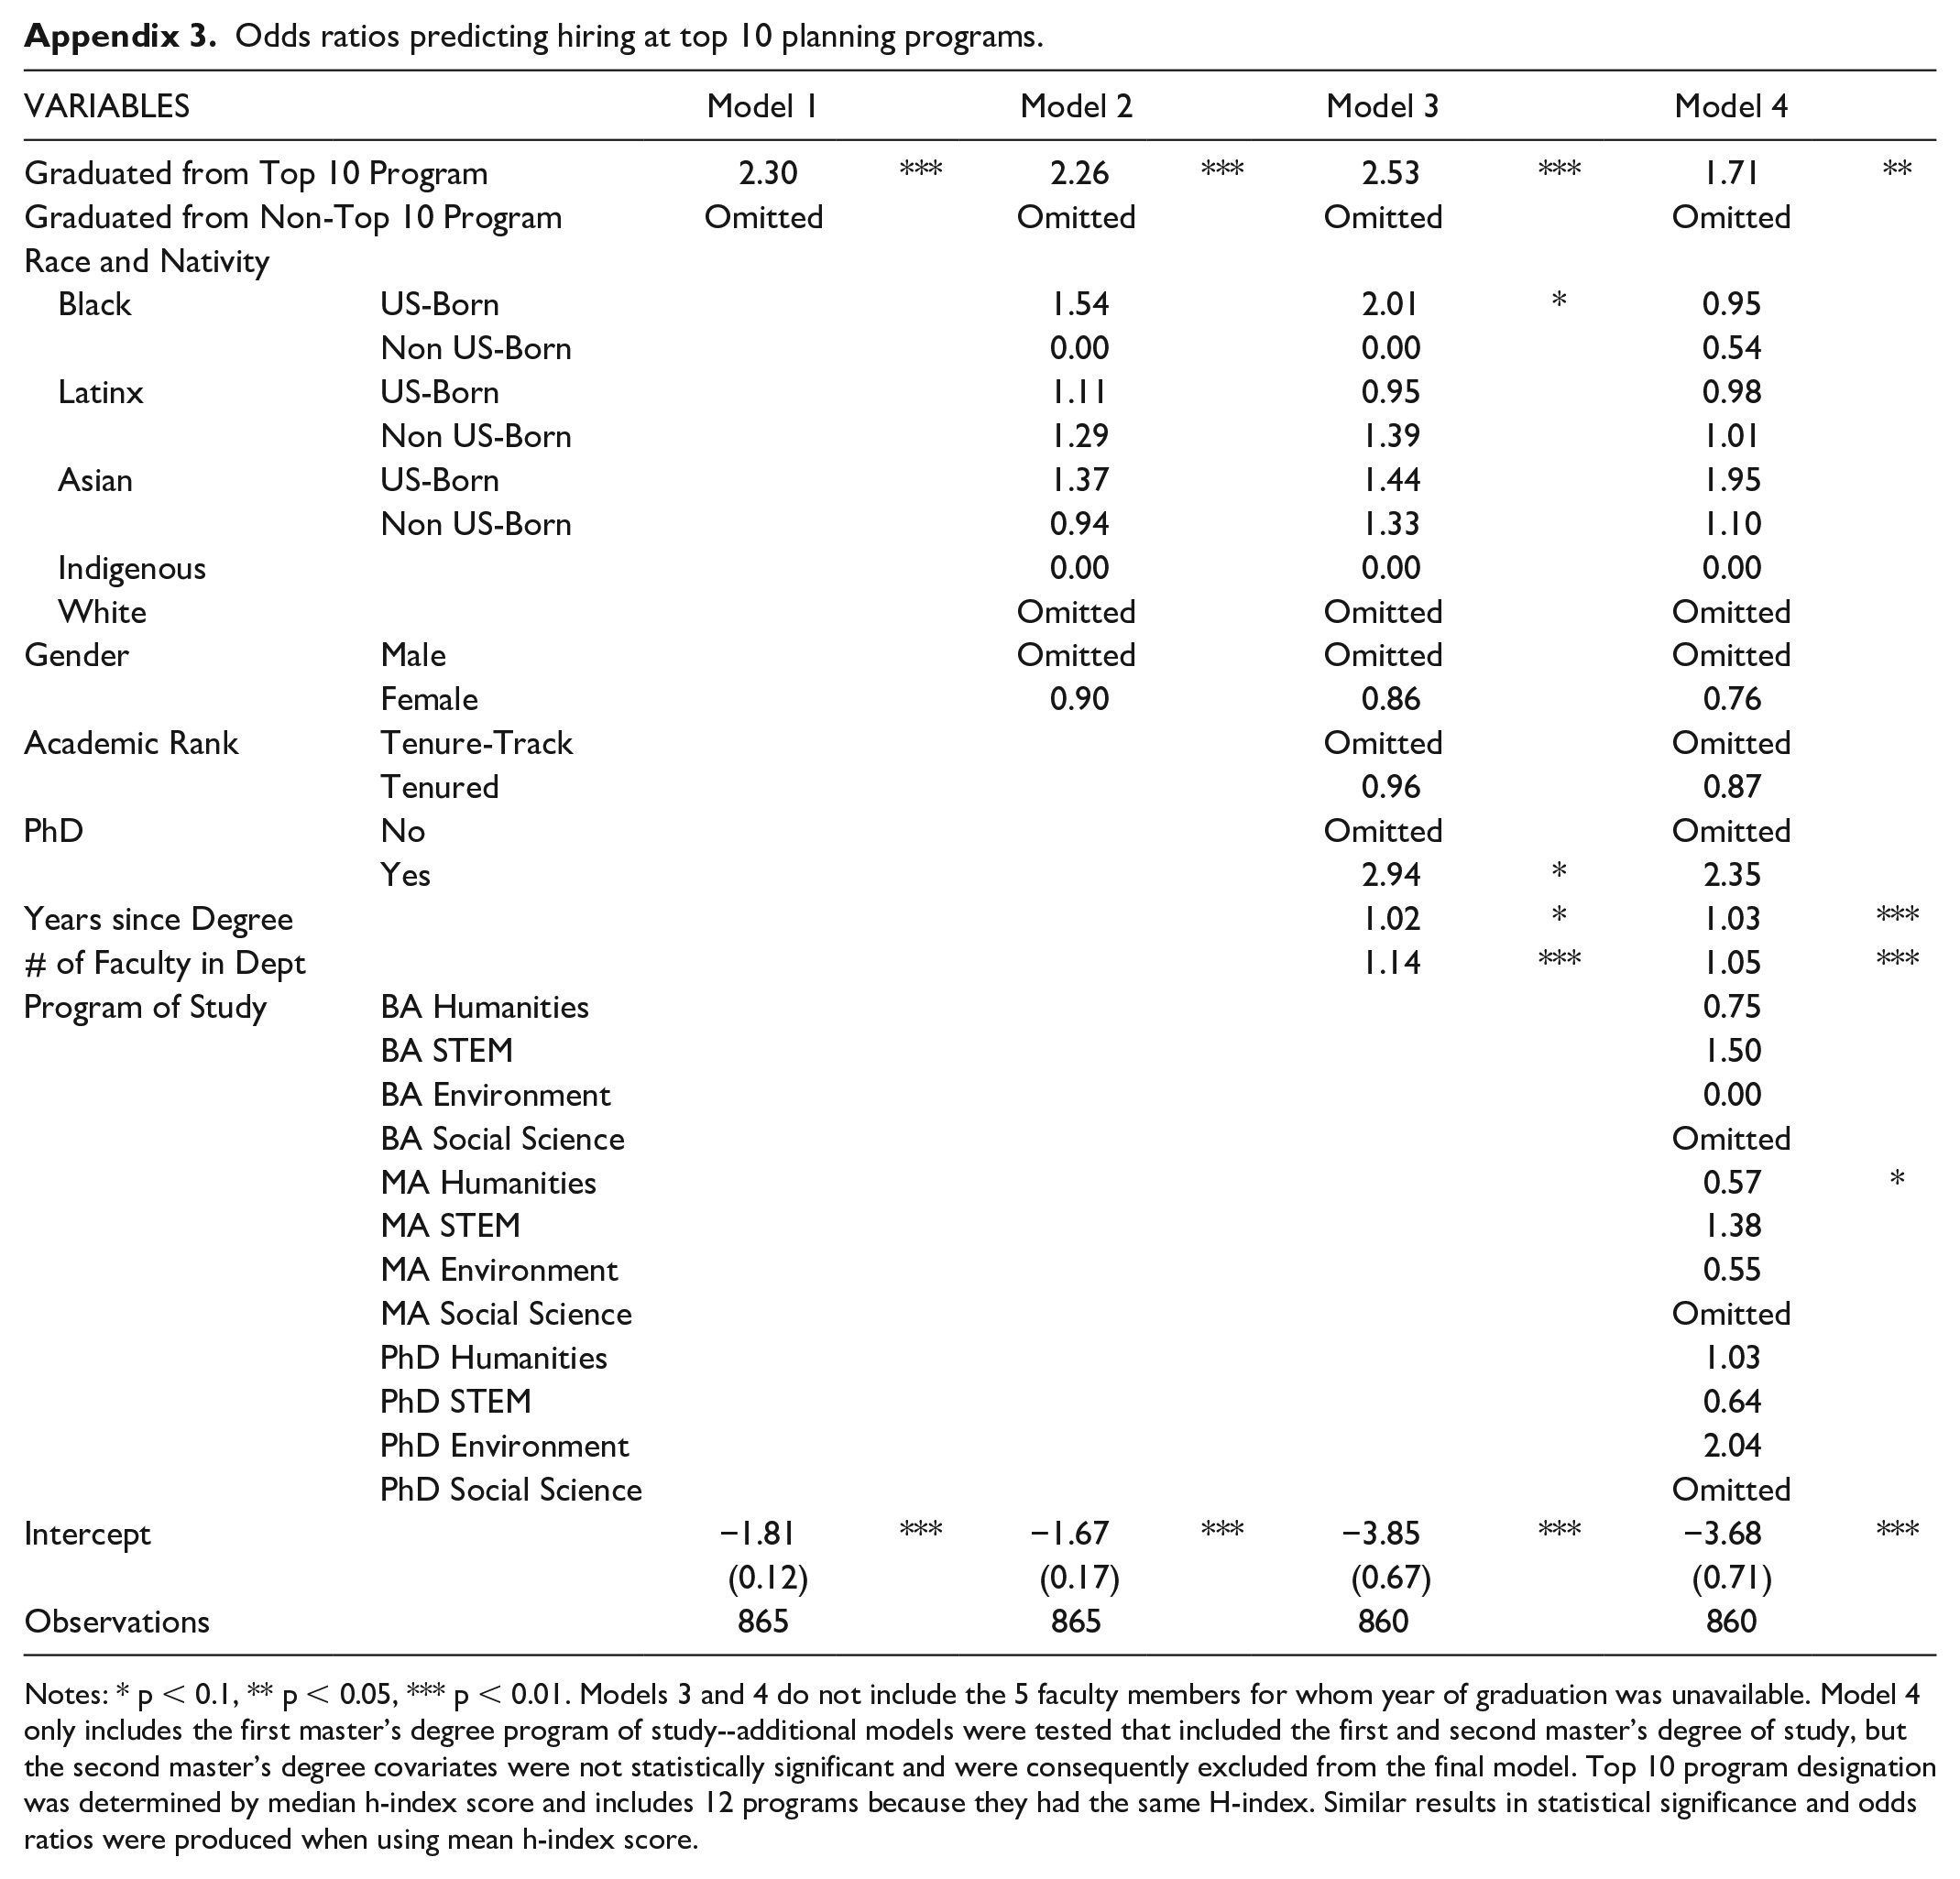
The final question examines whether graduated program ranking has a statistically significant association with hiring at top ten programs. The logistic regressions used median h-index score to rank universities to align with other studies that use citations to measure prestige (Huang 2012; Lund 2019; see Appendix 1). Appendix 3 summarizes the odds ratios predictions for the models. The analysis demonstrates that graduated program rank has a statistically significant positive relationship with hired university rank across the models. Faculty who graduated from the top ten programs had a higher likelihood of getting hired at a top ten program, after accounting for faculty and program characteristics. For the first three models, the odds that a graduate of a top ten program was hired at a top ten program is about 2.3 times the odds of a graduate from a non-top ten program getting hired at a top program (p < 0.01). The odds ratio decreases to 1.71 (p < .05) in Model 4, after accounting for program of study.
Faculty demographics (race/ethnicity, nativity, and gender) were not statistically significant. For example, the odds of faculty of color getting hired at a top ten program was not statistically significant relative to white faculty. Further bivariate analyses show similar proportions in hiring between top ten and non-top ten programs, which may explain the non-significant finding. For instance, U.S. born Black faculty comprise about 6 percent of faculty at top ten and non-top ten programs; white faculty comprise nearly two-thirds of all top ten and non-top ten hires. It is important to note small populations for some groups. There was 1 non-U.S. born Black faculty and no Indigenous faculty hired at a top ten school.
Other faculty and program characteristics predict hired university (Models 3 and 4). Years since degree and number of faculty were control variables and had a statistically significant positive relationship with top ten university hires. These relationships were expected, as faculty who have been in the academy longer and programs with more faculty are likely to have higher h-indices and resources to hire faculty (Barnett et al. 2010; Bornmann and Marx 2011). The final model assessed how programs of study may account for variance in hired university rank. Degrees in social science were the reference group. A master’s degree in the humanities had a marginally positive statistically significant relationship with hires at a top ten school relative to master’s degree holders from social science programs (p < .1). Otherwise, there was no statistically significant difference between programs of study. This finding illuminates how planning is interdisciplinary and likely to continue to hire from different fields beyond planning.
Implications and Conclusion
This is the first study to examine detailed faculty demographics and hiring in the planning academy. The findings provide evidence that align with the academic caste system theory. First, prominent programs were identified in placing graduates: Berkeley, MIT, UCLA, Cornell, and UNC-Chapel Hill. There was little upward movement between university ranking tiers. Graduating from a top ten program also had a statistically significant relationship with hires at a top ten program, while other covariates were not statistically significant.
However, the planning field is changing and may differ from other fields. As mentioned, some schools changed their ranking within ten years, such as USC, which moved to become one of the top ten schools in placing students. In contrast, Masuoka et al. (2007) found that Columbia, Harvard, and University of Chicago remained among the top ten programs in political science for more than 70 years. UT-Austin and Ohio State are also placing more assistant professors, which may signal a change in future rankings.
Future studies can evaluate whether the age of programs affect placements, particularly those that are placing more assistant professors. Program of study was also not statistically significant. This finding suggests planning will likely continue to be an interdisciplinary field, since non-planning PhDs did not have different outcomes as those with a planning degree. The field can thereby expand its pipeline by recruiting from other disciplines. Other studies can also provide nuance in understanding prestigious schools. Schools may have two-way exchanges of hiring each other’s’ students (Barnett et al. 2010) and prominent faculty may be more successful in placing students. Since prestige was based on citation scores here, further analyses could assess if planning subfields affects placement (Sanchez 2020; Stevens et al. 2022). Additional covariates related to salary and university location can be analyzed to understand impact on attracting and/or retaining faculty. Finally, studies can examine non-U.S. placements given the globalization of the field.
There were no statistically significant differences in hiring faculty of color or female faculty between top ten and non-top ten programs. This finding can be interpreted in several ways. This study captures faculty who make it through the pipeline and are successfully hired. Alternatively, high ranking programs may have more resources to conduct target hires and/or attract and retain candidates. Still, gender, race/ethnicity, and nativity remain important factors in hiring. For example, though female faculty are no longer underrepresented, harassment, sexism, and pay differences remain between male and female faculty (Croom 2017; Patton 2004). 12 Though faculty of color are successfully placed, the field is still predominantly white faculty, and more work is needed to support faculty of color (Turner, Gonzalez, and Wood 2008). We also do not know enough about Indigenous/Native faculty or students, who have been left out or did not self-identify in planning climate studies (Greenlee et al. 2022; Wubneh 2011). Cross-sectional data do not capture students and faculty of color who leave academia (Layton et al. 2016), hiring and placement over time by cohort, or time securing a job (Flaherty 2018; Masuoka et al. 2007)—these are areas for future studies. Other studies can also assess the age of a PhD program and track the planning PhD program pipeline, cohort sizes, demographics, and placement over time to understand who leaves the academy and where planning PhDs are hired, including accredited programs, types of colleges, and/or non-planning programs. Other studies can also examine trends over time as PAB guidelines continue to evolve around faculty diversity.
Higher education scholarship provides context as to how these findings perpetuate inequities. Tight hiring networks reward faculty who come from privileged backgrounds and/or adapt to the culture of prestigious universities—an elite “cultural competence” (Warikoo 2016). Students who decide to attend elite programs may feel more comfortable in affluent cultures (Jack 2016), while non-white students may feel discomfort (Torres 2009). The planning academy needs to evaluate whether using university prestige as a proxy for academic qualifications disqualifies barriers that underrepresented groups experience (Burris 2004; Nevin 2019). For example, planning can value “cultural competence” that is from lived experiences of diverse people from institutions beyond elite programs. About 24 percent of graduate students entered higher education through a community college (Fain 2017). While HBCUs comprise less than 3 percent of higher education institutions, they produce a high proportion of Black students who eventually earn a PhD. For example, nearly a fourth of Black science and engineering PhDs went to a HBCU (National Science Foundation 2018) and about a tenth of all Black doctoral students graduated from a HBCU (NCES n.d.). Planning schools can hire from HBCUs, community college, and other Minority-Serving Institutions that are gateways for future candidates of more diverse backgrounds. Furthermore, Bernal and Villalpando (2002) argue that higher education institutions are built on white supremacy in that Eurocentric perspectives are prioritized, and faculty of color who stray from this norm are rejected (see also Posselt et al. 2020).
Beyond academic background, other forms of implicit bias are embedded in hiring processes. Valuing elite institutions could be form as bias because of familiarity with a program or assumptions about the candidate’s abilities. Other metrics to assess and prioritize cultural competency can be used to evaluate candidates. For example, membership in programs, scholarships, and fellowships that support underrepresented groups can be included in evaluation rubrics, such as McNair Scholars, Gates Millennium Scholars, or the Ford Foundation. Rather than using institution as a shorthand for evaluation, a committee can specify what qualifications this proxy is used for and determine other evidence that would suggest quality training. This study is a step to understanding why the field lags in hiring and retaining underrepresented faculty. Students in the upcoming decades will become increasingly diverse, and planning programs need to hire in ways that support them to be responsive to the profession’s needs.
Supplemental Material
sj-docx-1-jpe-10.1177_0739456X221121611 – Supplemental material for Who Gets Hired at the Top? The Academic Caste System Theory in the Planning Academy
Supplemental material, sj-docx-1-jpe-10.1177_0739456X221121611 for Who Gets Hired at the Top? The Academic Caste System Theory in the Planning Academy by C.Aujean Lee in Journal of Planning Education and Research
Footnotes
Appendix
Odds ratios predicting hiring at top 10 planning programs.
| Variables | Model 1 | Model 2 | Model 3 | Model 4 | |||||
|---|---|---|---|---|---|---|---|---|---|
| Graduated from Top 10 Program | 2.30 | *** | 2.26 | *** | 2.53 | *** | 1.71 | ** | |
| Graduated from Non-Top 10 Program | Omitted | Omitted | Omitted | Omitted | |||||
| Race and Nativity | |||||||||
| Black | US-Born | 1.54 | 2.01 | * | 0.95 | ||||
| Non US-Born | 0.00 | 0.00 | 0.54 | ||||||
| Latinx | US-Born | 1.11 | 0.95 | 0.98 | |||||
| Non US-Born | 1.29 | 1.39 | 1.01 | ||||||
| Asian | US-Born | 1.37 | 1.44 | 1.95 | |||||
| Non US-Born | 0.94 | 1.33 | 1.10 | ||||||
| Indigenous | 0.00 | 0.00 | 0.00 | ||||||
| White | Omitted | Omitted | Omitted | ||||||
| Gender | Male | Omitted | Omitted | Omitted | |||||
| Female | 0.90 | 0.86 | 0.76 | ||||||
| Academic Rank | Tenure-Track | Omitted | Omitted | ||||||
| Tenured | 0.96 | 0.87 | |||||||
| PhD | No | Omitted | Omitted | ||||||
| Yes | 2.94 | * | 2.35 | ||||||
| Years since Degree | 1.02 | * | 1.03 | *** | |||||
| # of Faculty in Dept | 1.14 | *** | 1.05 | *** | |||||
| Program of Study | BA Humanities | 0.75 | |||||||
| BA STEM | 1.50 | ||||||||
| BA Environment | 0.00 | ||||||||
| BA Social Science | Omitted | ||||||||
| MA Humanities | 0.57 | * | |||||||
| MA STEM | 1.38 | ||||||||
| MA Environment | 0.55 | ||||||||
| MA Social Science | Omitted | ||||||||
| PhD Humanities | 1.03 | ||||||||
| PhD STEM | 0.64 | ||||||||
| PhD Environment | 2.04 | ||||||||
| PhD Social Science | Omitted | ||||||||
| Intercept | −1.81 | *** | −1.67 | *** | −3.85 | *** | −3.68 | *** | |
| (0.12) | (0.17) | (0.67) | (0.71) | ||||||
| Observations | 865 | 865 | 860 | 860 | |||||
Notes: * p < 0.1, ** p < 0.05, *** p < 0.01. Models 3 and 4 do not include the 5 faculty members for whom year of graduation was unavailable. Model 4 only includes the first master’s degree program of study–additional models were tested that included the first and second master’s degree of study, but the second master’s degree covariates were not statistically significant and were consequently excluded from the final model. Top 10 program designation was determined by median h-index score and includes 12 programs because they had the same H-index. Similar results in statistical significance and odds ratios were produced when using mean h-index score.
Acknowledgements
Thanks to Stephanie Pilat and Carissa Slotterback who read an early version of the manuscript.
Declaration of Conflicting Interests
The author(s) declared no potential conflicts of interest with respect to the research, authorship, and/or publication of this article.
Funding
The author(s) disclosed receipt of the following financial support for the research, authorship, and/or publication of this article: Funding was provided by the University of Oklahoma Inequities in the Academic Research and Creative Activity Enterprise Rapid Response Research Seed Grant. Daisy Munoz, Georgex Tafoya, and Duy Nguyen provided additional research assistance.

Notes
Author Biographies
References
Supplementary Material
Please find the following supplemental material available below.
For Open Access articles published under a Creative Commons License, all supplemental material carries the same license as the article it is associated with.
For non-Open Access articles published, all supplemental material carries a non-exclusive license, and permission requests for re-use of supplemental material or any part of supplemental material shall be sent directly to the copyright owner as specified in the copyright notice associated with the article.
