



Abstract
Is the compact city more likely to materialize if development is guided by the “invisible hand” of the market or the government’s “iron fist”? This article explores this question in the context of Shiraz, a medium-sized, medium-density city in south-central Iran. Through a series of longitudinal analyses, we examine the roles of the market and planning along thirty years, from the mid-1980s through the mid-2010s. The study reveals that since the mid-2000s, market forces have superseded government planning in guiding urban development in Shiraz. The government has reduced its interventions in the market: it no longer issues public land for housing development. Combined with natural constraints and sociodemographic pressures, this new planning/market balance has produced a denser and more compact city than ever before. Shiraz has been transformed from a city of villas, nightingales, and gardens into one dominated by mid- and high-rise apartment towers. The direction and intensity of development have not followed the recommendations of local planners and plans. Rather, they have been driven primarily by developers and residents. Regardless, density and compactness are generally positive—as long as housing and infrastructure quality are sustained, and residents have good access to parks, open spaces, and natural sunlight.
Introduction
Planners have long advocated for dense and compact cities and against urban sprawl. How to make this vision happen is a matter of debate. Is the compact city more likely to materialize if development is guided by the “invisible hand” of the market, or is the government’s “iron fist” better suited to the task? This article explores this key question in the context of Shiraz, a medium-sized city in south-central Iran. This is an interesting setting for this type of study because, since the 1990s, in line with international neoliberalization trends, the government here has been withdrawing its interventions in urban planning. At the same time, Shiraz has been transformed from a city of villas, nightingales, and gardens into one dominated by mid- and high-rise apartment towers. Through a series of longitudinal quantitative, qualitative, and spatial analyses, we examine the respective roles of the market and planning in this outcome; the timeline spans thirty years, from the mid-1980s through the mid-2010s. Prior to proceeding to the empirical portion of the study, we review the key historical evidence on the products of the interaction between planning and the market.
What Drives Urban Densification and/or Sprawl? Market vs. Planning in the Real World
Where planning policies and tools are effective and work in concert with private investors (individuals and companies), they can produce compact cities with medium-high densities accommodated within mid-rise, human-scale buildings. Examples of this approach are more often found in Scandinavian and northwestern European cities with mature and integrated planning systems (Broitman and Koomen 2015). Such balanced settings are the exception rather than the rule. Around the world, the interaction between planning and market forces has variably produced hyper-density or urban sprawl depending on the financial capacity of real estate investors, which range from large development companies to impoverished squatters. This continuum is illustrated in Figure 1 and unpacked below.
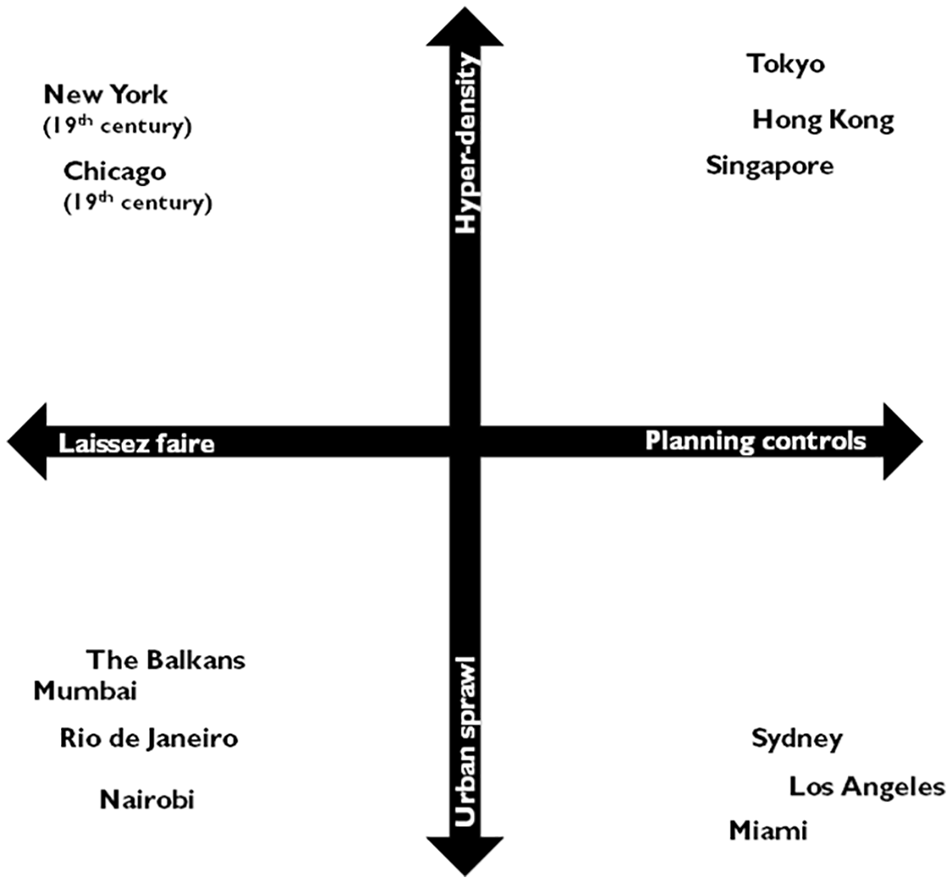
Densification patterns evidenced in the real world by level of planning control.
Planning Regulations Produce Hyper-Density
The prime examples are East Asian cities such as Tokyo, Singapore, and Hong Kong, which have very high densities created in the context of mature planning regimes and high levels of compliance with government regulations. Tokyo has employed regulatory and financial instruments (such as tax exemptions and/or value capture) to create hyper-dense urban nodes centered on rail stations. By coordinating land-use and transit development, the city has succeeded in making public transport profitable, increasing residential density in the urban core, and re-distributing employment from the CDB to secondary centers (Chorus and Bertolini 2011). However, critics point out that the Japanese government’s preference for compact land development in the capital has mainly aimed at attracting massive private sector investment in real estate and thus boosting its international image and competitiveness—rather than improving the well-being of locals (Aveline-Dubach 2020; Sorensen, Okata, and Fujii 2010; Waley 2007).
Singapore has also made densification a cornerstone of its development policy. Here, hyper-densities are a necessity given the constrained island setting. While the city-state has made an effort to grow its scarce land resources by reclaiming land from the sea, most urban growth has come in the form of infill (Angel et al. 2021; Dembski et al. 2020). Infill development can be delivered quite effectively in the context of centralized planning power and large-scale public ownership of land (Mugavin 2003). High-density, high-rise buildings are not necessarily concentrated in the center. In fact, some new suburban nodes created around rail transit stops (but also along highways) are denser than the central business district (CBD) (Angel et al. 2021; Grêt-Regamey et al. 2020). Unlike Tokyo, new development is not all for-profit. On the contrary, public housing (in high-rise towers near transit) is widespread (Joo and Wong 2008; Lin-Heng 2020; Wang 2012). Life satisfaction in such public housing is high because the quality of the apartments is good (Yuen et al. 2006). Also, residents share an understanding that concentrating units in tall buildings frees the ground for open and green spaces (Grêt-Regamey et al. 2020; Yuen 2009).
Like Singapore, much of Hong Kong’s land has traditionally been held in public ownership. While the private sector is heavily involved in real estate development (on land leased from the government), the public sector plays a critical role in planning for high-density. It uses policies and tools such as regulations on building volumes, density bonuses (in exchange for public amenities), and public housing provisions (Yeh and Yuen 2011a). Given limited space for expansion and a fragmented geography, high-rise buildings have been a necessity in Hong Kong, as in Singapore (Mahtab-uz-Zaman, Lau, and Mei 2000; Tang et al. 2019; Yeh and Yuen 2011b). However, the city also comprises a substantial amount of parkland outside its hyper-dense core.
Planning Regulations Produce Urban Sprawl
The United States and Australia are notorious for planning regimes which have enabled or encouraged urban sprawl. In the United States, all multifamily housing (including public housing and market-rate housing) was demonized by early twentieth-century social reformers as the enemy of human dignity, freedom, safety, and health. Zoning and taxation became prime instruments to restrict the construction of all types of housing but single-family (Baar 1996). This approach was complemented by massive federal funding to build urban and interurban highways. It led to the vast suburbanization of American cities, with devastating environmental and economic consequences (Lee, Ambrey, and Pojani 2018). Despite recent efforts to introduce “smart growth” concepts, single-family homeownership remains a crucial component of the American Dream. The situation will be challenging to reverse given the existing built-up patterns, the extreme decentralization of planning powers (Byun and Esparza 2005; Esparza and Carruthers 2000), and the political clout of NIMBY (Not In My Backyard) residents who want to protect their vested interests (Charmes and Keil 2015; McNee and Pojani 2022).
The Australian context is similar: low-density sprawl has been the dominant planning paradigm since the nineteenth century (Freestone, Randolph, and Pinnegar 2018). It was originally rooted in English Romanticism and the idealization of nature (Shepherd 2020), and has been sustained by local and state government regulations, public financing of houses in single-family lots, and investments in car-based infrastructure—despite opposition by real estate developers (Gurran 2011; Punter 2005). While zoning has not been as exclusionary as in the United States, Australian cities are among the most dispersed in the world (Ruming 2014) and residents remain emotionally attached to a suburban lifestyle in single-family homes with large gardens (Raynor, Mayere, and Matthews 2018; Willing and Pojani 2017). Meanwhile, planning regulations have only nominally changed to steer higher density development toward key urban nodes (Gurran and Whitehead 2011; Yang and Pojani 2017).
Laissez-Faire Regimes Produce Hyper-Density
The key example is New York—Manhattan in particular—in the late nineteenth century before planning was born as a separate professional discipline (Marcuse 1987). Unbridled capitalism and private real estate investors’ quest to maximize profits produced the city’s famed high-rise, hyper-dense development pattern (Drover 1975). In fact, the skyscraper was, at the time, a quintessentially American style; other parts of the world did not adopt it until much later. A 1900 comment from architect Cass Gilbert (quoted in the New York Times, July 4, 1997) captures the ethos of the era: “A skyscraper is a machine that makes the land pay.”
As New York grew dense and tall, the streets became congested, and apartment living (in lavish towers, derelict tenements, and everything in-between) became the norm. It was not uncommon for tall buildings to fill up almost the entire lot, allowing minimal room for air circulation and sunlight on the streets and posing a fire hazard. The only limit on height was the available technology and the cost/benefit ratio. This situation continued until a social reform movement took hold in the early twentieth century. Eventually, buildings’ use, height, and bulk were regulated by law (Marcuse 1987).
Laissez Faire Regimes Produce Urban Sprawl
Uncontrolled urban sprawl in the form of peripheral informal settlements is widespread throughout the Global South (Rocco and Van Ballegooijen 2019). It is also present in parts of Southern Europe—a lesser-known context. After the fall of the Iron Curtain in the 1990s, the small states that comprise the Balkan Peninsula came to reject government planning, which was associated with the communist dictatorship and its strict housing, zoning, and construction rules and embraced the notion of an unbridled free market (Pojani 2019, 2020; Pojani and Maci 2015). This shift in mentality, coupled with mass poverty, corruption, and high levels of internal migration, led to the construction of vast informal settlements in the outskirts of major cities (Pojani 2018, 2019, 2020, 2021; Pojani and Baar 2020). Some capitals, such as Tirana (Albania), doubled in size within a few decades in this new laissez-faire regime (Pojani 2010). In the case of Southern Italy, the powerful local mafia also plays a role in perpetuating sprawl. In Palermo, for example, the local Mafiosi have scarred the coastline by building luxury villas without planning permits or regard for the environment (Saviano and Tondo 2021).
Planning vs. Market in the Iranian Context
The notion of a “free market” is different in Iran relative to Western conceptualizations. Also, the relationship between the government and the market has unique local characteristics. In 1979, an Islamic Revolution took place in Iran, which overthrew Shah Mohammad Reza Pahlavi and replaced the monarchy with an Islamic republic ruled by Ayatollah Ruhollah Khomeini. Unlike the Pahlavi regime, post-revolution Iranian governments were theoretically opposed to capitalism, whose tenets of competition and hierarchy run against Islamic notions of equality and intrinsic dignity of all human beings. But in reality, most Islamic governments have pursued marketization strategies, which have led to the gradual privatization of major sectors, including health, education, and housing (Mirzamohammadi and Mohammadi 2017; Valadbaygi 2022).
Shortly after the Islamic revolution, Iran engaged in an eight-year war with Iraq (1980–1988). During that period, three primary economic actors emerged in the Iranian market. The key one was the government, which assumed control of most large industries inherited from Shah Pahlavi’s era. Second, populist religious organizations, known as Bonyads, gained power. These para-governmental trusts soon turned into giant private monopolies with little public oversight. The third group included Bazaaris—private businesses with close relationships with the government (Valadbaygi 2022). All of these have been involved in housing production. Bonyads have been particularly important, filling the gap created by a lack of direct foreign investment and the inability of small development companies to finance housing production (Valadbaygi 2022).
The first post-war government faced the challenging task of restoring a war-torn economy. Pro-Western factions in the government pushed to integrate Iran into the global markets, attract foreign investment, privatize public services, and reduce government subsidies to businesses and households—in line with the neoliberalism trends of that era (Sune 2020). Megaprojects and shopping malls located in large cities were Iran’s way of participating in the world economy (Razavi et al. 2017). However, given the strong presence of Bonyads and Bazaaris, the Iranian version of neoliberalism was (and remains) a hybrid of Western and Middle-Eastern models (Valadbaygi 2021).
Owing to petrodollars, consecutive Iranian governments have implemented some welfare policies to secure the votes of the working classes (Askari and Arfaa 2007). For example, in the aftermath of the Islamic Revolution, the government released large amounts of public land for housing development. Later, it reduced its intervention but kept providing land for housing through cooperatives. Eventually, however, the national government withdrew support for housing (Zarghamfard et al. 2019). In addition, starting in the 1990s, it began curtailing funding to municipalities. To make up for the deficit, local governments resorted to raising private capital by issuing density bonuses to real estate developers (Ghadami and Newman 2019) and relaxing planning rules (Karampour 2021).
Owing to these approaches, the housing crisis has deepened in the last decade (Karami et al. 2021), while public housing provision for low-income groups has been negligible (Povey 2019). At this point, it is clear that privatization, deregulation, and liberalization hardly benefit ordinary Iranian people. The main beneficiaries are large public and private entities, the military, and Bonyads (Razavi et al. 2017). Although real estate is a highly profitable sector, the poor are struggling in a liberalized regime (Povey 2019).
Moreover, an overreliance on housing construction taxes renders municipalities vulnerable to political and economic winds at the national and international levels (Karami et al. 2021; Shokri 2019). Since the Islamic Revolution, different governments have attempted to reduce their reliance on oil revenues by diversifying the economy (Izadi 2008). Still, global issues such as oil price fluctuations, Iran’s relationship with neighboring countries and the United States, and changes in currency rates continue to affect housing costs (Karami et al. 2021).
While housing speculation is driving urban development, it has also caused various market inefficiencies and externalities (Zarghamfard et al. 2019). For example, houses have been built in areas that lack urban services and infrastructure (Masoumi 2014). Poorly planned neighborhoods, or even whole towns, now line the fringes of large cities (Zali, Ghal’Ejough, and Esmailzadeh 2016). Historically compact and organic cities have turned into sprawling metropolises (Masoumi 2012). Government land releases in addition to market forces have played a role in this outcome (Hosseini and Hajilou 2019). Meanwhile, municipalities keep preparing masterplans that only cover the land within their administrative borders (Mohammadi-Hamidi et al. 2022).
Case Study of Shiraz
Shiraz, the capital of Fars province, is Iran’s fifth-largest city and the commercial and political center of the southern region. Its population surpasses 1.8 million. Over the past four decades, the city has experienced significant urban development. It currently occupies about 440 km2. At 3,400 inhabitants per square kilometer, the population density is medium-low relative to major Asian cities. Below we discuss the three major forces affecting Shiraz’s development: (1) natural environment constraints, (2) sociodemographic pressures, and (3) public policies and plans.
Natural Environment Constraints
Shiraz’s linear development owes to its environmental setting, consisting of a vast river plain stretching from the northwest to the southeast. Now, the river is dry most of the year, but there are occasional floods during the rainy season. Tall mountains border the plain on either side and a large lake (Maharloo) is on the southeast (Figure 2). Thus, on three sides, the topography limits the scope for expansion. While some flat portions exist on the southwest, expansion in this direction is constrained by a lower environmental quality (due to airport noise, industrial smoke, and sewage smells). Practically, the city can only extend toward the northwestern hills. This area is, in any case, the most desirable for residential development due to its lower summer temperatures, proximity to orchards and gardens, and a less moist soil (Azhdari, Sasani, and Soltani 2018). Therefore, real estate is costlier here. Consequently, the wealthy tend to live in the northwestern zone, whereas less affluent residents are concentrated in the southeast (Azhdari, Sasani, and Soltani 2018; Azhdari, Taghvaee, and Zahirnejad 2015).
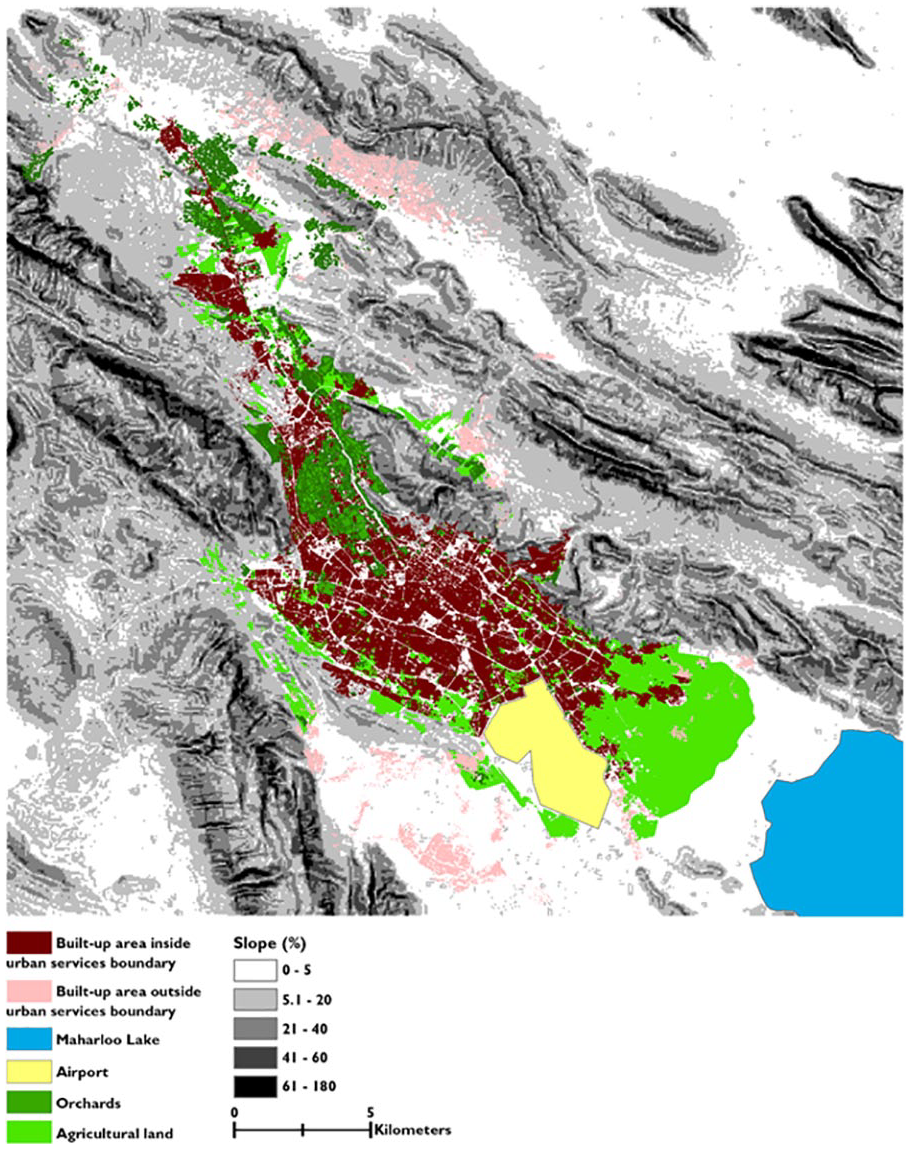
Shiraz’s natural constraints for expansion.
Sociodemographic Pressures
After the Islamic Revolution, the rural–urban migration intensified in Iran. Better economic and educational opportunities in cities played a significant role here. In Fars, the urbanization rate increased from 42 percent in 1976 to 70 percent in 2016 (Table 1). Urbanization was accompanied by a massive increase in birth rates immediately following the Revolution. Expanding healthcare services and the so-called “justice-based” economic policies of the era encouraged Iranian couples to have more children. In the mid-1980s, Shiraz’s population growth rate peaked at 7 percent per year. Once birth control policies were put in place in the late 1980s, Iran’s fertility rate fell well below the replacement rate. At 0.6 children per woman, it is now one of the lowest in the world.
Shiraz Population Growth and Urbanization Rates.
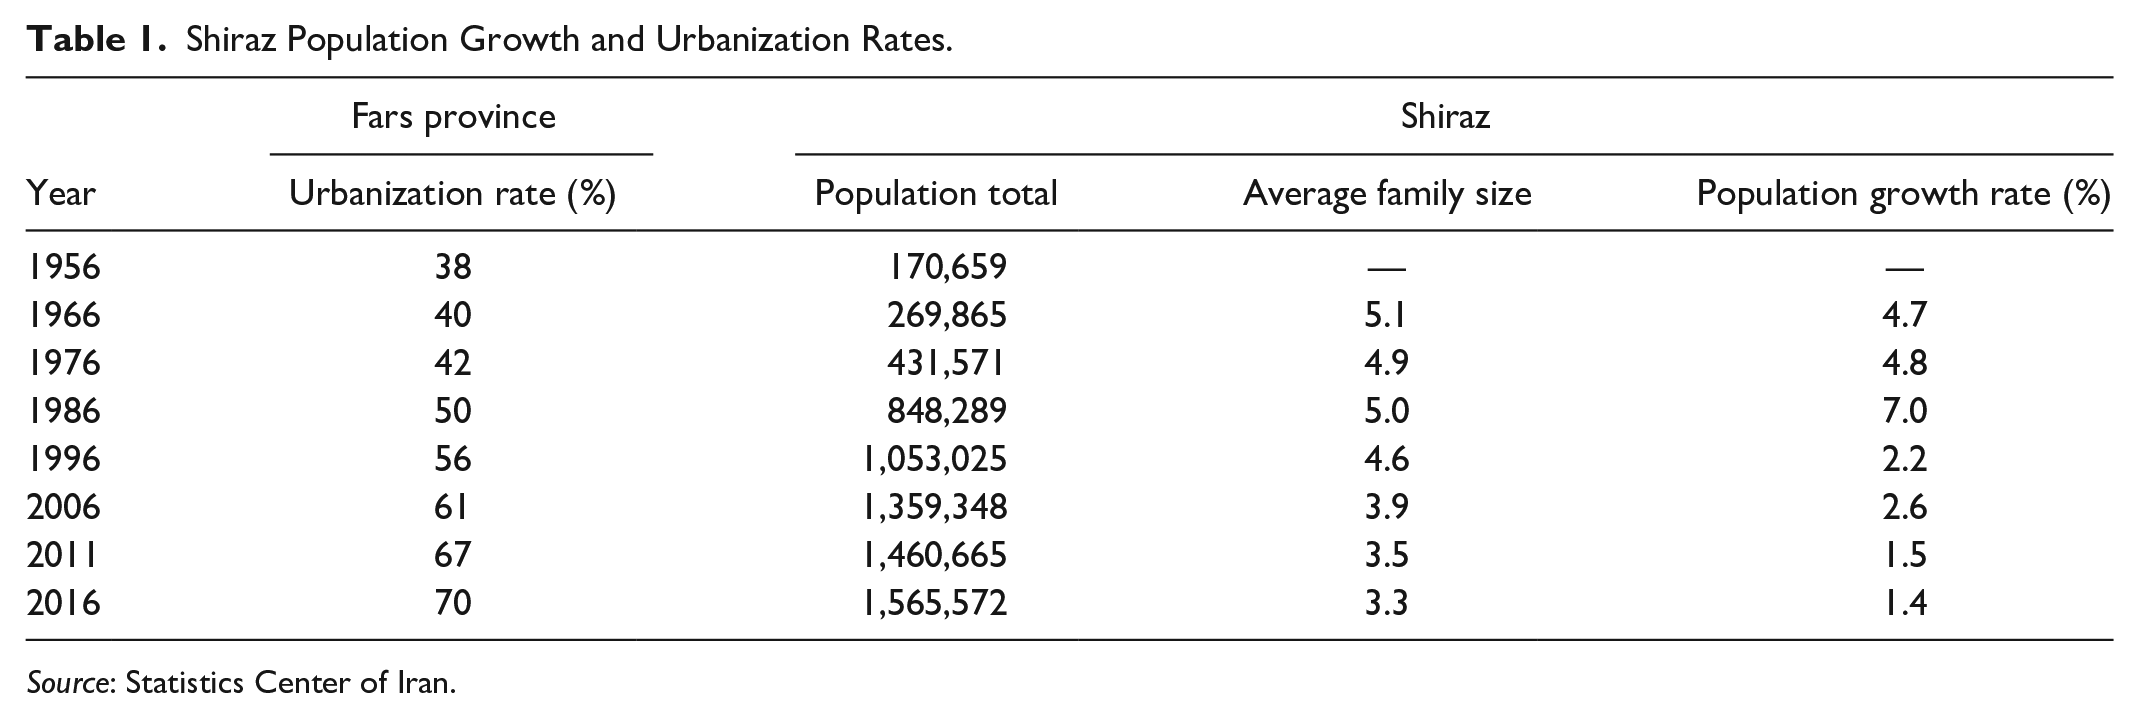
Source: Statistics Center of Iran.
In the 1980s, the protracted Iran–Iraq War also affected Shiraz’s demographic composition. The city hosted thousands of refugees, many of whom never returned to their hometowns after the war. As a result of these forces, the population increased from 430,000 inhabitants in 1976 to more than 1.8 million in 2021. Rural migrants, refugees, and other impoverished families and individuals inhabit massive informal settlements to the south of the city, eating into the agricultural land. The poor are exposed to major air and noise pollution coming from the airport. The central district (the historic zone) has decayed and currently houses destitute members of society. Socioeconomic ills such as drug trafficking and prostitution are rife here. The middle classes have fled to the northwestern neighborhoods. At present, residential segregation by income is one of Shiraz’s key characteristics (Azhdari, Sasani, and Soltani 2018; Azhdari, Taghvaee, and Zahirnejad 2015).
Public Policies and Plans
The national and local policies and plans that have affected Shiraz since the Islamic Revolution are listed in Figure 3. The first post-revolutionary government made “affordable housing for all” a centerpiece of its agenda at the national level. On this basis, it intervened vigorously in the housing and residential construction market. This approach was possible because the government was the principal landowner in the country.
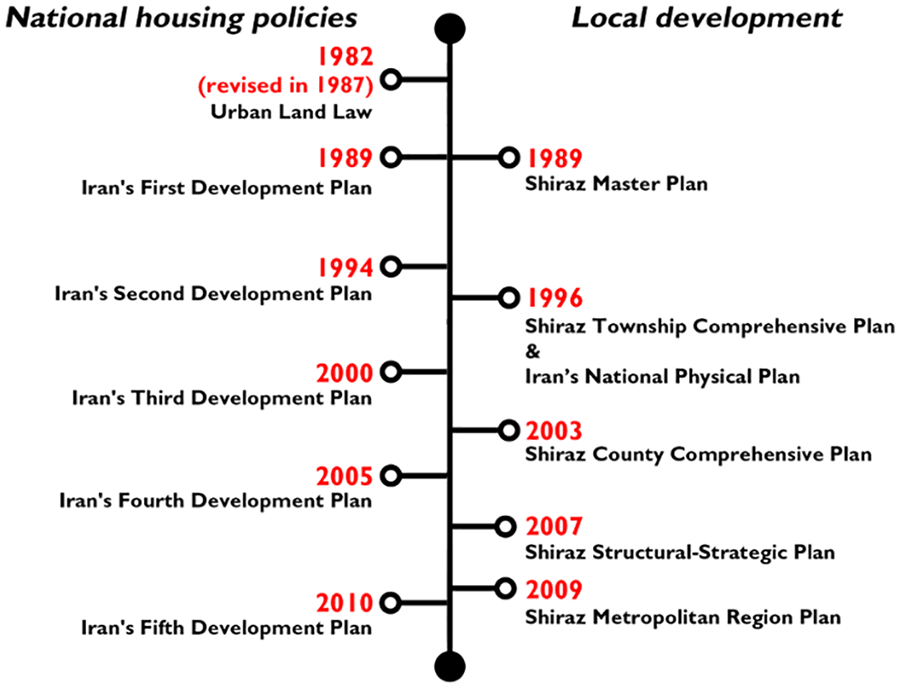
Timeline of national and local policies and plans affecting Shiraz.
In the 1980s, it started issuing free or low-cost land to disadvantaged groups under the new Urban Land Law. Through the early 1990s, based on the provisions of Iran’s First Development plan, an extensive amount of government land was slated for housing construction in the outskirts of major cities, including Shiraz. The houses produced in that era tended to be single-family, whereas apartment units were seen as a less attractive investment.
Later in the decade, with the adoption of Iran’s Second Development Plan, the share of government land supply was reduced to allow the market to play a more prominent role in housing provision. At the same time, to ensure that the housing needs of the poor were met, low-cost land was given to housing cooperatives, which resulted in new suburbs and satellite towns. Near Shiraz, the city of Sadra was established.
Iran’s Third Development Plan, adopted in the new millennium, continued along the same path. In Shiraz, this led to the establishment of more than forty cooperative settlements (Figure 4). The rest of the city grew in a frenzy during this time. The built-up area nearly doubled between 1996 and 2006. In good part, this was due to a new nationwide policy of selling density bonuses to developers to increase municipal revenues (Ghadami and Newman 2019).
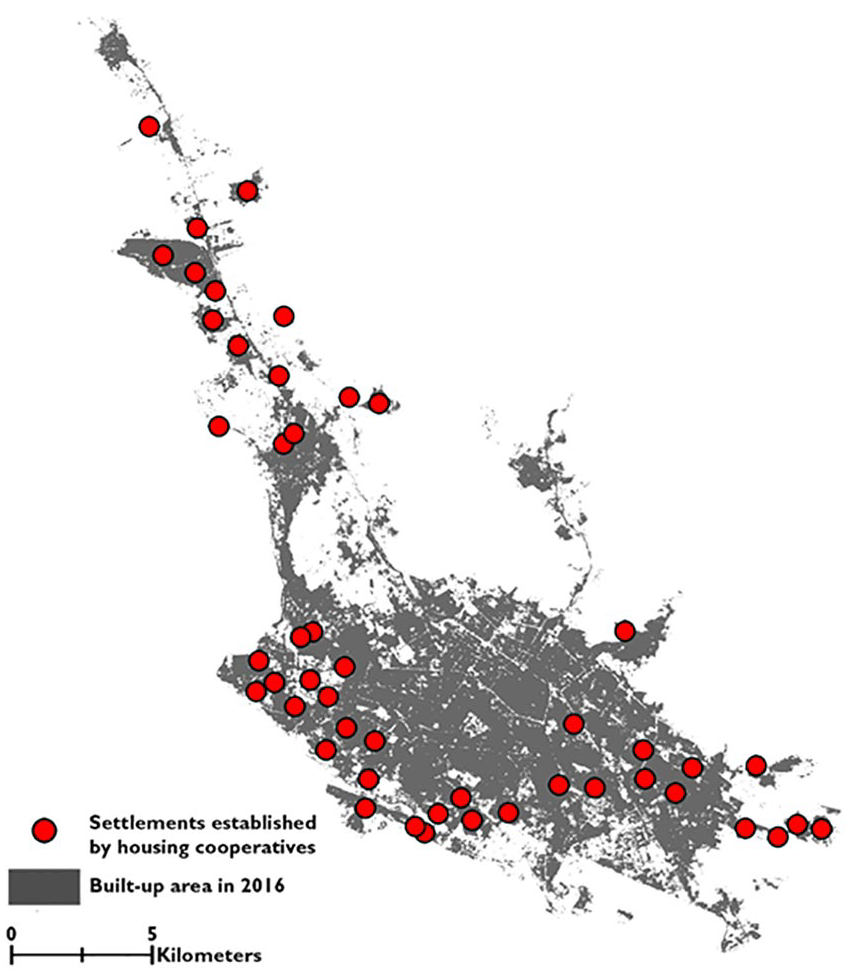
Location of settlements established by housing cooperatives in Shiraz.
With the adoption of Iran’s Fourth Development Plan, the country briefly returned to the earlier policy of issuing free or low-cost government land to house disadvantaged groups. This plan promoted the development of dense neighborhoods with mid-rise apartment buildings packing smaller units. But the plan moved from the notion of universal homeownership toward the concept of rental housing.
In the following decade, Iran’s Fifth Development Plan broke with the past by introducing provisions to privatize housing. To this end, issuing government land for residential construction was halted, and the housing and land taxation systems were reformed in favor of the market. With less government land available, private developers finally turned their attention to high-rise apartment construction. However, disadvantaged groups were still supported through housing subsidies.
In Shiraz, the City Master Plan of 1989 proposed both the intensification of construction within the existing urban footprint and the establishment of new satellite settlements. However, this plan—which was not formally approved until 1995—had little effect in guiding local development, partly due to the delayed preparation of historic preservation plan overlays. By the time two plan overlays to restore the historic zone and preserve the Qasr al-Dasht Gardens were approved in 2001, it was too late to start the implementation of the City Master Plan. Its horizon had been reached, and negotiations for a revision had begun.
In parallel to the (mostly failed) City Master Plan of 1989, the Shiraz Element in Iran’s National Physical Plan of 1996, the Shiraz Township Comprehensive Plan of 1996, and the Shiraz County Comprehensive Plan of 2003 made some provisions to guide the city’s development. All these regional plans envisioned future development as consisting of satellite towns and leapfrogging suburban settlements. The practical effect of these plans was limited; apart from Sadra, new satellite towns never materialized.
In the new millennium, local planning came to overshadow national planning. Following international trends at the time, Iran implemented a decentralization reform devolving planning powers to local authorities. Municipalities became fiscally independent of the national government, and the first city council election took place in 1998. The local plans that followed (the Shiraz Structural-Strategic Plan of 2007 and the Shiraz Metropolitan Region Plan of 2009) were much more influential than all the preceding plans combined. For the first time, the new plans did not endorse the expansion of the existing urban footprint. Instead, they proposed that future development be concentrated within the current service boundary in the form of compact, infill, and transit-oriented development (TOD) in the CBD and around new nodes (Figure 5). However, these plans were accused of elitism in that they retained lower densities in the wealthier northwestern zone.
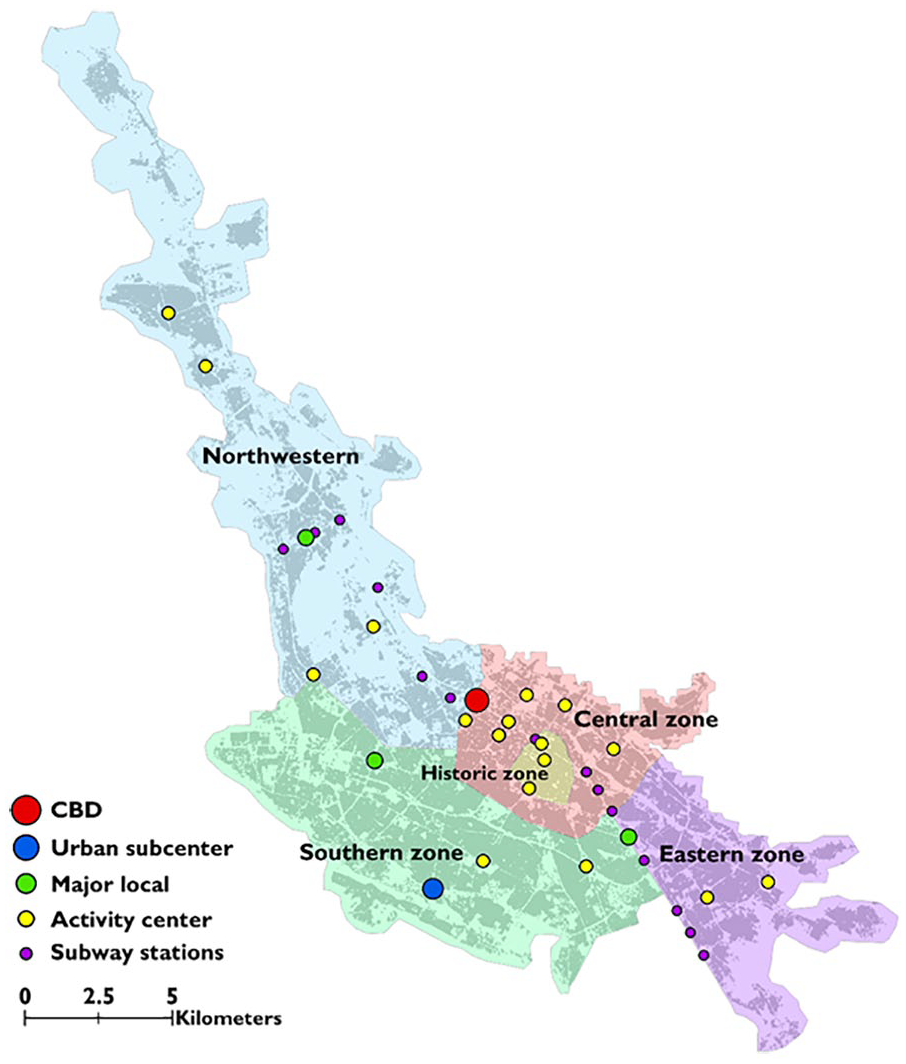
Differentiated density structure and a hierarchy of urban nodes proposed in the Shiraz Structural-Strategic Plan.
Data and Analysis
Conceptually, this study sought to determine whether the development proposals contained in the local plans (particularly the instrumental Shiraz Structural-Strategic Plan of 2007) have been consistent with the actual development in the city. The study timeframe extended from 1986 to 2016 to match the horizon covered by the local master plans.
To conduct the analysis, we employed three data sources: (1) provincial and municipal yearbooks, (2) satellite imagery, and (3) national censuses. These are described below, in conjunction with the steps of the analysis.
Provincial and Municipal Yearbooks
The yearbooks of Fars province and Shiraz municipality contain data such as the number of building permits issued, the amount of vacant government land given for housing, the average number of floors in new residential buildings, and the floor area ratio (FAR) 1 in new residential buildings. These data were used to explain the shift in housing patterns during the decades under study.
Satellite Imagery
We calculated the growth of built-up areas using satellite imagery. Four satellite images (for 1986, 1996, 2006, and 2016) were downloaded from Landsat 5, 7, and 8. 2 Then, the impervious surfaces (built-up areas as opposed to green or blue areas) were extracted in Envi 4.8. Finally, an index devised by Xu et al. (2007) was computed to examine Shiraz’s urban development patterns (ranging from sprawl to consolidation) along the decades under study:
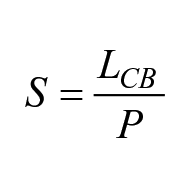
where S is the sprawl index, LCB is the length of the common boundary between a newly developed urban area and existing urban areas, and P is the perimeter of the newly developed urban area.
The results are interpreted as follows:
S ≥ 0.5 indicates “infill development,”
0 < S ≤ 0.5 indicates “edge expansion,”
S = 0 indicates “leapfrog development.”
National Censuses
Data on population density, FAR, and dwelling units were obtained from the Statistical Centre of Iran. We limited the analysis to 2006, 2011, and 2016—the last three national census years—because the data from earlier censuses are not sufficiently detailed. Also, the 2006–2016 timeframe coincides with the horizon covered by the Shiraz Structural-Strategic Plan. We conducted buffer analysis to investigate whether land-uses and population have been concentrating in the various activity centers identified in the Plan. That is, we created circles with different radiuses around the urban centers and measured the changes in land-use intensity and population density within those. 3
The key findings based on these data are discussed below. Future studies may also include data on housing and land prices for a more detailed market analysis.
Findings and Discussion
We discuss findings in three key areas: (1) urban expansion patterns, (2) land-use intensification, and (3) local plan compliance.
Urban Expansion Patterns
The map in Figure 6 shows that Shiraz expanded substantially between 1986 and 2016 (from 5,843 ha to a whopping 14,905 ha), with the most growth occurring between 1996 and 2006 as Bonyads took advantage of deregulation and privatization trends (Ghadami and Newman 2019; Izadi 2008; Povey 2019). The graphs in Figure 7 show that, overall, Shiraz also became more compact between 1983 and 2017. The supply of vacant land issued by the government for housing declined steadily, whereas building footprints became smaller over time. The average number of floors in new buildings increased from 1.17 in 1983 to 4.3 at the end of 2017, whereas the FAR grew from 0.49 in 1983 to 2.77 in 2017.
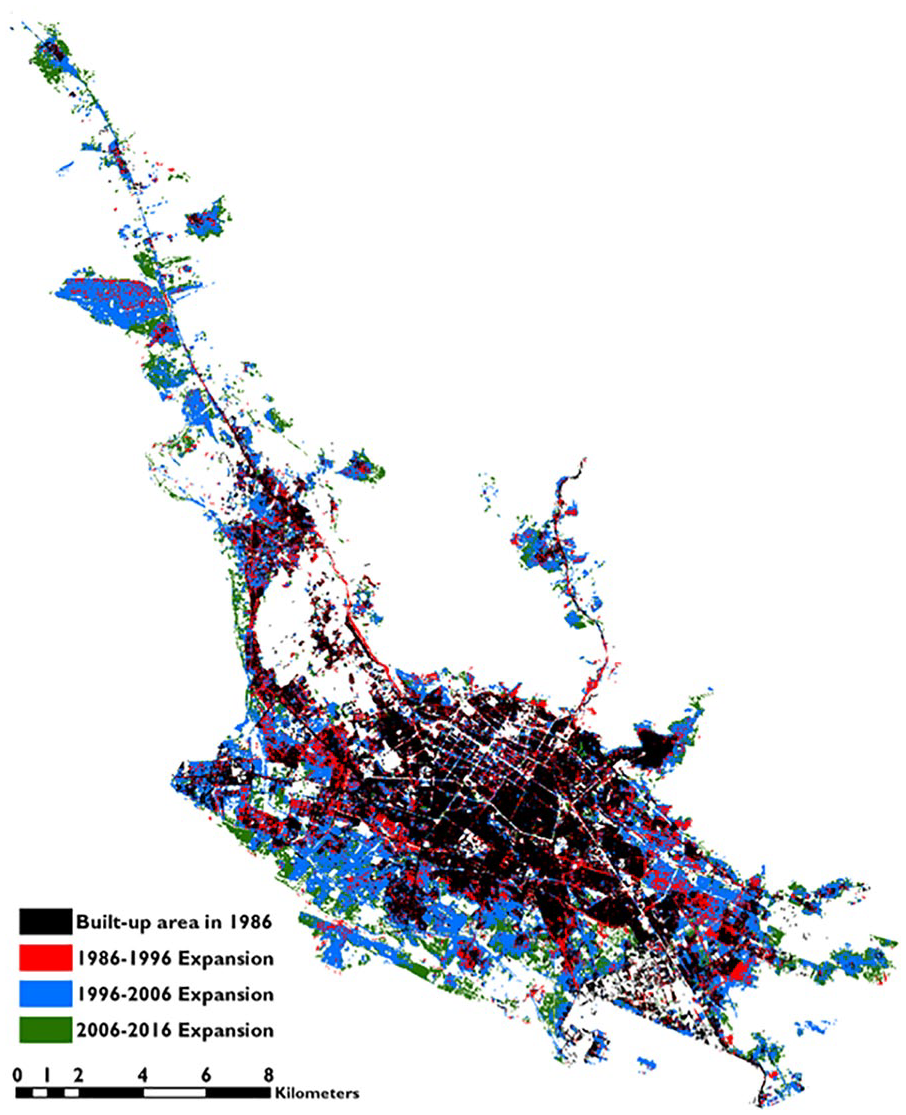
Shiraz’s expansion, 1986–2016.
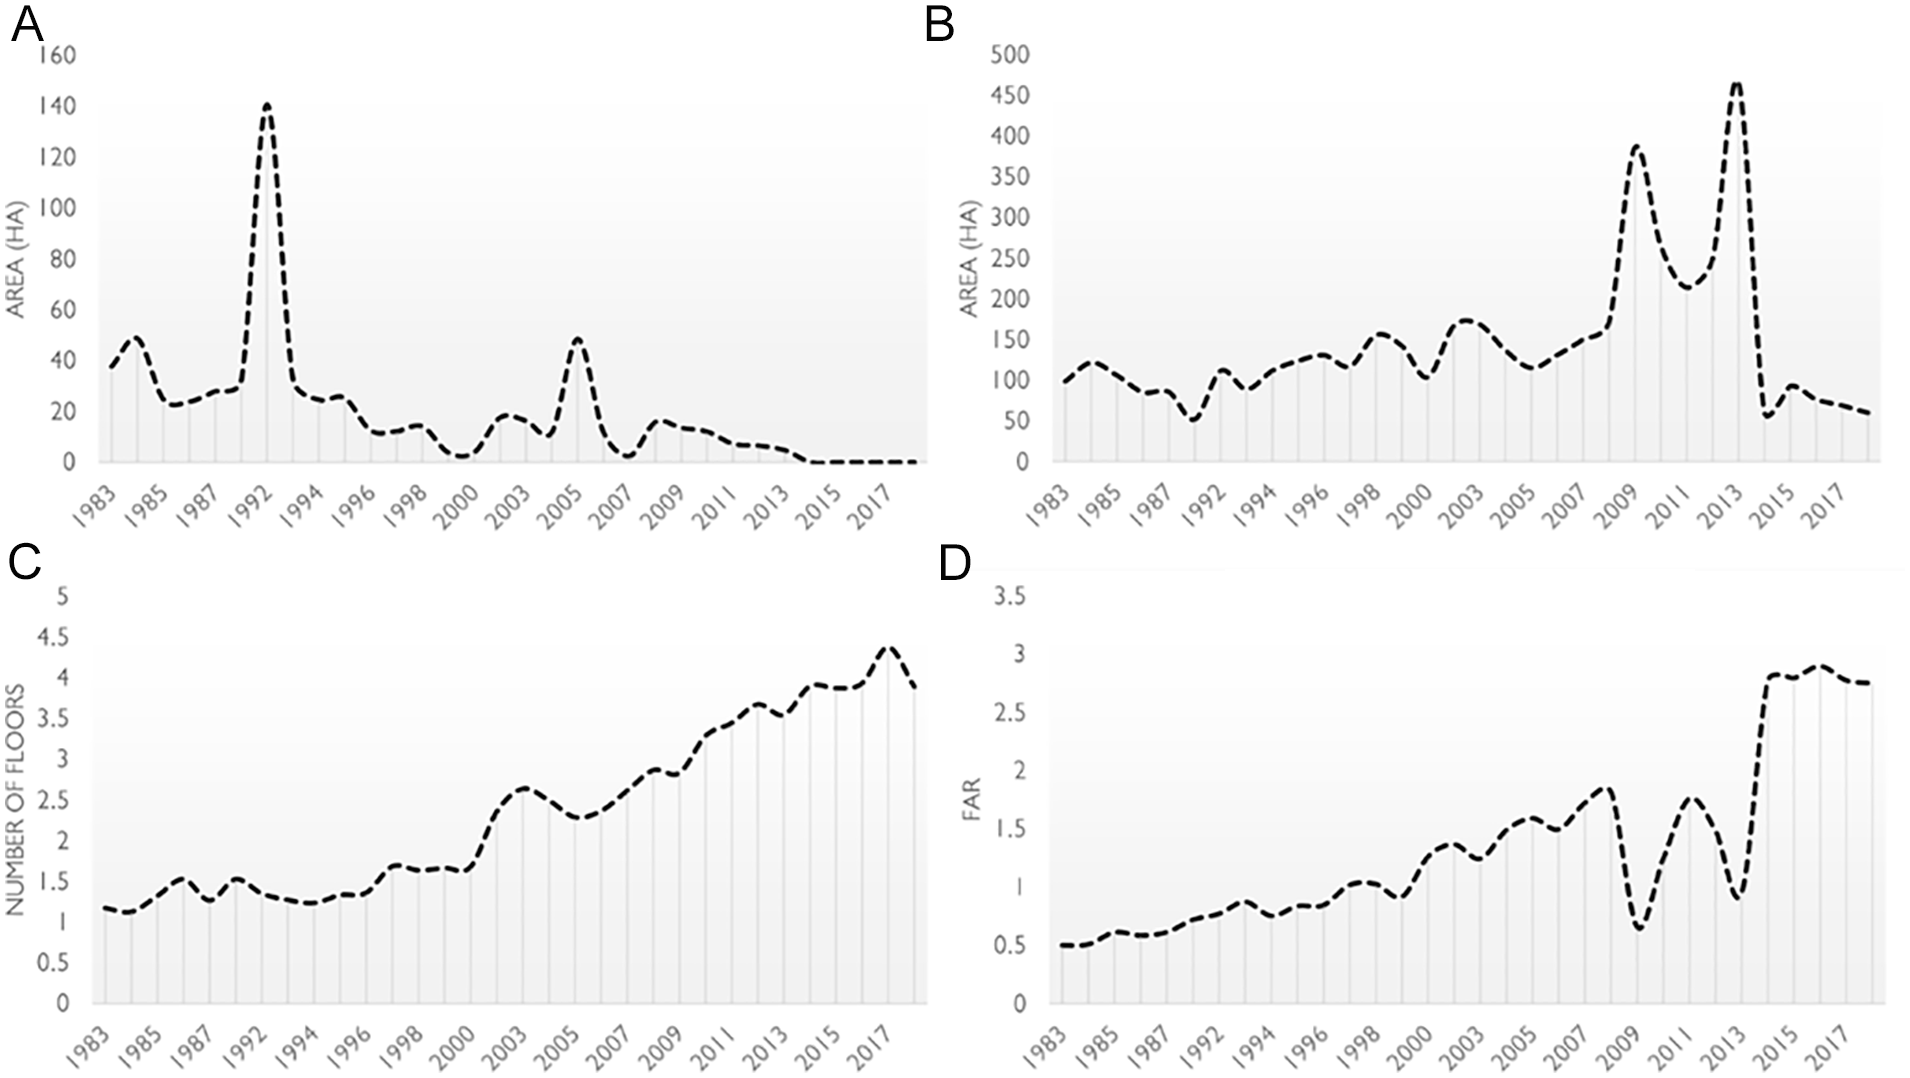
Consolidation indicators. (A) Area of vacant lands for new housing, (B) land area of issued building permits, (C) the average number of floors, and (D) floor area ratio.
However, the consolidation trends were not linear. For example, government land issued for housing spiked briefly in 1992 and 2005. Similarly, the size of new building footprints surged in 2009 and 2013, mirrored by a drop in FAR. Such sudden and temporary changes are explained by political phenomena known as the “Political Business Cycle” (Nordhaus 1975) and “Election Driven Informality” (Imami, Lami, and Pojani 2021). These are generally defined as a tendency of governments, especially in the Global South, to modify their policies in the period leading to, or immediately following, elections to curry favor with voters. Their actual manifestation differs by country. In the case of Iran, the government controls the pricing of raw construction materials such as iron and cement, and prices are stabilized or even artificially lowered in the run-up to elections, enticing more people to build. These interventions, cross-subsidized through oil sales, are a type of welfare employed by incumbent government to win votes (Povey 2019). In other countries, governments may increase public expenditures on infrastructure or show leniency toward informal construction (Imami, Lami, and Pojani 2021).
Returning to Shiraz, Figure 8 shows the different patterns of urban development by zone, based on Xu et al.’s (2007) sprawl index. As seen, the northwest attracted more new construction than any other zone. Development in the southwest and southeast was also significant. Meanwhile, the northeast (due to its natural constraints) did not accommodate much growth. Most growth took the form of “infill development,” whereas “leapfrog development” declined. Overall, the city experienced a transformation from a sprawling to a compact pattern.

Patterns of urban development, based on Xu et al.’s (2007) sprawl index.
However, the northwestern zone was markedly different from the rest, particularly during the last decade under study (2006–2016). Here the prevalent development type was “edge expansion.” Furthermore, it was the only zone in Shiraz where “leapfrog development” accounted for more than 10 percent of the total growth. A megaproject (the Persian Gulf Complex), combining shopping and other commercial functions, was also located in the northwest. Both “edge expansion” and “leapfrog development” run contrary to the goals of the new master plan (combating sprawl). Yet, that is what developers and residents in this zone prefer. Together, these findings mean that the market has been the dominating force shaping development in the northwest.
Land-Use Intensification
Overall in Shiraz, between 2006 and 2016, the population density increased by more than 4 percent (to reach 70.7 people/ha), the FAR increased by 74 percent (to reach 0.94), and the dwelling density increased by 38 percent (to reach 20.9 units/ha). The charts in Figure 9 visualize changes in these indicators by zone over the same 10-year period.
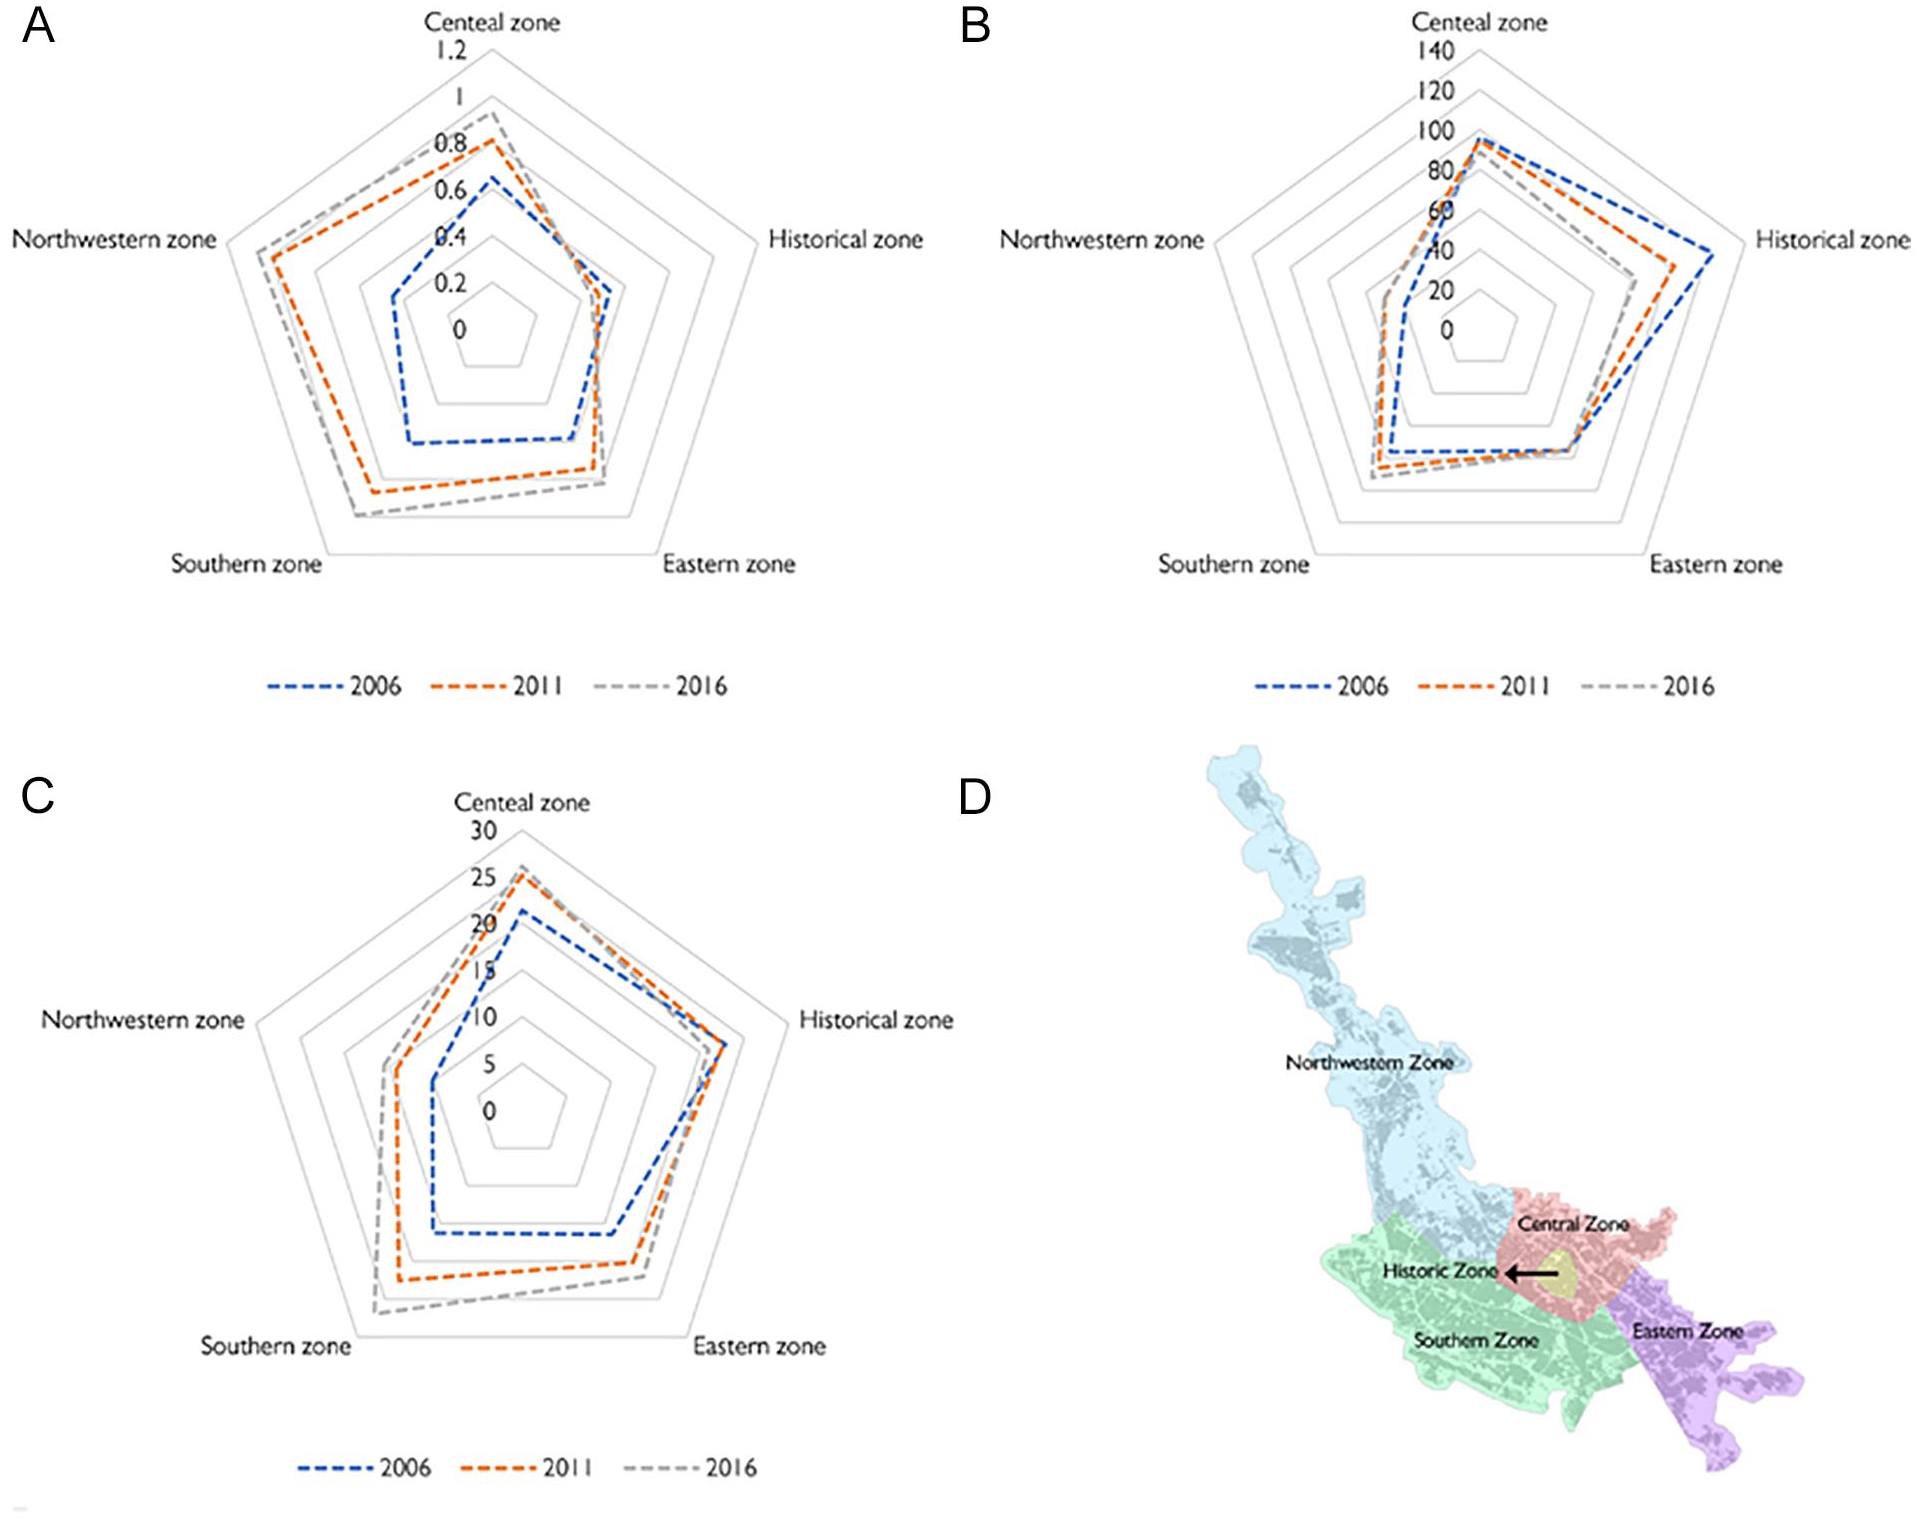
Changes in floor area ratio, population density, dwelling density by zone, and Shiraz’s five zones as defined by the new master plan. (A) Floor area ratio, (B) population density, (C) dwelling density, and (D) five zones of Shiraz.
As seen, the historic zone experienced a dramatic decline in population density (−33%). The FAR similarly decreased by 15 percent, just as the dwelling density dropped from 23 to 21 units/ha. The population density also decreased in the central zone (by 7%), but the change was less visible than in the historic zone. Meanwhile, the FAR and the dwelling density increased here (by 43% and 22%, respectively). However, both values were significantly lower than the city average. The eastern zone saw the smallest increase in the FAR (41%), population density (only 0.1%), and dwelling density (from 16.4 to 22 units/ha). This indicates “infill development” but with a lower intensity than in other zones. The population density in the southern zone jumped by 20 percent. The dwelling density increased by 65 percent—more than in any other zone and much more than the city average. The increase in the FAR was below average at 63 percent. As with the sprawl index, the northwestern zone behaved uniquely. The FAR, population density, and dwelling density all grew here (by 135%, 27%, and 53%, respectively), but in 2016 these indicators were still much lower than in other areas of the city. The FAR was 1.06, the population density was 50.3 people/ha, and the dwelling density was 15.5 units/ha.
The maps in Figure 10, which cover the period between 2006 and 2016, show that urban development intensified in the northwestern and southern zones, while the central zone, especially the historic core, decayed. Clearly, the northwestern zone was the primary focus of development in Shiraz (see Bagheri and Tousi 2018)—contrary to the master plan’s provisions of reorienting growth toward the south. The construction in the northwest of the largest commercial and entertainment complex in the Middle East (2011) and the transfer of the central railway station from the southeast to the northwest (2010) confirm that market forces have prevailed over public planning in driving urban development in Shiraz.

Change in floor area ratio (left), population density (middle), and dwelling density (right) from 2006 to 2016.
Local Plan Compliance
As noted, the Shiraz Structural-Strategic Plan of 2007 proposed creating and/or strengthening various nodes throughout the city—following the “urban village” model. Figure 11 presents, in graph format, the results of the buffer analysis measuring the changes in land-use intensity and population density around those nodes between 2006 and 2016. For the location of the nodes, refer back to Figure 5.
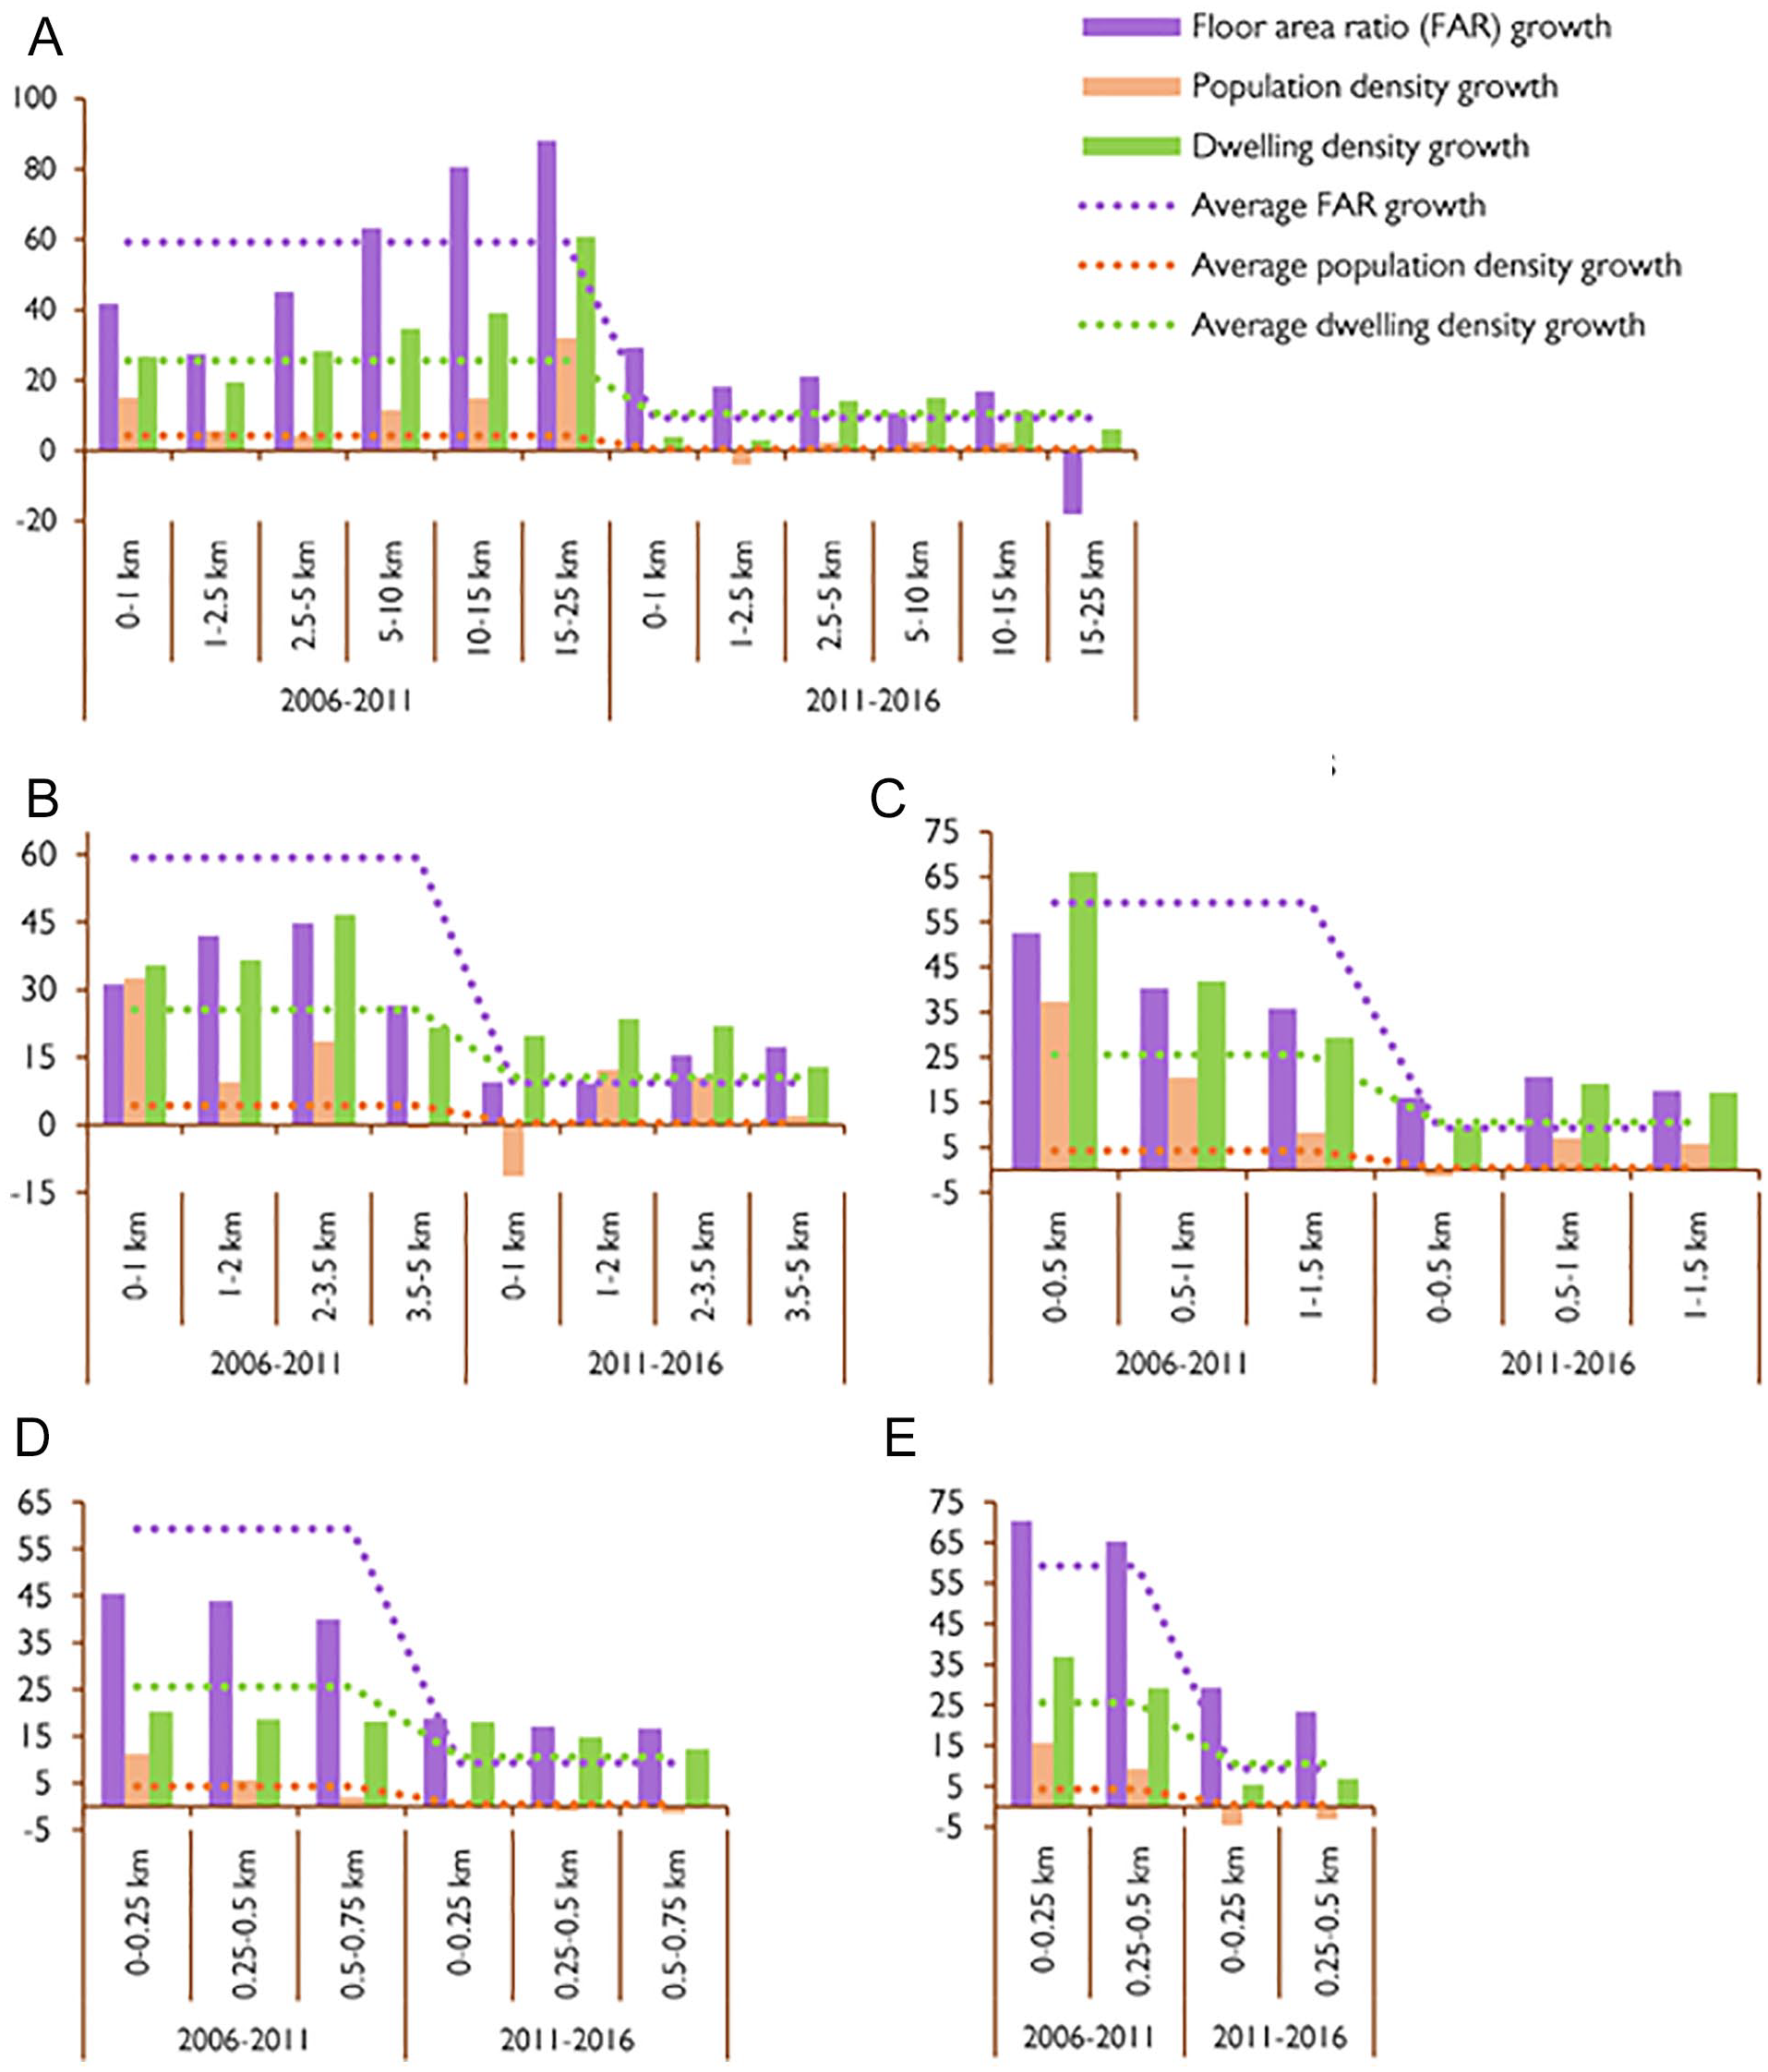
Buffer analysis for the urban nodes proposed by the new master plan. (A) CBD, (B) proposed subcenter, (C) major local centers, (D) activity centers, and (E) subway stations.
The first finding is that the Shiraz CBD was relatively unsuccessful in attracting development and (especially) residents and during the ten years under study. Between 2006 and 2011, the FAR within a 5-km buffer from the CBD grew less than the city average. In fact, the lowest FAR increase in the city (27%) occurred in a ring around the CBD. The FAR only begins to increase above average at a distance greater than 5 km from the CBD. The same was true for dwelling density—to the extent that at 15–25 km from the CBD, the dwelling density was almost twice the city average. As for population density, this did not differ much from the city average within the 5-km buffer. But like the FAR and the dwelling density, the population density grew in parallel with the distance from the CBD. In the next period, 2011–2016, all the indicators dropped considerably, and in a few cases even turned negative. The CBD clearly experienced an outflow of population even as the FAR and dwelling density slightly increased (due to commercial activities rather than housing).
The proposed subcenter on the south side mirrored the experience of the CBD. The growth in FAR and population density was at or below the city average and increased in buffers that were farther away from the subcenter. While the growth in dwelling density somewhat exceeded the city average throughout the period under study and in all the buffers, higher levels of growth were experienced farther from the sub-center. This suggests that new housing was not as compact as proposed in the plan. Under these circumstances, we conclude that this subcenter did not gain the anticipated centrality to rival the CBD over this decade.
The three major local centers proposed by the plan were more successful in concentrating development—especially between 2011 and 2016. While the FAR did not exceed the city average until 2011, both the population density and dwelling density grew faster than the city average throughout the ten years under study (except for the 0.5 km buffer which lost population between 2011 and 2016).
The 17 activity centers proposed by the master plan behaved similarly to the major local centers, albeit on a smaller scale. In the first period, the dwelling density growth was much lower here—compared to both the major local centers and the city average. In the second period, both the FAR and the dwelling density grew in excess of the city average, but the population shrunk. This suggests that these areas may have densified through office and commercial development but were not considered as attractive for living.
The 22 subway stations in Shiraz were the only proposed nodes to fully achieve the goals set forth in the master plan—but only in the first five years. Within a 500-m radius (the typical Transit Oriented Development zone), all three indicators were positive and slightly above the city average. Between 2011 and 2016, however, the station areas lost population and the dwelling density growth stalled even as the FAR increased almost three times as much as the city average. This suggests that office and commercial construction was favored over residential space.
Conclusion
This study has revealed that since the mid-2000s, market forces have superseded government planning in guiding urban development in Shiraz. The government has reduced its interventions in the market: it no longer issues public land for housing development. As a result, apartment towers, which maximize developers’ return on investment, have come to dominate the housing scene. However, large private developers are not the only actors in the context of Iran. Powerful religious trusts (Bonyads) operate in the housing market with little public oversight (Valadbaygi 2022). Combined with natural constraints and sociodemographic pressures, this new planning/market balance has produced a denser and more compact city than ever before (Figure 12). In Iran’s case at least, it appears that development is more compact when guided by the “invisible hand” of the market rather than the government’s “iron fist.”
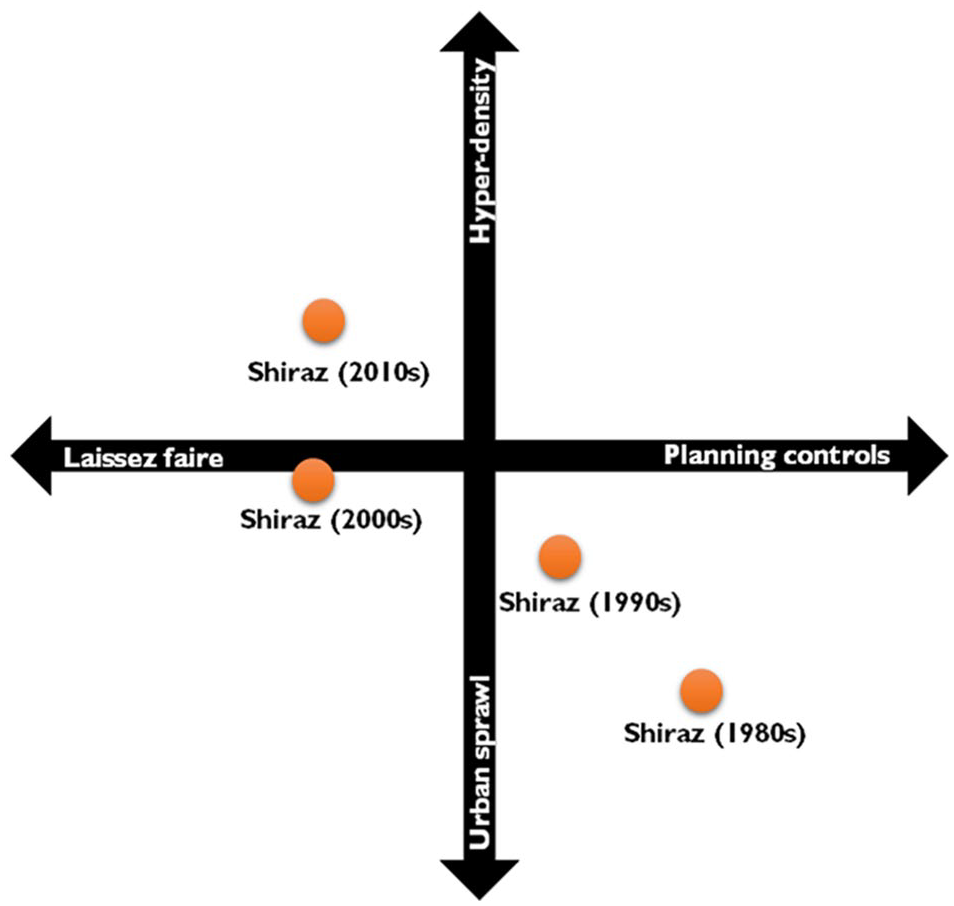
Shifting balance between densification patterns and planning controls in Shiraz over time.
The direction and intensity of development in Shiraz have not followed the recommendations of local planners and plans. Rather, they have been driven primarily by developers and residents. While the government’s goal has been to stir growth toward the southern zone and redistribute it in specific nodes throughout the city, market forces have continued to favor the northwest, which, as a consequence, has attracted the lion’s share of development. Value uplifting in this peripheral stretch has contributed to the decline of the center (see Pinnegar, Randolph, and Troy 2020).
A gap between policy and reality is not unique to Shiraz (see, for example, Adelfio et al. 2018, on Barcelona). Research shows that in other settings too, in both the Global North and South, development veers from the approved plans for a variety of reasons including political interference in planning matters, emerging socioeconomic concerns, and neoliberal inclinations (see Filion, Leanage, and Harun 2020 on Toronto; Silva and Vergara-Perucich 2021 on Santiago; Bibby, Henneberry, and Halleux 2020 on London). Regardless of the drivers, denser and more compact development is generally positive—as long as it does not reach the extremes of early capitalist centers such as New York and Chicago. Also, some discretion and flexibility are warranted in planning and development to accommodate change. Rigid adherence to long-term plans is detrimental in complex contexts where unanticipated factors are likely to arise. On the other hand, excessive discretion may systematically favor the market and thus undermine public interests and community trust in the planning system (Kwok, Johnson, and Pojani 2018).
Either way, density and compactness need to be balanced with good access to parks, open spaces, and natural sunlight. Housing, even in the form of apartment units, should be spacious and well-served by urban infrastructure (clean water, sanitation, electricity, and Internet). Another key issue is the regeneration of the urban core, which has great potential in historic places like Shiraz. For medium-sized cities, a strong core that concentrates employment and is equidistant from other zones is desirable in terms of accessibility and equity. In addition, it is important to articulate growth so that secondary activity centers—combining housing, work, and commerce—are easily reachable by public transit. The TOD model, which is predicated on densification, high-quality design, and value capture around transit nodes, has much to offer here (see Pojani and Stead 2014; Thomas et al. 2018). But to achieve TOD objectives, the market and the planning sector need to work in concert rather than be in competition. Government authorities, consultants, developers, and residents should all engage in the planning process to co-create the city they want.
Footnotes
Declaration of Conflicting Interests
The author(s) declared no potential conflicts of interest with respect to the research, authorship, and/or publication of this article.
Funding
The author(s) received no financial support for the research, authorship, and/or publication of this article.
