



Abstract
In many central business districts (CBDs), job growth has occurred since the 1990s, but at a far slower rate than in non-CBD areas. Over this time, there has been a great divergence in economic performance among CBD areas, with a handful of CBD economies far outperforming the rest. Overall, CBD economies have become home to higher paying economic activities, compared with non-CBD areas, because industries comprising higher levels of “cognitive” tasks locate a higher share of jobs in CBD areas. As such, CBD performance seems to be tied to the mix of industries present in a given region’s economy.
Introduction
The suburbanization of U.S. cities following World War Two has been widely studied. By the end of the twentieth century, the great majority of jobs and residents were located outside of the historic cores of the nation’s largest metropolitan regions (Baum-Snow 2014; Euchner and McGovern 2003; Glaeser and Kahn 2001; Kneebone 2009). Since the turn of the century, however, a significant narrative has emerged centered around an “urban resurgence.” For planners this would be welcome news following decades of efforts, both local and federal, to revive urban cores, as well as the perceived benefits associated with denser forms of development. Indeed, with respect to jobs, there is some evidence of an urban resurgence (Kneebone 2009, 2013; Landis 2009), although its extent can be overstated (Cortright 2015). While there is not a uniform definition of the term “urban resurgence,” one common understanding refers to a halt in, or reversal of, trends toward the decentralization of jobs and residents within regional economies (Manville and Storper 2006). This paper considers evidence of an urban resurgence of jobs, analyzing the performance of central business districts (CBDs) in the 100 largest metropolitan regions in the United States over the period 1994–2019. The paper provides an in-depth quantitative and qualitative analysis of changes in the economies of CBDs over this period.
In the nineteenth century, as rural populations moved to burgeoning cities, limits on the ability of workers to commute over long distances, as well as the need for goods producers to locate close to inter-regional transportation hubs, fostered the development of dense urban cores within cities (Muller 2004). Throughout the twentieth century, jobs and residents decentralized within cities, for a number of reasons. The rise of automobiles enabled households to purchase larger and cheaper homes in suburban areas, while initially commuting to their jobs in central locations (Euchner and McGovern 2003). This was driven, in part, by some residents fleeing the negative externalities found in central city locations, such as pollution (Baum-Snow 2014; Cullen and Levitt 1999; Euchner and McGovern 2003). Suburbanization enabled the fragmentation of governance within metropolitan regions, enabling Tiebout-sorting rooted in preferences for local public services (Baum-Snow 2014; Euchner and McGovern 2003; Fischel 2001; Glaeser and Kahn 2001; Muller 2004). It is widely held that there was a significant racial dimension to decentralization, and indeed fragmentation, as white populations left central cities to live in racially homogeneous suburbs (Boustan 2010). Suburbanization was greatly assisted by a number of federal and local policies, such as single-family zoning, highway construction, and policies that supported lower driving costs and homeownership (Baum-Snow 2014; Euchner and McGovern 2003). As city residents moved to the suburbs, local services industries followed to meet the demand from suburban populations. Decentralization also enabled mature, land-intensive export-oriented industries, such as manufacturing industries, better access to workers, as well as cheaper land (Euchner and McGovern 2003; Glaeser and Kahn 2001).
Beginning sometime in the 1990s, the tide began to turn for central city areas (Manville and Storper 2006). The historic cores in some cities stopped losing residents and, in some instances, population gains occurred (Manville and Storper 2006). In most cases, however, central city populations have continued to grow more slowly than their suburbs (Landis 2009; Rosentraub 2014). Similar trends have been observed in relation to jobs (Kneebone 2009, 2013; Landis 2009).
Research has identified a number of potential causes for the relative change in the fortunes of central city areas, although two views dominate. One centers around a “consumption” narrative. According to this view, changing social structures, such as the later age at which couples marry, as well as higher wages for some workers—particularly those working in “creative” or high-tech industries—have created greater demand for diverse types of consumption, which are more pronounced in CBD and downtown areas (Florida 2002; Glaeser, Kolko, and Saiz 2001). Another narrative is grounded in the location preferences of firms of the “new economy.” For many new economy industries, information and ideas are critical inputs to production, and dense urban environments are theorized to facilitate their efficient exchange and dissemination (Duranton and Puga 2015; Glaeser 2011). According to this view, as the new economy has grown in size and importance, industries of the new economy have sought denser urban environments, leading to a relative resurgence of economies in central city areas.
This paper focuses on the “urban resurgence” of jobs, and in particular, the evolution of CBD economies in the 100 largest metropolitan regions 1 in the United States over the period 1994–2019. The focus on CBD areas treats the location of employment within regions in a binary manner, which does not reflect the degree of connectivity and dependence between firms and workers across modern, metropolitan regions. Yet interest in an urban resurgence is fundamentally driven by attempts to understand whether processes of decentralization are reversing, and CBDs were historically the primary employment hub at the core of regional economies. Policy efforts to reverse or slow decentralization have specifically targeted CBD areas and their surrounding neighborhoods for decades (Euchner and McGovern 2003). Moreover, evidence of an urban resurgence is frequently considered through the lens of CBD economies (Glaeser and Kahn 2001; Kneebone 2009, 2013). This paper is motivated by three primary questions. First, for the 100 largest regions in the United States, how has CBD job growth compared to non-CBD job growth over the period 1994–2019, and do we see variation in CBD performance among regions? Second, since the 1990s, has there been a qualitative shift in the economic activities found in CBD and non-CBD areas? Third, are there differences in the extent to which given industries locate jobs in CBD areas, and what factors influence such differences?
This paper is distinct from other studies of the urban resurgence of jobs in a number of ways. The longer period of analysis, compared with most other studies, means that the present findings detect longer-term trends, and are not as obscured by short-term, economic cycle effects. For example, the findings in a number of studies are confounded by the impact of the Great Recession (Kneebone 2009, 2013; Cortright 2015; Hartley, Kaza, and Lester 2016). The current paper performs a rigorous analysis of qualitative changes in CBD and non-CBD economies, including a comparison of the fastest growing industries in CBD and non-CBD areas, and an analysis of wage growth in CBD and non-CBD areas. In most studies, analysis of qualitative changes in CBD economies is limited, and mostly restricted to the level of relatively crude two-digit (highly aggregated industry classifications) NAICS 2 categories (Cortright 2015; Kneebone 2009, 2013). This paper examines industries at the four-digit (finer grained) NAICS level of analysis and uses data on occupations from the Department of Labor’s O*NET database to examine the skill content of industries that locate a high share of workers in CBD areas.
The paper finds that, over the period 1994–2019, CBD economies added more than 1.7 million jobs across the 100 largest metropolitan regions in the United States, a growth rate of 24 percent. At the same time, employment in the non-CBD areas of these regions grew by 46 percent, where close to 26 million jobs were added. CBD areas have accounted for only 6.2 percent of the net job growth in these regions over the period. There has been a great divergence in the performance of CBD economies, with just ten CBD economies accounting for 81 percent of all CBD job growth across the 100 largest regions. In the ten CBD areas that added the most jobs over the period, employment grew by 47 percent, compared with 42 percent in the non-CBD areas of these regions. In the other ninety regions in the sample, CBD employment grew by just 9 percent over this period, compared with 47 percent in the non-CBD areas of these regions.
Similar divergence is seen with respect to the wages paid by employers in CBD areas. In the ten CBD areas in which wages grew the fastest, wages grew by 224 percent from 1994–2019, far exceeding wage growth in their non-CBD areas. This compared to wage growth of 77 percent in the ten CBDs that saw the slowest wage growth, which was lower than the wage growth in the non-CBD areas of these regions. By contrast, there is much less variation in the wage growth of non-CBD areas among regions. This makes CBD economies a key point of differentiation with respect to economic performance among regions. Overall, there has been a considerable divergence in the wages paid by employers in CBD and non-CBD areas. Over the period 1994–2019, on average, wages paid by jobs in CBD areas grew at a rate that was 47 percent higher than wage growth in non-CBD areas. This is because industries that locate a high share of their workers in CBD areas comprise activities that are more “cognitive” in nature. As such, the performance of CBD job growth in a given region is likely tied to the nature of the wider regional economy and the industries in which it specializes. The paper concludes with the planning implications of its key findings. Finally, the paper considers how the Covid-19 pandemic could affect the fortunes of CBD economies.
Literature Review
Throughout the nineteenth and early twentieth centuries, development patterns in U.S. cities were highly centralized. Due to limitations in the movement of people and goods, as city economies grew, compact land use patterns were the most efficient way to connect firms to workers and firms to their customers (Glaeser and Kohlhase 2003; Muller 2004). As early suburbs, first enabled by street cars, developed around these cores, monocentric cities became the primary focus of urban theorists (Dear 2002; Muller 2004). Urban economists later formalized the monocentric city—where jobs within a city are located entirely in a central core—into models of urban land use. These models were primarily rooted in the minimization of transportation costs for firms and workers (Alonso 1964; Mills 1967; Muth 1969).
Just as economists had formalized the monocentric city into a general equilibrium framework, their foundational models ceased to be an accurate representation of urbanized areas in the United States (Glaeser and Kohlhase 2003). While definitions of centrality can vary (Baum-Snow 2014; Glaeser and Kahn 2001; Landis 2009; Rossi-Hansberg, Sarte, and Owens 2010), findings across studies are unambiguous: Today, decentralized areas account for the majority of jobs in U.S. metropolitan regions (Baum-Snow 2014; Glaeser and Kahn 2001; Hartley, Kaza, and Lester 2016; Kneebone 2009, 2013; Landis 2009; Rossi-Hansberg, Sarte, and Owens 2010). For example, for the 100 largest metropolitan regions in the United States, Baum-Snow (2014) finds that the share of central city employment fell from 61 percent in 1960 to 34 percent in the year 2000. Other studies measure the share of regional employment found in CBDs, which is a more restrictive measure of centrality, finding that, on average, CBD economies account for between 12 and 21 percent of jobs in the largest metropolitan regions (Glaeser and Kahn 2001; Kneebone 2009).
Modeling extensions have incorporated polycentricity into urban land use models (Duranton and Puga 2015; Lucas and Rossi-Hansberg 2002; Ogawa and Fujita 1980). While initially rooted in the minimization of transportation costs, models have evolved to incorporate transaction costs and information exchange as critical features shaping the location of firms within cities (Duranton and Puga 2015; Lucas and Rossi-Hansberg 2002; Ogawa and Fujita 1980; Rossi-Hansberg, Sarte, and Owens 2010). When firms cluster together within cities, they generate highly local agglomeration economies, but the benefit of such clustering decays with distance, and such clustering generates local urban costs, such as congestion and higher land prices (Duranton and Puga 2015). As such, firms locate within cities with respect to their core activities, as well as access to consumers. Firms can absorb higher urban costs when the agglomeration benefits of dense areas, such as information spillovers, are critical inputs to their activities (Duranton and Puga 2015). Yet firms in industries that benefit less from denser locations decentralize within cities, where they trade access to local agglomeration economies for cheaper land and lower commuting costs.
There is not a large body of empirical work that seeks to understand the causes of employment decentralization within U.S. cities. Baum-Snow (2014) is a rare exception in this regard, finding that, over the period 1960–2000, the supply of highways had a statistically significant effect on the decentralization of employment within large metropolitan regions. Specifically, the addition of each new highway reduced job centralization by 6 percent, while reducing the extent of residential centralization by 16 percent. Glaeser and Kahn (2001) consider factors that affect the extent of job decentralization across industries within cities, providing evidence that industry worker suburbanization is strongly associated with the extent of industry decentralization. They find that manufacturing industries decentralize within cities, while industries that employ a high share of college educated workers are more likely to centralize jobs within cities. Their findings suggest that information-oriented industries are more likely to centralize within regions.
As the Glaeser and Kahn (2001) findings suggest, there is evidence that job decentralization differs by sector. Baum-Snow (2014) provides evidence that each new highway reduced the extent of retail and wholesale employment centralization by 14 percent but reduced centralization of FIRE sectors (finance, insurance, and real estate) by only 4 percent. Rossi-Hansberg, Sarte, and Owens (2010) show that, within regions, management jobs are more likely to centralize than production jobs. These findings suggest that regional economic specialization could influence the extent of job centralization within regions.
After decades of employment decentralization, research has looked for evidence of a halt to, or reversal of, this trend. Landis (2009) defines the core area of a metropolitan region as the five-mile ring surrounding its geographic center. Over the period 1994–2003, Landis (2009) finds that 10 percent of all metropolitan area job growth occurred in the core areas of regions, where employment grew by 9 percent. This compared to growth of 26 percent in the suburbs and 22 percent in exurban areas. Studying 281 metropolitan regions over the period 2002–2011, Hartley, Kaza, and Lester (2016) find that CBD employment fell by 152,241 jobs (or 1.6%), while inner city employment grew by around 1.8 million jobs, and suburban employment grew by around 4 million jobs.
Two papers by Kneebone (2009, 2013) measure the share of jobs found in CBDs for the 100 largest metropolitan regions in the United States. In 2006, 21 percent of all regional employment was located within three miles of CBD areas, while 45 percent of employment was located at a distance of greater than ten miles from CBDs. Over the period 1998–2006, Kneebone (2009) finds that, on average, employment grew by one percent within CBDs, by 9 percent in the middle ring of regions (3–10 miles from the CBD) and by 17 percent in the outer ring (10–35 miles from the CBD). Kneebone finds evidence that industries centralize within regions to different degrees. Retail, construction, and manufacturing jobs display the highest degree of decentralization, while finance and insurance jobs show the highest degree of centralization. There is broad evidence of industry decentralization over the period 1998–2006, with employment decentralization (faster employment growth in the outer rings) occurring in seventeen of the eighteen two-digit industries examined. In a later study, Kneebone (2013) found that the share of regional employment within three miles of CBDs fell in ninety-one regions over the period 2007–2010.
Based on these studies, the urban resurgence of jobs refers more to a reversal in the longer-term trend of central city area job losses, rather than a reversal of trends toward decentralization. These studies relate to truncated periods of time, since the turn of the century, and impact of the Great Recession obscures many of the findings. Apart from the study of relatively crude two-digit industrial classifications, the studies do not examine qualitative changes in the economies of CBDs, such as whether they have become home to higher paying industries over time, or whether there is a difference in the skill intensity of industries in CBDs compared with the rest of regions. The current study seeks to close some of these gaps in the literature.
Data and Method
The following analysis relies on data from the ZIP Codes Business Patterns (ZBP), which is part of U.S. Census Bureau’s County Business Patterns program. The program releases annual data extracted from the Business Registrar—a Census Bureau database of all business establishments with paid employees. The Census Bureau releases two types of ZBP file: a “Totals” file and an “Industry Detail” file. Each file type is available for the period 1994–2019. For each of these years, the “Totals” files provide employment and establishment counts, as well as first quarter payroll data, for each zip code in the United States. From these files, payroll data are converted to annual wages by multiplying first quarter payroll by four and dividing this figure by the annual employment count for a given zip. The “Industry Detail” file provides firm counts by establishment size category for each zip code, but lacks payroll and employment count data. In total there are nine establishment size categories, ranging from establishments with one to four employees to establishments of more than 1,000 employees. In the “Industry Detail” file, establishment counts are categorized by industry type, ranging from broad (two-digit) to detailed (six-digit) NAICS categories (North American Industrial Classification System). Data prior to 1998 are categorized using Standard Industrial Classification (SIC) definitions.
Following the approach of Glaeser and Kahn (2001), zip level employment totals for each industry are estimated by multiplying the midpoint of each establishment size category by the count of establishments. For example, for a given zip code that is home to 100 business establishments in the one to four size category for a given NAICS code, 100 is multiplied by 2.5 (the midpoint of the range) to yield an estimate of 250 employees for the given industry. For the largest establishment size category (greater than 1,000 employees), 1,200 is multiplied by the establishment count for each zip-NAIC’s pair, which is the approach taken by Glaeser and Kahn (2001). Employment totals for each zip-NAICS pair are calculated by summing the employment estimates generated for each industry-establishment size category.
Central Business Districts
In this study, I define the central business district (CBD) for a given city according to the 1982 Census of Retail Trade, in which local business leaders were asked to identify the CBD within their respective communities. Based on these responses, the Census Bureau identified those census tracts that represent the CBD in a given city. While dated, these definitions have been used in various studies (Glaeser and Kahn 2001; Hartley, Kaza, and Lester 2016; Kneebone 2009, 2013) and still provide a very good approximation of the location of CBDs within cities. For example, Kneebone (2013) finds that for the 100 largest metropolitan areas in the United States, the 1982 CBD definition remains home to the census tract with the highest employment density in 91 regions, and the second densest tract in the remaining 9 regions. Each CBD is matched to the metropolitan region within which it is located, so that CBDs can be compared with the regional economies in which they are located.
While zip level data allow for the study of geographic variation in intra-regional activity, in smaller regions there are typically too few zip codes to detect meaningful geographic variation. For example, there are only eight zip codes in the Anchorage, Alaska, metropolitan region. Eighty percent of the region’s employment is found in only one zip code, which covers the area of the CBD. This makes it impossible to discern the extent of employment located in the CBD from that in the surrounding area. Analysis in this paper is therefore restricted to the 100 largest metropolitan areas in the United States (based on population estimates from the Census Bureau for 2019), within which there are sufficient zip codes to detect meaningful intra-regional variation in employment activity. 3 New York City’s metropolitan region is the largest region in the data set, which has close to 20 million residents. Spokane, Washington, which is home to around 500,000 residents, is the smallest. Metropolitan regions (metropolitan statistical areas [MSAs]) are identified according to the definitions of the Office of Management and Budget. MSA boundaries comprise a core county that has an urbanized area with a population of at least 50,000 people along with the surrounding counties with which it has strong commuting ties. For the 100 largest metro areas, there’s an average of 124 zip codes per region, with a median of 91. The centroid for each group of CBD census tracts was matched to the equivalent zip code for each region of study. In the following analysis, the CBD will refer to all zip codes that have a centroid located within a two-mile buffer of the CBD centroid for a given region. A three-mile buffer creates an average CBD area of roughly 7.69 square miles across the cities of study. A three-mile buffer, as used in other studies (Glaeser and Kahn 2001; Kneebone 2009), would yield an average CBD area of roughly 19 square miles, which seems too large to fit the common perception of a CBD area (this would yield an average CBD area roughly equivalent to the size of Manhattan).
Findings
Trends in CBD Employment, 1994–2019
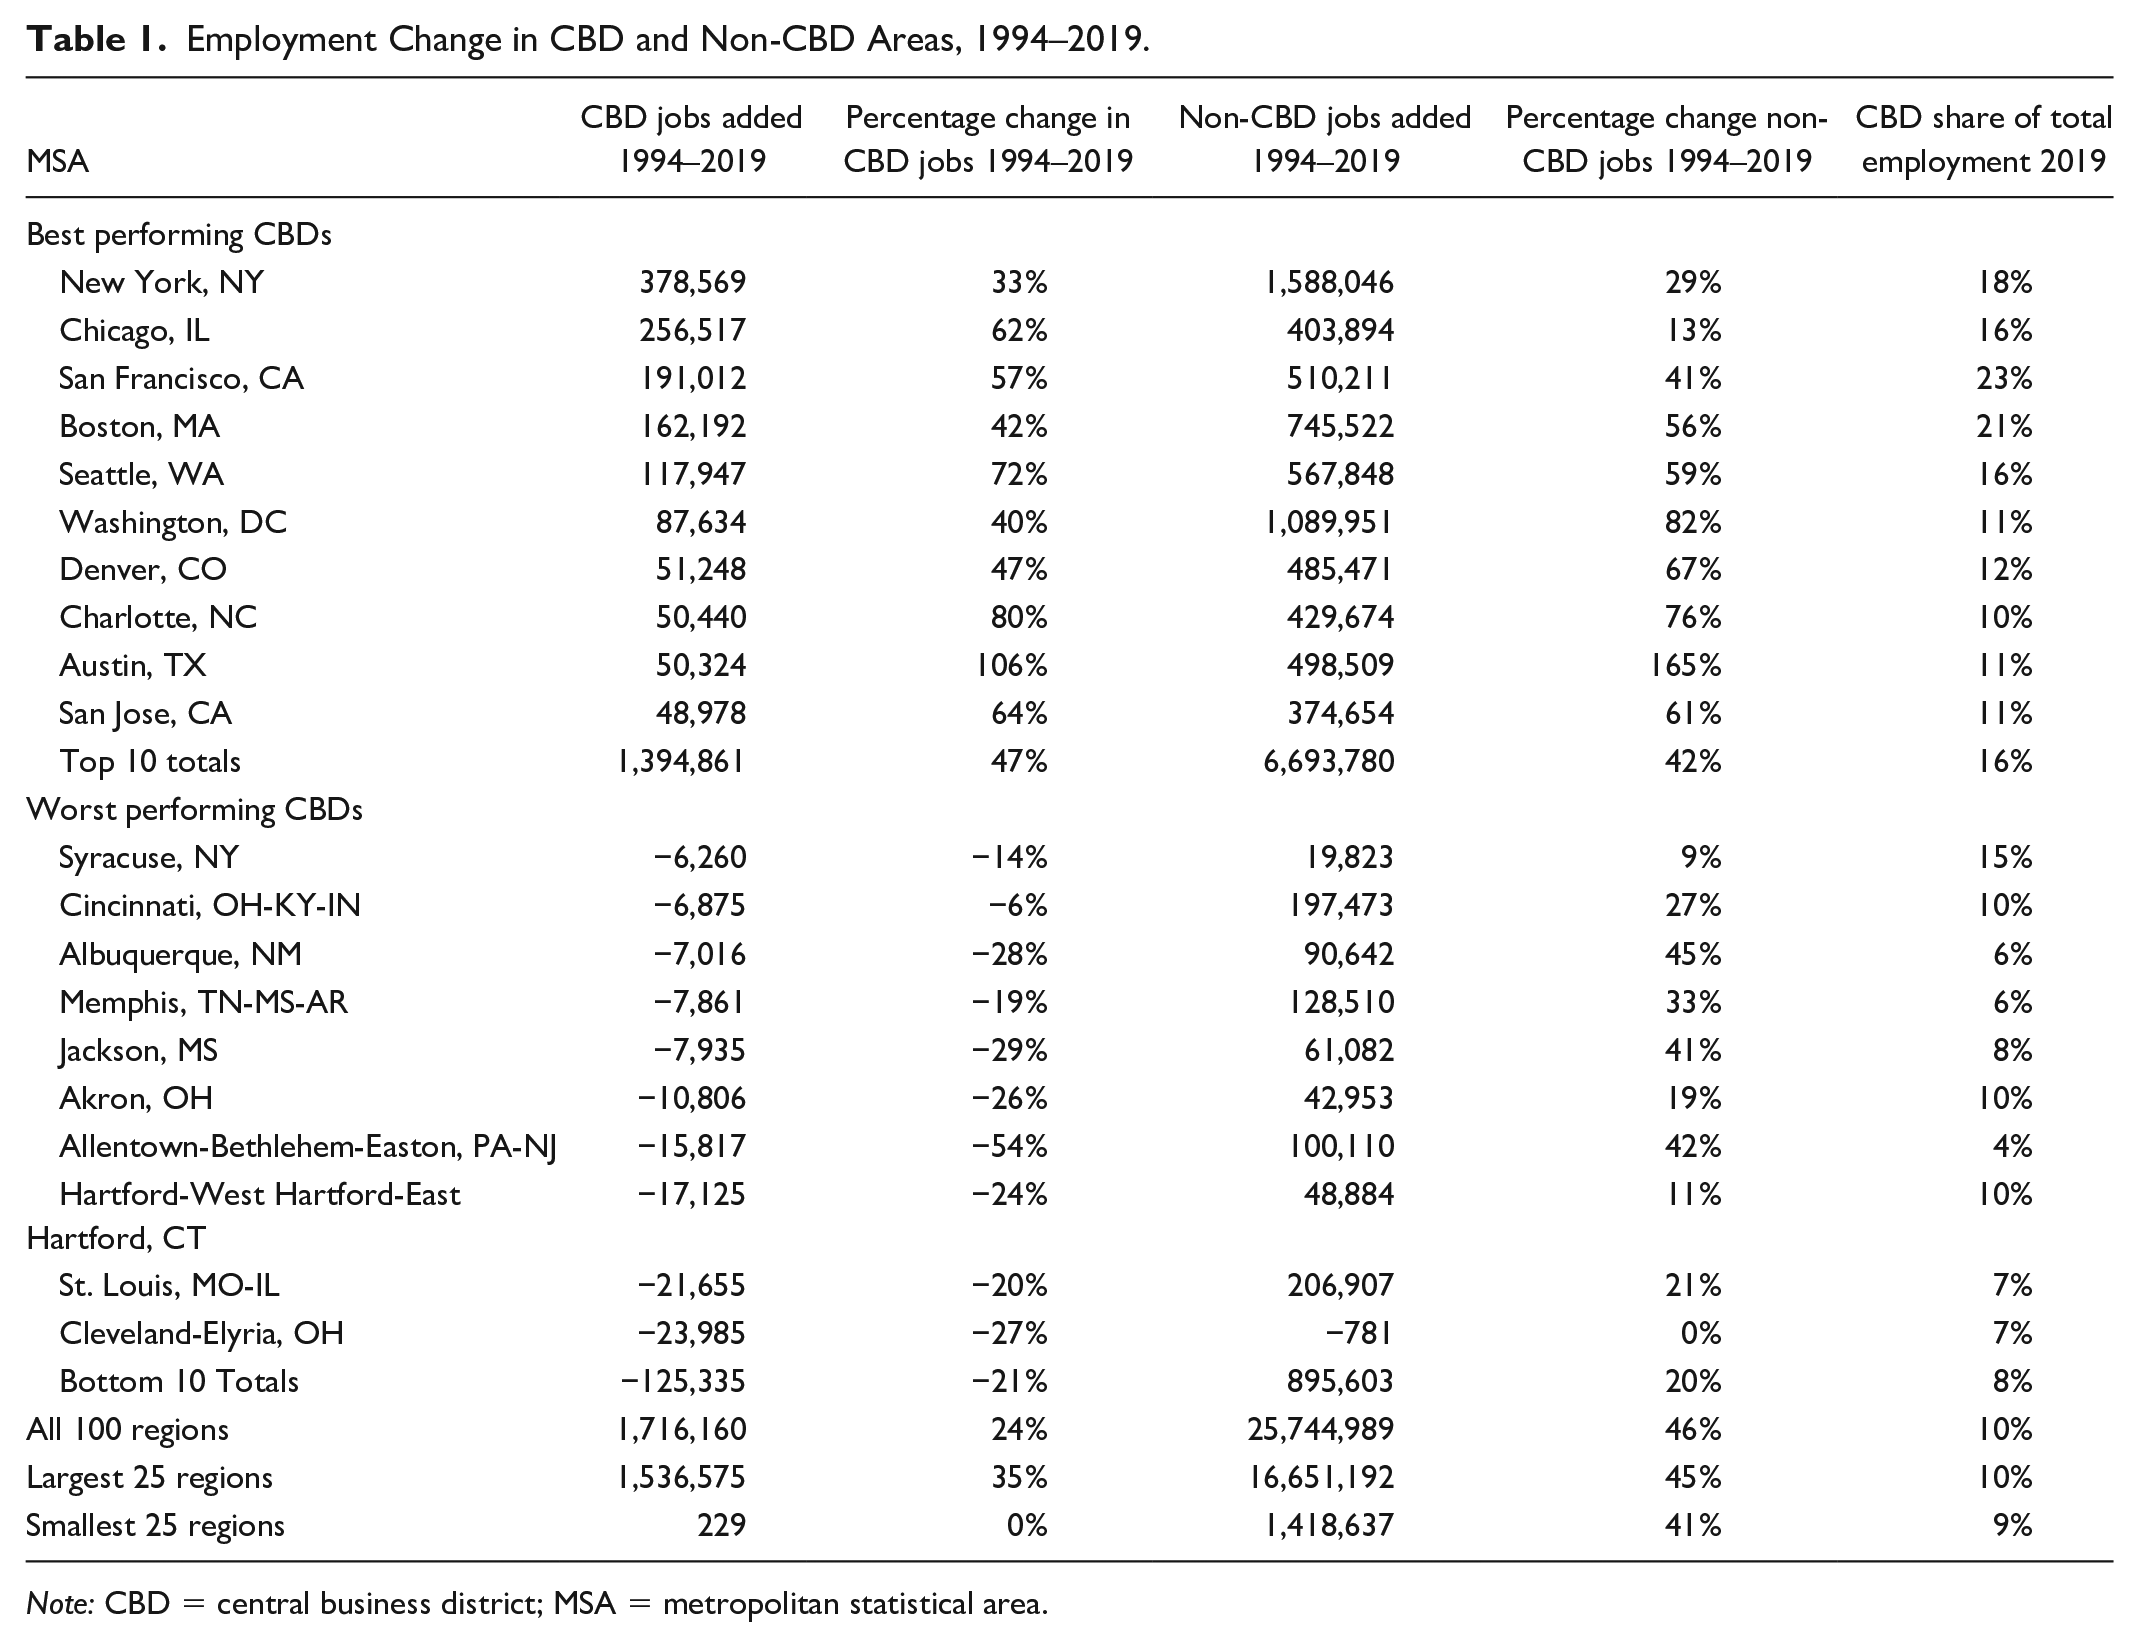
This paper’s first motivation is to compare CBD and non-CBD job growth over the period 1994–2019, and consider differences in CBD performance. This will help us understand to what extent we observe an “urban resurgence” of jobs since the mid-1990s. As Table 1 reveals, since 1994, there has been stable job growth in CBDs across the 100 largest regions in the United States, but this growth has been slower than job gains in non-CBD areas. Over 1.7 million jobs were added to CBD economies in the 100 largest metropolitan regions during this time, a growth rate of 24 percent. At the same time, non-CBD employment grew by 46 percent, where nearly 26 million jobs were added across these regions. To put this slightly differently, despite accounting for 11.2 percent of regional employment in 1994, CBD economies accounted for only 6.2 percent of the net jobs added in the largest regions over the period 1994–2019. While we observe job growth in CBD areas, across the entire sample of cities, the regional share of CBD employment fell from 11.2 percent in 1994 to 9.6 percent in 2019. Positive job growth occurred in sixty-four CBDs across the sample.
Employment Change in CBD and Non-CBD Areas, 1994–2019.
Note: CBD = central business district; MSA = metropolitan statistical area.
Just a handful of regions accounted for the majority of CBD employment growth across the sample of cities. Table 1 displays the CBD economies that added the most and fewest jobs, measured by absolute employment change. Just five CBDs have accounted for 64 percent of the net CBD job growth across all regions. To place this figure in context, these CBDs accounted for 34 percent of all CBD jobs across the sample in 1994. Furthermore, ten MSAs have accounted for 81 percent of net CBD job growth since 1994, despite accounting for 41 percent of all CBD jobs across the sample in 1994. In other words, CBD employment growth since 1994 has been concentrated disproportionately in a minority of regional economies.
New York City’s CBD accounted for the equivalent of 22 percent of net CBD job growth across all cities, while Chicago’s CBD accounted for 15 percent of net growth, San Francisco’s CBD accounted for 11 percent of the total, and Boston’s CBD accounted for 9 percent of net CBD job growth over the period. In the ten CBDs that added the most jobs, CBD employment grew at a faster rate than in non-CBD areas, in relative terms. On average, CBD employment grew by 47 percent in the ten best performing CBDs compared with 42 percent in the non-CBD areas of these regions. If the ten best performing CBDs are removed from the sample, CBD employment in the remaining ninety regions grew by a combined 321,000 jobs (fewer jobs than were added in New York City’s CBD alone, over the period), or 19 percent of net CBD job growth across the sample. Across these ninety metropolitan regions, CBD employment grew by 3,570 jobs per region, on average, and CBD job growth accounted for just 2 percent of all jobs added within these regions. In these ninety regions, CBD employment grew by just 9 percent, compared with 47 percent in their non-CBD areas.
In the ten “worst” performing CBD areas, as measured by absolute job change, CBD employment contracted by 21 percent, or a loss of roughly 125,000 CBD jobs combined. CBD job losses in these cities cannot be attributed to broader regional trends. In the regions that are home to the worst performing CBD economies, employment in non-CBD areas grew by 20 percent, on average, or just under 900,000 jobs in total, over the period of analysis. In other words, CBD job losses occurred despite job growth within the broader regional economies in which they were located. Across the sample, Cleveland is the only region in which regional employment fell over the period. The highest CBD job losses were found in Cleveland, Ohio, where CBD employment fell by around 24,000 (27%), and St Louis, Missouri, where CBD employment fell by around 21,500 jobs (20%).
There is a difference in the performance of CBD economies in the largest and smallest cities (measured by totals jobs) in the sample. In the largest twenty-five cities, CBD employment grew by 35 percent, on average, over the period, although this growth is primarily attributable to the ten best performing CBDs. In the smallest twenty-five cities, CBD employment growth was flat over this period, which has meant that the CBD share of regional employment fell by 1 percent percentage point in the smallest cities. For the largest twenty-five cities in the sample, CBDs accounted for around 10 percent of regional employment in 2019, while CBDs account for 9 percent of employment in the smaller cities, on average.
Overall, in fourteen regions, CBD job growth outperformed non-CBD growth, in relative, although not absolute, terms. This means that, in these regions, the share of jobs found in CBD areas has increased since the 1990s, albeit by a small amount. In these economies, this is evidence of a reverse in the fortunes of CBD economies, bucking a decades-long trend. In all other regions in the sample, the share of jobs found in CBD areas fell over the period.
Trends in CBD Wages 1994–2019
The remainder of this paper considers qualitative changes in CBD and non-CBD economies over the period of analysis. I will first consider wage changes in the economic activities of CBD and non-CBD areas. While somewhat crude, wages are widely used to discern qualitative differences in economic activities among places, whereby higher paying jobs are associated with higher-skilled and higher educated workers, as well as innovative and higher-value added economic functions (Moretti 2012; Storper et al. 2015). All else being equal, we should expect wages to be higher in CBDs than in non-CBD areas. For the most part, only the highest value-added sectors should be able to support the urban costs of dense CBD locations.
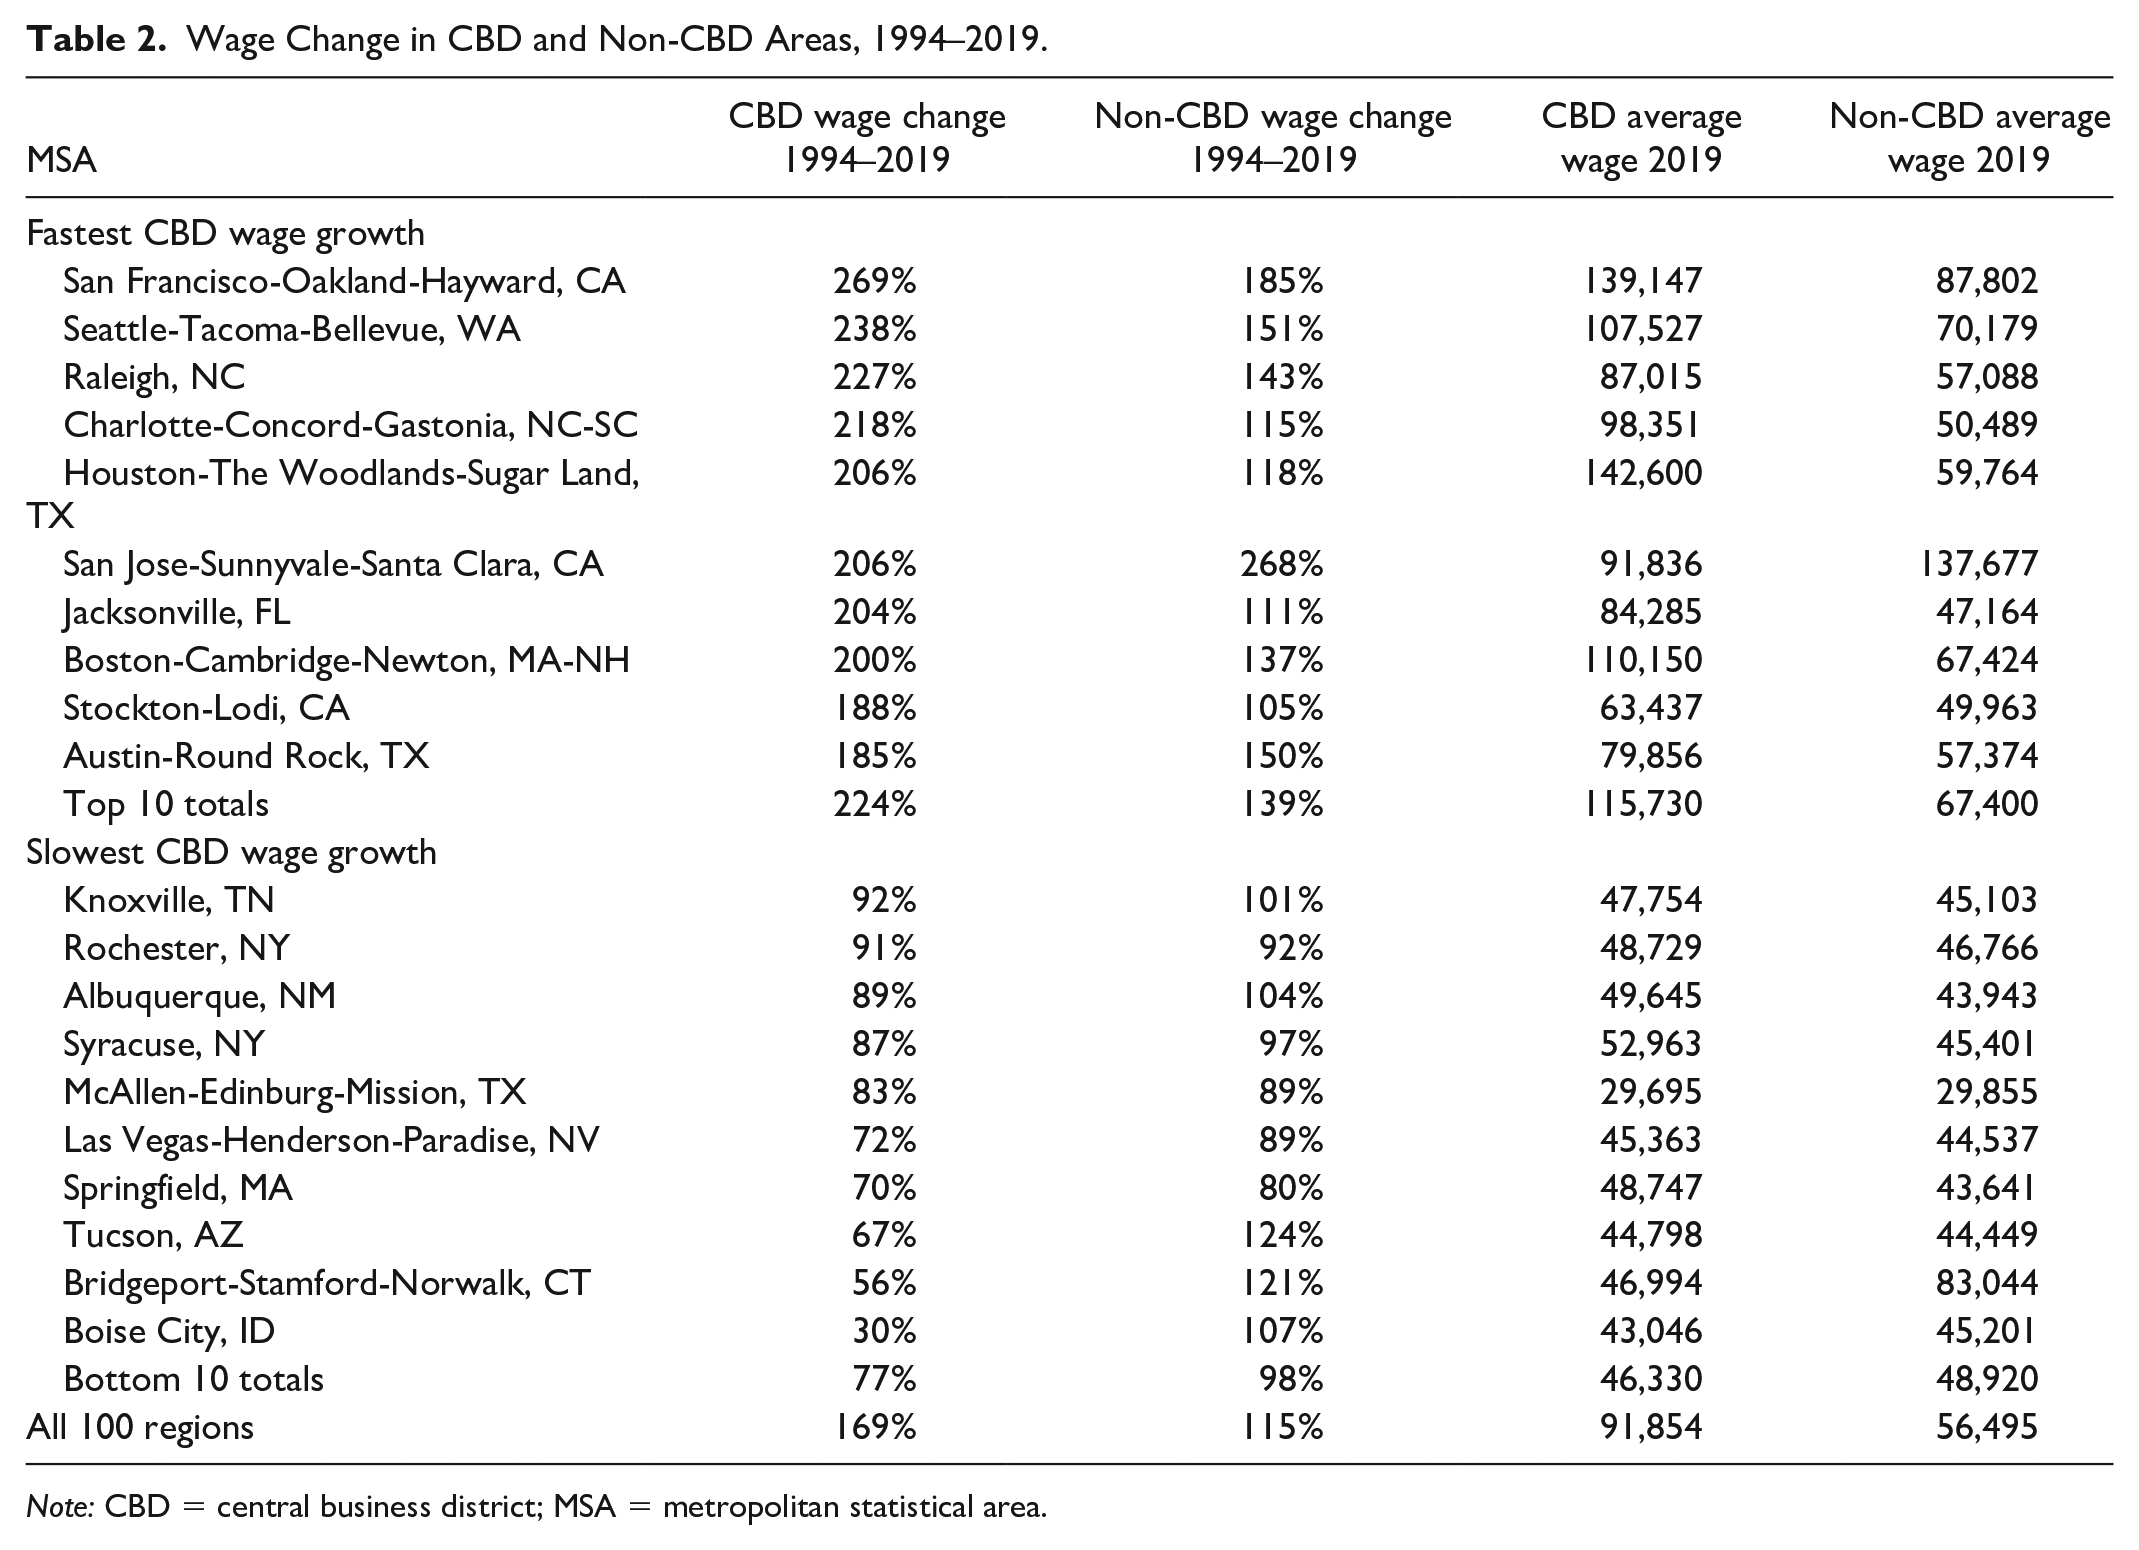
As Table 2 reveals, the wages paid by activities found in CBDs are higher than those paid in non-CBD areas. In 2019, across the sample of cities, employers in CBD areas paid an annual average wage of roughly $91,854, compared with around $56,495 in non-CBD areas (wages in CBD areas were 64% higher than in non-CBD areas). The gap between CBD and non-CBD wages has grown over time. In 1994, employers in CBDs paid an annual wage that was, on average, 31 percent higher than the wages paid in the non-CBD areas of regions. For the period 1994–2019, on average, wages paid by activities in CBD areas grew by 169 percent, from roughly $34,161 per year to $91,854, whereas wages in non-CBD areas grew by 115 percent, from $26,000 to $56,495. This means that for every dollar increase in wages paid in non-CBD areas, wages in CBD areas grew by $1.47. These figures suggest we have seen a qualitative shift in activities that locate in CBD and non-CBD areas over time. At point to which I return below.
Wage Change in CBD and Non-CBD Areas, 1994–2019.
Note: CBD = central business district; MSA = metropolitan statistical area.
Again, there are differences in wage growth across the sample of CBD areas. Table 2 displays the ten cities in which the wages paid in CBD areas saw the fastest and slowest growth rates over the period 1994–2019. The highest CBD wage gains were seen in San Francisco, where wages increased by 269 percent, followed by Seattle, with a gain of 238 percent. These cities experienced pronounced employment growth in the tech sectors of the economy over this period, which have seen extraordinary wage growth (Kemeny and Osman 2018). Since such activities tend to locate in dense urban areas, such as CBDs, this could help to explain the remarkable wage growth in these CBD areas. For each of the ten highest wage growth CBDs, CBD wages outgrew the average wage growth in non-CBD areas, except in metropolitan San Jose. San Jose is a part of Silicon Valley, but historically, San Jose has not been the center of the region’s ‘tech activity, which is found in places like Menlo Park and Mountain View. As such, it is not surprising that higher wage growth has occurred outside of San Jose’s CBD, where Silicon Valley’s flagship ‘tech companies are located.
In the CBD areas that saw the slowest wage growth, CBD wage growth trailed wage growth in non-CBD areas—CBD wages grew at a rate that was 21 percent slower than in non-CBD areas in these regions. For the ten CBD areas where the slowest wage growth occurred, CBD wage growth was two times slower than CBD wage growth across the entire sample and three times slower than CBD wage growth in the fastest wage growth CBDs. Despite the underperformance of CBD areas in these regions, wage growth in their non-CBD areas is comparable with non-CBD wage growth for the whole sample, growing by 98 and 115 percent, respectively. In other words, CBD economies are a key point of differentiation with respect to economic performance among regions.
To expand on this point further, consider the impact of CBD wage growth on the wage growth of the regional economies they are located in. This can be calculated by comparing wage growth in MSA regions to the wage growth of the non-CBD areas of these regions. From 1994–2019, across all regions, MSA wage growth was, on average, 5.2 percent higher than non-CBD wage growth. In other words, if wages in CBD areas had grown at the same rate as wages in non-CBD areas, regional wages would have been 5.2 percent lower in 2019—or $56,054 instead of the actual figure of $59,852. This impact varies by region. In New York, CBD wage growth had the biggest impact on regional wages, boosting wages by 9 percent, for example. In some regions, by contrast, CBD wage growth slowed regional wage growth. Overall, CBD wage growth exceeded non-CBD growth in sixty-eight regions.
Taken together, these figures reveal that regional factors of production combine into relatively high paying activities in many CBD areas. Beyond differences in job growth, these findings provide more evidence of the divergence in economic performance among CBD areas. Some CBDs have become home to the highest paying economic activities, and in these CBDs, wage growth has far exceeded wage growth in other CBD areas.
Understanding Employment Centralization across Industries
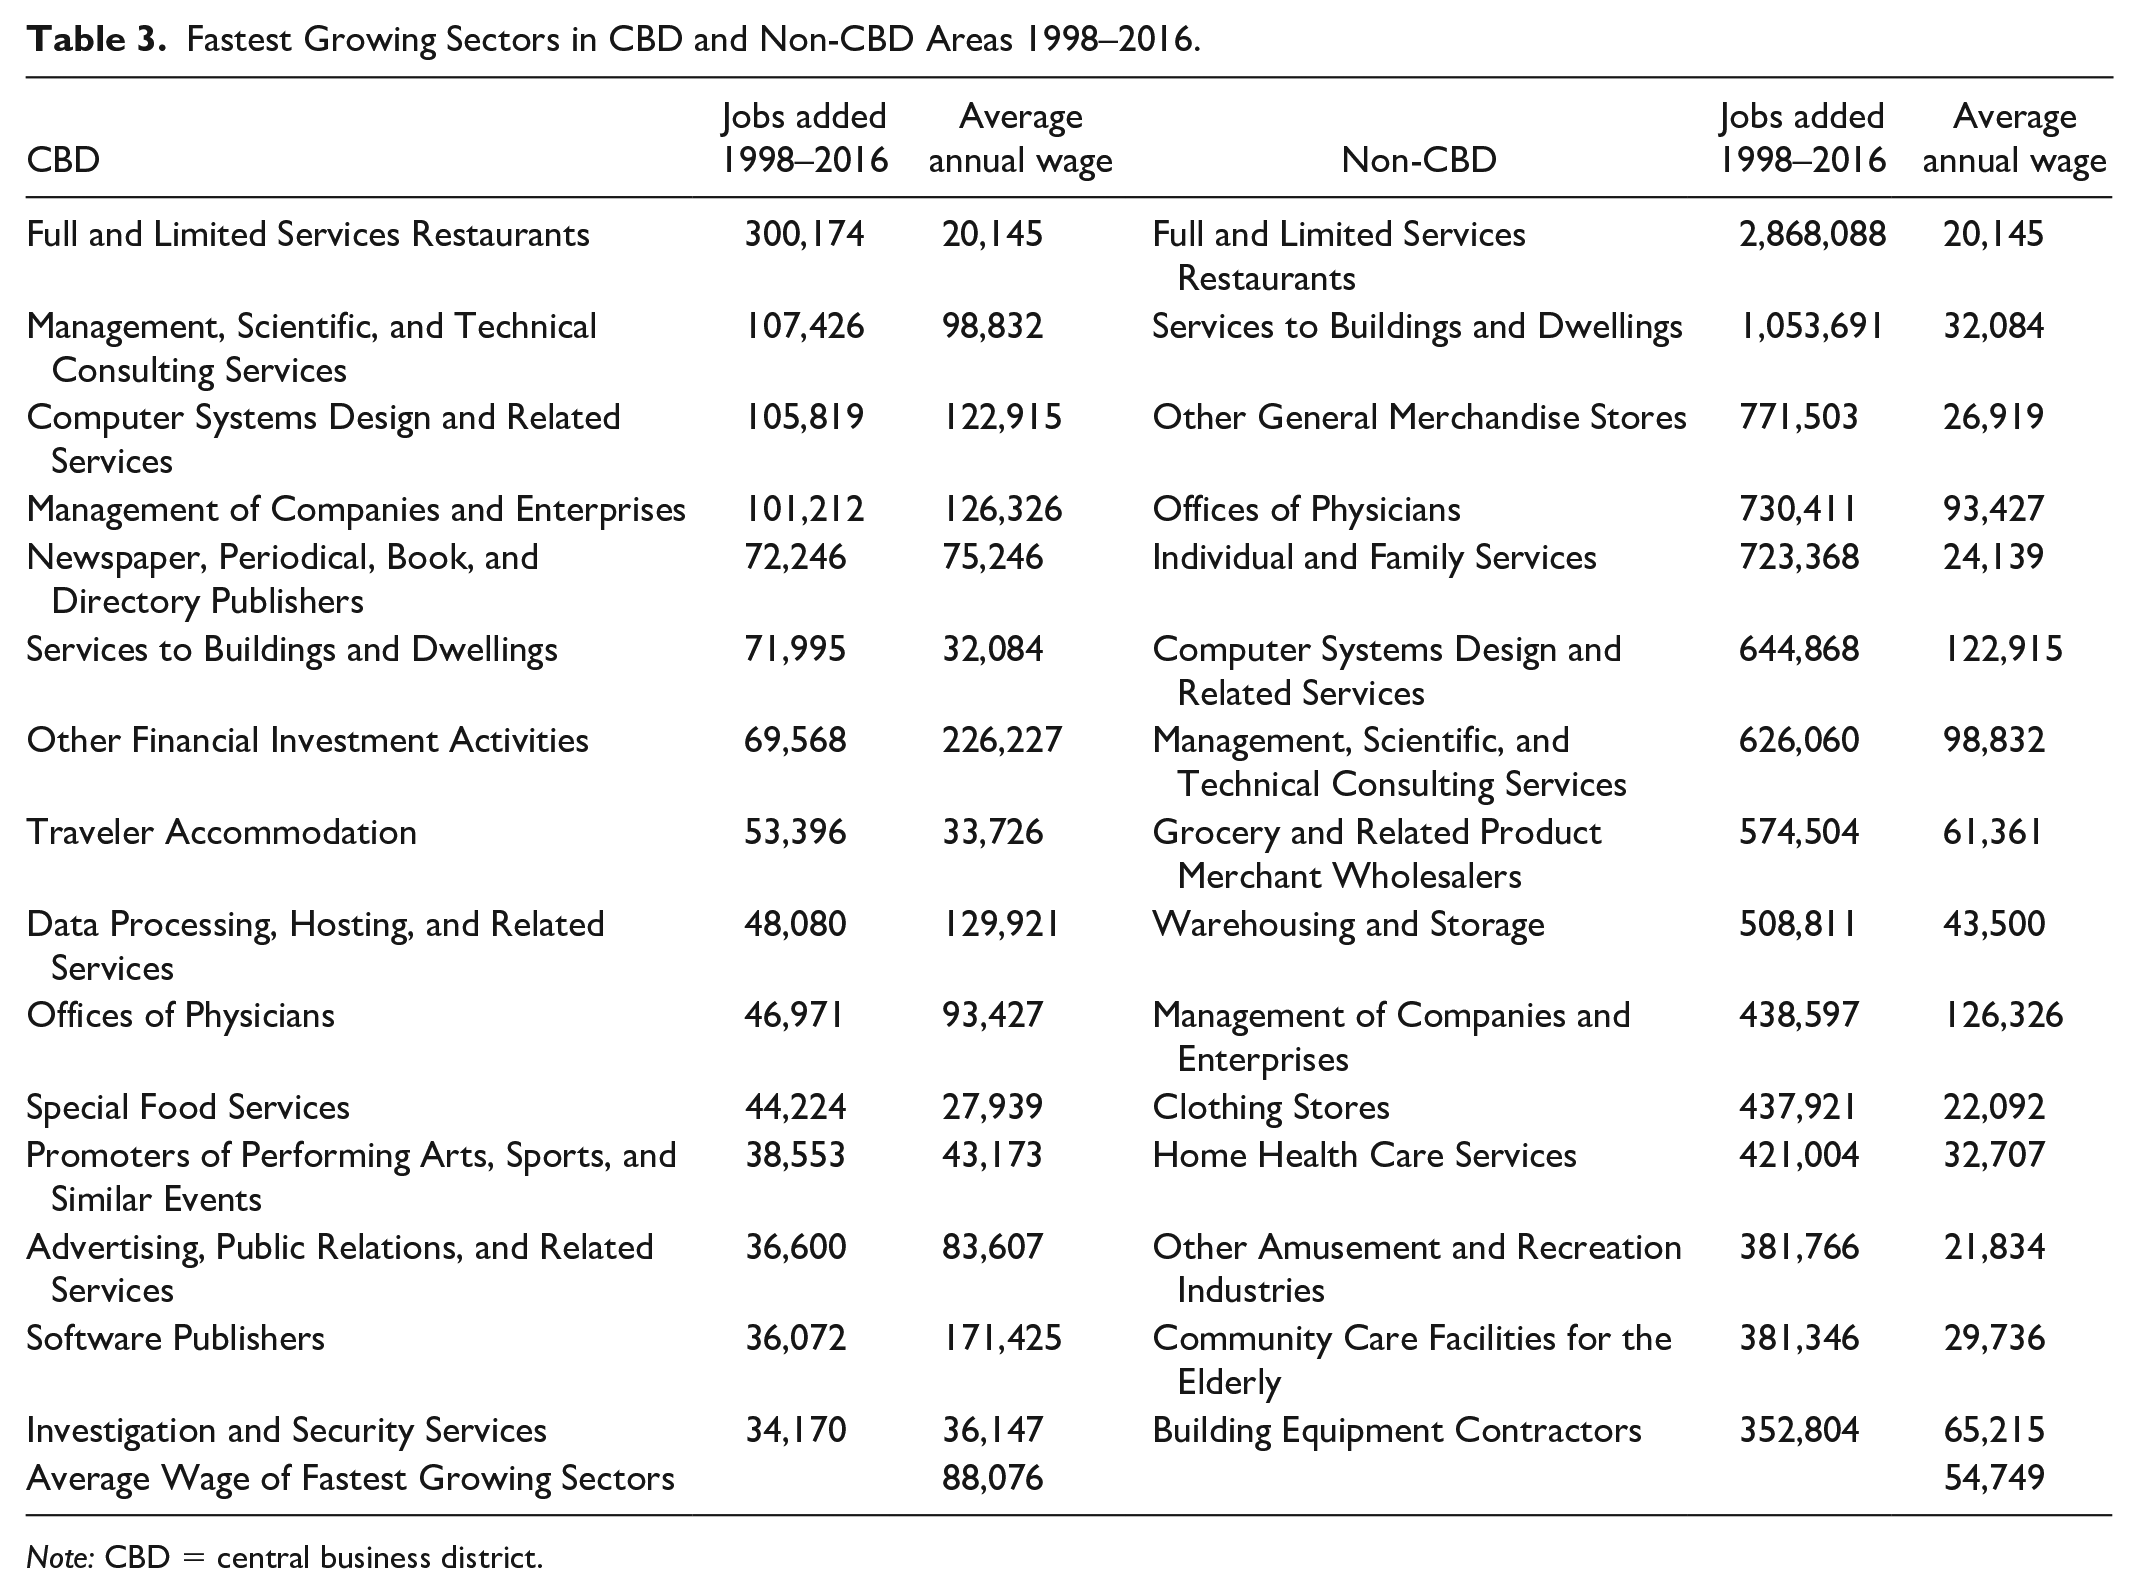
The wage data presented so far suggests that, compared with non-CBD areas, job growth in CBD areas has been concentrated in relatively higher paying industries and economic activities. This intuition is confirmed in Table 3, which displays the industries that have added the most jobs in CBD and non-CBD areas over the period 1998–2016, 4 aggregated across the entire sample of cities. Note that absolute job growth is higher in non-CBD areas because non-CBD areas account for the great majority of metropolitan region employment. The national average annual salary each industry paid in 2019 is displayed, to provide a sense of wage differences across these sectors. Wage data are drawn from the Bureau of Labor Statistics’ Quarterly Census of Employment and Wages. The table reveals that the industries that added the most jobs in CBD areas comprise higher paying activities of the knowledge economy—such as advertising, computer systems design, and software engineering—to a much greater extent than is the case for the fastest growing industries in non-CBD areas. The unweighted average of the wages paid by the fastest growing industries in CBD areas stands at $88,000 compared with less than $55,000 for the industries in non-CBD areas.
Fastest Growing Sectors in CBD and Non-CBD Areas 1998–2016.
Note: CBD = central business district.
Why do we see such variation in job growth among industries in CBD and non-CBD areas, and do industry-specific attributes explain such variation? In other words, do the characteristics of a given industry influence the extent to which it locates jobs in CBD areas? If so, the variation in the performance of CBD economies observed above, where some CBD economies have added many, and relatively high paying, jobs while others have added relatively few jobs since the 1990s, might be explained by the mix of industries that are present in a given region. To put this slightly differently, some regions may be home to a range of industries that do not locate a high share of jobs in CBD areas, partly explaining the underperformance of their CBD economies.
Glaeser and Kahn (2001) identify three potential determinants of industry job decentralization within regions: industry-specific worker suburbanization, industry-specific input suburbanization, and a given industry’s activities, specifically, whether or not an industry is in the manufacturing sector of the economy. They also provide controls for an industry’s average establishment size (measured by employees), as well as human capital measures (educational attainment) of a given industry’s workers. They contend that industries comprising higher educated workers are more likely to centralize within regions, because the greater density of CBD areas is associated with positive externalities for knowledge sectors of the economy.
I invert the analysis of Glaeser and Kahn (2001) to investigate which industry-level characteristics affect industry job centralization (CBD location) within regions. The primary purpose of the analysis is to understand what factors are associated with the share of an industry’s jobs located in CBD areas. This relationship is estimated for four-digit NAICS industries with the following ordinary least squares regression:
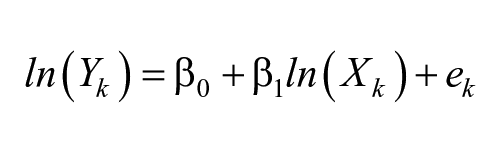
Y is the share of industry k’s employment found in CBD areas, where the share is the weighted average (by MSA employment) across the sample of MSAs. X is a vector of industry-specific characteristics, and e represents the error term. There is a relatively large pool of four-digit industries to analyze, compared with the use of two and three-digit sectors, allowing for the analysis of meaningful variation across industry types. While the analysis of five and six-digit industries would have increased the number of observations in the analysis, data for some of the independent variables employed here are not available at this level of industry disaggregation. To account for the skewed distribution of many of the variables employed here, the variables are log-transformed.
Independent Variables
Worker location
For each four-digit industry, the share of its workers who live in the CBD, as previously defined, is calculated. Zip level (ZCTA) worker residence for each industry is drawn from the five-year sample of the Census Bureau’s American Community Survey (ACS) for the period 2012–2016. The ACS identifies the industry in which an employee works by two-digit NAICS code, each of which are matched to the relevant four-digit NAICS category. For each industry, the share of workers who live in the CBD is calculated based on the weighted average (by MSA population) across regions. Treating worker location in a binary way does not represent the complexity of commuting patterns within MSA areas. Rather, the variable controls for the possibility that worker centralization might be associated with industry job centralization. While the direction of causality is unclear—within a region, do firms locate where their workforce lives or vice versa?—we should expect the share of industry workers in CBDs to be associated with the location of workers within regions. A firm is unlikely to locate in the exurbs, for example, if the type of workers it typically employs tend to live centrally within regions and vice versa.
Cluster location
Clusters refer to regional concentrations of related industries (Delgado, Porter, and Stern 2015). For example, “high-tech” activity refers to a collection of industries that are related through supply chains, the activities they perform, and the types of workers they employ. Such clusters show a high propensity to congregate together within regions. A given industry, therefore, might locate a high share of workers in CBD areas if the industries with which it forms a cluster also locate a high share of their workers in CBD areas. Each four-digit industry is assigned to a cluster according to the definitions of Delgado, Porter, and Stern (2015). For each four-digit sector, I calculate the average share of its clusters’ employment that is found in CBD areas (less the industry’s own employment), weighted by employment across each MSA. For each four-digit sector, the independent variable is the share of its cluster’s employment that is found in CBD areas. Treating cluster location in a binary way does not represent the complexity of supply chains within MSA areas. Rather, the variable controls for the possibility that industry job centralization might be associated with cluster job centralization within a region.
Industry skill content
The nature of a given industry’s activities can determine its location, both within and among regions. Within regions, local services sectors will locate to access consumers (i.e., where residents are concentrated), while some industries locate to benefit from density and agglomeration economies, such as information spillovers and networking effects. Here, I examine how the level of human capital of a given industry’s workers determines the share of industry employment located in CBD areas. Acemoglu and Autor (2011) measure the skill intensity of industries using the Department of Labor’s O*NET database. The O*NET database ranks each occupation in the Bureau of Labor Statistics’ (BLS) Standard Occupational Classification (SOC) System, across a variety of task categories. One task, for example, measures the extent to which a given occupation requires “using mathematics to solve problems.” For each occupation, Acemoglu and Autor (2011) group certain tasks into two dimensions of worker skill. The first measures the extent to which an occupation comprises tasks that are “routine” or “nonroutine.” The second measures the degree to which the tasks of a given occupation are either “cognitive” or “manual”. Jobs consisting of nonroutine work involve complex environments with few universal rules, whereas routine work is guided by the application of rules and protocols. Manual work comprises chiefly physical tasks, while cognitive work tends to be more analytical, requiring complex problem-solving. Combining these dimensions, we can say, for instance, that the job of an anesthesiologist requires a lot of nonroutine and cognitive work, while the work of a construction worker is more manual and routine.
Each industry comprises a different occupational structure—the share of workers that are programmers or machinery operators, for example—and each occupation ranks differently across the two skill dimensions Acemoglu and Autor (2011) identify. Based on the national occupational structure of each four-digit industry (how jobs are divided across different occupations within an industry, released by the Bureau of Labor Statistics), it is possible to calculate a weighted skill-intensity measure for each four-digit sector. We should expect industries that comprise more cognitive activities to locate a higher share of workers in CBD areas to benefit from agglomeration economies.
Other controls
A dummy variable is used to identify if an industry is part of the traded or non-traded sector of the economy, based on the definitions of Kemeny and Osman (2018). Typically, traded industries produce goods that are predominantly consumed in a location outside of the region of production, whereas goods and services in non-traded industries are predominantly produced and consumed within the same region. We would expect non-traded industries to be dispersed to serve populations, whereas traded industries should be more clustered (maybe within a CBD), to benefit from density and localized agglomeration economies. For each four-digit industry, the (national) average number of employees per establishment is calculated, based on data released by the Quarterly Census of Employment and Wages. Industries comprising larger firms should locate a higher share of employment outside of CBDs, where space is more abundant and land is typically cheaper. The analysis covers the period 2016. Two separate models are estimated, one for each of the two skill dimensions identified above, “cognitive” and “routine,” which are distinct but overlapping measures of industry skill content.
As Table 4 reveals, the coefficients generally have the expected signs. As the tasks that comprise work in an industry become more cognitive in nature, the share of industry centralization increases, all else held constant, with a 99 percent level of confidence. By contrast, as an industry’s degree of routine activities increases, the share of industry centralization decreases, with a 99 percent level of confidence. In other words, the nature of a given industry’s activities is a statistically significant predictor of the extent to which it locates employment in CBD areas. The presence of cluster activity in CBD areas has a positive but statistically insignificant impact on the degree of industry centralization. By contrast, as the share of industry workers who live in CBD areas increases by 1 percent, the share of jobs found in CBD areas increases by nearly 1 percent, with a 99 percent level of confidence. To be clear, the positive relationship between CBD job and worker location for a given industry represents an association rather than a causal relationship. More research is required to understand the extent to which people follow jobs or jobs follow people within regional economies. As the average size of an establishment in an industry increases by 1 percent, the share of industry workers in a CBD area decreases by around 0.2 percent, with a 95 percent level of confidence. In other words, industries comprising larger business establishments, which should require more space, locate fewer workers in CBD areas. If an industry is part of the trade sector of the economy, this negatively predicts the share of industry employment found in CBD areas, although the coefficient is only statistically significant in Model 1. This could be the case because many traded industries, such as manufacturing activities, do not thrive in CBD locations. In summary, when we control for other factors that might influence the extent to which an industry locates jobs in CBD areas, we find that industries comprising relatively more cognitive work locate a higher share of jobs in CBD areas.
Determinants of Industry Centralization 2016.
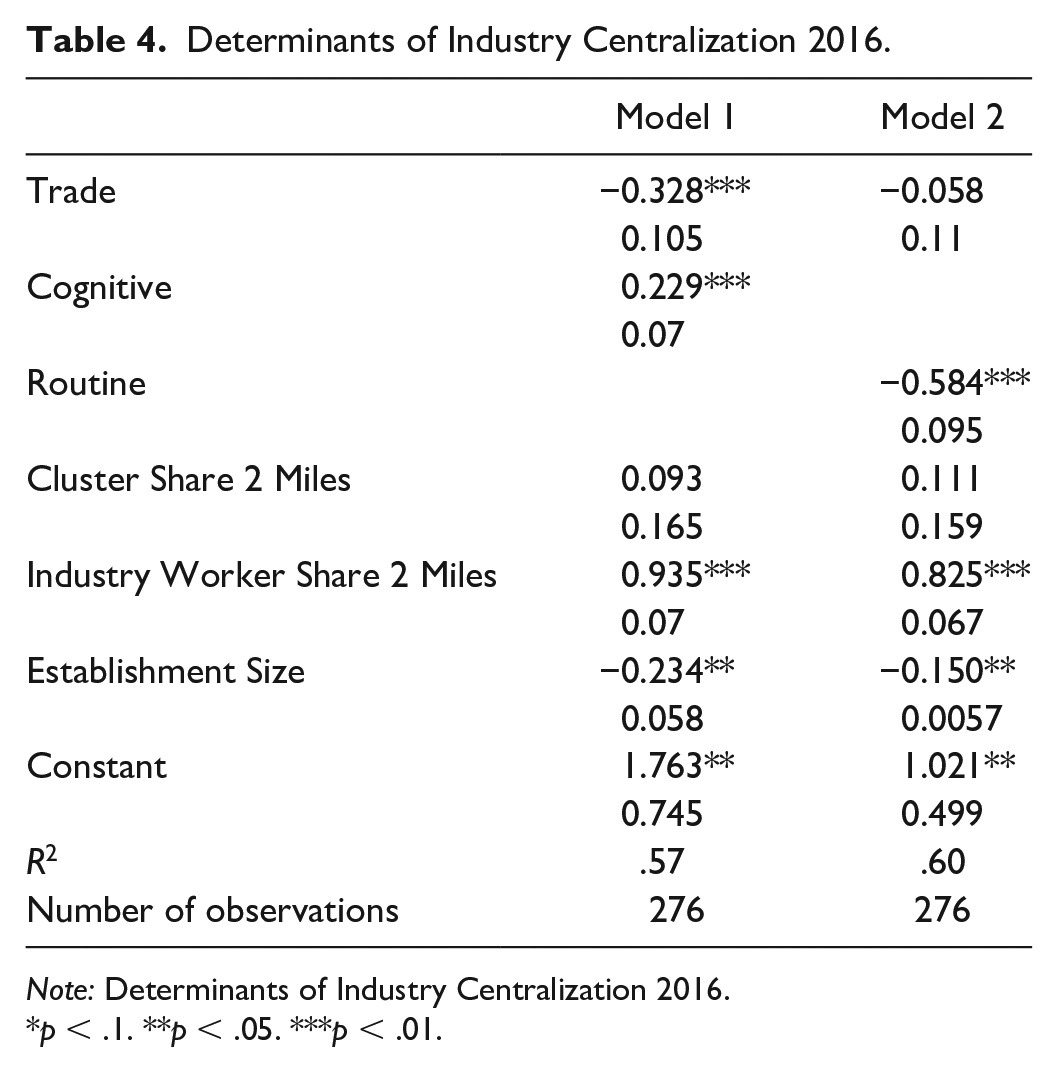
Note: Determinants of Industry Centralization 2016.
p < .1. **p < .05. ***p < .01.
Based on these results, it is likely that the nature of economic activities found in a given region influences the performance of its CBD area. For example, a CBD area in a region that has a specialization in routine, manufacturing activities, which have a lower propensity to locate jobs in CBD areas, will likely underperform a CBD area in a region which specializes in cognitive, information-oriented activities. To shed light on this point further, consider the CBDs that added the most and fewest jobs since the 1990s, identified in Table 1. For the regions in each group, I calculate the degree of cognitive activities in the trade sector of their economies (skill content should vary less between their respective nontrade sectors; Moretti 2012). In 2016, the trade sectors of the regions where CBDs added the most jobs comprised activities that were, on average, 31 percent more cognitive than in the “worst” performing CBD regions. Since the 1990s, the degree of cognitive activity in the trade sector of the regions home to the best performing CBDs rose 64 percent, while cognitive activities in the regions home to the least well performing CBDs increased by 32 percent. These figures provide some evidence that the type of industries in which regions specialize have a bearing on the performance of their CBD economies.
Conclusion
For decades, planners and local leaders have sought to reverse trends of decentralization and revive central city economies (Euchner and McGovern 2003). The findings presented in this paper reveal that while many CBD economies have experienced job growth over the period 1994–2019, aggregate CBD job gains have been concentrated in a handful of CBD areas. Furthermore, CBD job growth has considerably lagged job growth in non-CBD areas, in most regions. While many CBD economies have become home to higher paying economic activities over time, compared with non-CBD areas, we see further divergence with respect to wages, where wage growth in some CBD areas has far exceeded wage growth in other CBD areas. This is likely because industries that locate a higher share of jobs in CBD areas comprise activities that are more cognitive, and less manual, in nature, and such activities are unevenly distributed across regions (Moretti 2012; Storper et al. 2015). The performance of CBD economies in a given region is likely tied to the nature of its wider regional economy, and the industries in which it specializes. Among regions, differences in the wages paid in CBD areas are much greater than the differences of the wages paid among non-CBD areas, suggesting that CBDs are a key point of differentiation in the performance of regional economies.
If we define the urban resurgence of jobs as absolute job growth in CBD areas, since 1994, sixty-four CBD areas have seen positive job gains. If we measure the resurgence as CBD job growth that has outpaced job growth in non-CBD areas, fourteen CBDs fall into this category. Yet even in those CBD areas that are home to relatively high shares of a region’s jobs, CBDs account for a significant minority of regional jobs. This is because the overwhelming majority of households in U.S. regions are located outside of central city areas (Baum-Snow 2014). Around 80 percent of jobs in the United States are found in the non-traded (or local services) sectors of the economy (Osman and Kemeny 2021), and, within regions, these industries locate to best access households. The decentralized feature of U.S. households within regions, therefore, places a constraint on the number of jobs that can reasonably locate in CBD areas. Short of a wholesale return of residents to the historic centers of regions, CBD economies will typically be home to jobs in: traded sectors of the economy that are able to support relatively high costs of doing business; local services industries which serve local residents and people who work in CBD areas; as well as leisure and hospitality sectors that serve regional and out-of-region visitors.
What does this mean about the ability of planners to revive CBD economies? If planners seek to stimulate significant employment growth in central city areas, a starting point would be to understand better the forces that drive CBD performance. Many efforts to develop CBD areas have targeted consumption industries, such as sports complexes, entertainment zones, and convention centers (Euchner and McGovern 2003). Based on the types of industry that locate high shares of employment in CBD areas, these types of efforts are unlikely to generate the urban revival that planners seek. Instead, the revival of CBD economies would best be aligned to broader regional efforts to nurture and grow the types of traded industries that locate in CBD areas.
On a final note, beyond the public health crisis, the Covid-19 pandemic has taken a toll on many aspects of the economy. Due to the timing of data releases, we cannot assess the extent of employment losses in CBD economies due to the pandemic. However, CBD areas are predominantly home to two types of economic activity that have been disproportionately affected by the pandemic. The first is the Leisure and Hospitality sector, which accounts for 17 percent of jobs in CBD areas compared with 13 percent of jobs in non-CBD areas. During the depths of the labor market losses at the outset of the pandemic, 46 percent of Leisure and Hospitality jobs were lost nationally. 5 As of August 2022, the sector still employed 7.2 percent fewer workers nationally (1.25 million positions) compared with pre-pandemic levels.
Second, CBD areas contain a disproportionately high share of office-related activities. Around 40 percent of jobs in CBD areas are directly found in offices, 6 compared with 21 percent of the jobs in non-CBD areas. This is significant because office jobs have a higher proportion of employees who began to work from home during the pandemic. For example, in May 2020, at the outset of the pandemic, 57 percent of workers in Management, Professional, and Related occupations, activities typically found in offices, were working from home due to the pandemic (Bureau of Labor Statistics 2021). Reduced daytime populations in CBD areas are the most obvious consequence of increased work-from-home activity, which will impact the revenues of local businesses that serve office workers during and after work. If there is a permanent drop in the number of workers who commute to CBD areas, this could engender a redistribution of consumption away from CBD areas, from places of work to places of residence. The longevity of work-from-home trends could also affect the demand for office space in CBD areas, which could impact property tax bases, and transit ridership.
Early in the pandemic, workers who retained their jobs and who could, worked from home. Not for the first time, many embraced teleworking as the future of work and wondered what this would mean for the endurance of cities. In May 2020, 38 percent of full-time workers in the United States reported working from home due to the pandemic. This figure had fallen to 7.5 percent in August 2022. The share of workers working from home due to the pandemic in Management, Professional, and Related occupations has fallen from 57 to 11.6 percent over this period (Bureau of Labor Statistics 2021). Surveys reveal that most employers and employees expect workers to maintain a significant presence at their places of work, even if there will be a greater acceptance for workers to work from home some of the time (Barrero, Bloom, and Davis 2021). It is estimated that as workers work from home to a greater extent, this will reduce spending in city centers by 5 to 10 percent (Barrero, Bloom, and Davis 2021).
Firms do not locate in CBD areas because they are the cheapest locations to do business, but because CBD areas are the most productive destinations for certain, typically information-oriented, activities. A large body of academic research highlights the benefits of agglomeration economies to companies and the importance of face-to-face contact and proximity for worker productivity (see, e.g., Storper and Venables 2004). A greater acceptance of work-from-home schedules will likely suppress some consumption in CBD areas, hurting local services businesses, and leading to reduced CBD employment in these sectors. The pandemic’s longer-term impact on the health of CBD economies will likely depend on the longevity of work-from-home trends for office workers and the extent to which technology can adequately replace face-to-face interaction. At this point, it seems to be the case that companies still value such interaction. We have not seen companies abandon physical offices and embrace the virtual office in a wholesale fashion, as some predicted they might. For those CBD areas that have performed well prior to the pandemic, the pandemic has most likely created a slower job growth trajectory, rather than signaling the beginning of their demise.
Footnotes
Declaration of Conflicting Interests
The author(s) declared no potential conflicts of interest with respect to the research, authorship, and/or publication of this article.
Funding
The author(s) received no financial support for the research, authorship, and/or publication of this article.
