




Abstract
In this article we propose a Janus-faced approach to survey design—an approach that encourages researchers to consider how they can design and implement surveys more effectively using the latest web and database tools. Specifically, this approach encourages researchers to look two ways at once; attending to both the survey interface (client side; what users see) and the database design (server side; what researchers collect) so that researchers can pursue the most dynamic and layered data collection possible while ensuring greater participation and completion rates from respondents. We illustrate the potentials of a Janus-faced approach using a successfully designed and implemented nationwide survey on the writing lives of professional writing alumni. We offer up a series of questions that a researcher will want to consider during each stage of survey development.
Keywords
Professionals encounter a steady stream of requests to participate in online surveys. On the WPA List in the first two months of 2013, for example, there were seven requests for participants in online surveys, with three additional requests appearing during the first week of March 2013. Given the rapid rise in popularity of online surveys—which utilize advancements in web and programming technologies to design, administer, and process surveys in new ways—one would expect to see an equally rapid rise in the development of effective online survey theories and techniques for writing studies researchers. However, what appears to have happened instead is a rise in the use of prepackaged survey platforms (e.g., SurveyMonkey, Zoomerang, Qualtrics, and many others) that have removed the perceived need for both programming skills and for any revisiting of theories informing survey construction. We believe that such a revisiting is necessary because, although survey software has made the process easier, it hasn’t necessarily made it more effective. As just about everyone who has participated in an online survey knows, it is all too common for surveys to present participants with long lists of questions with little indication of the effort required to complete the survey or even its overall purpose. Thus, we argue that writing researchers need to take a more active role in constructing surveys outside of the prepackaged options because, while some surveys may be smaller in scale and intended for internal use to improve an individual course or program, other surveys are quite large and sponsored by large educational organizations (like Educational Testing Service), and the results of these kinds of surveys exert wide-ranging and potentially dramatic influence on the work we do in the field and on our ability to advocate for our work to others outside of the field.
Survey Research and Methodology in Writing Studies
Survey research has, of course, been used for decades in writing studies as a valuable tool for collecting data and uncovering trends about perceptions, practices, and experiences that can in turn be used to inform our teaching and research. Surveys are valuable instruments to employ when a researcher needs to obtain descriptive information from a large population (Lauer & Asher, 1988, p. 55). Surveys of large-scale sets of writers may be useful for gauging genre use and technology use and for detecting correlations between socioeconomic factors and writing. In addition, surveys remain important because they allow researchers to seek trends that might not otherwise appear in smaller data sets. Does a trend observed in a classroom (of perhaps 25 students) hold true across a program of 3,000 students? Does a trend observed on one campus hold true when analyzed across programs around the country?
In the professional writing community, for example, scholars have surveyed students, alumni, teachers, professionals, and managers about their perceptions of professional writing coursework (Coon & Scanlon, 1997; Cox, 1976). Others have used surveys to identify and assess the kinds of job skills needed by professional writers (Bednar & Olney, 1987; Halpern, 1981; Sapp & Zhang, 2009; Whiteside, 2003), and still others have used surveys to gather data about current workplace practices (Brumberger, 2007; Dawley & Anthony, 2003; Dayton & Hopper, 2010; Moss, 1995). In the composition community, survey research has been used to discover trends in topics such as program assessment (Stitt-Bergh & Hilgers, 2009; Weiser, 1999), satisfaction with university writing centers (Thompson et al., 2009), and instructor perception of multimodal writing (D. Anderson et al., 2006). Although these surveys have produced valuable data for our field, only the most recent were conducted online, and those that were appear to have used prepackaged survey software rather than taking advantage of some of the capabilities that web and database technologies now provide. So although their results may continue to be relevant, the methodologies they employed can no longer serve as a guiding example for how to design and implement a modern survey using the latest technologies.
Until recently, scholars had engaged in theorizing the development of effective survey instruments in writing studies (P. Anderson, 1985; Chou, 1997; Sherblom, Sullivan, & Sherblom, 1993; among others). P. Anderson (1985) continues to serve as a primer for writing studies researchers on the theory and practice of effective survey development, discussing both the elements of a survey and concepts like operational definitions, levels of measurement, reliability, validity, and others. Sherblom et al. (1993) also introduce important perspectives to consider in survey development, in response to what they perceived as an overall lack of attention to careful and systematic development, construction, and analysis of surveys in business communication (p. 58). Chou (1997) introduces researchers to networked, email, and web-based surveys, but his relevance is limited by the fact that the web technologies he refers to were only in their infancy back then and did not include more sophisticated visual design or back-end processing considerations.
Substantial innovations have emerged in web-based survey development since Chou (1997), yet recent special issues of journals devoted to research methods—including Technical Communication (2008), Written Communication (2008), and College Composition and Communication (2012)—include no discussion of survey methodology. No books appear to include this discussion either. Lauer and Asher (1988) write about sampling and surveys, but the subject has either disappeared or been submerged in more recent volumes (see, e.g., Bazerman & Prior, 2003; Kirsch & Sullivan, 1992; McKee & DeVoss, 2008; Nickoson & Sheridan, 2012). Survey research is included in Hughes and Hayhoe’s (2007) A Research Primer for Technical Communication, but it is largely intended for an audience of research novices. This is problematic because, while surveys (both large and small, local and national) fill a particular need, our field is paying little attention to the challenges of developing complex, larger-scale data collection despite the new functionality available that would make surveys more effective than ever, both in terms of user completion and in terms of the collection of complex data. To borrow a distinction made by Lanham (1993), writing studies often looks through surveys, but seldom looks at them (pp. 80-81).
A Janus-Faced Approach to Survey Design
We propose a Janus-faced approach to looking at survey design—an approach that encourages researchers to look two ways at once—specifically, to develop surveys with an eye toward the participant’s experience while also planning for usable outputs for researchers. This dichotomy can also be understood in terms of attending to both the front-end survey interface (how participants interact with questions and produce data) and back-end data collection (how participant responses are stored and utilized) so that researchers can pursue the most dynamic and layered data collection possible while ensuring greater participation and completion rates from participants.
This approach encourages researchers to consider how they can implement surveys more effectively using the latest tools to develop both the front-end interface and the back-end data collection in their surveys. At this point those latest tools are web-based programming and database tools. However, a Janus-faced approach accommodates changes in technologies and can be adapted to whatever future technologies or capabilities that may develop.
A Janus-faced approach arises out of the reality that the possibilities available to researchers are much more extensive and promising than what simple survey packages are able to offer. Continued advancements in technology that enable more sophisticated user interaction (technologies like HTML, CSS, and JavaScript libraries like jQuery) paired with back-end, server-side technologies for processing and storing user data (programming languages like PHP and Ruby combined with databases like MySQL) enable efficient and dynamic data collection and analysis that extend beyond prepackaged survey software. Although such prepackaged software has made surveys more accessible and easier to develop and distribute, their predefined structures have also had the effect of making researchers bend to their limitations.

Illustration of Janus coin face adapted from one found at mythopoetry.com.
As part of a Janus-faced approach, we offer a set of productive questions designed to help researchers as they develop surveys appropriate to their particular contexts. To illustrate the potentials of this approach, we refer often to a nationwide survey that we constructed on the writing lives of professional writing alumni. We designed this survey to meet the needs of participants and researchers through question development, interaction design, usability testing, and data analysis. In the following sections we offer a series of developmental issues and the questions that a researcher should consider.
Determining Research Objectives
Key questions: What questions do I want answered? What data do I want to collect? What do I want to be able to do with my data? What technologies do I have available to me to solicit and process data?
A typical starting point for researchers is to identify research questions and the kinds of information that can be gathered to address those questions. But we would add to this that it is imperative for researchers to formulate their questions with an eye toward the technological tools that will enable researchers to collect data in a way that is both engaging for the user and easily processed by the researcher. Researchers should envision participant responses not just as “answers” but also as “data” to accommodate both the collection of participant content and the consideration of how such content should be stored and processed.
Previous to our current online, database-driven technological context, survey researchers would often store and process their data using spreadsheets. Because of the ubiquity of spreadsheet software like Microsoft Excel and the ability of survey packages to easily export results into such software, researchers may default into envisioning data collection in terms of what information they can imagine storing in rows in columns. This perspective can limit not only the ways that participants might be asked to respond to questions, but also the amount of data researchers can decide to collect and the questions researchers may decide to ask of the data.
In the study we’re referencing here, we knew that we wanted to learn about the writing lives of professional and technical communication (PTC) graduates. We didn’t want to limit ourselves to hearing from graduates from just a single program or graduating class. We wanted to be able to hear from as many PTC graduates as possible and find out from them a variety of things, including these:
What genres did alumni write?
What genres did they value?
For whom did they write?
With whom did they write?
Where did they write?
What technologies did they use?
As we were deciding what we wanted to know, we also had to imagine how we wanted to analyze and report the data we were going to collect. Though our questions seemed relatively contained at the onset, we wanted to collect additional data about each question that would enable us to chart trends among all respondents while simultaneously constructing a picture of each individual respondent. After these questions were suitably fleshed out and added to contextual questions about participant demographics and professional experience, our five initial questions had turned into at least 75 data points, or more, depending on how each participant responded. Storing this amount of data as a single row in a spreadsheet, as most prepackaged survey tools would provide, is incredibly limiting for both researchers and participants, as we’ll discuss later (see Blythe, Lauer, & Curran, forthcoming, for survey results).
Identifying Collaborators
Key questions: Should I make the survey myself? Should I collaborate with others? Who might those others be? Where can I find them? What might persuade them to work with me?
If researchers are going to be able to move beyond spreadsheets and utilize more advanced interface design and data storage databases, they are going to need help. Most researchers will acknowledge their limitations when it comes to mastering—single-handedly and quickly—the complex array of web-based tools currently available. Rather than succumbing to the technical limitations of a prepackaged survey tool—or taking the time to master web design and development, database programming, and statistical analysis skills—researchers should take seriously the possibility of collaborating with skilled colleagues to design customized survey mechanisms that will produce the most useful methods possible for data collection and analysis. While some argue that researchers should develop skills that would allow them to code their own mechanisms (Lockett et al., 2012), the skills required to code an effective and reliable mechanism are difficult to master and require time to develop. Seeking out programmers and statisticians who can collaborate with researchers in this component of the work makes building custom mechanisms more feasible for most researchers.
Identifying where potential collaborators might be found on campus and identifying how they might benefit from the collaboration are good first steps. Larger universities may have departments, colleges, or schools within their universities that sponsor computing environments and that hire experienced graduate students, or that network with experienced researchers across a variety of departments. Similarly, universities may have university-wide training or resource labs that provide these services. Universities may also have research assistance networks that help researchers secure important resources. Programs or departments that work heavily in computing or statistics (like psychology and education) may have faculty who are willing to trade services, or donate their time in exchange for a name on any future publications. One of the authors has worked with two different statisticians, both of whom gave of their expertise in return for a coauthor credit.
Other options include putting the word out to graduate students and undergraduate students in these fields, who can often be hired for less than professionals and/or are willing to work for internship credit. Sometimes departments will provide funding to hire these sorts of students. Another author has worked with both graduate students and a professor in the neighboring psychology department who processed statistics in return for small stipends that were funded by the author’s department (sometimes available out of already-approved travel funds). In addition, funding can be secured on a small scale through grants from organizations like the Council of Writing Program Administrators, the Council for Programs in Technical and Scientific Communication, the National Council of Teachers of English, the International Writing Centers Association, and others who would benefit from the research. One thing to remember is that what may seem terrifically difficult for a researcher in writing studies (e.g., programming a web interface to interact with a database, running statistics on the data once it is collected) are quite easy tasks for those who do them often, which may make their interest in participating more likely than expected.
Securing collaborators is one challenge, but another is recognizing their valuable technological expertise but limited rhetorical expertise. This means that a researcher in rhetoric or writing-related fields should come to the table with a basic understanding of information architecture and interaction design, both of which are rhetorical work despite not being traditional tasks of rhetoric researchers. While we are not advocating that researchers be masters of the technology they will be using, we argue that understanding information architecture allows a researcher to clearly articulate to others what data must be collected—what is valuable, how it will be collected through the survey, how it will be stored in a database, and how it will be utilized in reports. Understanding interaction design helps researchers craft paths through the survey for participants, identifying what the optimal question sequence is, where questions can be hidden unless needed, and how to communicate progress to participants.
In the software industry, the products of information architecture and interaction design are often called “requirements documentation,” documents that enable dialogue first between designers and stakeholders to ensure that all needs are met, and later between designers and developers to find the best possible solution for constructing those designs. This latter dialogue is particularly important as it helps to establish the time and cost for building a design, and developers can often propose compromises that will accomplish the same goal but do so in simpler ways that save on development costs. Researchers need to start with the assumption that their collaborators will not necessarily understand the objectives or have the same goals. The design and “requirements gathering” phase of a project, which is intensely rhetorical and a natural fit for writing researchers, helps collaborators to align goals and determine needs while moving forward with the larger objective of a collaborative research project.
Viewing Survey Participation as User Experience
Key questions: How can I create an interface that encourages potential respondents to take the survey? Once they decide to participate, how do I keep them engaged long enough to finish?
The design of web surveys can involve two competing goals. The first is to collect a large amount of data that can be cross-referenced to produce complex, interconnected results (as we discussed in the section on determining research objectives). The second goal is to design an interface that will engage users long enough to complete the survey. “Survey fatigue” is a well-documented, often-discussed problem in the survey literature (Adams & Umbach, 2012; Lipka, 2011; Rogelberg & Stanton, 2007; Sinickas, 2007). Couper and Miller (2008, p. 833) report that the problem has become so significant that the completion rate for opt-in surveys has dropped to below 10%. The design of our own survey proceeded with this challenge in mind. What follows in this section is a description of decisions that need to be made in order to raise the completion rate. In our case, we believe that the decisions we describe here led to the 68.5% completion rate of our survey. In other words, of the 375 participants who began the survey, 257 (N = 257) completed it.
The participant side of a web survey is a means through which a researcher and participant engage in symbolic activity. It is, as Zimmerman and Schultz (2000, p. 177) note, a unique form of communication between researchers and participants. Surveying others has traditionally involved deciding how to word questions to ensure that responses are of the kind that would further a research agenda. However, web technologies can now fundamentally change the way we solicit responses from participants, not only by the options participants have in responding and by the visual arrangement and interfaces that accompany the questions, but also by the ways in which researchers can store responses in databases for future analysis (see also Christian & Dillman, 2004; Couper, Traugott, & Lamias, 2001; Dillman, Smyth, & Christian, 2009; Tourangeau, Couper, & Conrad, 2004).
Researchers need to assess what tools and options they have at their disposal, and to think in terms of not only origins (Where are we coming from in our research?) but also ends: How are we going to ensure that people answer the questions and finish the survey? How do we want people to be able to respond? What do we want to be able to do with the data, and thus how should we ask for them and then store them? Put another way, when soliciting responses from a participant, researchers need to think not just about what language (words) to use, but also how to present those words and/or visuals on a screen, how they can be grouped, contextualized, introduced, and arranged and how participants will be given the option of responding to them.
Survey research shows that surveys up to 20 minutes have a much higher completion rate than do surveys of any length beyond that (Galesic & Bosnjak, 2009). Not surprisingly, the shorter a survey, the more likely a respondent will complete it. However, because shorter surveys are not generally in the best interest of researchers’ ability to collect meaningful data, researchers should take advantage of the web’s capabilities to maintain a respondent’s interest throughout a longer survey. For respondents to our survey, a commitment to a 20-minute length was made up front. We incorporated “the fine print,” including institutional review board–mandated language about participation and contact information, but in smaller text off to the side that could be scrolled (see Figure 2). In our usability testing of the survey (something we’ll talk about throughout these sections), not one of our participants actually read the preliminary text, so we regarded subordinating it to the friendlier, plain language as a usability improvement.
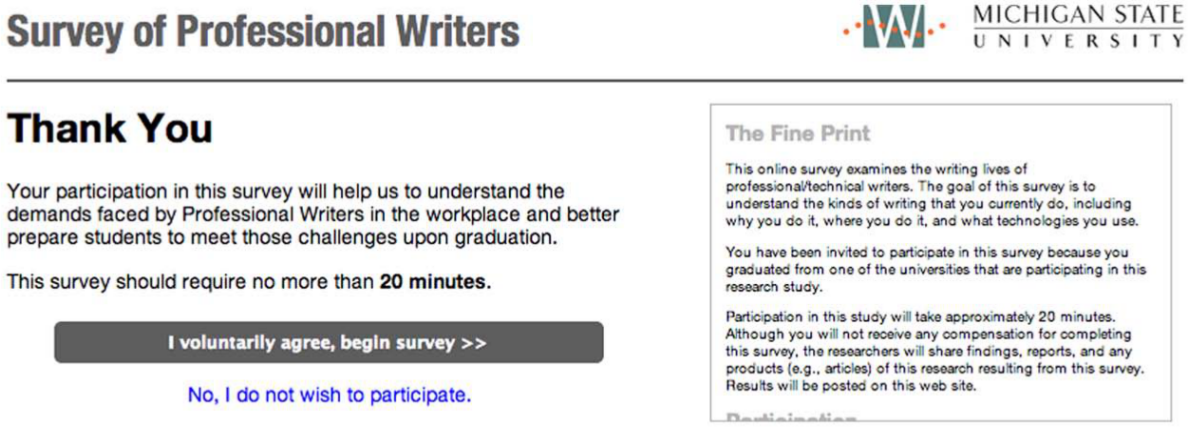
Welcome screen of survey showing IRB language and commitment to 20-minute time limit.
In addition to honoring a 20-minute time limit, the typical way that we tried to avoid frustrating respondents was to create interfaces that adapted to a respondent’s input. We knew that the grouping of questions into clearly identified sections can assure a respondent’s persistence with a survey (Christian, Dillman, & Smyth, 2007; Smyth, Dillman, Christian, & Stern, 2006), but our original list of survey questions, compiled into a Microsoft Word document, was simply unapproachable and unwieldy. By grouping related questions and naming each section clearly, we gave respondents a better sense of what they were being asked and why it was important. (We see this as a move akin to the need to group a set of tasks in a tutorial to no more than 10 steps [Sun Microsystems, 2009, p. 123].) Each section also had a very brief description of what we were asking for (see Figure 3). These descriptions were made more succinct after usability participants indicated that they simply did not read our longer explanations.

Section header with brief description of questions to be answered in that section.
For example, Section 1 of the survey was intended to give us insight into the careers of professional writers after they had completed their degrees, including their job titles, fields in which they had been employed, and their continued education. We realized that exposing all of the possible questions we might want participants to answer would be long, unwieldy, and intimidating. To avoid that, we were able to identify the questions we wanted all participants to answer and the remainder could be hidden from a participant’s view until the participant responded in particular ways. As shown in Figures 4 and 5, hiding options for users until applicable made the survey seem more “customized” toward each individual participant (Tuten, 2010) and resulted in an initial set of four questions that could fit on one screen, which was far more approachable and, depending on participant responses, could be completed very quickly.
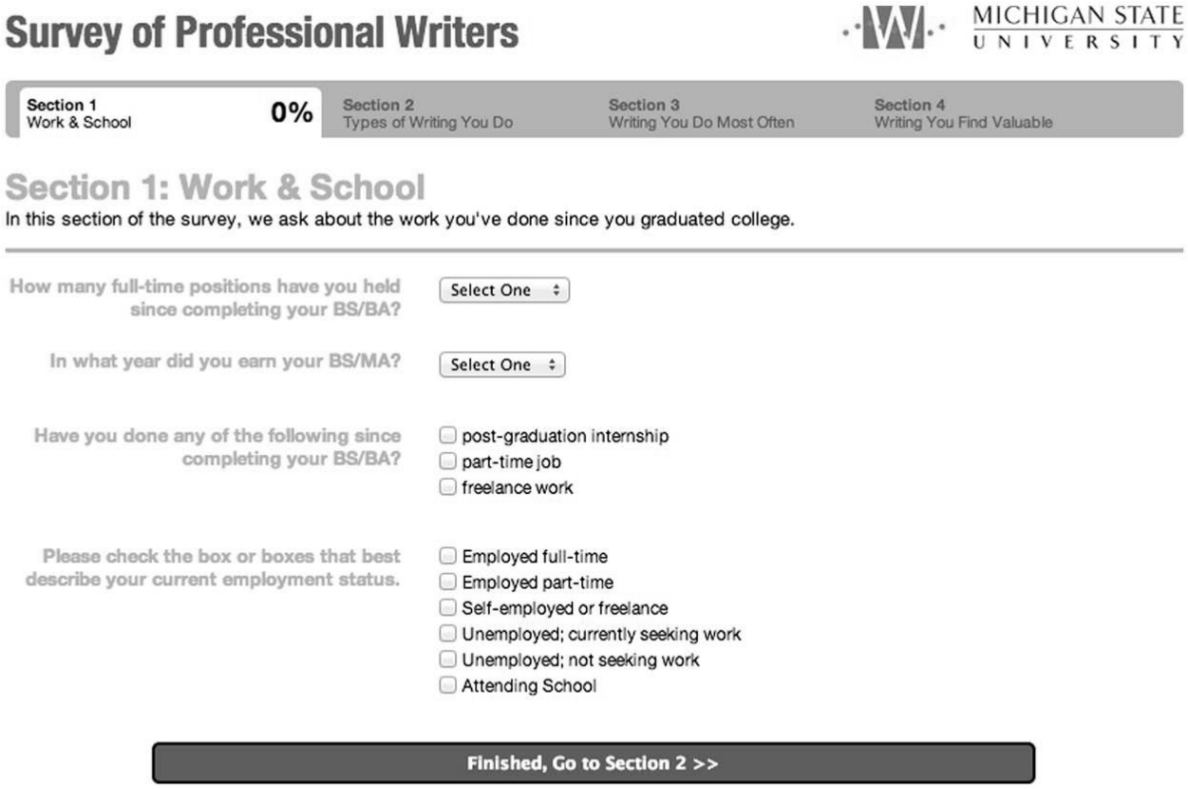
Section 1 of the survey when the user first lands on it; all questions immediately scannable, short, not intimidating.

Section 1 with all possible questions displayed based on user response to the initial questions; long, intimidating, scary.
By hiding these extra choices unless the participants indicated they needed them, we were able to make that step of the survey appear shorter, requiring less screen reading and making it easier for the participants to move through it quickly. Developing such “skip patterns” greatly improves researchers’ ability to guide a user seamlessly through a survey (Dillman, Caldwell, & Gansemer, 2000; Fleming & Bowden, 2009; Shropshire, Hawdon, & Witte, 2009).
A status bar was another commitment we made to helping respondents’ persist through the survey (see Figure 6). The status bar showed participants exactly how many sections of the survey there were, which section of the survey they were currently responding to, and exactly how far they had gone in the completion of that step.

Progress indicator showing stages of the survey that a user will need to complete.
As Figure 7 illustrates, when participants completed a section, they were notified of that fact by a green checkmark indicator and then advanced to the next section.

Progress indicator showing already completed stages and current completion rate.
Survey research supports the inclusion of progress indicators (Vehovar, Batagelj, Manfreda, & Zaletel, 2002, who cite many others), as did our usability tests. Before adding these displays (known also as “wayfinding” in user experience design language), participants in our usability tests expressed frustration about not knowing how far along in the survey they were or how much was left. While these features do not themselves save respondents time, we noticed through additional usability testing that adding them had an appreciable effect in reducing participant frustration in the process of completing the survey.
One more way we increased participant persistence was by using techniques that made moving and selecting data easy, perhaps even engaging, for respondents. Our usability testing consistently identified Sections 3 and 4 of the survey to be the most problematic in terms of survey fatigue. Once participants had built their initial list of all writing genres they had ever created (they were required to indicate at least five), they were asked to create two lists, one of the five genres they wrote most frequently (Section 3) and one of the five they valued most (Section 4). To make this process as efficient and speedy as possible, participants were presented with the list of writing types they had indicated in the previous question and given an interface that allowed them to simply drag and drop the appropriate genre into an ordered list. The “top 5” box would glow green when participants successfully added a type to the list, and they could remove items and rearrange as necessary (see Figure 8). The button to advance to the next step was disabled until participants finished the list, giving them first a condition (“Build Your Top-5 List”) and then an option (“Go to Question 3”) when the step was complete. The novelty of being able to build an ordered list by dragging existing options into a new area of the screen (rather than having to retype those options) and the use of color to highlight the completion of a task are some of the visual cues and tools that reduced cognitive complexity (Dillman et al., 2000) and we believe resulted in the 68.5% completion rate of our opt-in survey.
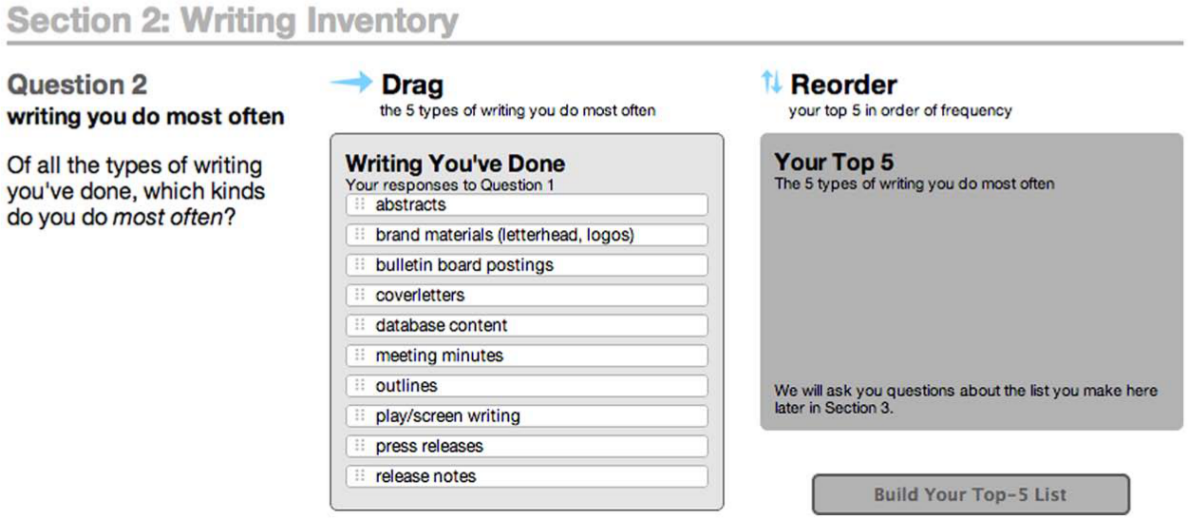
To build the lists of writing they do most often and writing they value most, participants are asked to choose from the list of writing they generated in question 1 and drag those types to their top 5 list. Items in the top five can be rearranged as needed.
Balancing Restriction and Flexibility
Key questions: When should respondents be asked to select from a list, and when should they be able to respond in their own words? Where can compromises be made between gathering needed data and optimizing the experience for participants?
In a Janus-faced approach to survey design, it is important to focus on user experience and researcher needs simultaneously. This often involves deciding between restricted and open-ended responses. In our survey, for example, prepopulating the list of genres and auto-suggesting existing genres for participants to choose from was about more than optimizing the time they spent responding to the survey. We chose to store writing types in a database, making it easy to display randomized lists (thus bypassing concerns over biasing based on list placement), but also making it easy to reuse this information across participants. If users had to enter types of writing manually, not only would there be the nightmare task of having to account for spelling mistakes or inconsistencies (“blogs” vs. “blog posts” vs. “bligs”), but also then there would be no way to consistently track a particular writing type across multiple participants. Consider “email,” for example: if every participant had a unique response for “email” (e.g., email, e-mail, Gmail, MS Outlook), it would be difficult to query the data for all participants who identified that (or a version of that) as a response. By saving that type in a database table, and giving users a checkbox rather than having them enter their own wording, that type became trackable, and we were able to see how all participants, or individual participants, responded with that genre. In this way, prepopulating and auto-suggesting had the effect of normalizing much of the survey data and reducing the amount of work researchers would need to do after the initial data collection cycle had ended.
As illustrated in Figure 9, one place where we balanced the competing needs for restriction and flexibility was in Section 2, where we began with a prepopulated list of genres that participants could then add to.

Section 2, Question 1 of the survey, in which students were asked to select the genres they’ve produced since completing their degrees. The genres were stored in the database and randomized for each participant so as not to bias the responses.
While we wanted to make it as easy as possible for participants to select the most common types of writing they might have used, we also wanted to enable them to add types we hadn’t accounted for. To that end we added an “Add More Types” option that would give participants an interface where they could add custom types to their list (see Figures 10 and 11). When a participant began entering the name of a new writing type, the survey would display a list of similar types that had been entered previously, or that were already on the list but that perhaps the participant had overlooked.

The button participants would click if there were types of writing they wanted to add to the list but had not been included in the default list.

The “Add Type” box in which participants would enter the type of writing they wanted to add, with the survey providing suggestions as they typed.
Though this option made it easier for participants to accurately name what they wrote, it also made the data collection process cleaner and resulted in less work for researchers on the database side of the survey.
Collecting and Using Metadata
Key questions: What can survey data tell us about how participants experience the survey? How can those data help researchers design better tools and get better participant completion rates?
One of the many advantages of a web-based survey is that it’s possible to collect data about how all participants interact with the survey mechanism. A great deal can be learned by recording how participants move through the survey,including when they start and when they finish, and, if they didn’t finish, where they abandoned the survey. Database tables can hold more information than just what participants specifically input in response to researcher questions; data about usage, response times, and paths the participant takes through the questions can also be collected and used to gain further insight into a participant’s experience of the survey. For example, the participant table in our database was designed to store not only participant demographic data but also metadata describing how the participant engaged with the survey. The following is a list of fields added to the participant table that didn’t answer any research questions but were essential in understanding and optimizing the participant’s experience:
Timestart—The time stamp corresponding to the date and time the user began taking the survey.
Timeend—The time stamp corresponding to when the user completed the last step of the survey.
Laststep—The field that was updated as the participant progressed through the survey, recording each time he or she advanced to another step.
Completed—The field containing a simple binary (0 or 1, yes or no) indicating whether or not the user had completed the survey. This field made it very easy to differentiate between complete and incomplete surveys and calculate completion rates.
While the demographic data stored in this table were particularly important for our research, the survey metadata this table also stored allowed us to understand and test participants’ experience. For example, by calculating the difference between timestart and timeend, we were able to see if participants were spending more than the 20 minutes we promised them it would take to complete the survey. After extensive testing we were able to get the average completion rate down to 824.9 seconds, or 13.8 minutes, well under the time bargain we made with participants in the consent form.
The metadata labeled Laststep were particularly important for usability testing because they allowed us to identify where participants were abandoning the survey, determine what might be causing trouble at that particular point, and modify the design to alleviate that trouble. During usability testing, Laststep data showed that most of those who abandoned the survey did so at Section 3, the second to last section; we were able to address that during testing by adjusting the design (see Figure 15, discussed later in the article), which dramatically improved our completion rate. While these data show our final completion rate at 68.5%, they also reveal that 47 of the 128 participants who abandoned the survey (36.7%) did so at Section 4, the “Most Valued” section, where participants began ordering the list of valued genres. If the survey were to be run again, we would focus our usability efforts on reducing the user frustration in that section.
Researchers as Information Designers
Key questions: How do the data collected need to be used? How can they be utilized during the survey to guide or assist participants? How can they be utilized in the form of reports and exports for researchers during and after the survey?
In addition to designing surveys to collect metadata, researchers can make choices regarding the design of their database tables that greatly improve the ways in which data can be used during and after the survey, while also ensuring that the values of the researchers are represented. When thinking about database tables overall, researchers should remember that the order in which a participant completes a survey should not coincide with how a researcher decides to build tables to store the data. For example, if we present the participant with four sections of a survey, we would not, then, set up our database tables to store data from each corresponding section in a linear fashion. Rather, researchers should base their construction of tables on factors such as whether information needs to be stored as a single response or multiple responses, or whether data will need to be reused throughout various sections of a survey.
In our survey, for example, the participant table stored demographic data that did not have multiple possible responses. This worked well for questions like “birth year” where we expected users to have a single response. However, we built a second table (demographic_responses) to store responses to the demographic questions where the participant could choose multiple responses. Without the ability to let participants respond with multiple answers, and without the means to store those responses as equally valid, researchers force participants into uncomfortable political territory. The question of gender, for example, is an issue we took very seriously. If we had only the participants table to store single responses, participants would have had to answer one way or another (see Figure 12). However, using the demographic_responses table, we could store two separate responses to the same question, allowing participants who identify with more than one gender to respond how they wish (see Figure 13).

Using radio buttons limits user selection to one option. Storing a participant’s response to this question requires only one field in a database table. Allowing participants to select only one response sends a clear message about the bias of the survey designers.

Using checkboxes allows participants to submit multiple responses. This type of interaction allows more freedom for participants to identify with multiple genders, but storing multiple responses requires a different information architecture.
While the decision to use checkboxes over radio buttons to collect responses to the question of gender respects participants’ right to identify with multiple genders, it also allows researchers to easily query participants’ responses in a number of ways; for example, researchers can identify
How many participants selected multiple genders, a specific gender, or didn’t respond
How many genders a specific participant selected
While on the surface the question of radio buttons versus checkboxes may seem small, that choice embodies both serious rhetorical implications as well as technical implications for how to store and retrieve multiple responses to the same question.
From an information design perspective, perhaps the most significant challenge we faced was in the design of the key questions for this study—questions about which types of writing participants do most often and which they value most. These responses needed to be stored as two lists of five prioritized genres identified by each participant (see Figure 8). These sequences were our essential data points that would guide how each participant responded to the rest of the survey, so they needed to stored separately from the other data, like demographics, or like the inventoried list of all the writing that participants had ever done (see Figure 9). To accomplish this, we designed a database table called sequences (see Figure 14) that would store one record for each genre in a participant’s lists, resulting in 10 records per participant (2 lists per participant × 5 genres per list).
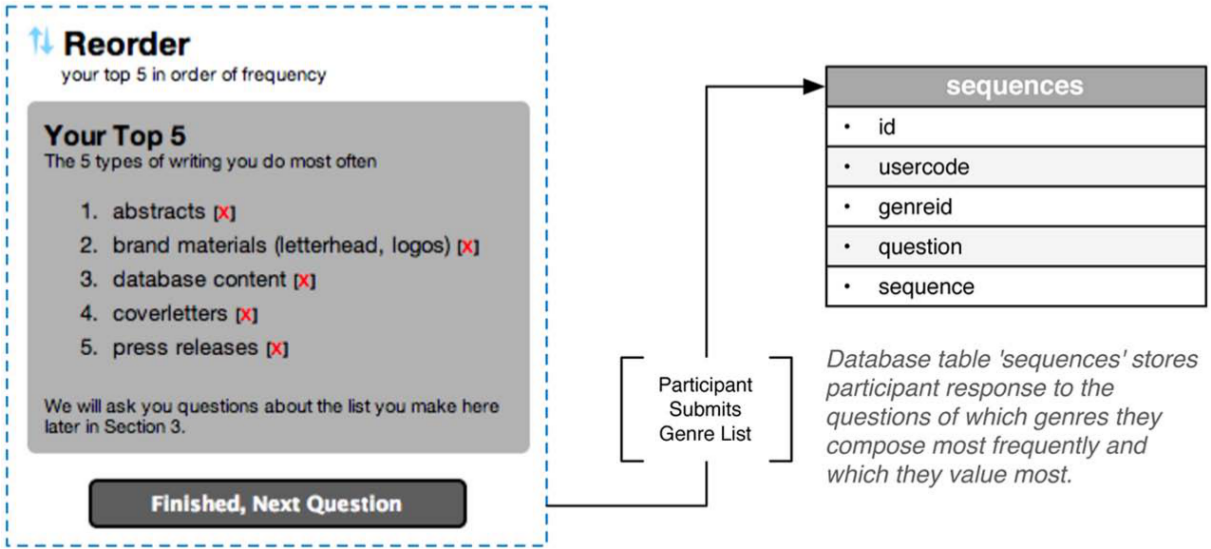
When participants submit their ordered list of genres, their responses are parsed by the survey and each of the five types is stored as a separate record in the database table named “sequences.”
Once processed by the survey, a participant’s responses would be stored in the sequences table (see Table 1).
Sequences.
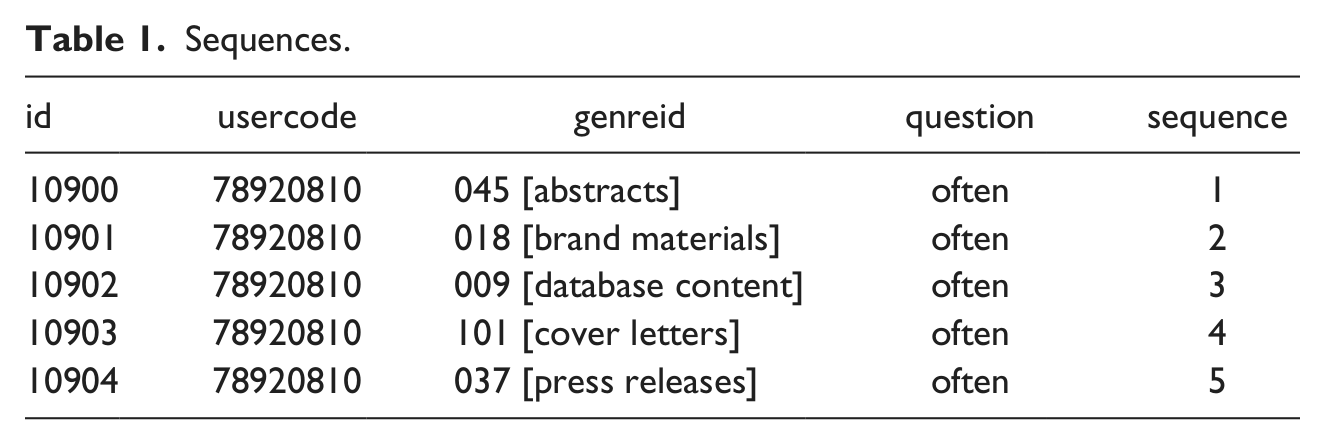
This table and its data are essential to the survey and emblematic of the challenge of storing sequenced data, so we would like to explain the table in greater detail to illustrate the larger question of how tables like this should be thought about. The
It is in the reassembling of the data for various purposes that the value in storing data in this way becomes apparent. For example, immediately following the steps in which participants create their two lists of five genres, they are asked to provide additional detail about each genre (see Figure 15).
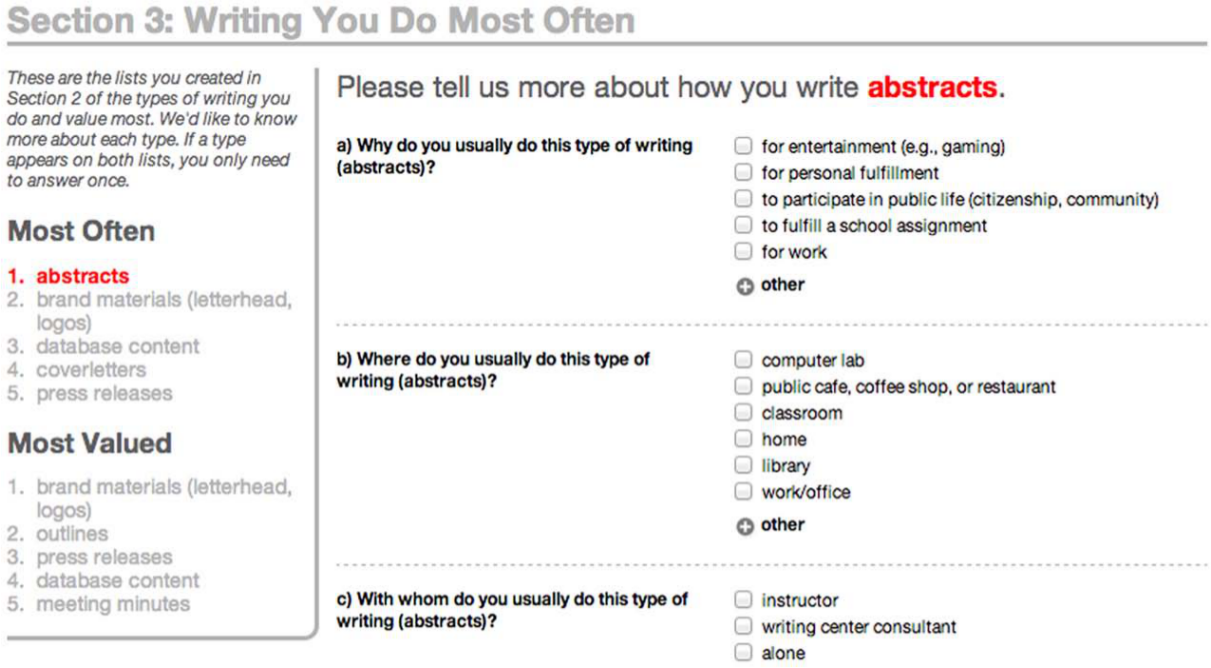
Partial screenshot of Section 3 of the survey, asking participants for more data about each of the genres in their two lists.
Section 3 of the survey is built around the two lists users created in Section 2 and that we stored in the sequences table. Figure 15 shows the step in which respondents add descriptive data about each of the genres in their lists. The interface makes use of the participant’s previous responses in two ways. First, the chosen genres serve as a progress indicator, displayed along the left side of the page, marking the genres the user has successfully supplied details for. Second, the item for which the participant is currently providing detail is bolded in red at the top of the section, indicating to the participant which genre he or she is currently adding detail for. If the participant had included the genre in both lists, it would be displayed in both navigation lists to the left and he or she would need to respond only once.
While this display uses the participant’s data to assist him or her in both adding more detail about each genre and navigating the survey, we can use those same data to assist the researchers in their analysis of the data. Figure 16 illustrates two of many possible views researchers might create using a single source of data (participant’s sequences).
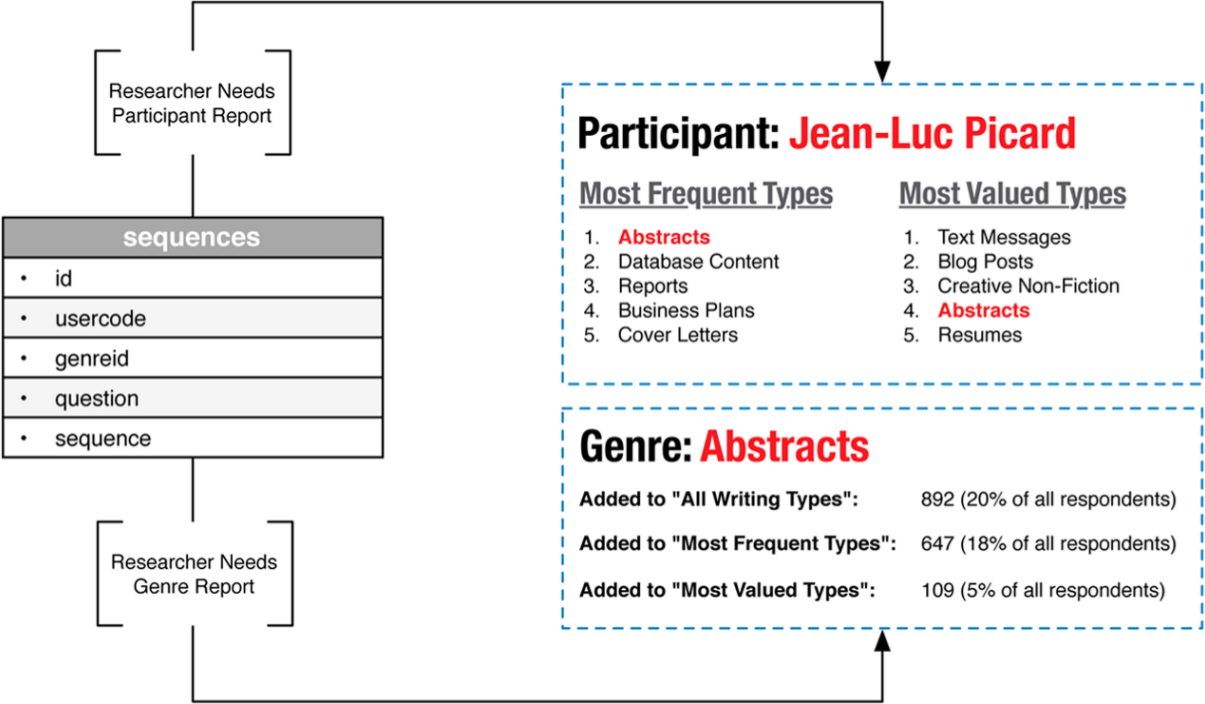
Illustration of how the data submitted to the sequences table by participants can be used to create multiple reports for researchers.
First, the researcher can generate a report about each participant, including lists of most valued and most frequently used genres. Using the same data, the researcher can then generate a report about each genre to determine how often a genre was used in either list, and where that genre was placed on each list (how often participants prioritized it as number 1 versus number 5, for example). These are only two examples of how these data might be recombined or analyzed, but because of the flexibility of how participant responses are stored, options for exploring data and repurposing them for different audiences with different needs are almost unlimited.
Implications and Conclusions
Survey research in writing studies has a great deal of potential for providing the field with important information about trends in skills, experiences, and perceptions related to the teaching and composing practices of instructors, students, practitioners, administrators, and others. This potential has been neglected as of late because researchers have not taken advantage of our current technological advancements, which now include tools that make engaging participants and storing complex arrangements of participant data more accessible than ever before. We call this approach to survey design a Janus-faced approach because it asks researchers to attend to both user and researcher needs simultaneously in the design, development, and analysis of surveys and survey data. A Janus-faced approach also advocates for researchers’ collaboration with programmers and statisticians who can help facilitate the kind of broad, detailed data collection that will ultimately benefit the field and better legitimize our work to those outside of writing studies.
But this work would be largely impossible if researchers were to rely on prepackaged survey platforms that allow for little more than building simple lists of questions and exporting the responses to those questions to a spreadsheet for limited analysis. Prepackaged survey platforms (like SurveyMonkey) usually limit researchers to the development of simple questions that lack interdependency and nuance, resulting in data with the same problems. By relying on these “user-friendly” tools, we lose the ability to assist users with custom progress displays, encourage participants to give us deeper responses about their choices, or generate a range of reports to suit researcher needs. For the survey we discuss throughout this article, collecting and using our data in this way allowed us to collect more data (and thus generate more useful reports) by improving the user experience and helping users through to completion. Designing in this way is a challenge, but it is not new; Barbara Mirel (1996) discusses the rhetorical challenges of designing useful data reports with database content in the workplace, but few of our survey tools have risen to meet those challenges.
We would argue, finally, that while a Janus-faced approach does not advocate for researchers to master the programming and statistical skills necessary for this kind of research, at the very least researchers who wish to engage in survey design should develop a passing familiarity with a core skill set that is rhetorical in its very nature and includes
user experience design
interface design
information architecture
information design
While each of these topic areas is a field unto itself, a basic knowledge of them and their practices is empowering. These practices are the rhetoric behind effective surveys: understanding your needs as a researcher, the needs of participants, best practices for asking questions, best practices for user interaction, and effective displays of data gathered from effective database design. Attention to all of these empowers researchers to design surveys that will not only gather more data but make them more useful and more revealing.
Footnotes
Appendix
Declaration of Conflicting Interests
The authors declared no potential conflicts of interest with respect to the research, authorship, and/or publication of this article.
Funding
The authors received no financial support for the research, authorship, and/or publication of this article.