



Abstract
In recent years, the Norwegian government has invested heavily in improving basic skills in the adult population. Initiatives have included legislation, the introduction of work-based adult education programs, and reforms in schooling. In light of this investment, we explore trends in adult literacy and numeracy, by comparing data from two international surveys of adult skills, conducted in 2003 and 2012. Paradoxically, the proportion of low-performing adults appears to have increased, most significantly in the 16- to 24-year age group and in the foreign-born population. The profile of the lowest performing group has changed in the intervening years. These findings suggest that adult education programs and the education system more generally may not be in concord with the goal of including all in the communities of the literate. We discuss policy implications, in the context of the Scandinavian model, but argue that the discussion is applicable beyond national boundaries.
Introduction
Since 2000, Norway has considerably increased investment in improving basic skills in the adult population, through both adult education initiatives and school reforms. This focus and investment is not unique to Norway, but rather reflects international discourse that consistently relates skill levels to economic growth (OECD, 2015b; Reder, 2013; Tett, Hamilton, & Hillier, 2006; Wickens & Sandlin, 2007). In light of this investment, we seek to identify and discuss associated trends in adult performance on tests of basic skills, thus promoting an understanding of lifelong and lifewide skill development (Reder, 2013; Rogers, 2011). Furthermore, we consider implications of our findings for education policy and initiatives. By identifying and profiling the low-performing groups (LP), we may contribute knowledge relevant to the design of preemptive and proactive measures. The profiling entails a range of demographic and background variables including age, gender, education, and employment status. We focus especially on the group of adults who demonstrate low performance on tests of either literacy, numeracy, or both dimensions. We ask the following:
Which trends, regarding the lowest performing group in the literacy and numeracy dimensions, are identified through a comparison of results from the two most recent international surveys of adult skills, the Adult Literacy and Life Skills survey (ALL) 2003, and Program for International Assessment of Adult Competencies (PIAAC), 2012.
How has the profile of the lowest achieving group altered from ALL to PIAAC? How is the profile of this group in PIAAC?
What are the policy implications of these findings for investment in basic skill development, especially for adult education initiatives?
The Role of Basic Skills
Literacy and numeracy are difficult and contested concepts (Desjardins, 2003; Hamilton, Hillier, & Tett, 2006; Hanemann, 2015). Human capital theory, which underpins the design of the OECD surveys (OECD, 2013a), reflects an individual skills paradigm, in which literacy is regarded as an acquired attribute or skill, stable over different contexts (Hamilton & Barton, 2000). In an alternate cultural practices paradigm, literacy is regarded as a situated response or as practice, influenced by the goals, desires, and needs of individuals (Hanemann, 2015). It is not the purpose of this article to discuss these issues in depth; however, we acknowledge that underlying ontologies influence approaches and interpretation, both when designing and analyzing surveys and when designing policy and educational interventions.
Statistical analyses of international surveys consistently relate performance on these surveys to individual well-being, finding strong positive correlations between high performance on survey tasks and the variables of employment, income, welfare, and empowerment (OECD, 2013a; Tighe, Barnes, Connor, & Steadman, 2013). St. Clair (2012), though critical to the surveys, sees potential in being able to link the demonstrated abilities of adults to the wide range of background factors. This type of analysis, he concludes, may provide insight into structural relationships and thus give direction for education policy.
A remarkable point is that, adults who perform poorly on these tests often report their own competence as good (Arnbak, 2004; Hamilton & Barton, 2000). There may be a number of explanations for this finding, but it perhaps indicates that day-to-day functioning may involve a wider range of literacy activities than those tested. We assume that adults are most likely more concerned with improving their day-to-day functioning than their performance on tests. The ontology underlying the design and analysis of the surveys may therefore fall short as a functioning ontology for designing successful adult education initiatives.
There is still, however, a general agreement on the need to invest in adult education (Hanemann, 2015; OECD, 2011). Literacy and numeracy are empowering for persons (Prins, 2006). A body of research suggests that adults with poor basic skills are more likely to be excluded from the labor market (McQuaid & Lindsay, 2005; Meld.St.16, 2016; Proliteracy America, 2003) and from participation in society more generally (OECD, 2013b; Windisch, 2015). Continuing technological developments have led to the situation where some professions and trades are becoming obsolete and many low-skill jobs are disappearing (OECD, 2015a; Schleicher, 2008), requiring workers to adapt and acquire new skills (Hoyles & Noss, 2009). There is a greater reliance on digital forms of communication and learning, which require a higher level of basic reading skill (Margolis, 2012). In addition, many studies have confirmed the intergenerational transmission of literacy skills (Windisch, 2015).
Basic Skills in the Norwegian Context: A Changing Narrative
Norway represents the Scandinavian social democratic project (Oftedal Telhaug, Mediås, & Aasen, 2006) with emphasis on the inclusion and active involvement of all citizens in the society. Ensuring and maintaining high levels of basic skills throughout the population has been, and continues to be, a policy priority (Hagen & Skule, 2008; Meld.St.16, 2016; Rinne & Kivinen, 1993). Historically, the ideas of humanism and democratic values have directed adult education (Gustavsson, 1991). Nilsson and Nyström (2013) claim that more recently these core values have been marginalized and human capital ideas have gradually overtaken. Responsibility for provision of adult education is now passed to employers, to a higher degree. According to Nilsson and Nyström (2013), this has led to participation patterns that tend to strengthen rather than weaken inequalities. Participation is limited to employed persons only and employers more concerned with production goals than with the development of individual competencies, may favor certain employees in provision.
Norway has chosen to monitor the status of basic skills in the adult population through participation in three international surveys: The International Adult Literacy Survey, IALS (1994-1998); the Adult Literacy and Life Skill Survey, ALL (2003); and the OECD Survey of Adult Skills, PIAAC (2012). Overall, Norwegian adults have consistently ranked highly in both the numeracy and literacy dimensions, but the identification of a relatively high proportion of low-performing adults in all three surveys (Bjørkeng & Lagerstrøm, 2014; Gabrielsen, Haslund, & Lagerstrøm, 2005) has not harmonized with the social democratic ideals and has subsequently aroused political response. Comparing results from ALL with those from the earlier IALS survey, Gabrielsen (2005) maintained that the proportion of low-performing adults, though high, had remained relatively stable over the intervening period. In this article, we consider trends in the later period between ALL and PIAAC.
Earlier initiatives aimed at improving the level of formal education in the adult population included legislations to ensure all adults the right to formal education, at all levels (KUF, 2002). Local and regional authorities struggled in implementing these policies, and research indicates that overall participation in formal education programs did not increase in the years following (Hagen & Skule, 2008; Riksrevisjonen, 2008). However, since 2008, the number of adults participating in lower secondary education has increased gradually, reaching 1.54 participants per 1000 in 2015. Participation patterns have changed and immigrants now form the dominate group, 92% in 2015 compared with 73% in 2008. We see a similar, though not so pervasive, pattern in participation in the upper secondary education provisions. Less than 50% of those participating in these upper secondary education programs complete the schooling (Vox, 2016b).
In 2006, in direct response to the ALL results, the Norwegian Ministry of Education and Research initiated a workplace-based program, “Basic Skills in the Labor Market” (BKA), administered by the Norwegian Agency for Lifelong Learning. In Norway, this agency bears the name “Vox.” 1 The ongoing BKA program is the flagship of Norwegian adult education. In the period 2006 to 2016, more than 60,000 adults were registered by their employers as completing BKA courses (Vox, 2016b). Enterprises together with course providers apply for funding to implement training programs designed to improve those basic skills perceived by employers as relevant to the work tasks. As such, BKA may be described as vocational basic education (Druine & Wildemeersch, 2000) linking basic skills to vocational training. Each course is between 30 and 100 hours duration and covers one of four main areas: arithmetic, reading and writing, ICT, and Norwegian as a second language. Several small-scale studies report positive effects, including improvement in basic skills and other effects related to improved cooperation, communication, and workplace satisfaction (Sønnesyn, 2014). The participant profile has changed over time. In general, participants are now younger, have higher formal education, and females no longer dominate. BKA now offers language provision to immigrants and the overall proportion of participants with minority background has increased from 26% in 2008 to 38% in 2014 (Sønnesyn, 2014). The BKA was recently renamed CompetencePlus (Vox, 2016a).
On the schooling front, Norway has embraced the tenets of the “basic to basics” movements. The two school reforms pertinent in this discussion are Reform 1997 and Knowledge Promotion 2006. Reform 1997 placed emphasis on providing relevant learning experiences through cross-curricula, while Knowledge Promotion emphasizes basic skill acquisition (Utdanningsdirektoratet, 2013). In addition, national and international testing schemes such as PISA (Programme for International Student Assessment), TIMSS (Trends in International Mathematics and Science Study), and PIRLS (Progress in International Reading Literacy Study) have gained an established place in the Norwegian schooling system to monitor the development of these skills. Disappointingly low results, in the initial rounds of these international student surveys (Gabrielsen & Turmo, 2013), contributed to increase the interest in basic skills education. Overall, Norway has achieved a much better international ranking in the three adult surveys (OECD, 2013a), but as we will see in the analysis of PIAAC, younger people are overrepresented in the low-performing categories, thus lending support to the findings in PIRLS, PISA, and TIMSS.
In light of these investments in basic skill development, the PIAAC results were awaited with some expectation in Norway. Again overall, the Norwegian adult population performed well on the cognitive skill tasks in all domains, ranking highly when compared with adults in other countries (OECD, 2013a). However, the proportion of adults in the lowest performing groups in both literacy and numeracy appeared disproportionately high (Bjørkeng & Lagerstrøm, 2014), thus motivating this investigation into trends.
Methodology
The data analysis builds on the Norwegian data from the ALL (N = 5,411) and PIAAC (N = 5,128) surveys. The PIAAC data are freely available on the PIAAC website. We obtained the ALL data from Statistics Canada. Both surveys provided background data, information on performance on cognitive test tasks, and other interview data for participants in the age span 16 to 65 years. The surveys are designed specifically to allow study of trend data (OECD, 2013a, p. 96). Previous research has linked the earlier IALS and ALL surveys (Cascio, Clark, & Gordon, 2008).
In analyzing the data, the proportions and associated standard errors are estimated using the SAS macro, known as the PIAAC Tool, also freely accessible on the PIAAC website. This macro enables the calculation of a variety of basic statistics and regression analyses and is tailored to take account of the specific properties of the PIAAC sampling design and methodology. In particular, it employs the plausible value approach used in estimating the national distributions of individuals’ latent skills, sampling weights, and jack-knife variance estimation (OECD, 2013a). All calculated statistics are sampling weighted, unless indicated otherwise. Statistical significances of differences in proportions and means were assessed by asymptotic Gaussian confidence intervals calculated from the jack-knife estimated standard errors.
The issue of defining LP groups is controversial (Arnbak, 2004). The reports from IALS, ALL, and PIAAC each apply different cut-off criteria; this practice results in differing proportions of adults being allocated to critical zones. In IALS and ALL, both Level 1 and Level 2 were defined as low-performing levels. Sticht (2005) argues that such dividing lines identify high percentages of adults as at risk. Such results lack credibility and the consequence might be that the lowest performing group does not receive necessary support. Hanemann (2015) argues that it is difficult to set dividing lines as contexts differ enormously as do factors such as age, working situation, and so on.
In this article, we adopt the practice advocated by Grotlüschen, Mallows, Reder, and Sabatini (2016). We define the LP group in ALL as those performing at Level 1 in either literacy or numeracy or in both dimensions, and in PIAAC as those performing below or at Level 1 (the two lowest proficiency levels in PIAAC) in either literacy or numeracy or in both dimensions. ALL and PIAAC apply the same scale-score when setting levels; thus, Level 1 in ALL is identical to the combined Below Level 1 and Level 1 in PIAAC.
In our sample, around 49% of the calculated LP group in ALL demonstrated low performance in both numeracy and literacy, while the respective rounded percentage in PIAAC was 64%. In general, it was more common for people to exhibit low performance in numeracy than in literacy. There were no incidences of low performance in either literacy or numeracy and superior performance (over Level 2) in the other dimension.
Findings With Discussion
We consider overall trends in the population and in the native-born and foreign-born groups before profiling the LP group more specifically.
Overall Population Trends From ALL to PIAAC
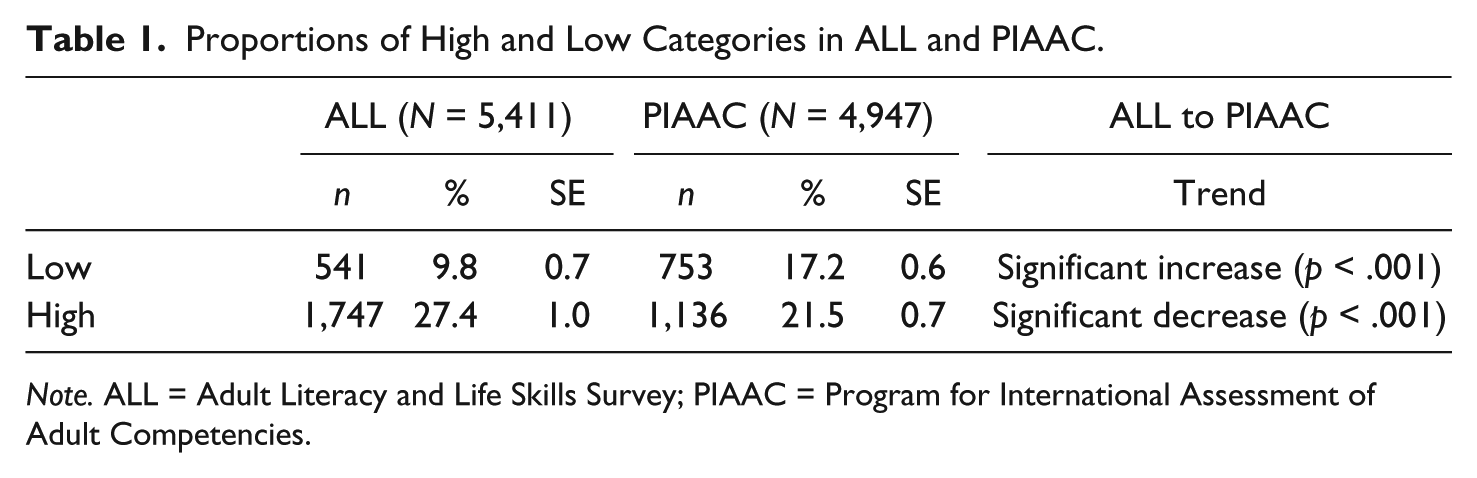
Table 1 shows the sample-weighted proportion of adults classified as LP in the ALL 2003 and the PIAAC 2012 surveys, as well as the respective unweighted sample sizes (n). For interest, we also display the corresponding proportion of adults classified as high proficiency, that is, adults with high scores (Levels 4 and 5) in literacy, numeracy, or both dimensions.
Proportions of High and Low Categories in ALL and PIAAC.
Note. ALL = Adult Literacy and Life Skills Survey; PIAAC = Program for International Assessment of Adult Competencies.
These analyses indicate that the proportion of adults displaying poor basic skills has increased significantly, from 9.8% to 17.2% in the 9-year period. The proportion of adults displaying high skills has decreased significantly in the same period, while the proportion of adults in the middle group is nearly constant, just above 60% in both surveys.
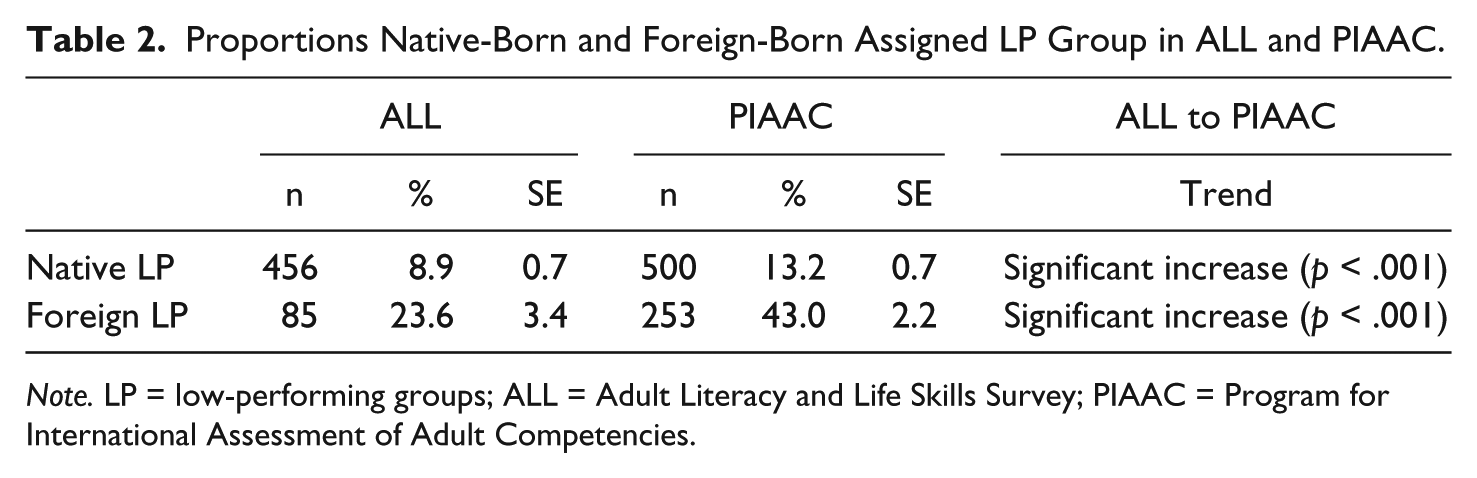
The question arising is if the observed trend simply reflects an increase in the number of foreign-born participants. The proportion of foreign-born residents in Norway has doubled since 2006, reaching around 14% in 2012 (Andreassen, Dzamarija, & Slaasta, 2013). Foreign-born respondents comprised 6.7% of the sample in ALL and 12.8% of the sample in PIAAC. The surveys are administered in the official language(s) of the participating country. Not unexpectedly, foreign-born respondents generally underperform in relation to their native-born counterparts (OECD, 2013a). We therefore separate native-born adults and foreign-born adults in further analyses. Table 2 displays the proportion of adults in the LP group in both ALL and PIAAC, for both native-born and foreign-born adults. There has been a significant increase in the proportion assigned to the LP group, for both categories. In the native-born population, the proportion of low-performing adults has increased from 8.9% in ALL 2003 to 13.2% in PIAAC 2012. In the foreign-born population, the proportion of low-performing adults has increased from 23.6% in ALL to 43.0% in PIAAC.
Proportions Native-Born and Foreign-Born Assigned LP Group in ALL and PIAAC.
Note. LP = low-performing groups; ALL = Adult Literacy and Life Skills Survey; PIAAC = Program for International Assessment of Adult Competencies.
It is difficult to identify any obvious explanation for the trend in the native-born population in this period. In addition to the investment in basic skills education, school reforms since the 1970s have given the present older cohorts better access to basic schooling. Only around 3% of the native-born LP group had less than 10 years of education. In this period, Norway has experienced an unprecedented period of prosperity with high economic growth, almost zero unemployment rates, and enviable welfare entitlements (Statistics Norway, 2015).
The trends in the foreign-born population may be easier to explain. One obvious explanation for the trend is that many foreigners simply have not acquired the Norwegian language. The Language Council of Norway, a consultative body for the Norwegian state and government on language issues, confirms that use of English as a working language is increasing (Språkrådet, 2012). For many foreign-born adults there may be little incentive or need to learn the Norwegian language, even though they may have the facility to do this.
The relatively high education level of the foreign-born LP group supports this explanation. Around 60% of the foreign-born LP group in PIAAC had more than 12 years of education, compared with around 25% of the same LP group in ALL. A determining factor for foreign-born adults to be classified as LP in both surveys was time in the country, the longer time in the country the less likely to be assigned the LP group. In ALL, only 14.6% of the foreign-born LP sample had lived in Norway less than 5 years compared with 32.0% in PIAAC. This reflects recent migration patterns.
The education patterns in the foreign-born LP group and the native-born LP group are quite different. A relatively large proportion, around 17% of the foreign-born LP group, had less than 10 years of education, suggesting that this particular subgroup, most likely, has not had access to basic schooling. Only 3% of the native-born LP group fall into this category. However, just over half, 52%, of the native-born LP group have 10 or more but less than 12 years of education. In contrast, only 23% of the foreign-born LP group fall into this middle category. The majority, 60%, of foreign-born LP group had more than 12 years of education. The high proportion of Norwegian young people dropping out of upper secondary school has been a matter of concern for some time (OECD, 2014).
Age Trends
We now consider age trends. The comparatively small sample of foreign-born adults in the ALL survey makes it difficult to identify reliable age trends for this group. We therefore focus on age trends in the native-born population.
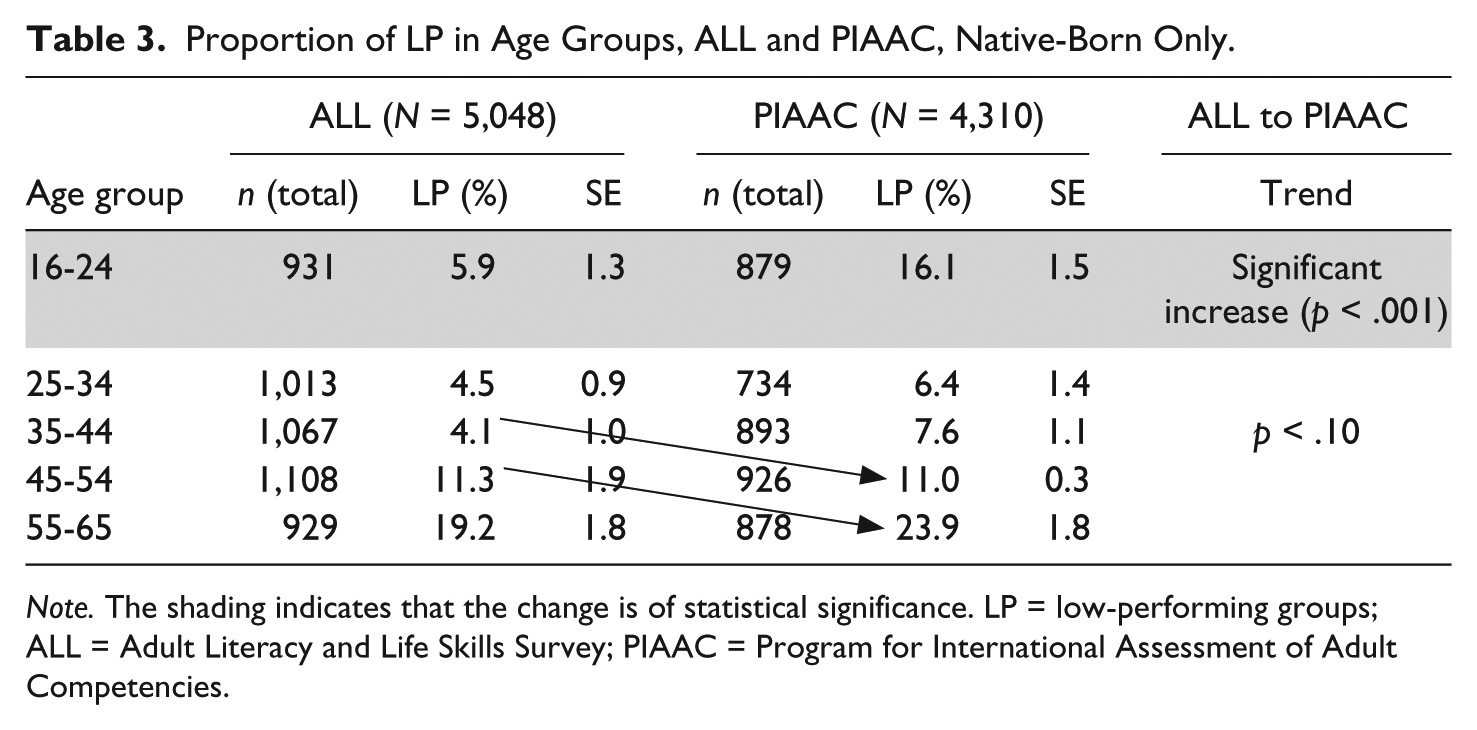
While ALL and PIAAC are not longitudinal studies, the age group samples should be representative for the full age group in the population. For the analyses, we divide the samples into approximate 10-year age groups. The first age group covers 9 years and the last 11 years. Table 3 shows the proportion of each age group allocated to the LP group for ALL 2003 and for PIAAC 2012. The proportion allocated LP has increased in almost all age groups, although the change is statistically significant in the youngest age group (16-24 years) only. In this group, the LP proportion increased from 5.9% to 16.1% in the 9-year period. The implication is that, one in six native-born young people have difficulties in basic literacy, numeracy, or both domains. Period effects do not offer obvious explanations for the tendencies. According to Brooks (2013), the proportion of both adults and young people with poor literacy skills is lower in countries with higher income levels and less inequality. The Norwegian results are therefore somewhat paradoxical. Norway has experienced unprecedented economic growth in the last decades. It is tempting to suggest that perhaps things are going too well in Norway, fostering complacency toward learning and achievement. As discussed earlier, the older cohorts in PIAAC have had access to more years of basic schooling, so the increased proportion of LP in these groups is somewhat surprising, given also, as commented earlier the high employment rates in Norway.
Proportion of LP in Age Groups, ALL and PIAAC, Native-Born Only.
Note. The shading indicates that the change is of statistical significance. LP = low-performing groups; ALL = Adult Literacy and Life Skills Survey; PIAAC = Program for International Assessment of Adult Competencies.
The trends indicated by the arrows in Table 3 support an age–skill loss argument (Cascio et al., 2008), particularly for the older age groups. For example, while 11.3% of the 45- to 54-year cohort was LP in ALL, 23.9% of this cohort, aged 55 to 65 years in PIAAC, is LP. This may be a particular cohort effect, but the overall average scores for these age groups rather support a skill loss argument (OECD, 2013a). The PIAAC data also indicate a significant (p < .001) and large increase in LP percentage (from 11.0% to 23.9%) between the two oldest age groups (45-54 and 55-65 years), thus further supporting the age–skill loss argument.
Norway, as other countries, is experiencing demographic change with an increasing proportion of older adults in the population. Government policy is now directed toward retaining workers longer in the workforce. If these skill loss mechanisms continue, it will be more difficult for older people to retain their positions in the workforce.
Gender Trends
Overall, the gender composition of the native-born sample was the same in both PIAAC and ALL, around 52% male and 48% female. Figures 1 and 2 illustrate the proportion of LP in each age group in ALL and in PIAAC for both genders. In the native-born population, the male and female patterns are similar for both ALL and PIAAC. We see later that these patterns vary in the foreign-born population.
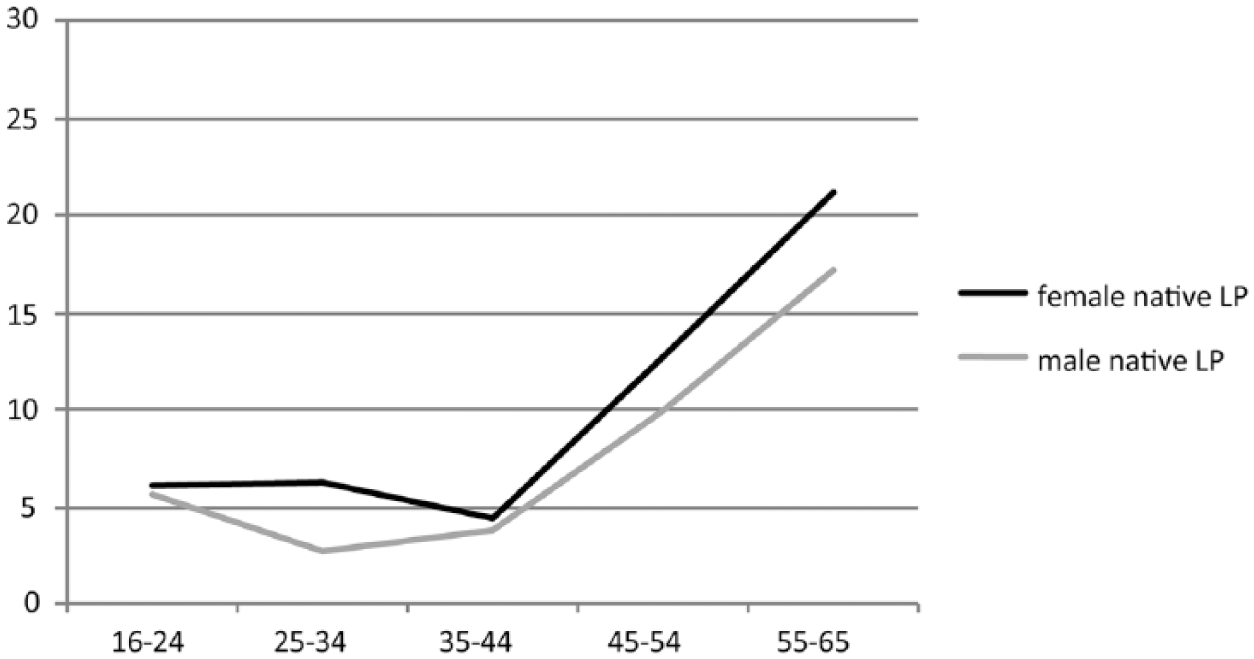
Proportion (%) of LP in age-gender groups, native-born, ALL.
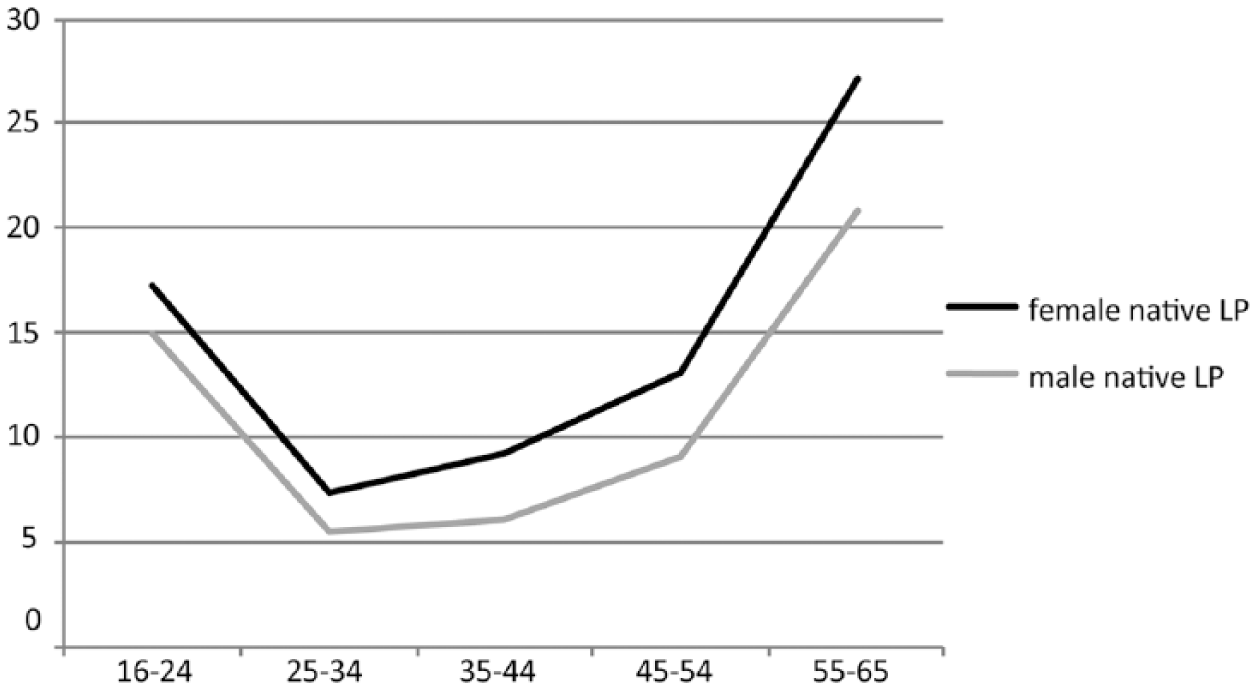
Proportion (%) of LP in age-gender groups, native-born, PIAAC.
There is a significant increase in both the proportion of males and the proportion of females assigned the LP groups between ALL and PIAAC. Differences between the genders favor males, but are not statistically significant. In PIAAC, 15.1% of females are classified LP compared with 11.4% of males.
We conclude that gender differences are not significant in the native-born population and do not explain either the increase in the LP percentages overall or increases within particular age groups.
Considering the foreign-born, the proportion of males in the sample has increased slightly, from 50% male (n = 181) in ALL to 54% male (n = 340) in PIAAC. In period between the surveys, the proportion of foreign-born males classified as LP increased significantly from 25.0% to 41.1% and the proportion of foreign-born females classified as LP increased significantly from 22.2% to 45.1%. Again, the gender differences, though apparently large, are not statistically significant.
Figure 3 displays the age–gender LP percentages in the foreign-born sample in PIAAC only. Males and females demonstrate different patterns over the age groups. In the native-born sample (Figure 2), the male and female patterns were similar. In the foreign-born sample, there is a noticeable difference between the proportion of males and females in the LP group in the 35- to 54-year age group, just over 30% of the males compared with around 45% of females. Because of the small sample sizes, this difference is not statistically significant. The differences may reflect the trend that female partners often join males who have found employment in Norway.
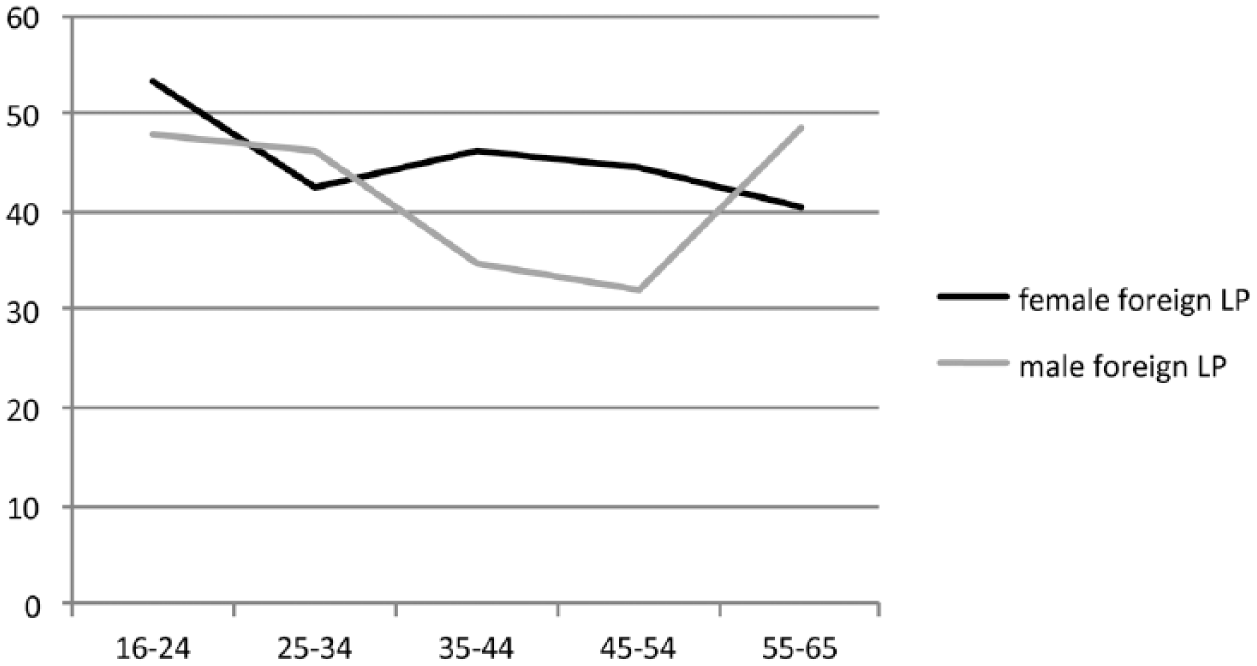
Proportion (%) of LP in age-gender groups, foreign-born PIAAC.
Profiling the LP group
The analyses so far indicate trends in the overall population and in groups within the population. We now consider the composition of the LP group, with particular focus on the PIAAC data. This profiling has implications for the evaluation and design of educational initiatives.
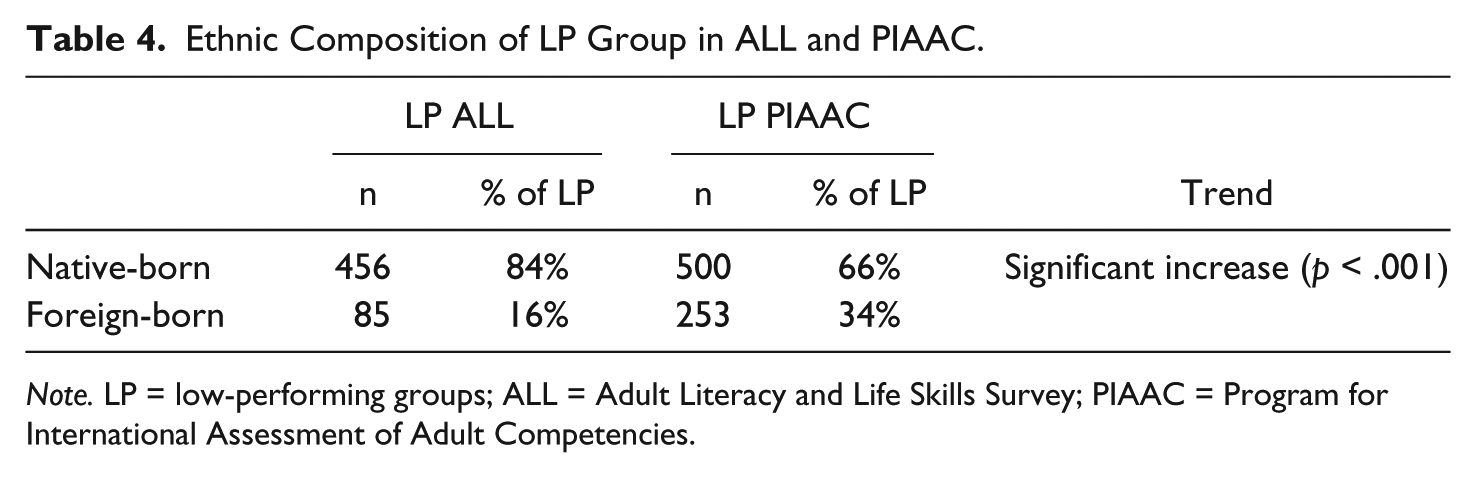
In both ALL and PIAAC, the LP group is predominately native-born (Table 4). However, the proportion of foreign-born in the LP group has increased significantly (p < .001) from ALL to PIAAC. In ALL, foreign-born adults comprised 16.2% of the LP group; in PIAAC, foreign-born adults comprised 34% of the LP group in the sample.
Ethnic Composition of LP Group in ALL and PIAAC.
Note. LP = low-performing groups; ALL = Adult Literacy and Life Skills Survey; PIAAC = Program for International Assessment of Adult Competencies.
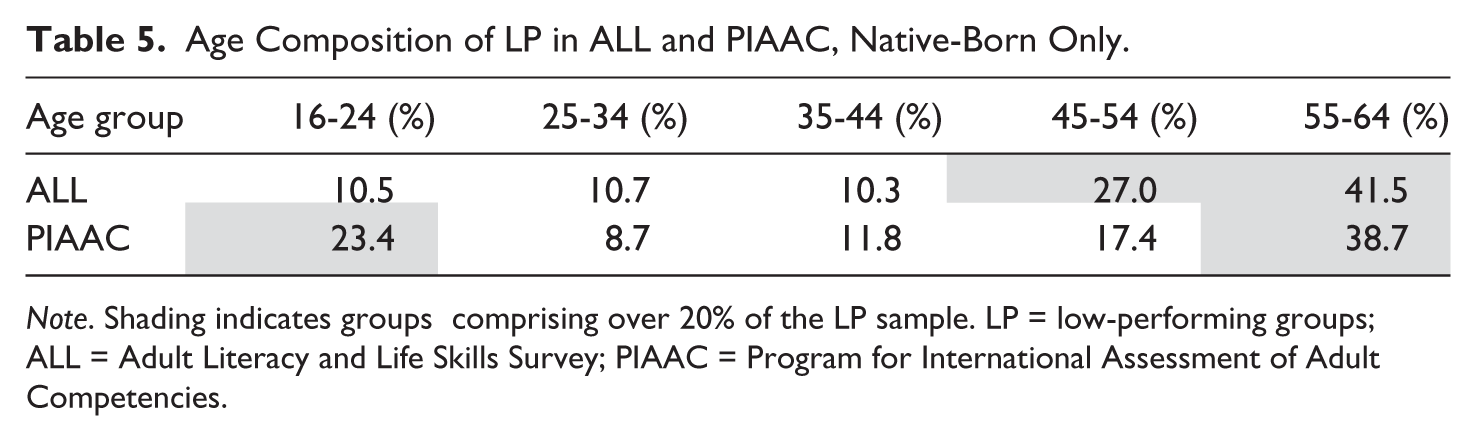
The data presented earlier suggest a change in the age profile of the native-born LP group. Table 5 shows the age composition of the native-born LP group in ALL and PIAAC. In ALL, the two oldest age groups combined accounted for almost 70% of the native-born LP group, with approximately 10% in each of the other three age groups. In PIAAC, the youngest age group now accounts for almost 25% of the LP group. The proportion in the 45- to 54-year age group has decreased while the proportions in the remaining age groups have remained relatively stable. In the total PIAAC sample, each age group accounts for between 19% and 21% of the sample. The distribution in the total sample is therefore not an explanatory factor.
Age Composition of LP in ALL and PIAAC, Native-Born Only.
Note. Shading indicates groups comprising over 20% of the LP sample. LP = low-performing groups; ALL = Adult Literacy and Life Skills Survey; PIAAC = Program for International Assessment of Adult Competencies.
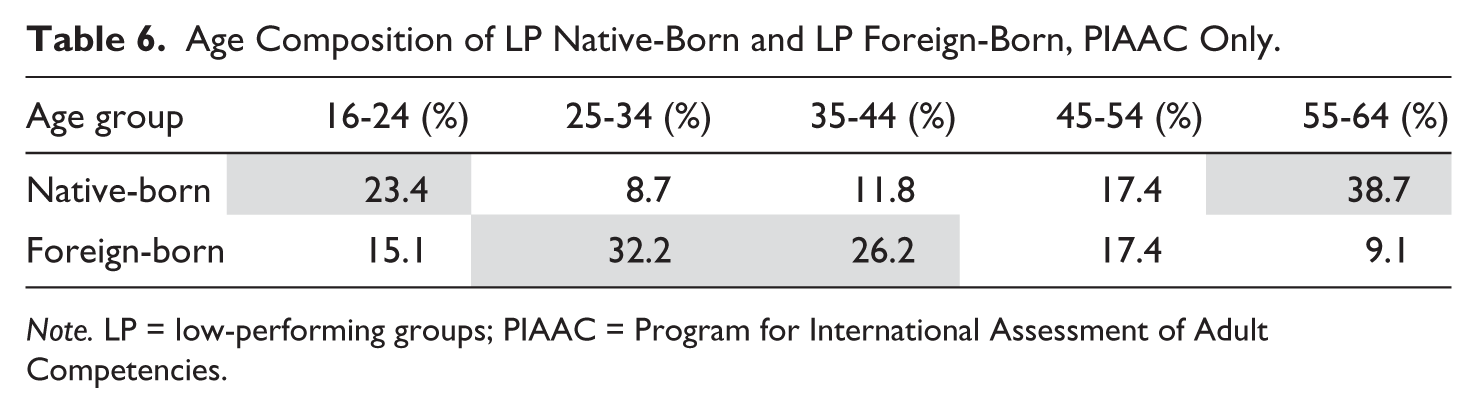
The population size of the foreign-born sample in PIAAC is large enough to allow consideration of the age composition of the foreign-born LP group. In Table 6, we compare the age composition of the foreign-born LP group with that of the native-born LP group. The shading indicates the largest groups, those comprising over 20% of the total LP group.
Age Composition of LP Native-Born and LP Foreign-Born, PIAAC Only.
Note. LP = low-performing groups; PIAAC = Program for International Assessment of Adult Competencies.
The composition of the LP foreign-born group follows closely the age distribution of foreign-born in the total PIAAC sample (13%, 31%, 28%, 20%, 9%). The majority (57%) of the LP foreign-born group are in the prime working age band 25 to 44 years, reflecting the migration patterns. The composition differs from that of the native-born LP group, which is polarized with the largest proportions in the youngest and oldest categories.
Activity status for the native-born and foreign-born LP groups differs only slightly. Fifty-eight percent of the foreign-born LP group are in employment, 15% are in education, and 27% are not in employment. In the native-born LP group, 52% are in employment, 14% are in education, and 34% are not in employment. Not in employment includes the categories of unemployed, invalid, early pension, and so on. Interestingly, for the majority in both LP groups, low skills do not seem to have impeded participation in work or education.
Further Discussion and Response
This study compared the Norwegian results from tests of literacy and numeracy from two surveys of adult skills, ALL 2003 and PIAAC 2012. The comparison indicates a significant increase in the proportion of adults in the lowest performing categories and a significant decline in the proportion of adults in the high-performing categories, within the time period. This applies to both the native-born and foreign-born samples. Two particular groups, the youngest native-born and the foreign-born adults, have a significantly higher LP proportion in PIAAC than in ALL. The findings also indicate that the profile of the LP group has changed between the two surveys. Three groups now dominate the lowest performing category, the youngest and oldest deciles in the native-born sample and the foreign-born.
The trends identified in this article are somewhat surprising or even paradoxical given the Norwegian context. By applying the yardstick of performance on international surveys, it appears that the relatively large investment in improving basic skills in Norway seems so far to have reaped negative returns.
For policymakers there are two immediate concerns. First, the findings suggest that current education policy and the resulting initiatives set in place to improve basic skills may not be functioning optimally. Second, the trends might indicate a threat to the social democratic model, as these trends imply the possible exclusion of many adults from the future workforce, from further schooling and from full participation in the democratic society. More fundamentally, the trends conflict with Norwegian values, Norway prides itself on the egalitarian culture firmly established in work and society (Rasmussen, 2003), with a high literacy rate and a rich tradition of literacy development.
Is More Education Always the Answer?
A large proportion, between 40% and 50%, of the low-performing young adults, both native-born and foreign-born, were engaged in some form of formal education. One may wonder how these young people are occupied in these educational pursuits, if the level of basic skills is really so low. In the years between ALL and PIAAC, the two school reforms have increased the focus on developing basic skills, albeit in different ways. Reform 1997 emphasized the use of basic skills through cross-curricula projects, while the current Knowledge Promotion 2006 has an explicit focus on the development of basic competencies. In this period, the government has introduced national and international monitoring schemes to ensure the desired development. These initiatives are not peculiar to Norway.
In theory, basic schooling should equip young adults with basic skills in numeracy and literacy, but this and other research finds that schooling does not always live up to its reputation. Many young people, in school and fresh from school, have poor basic skills (Wagner, 2008; Windisch, 2015). Analysis of the PISA results shows that, at the age of 15 years many young people have problems with basic reading skills. This applies to Norway and to most other countries participating in the PISA survey (Rasmussen, 2003; Sulkunen, 2013). In reviewing the PISA results, Sulkunen (2013), pointing to lower standards in many countries and persistent inequities, claims that adolescent literacy requires urgent attention. She further suggests that literacy curricula should be ambitious rather than presenting a narrow view of literacy as basic skills. Teachers in the higher grades of early adolescence need support to develop discipline-oriented strategies rather than just generic reading strategies (Sulkunen, 2013). Similar arguments apply to the teaching of numeracy (Straesser, 2015). The Norwegian curriculum may have maintained a too narrow focus, fronting limited conceptual images of literacy and numeracy, thus failing in its ambitions. In addition, a growing body of research suggests that the introduction of international and national testing schemes in schools may affect the quality and nature of the broader learning experiences, by altering approaches to teaching and learning and to the structure and nature of curricula (Polesel, Dulfer, & Turnbull, 2012). Again, the monitoring schemes may have had the reverse effect than for which they were designed. On the other hand, Norway introduced two major school reforms in a short period and these reforms may not have not had time to work. Positive effects may emerge over time.
Nevertheless, the large proportion of low-performing young adults in formal schooling sends a clear challenge to schooling authorities to identify and assist these young people at an earlier stage. A preemptive strategy would entail investigating more closely mechanisms related to basic skill development within schools. Yearly national testing schemes could be replaced with four yearly schemes allowing schools time to reflect, develop, and introduce long-term programs. Sulkunen (2013) claims that such programs are the hallmark of successful school systems.
The profiles of the foreign-born LP group versus the native-born LP group are quite different with regard to age and education and somewhat different regarding employment status. The foreign-born LP group divides roughly into two groups, a larger group, around 60%, with more than 12 years of formal education, and a smaller group, around 17%, with less than 10 years of formal education. In contrast, the native-born LP group is polarized on the age variable, with very few of this group (3%) have less than 10 years of education, reflecting obligatory schooling in Norway. Many however, have less than 12 years of formal education. We suggest that there are strong arguments for providing separate interventions for foreign-born adults, adapted to their education level.
For foreign-born adults with more than 12 years of education, Norwegian language provision would appear to be an appropriate response, but as we have pointed out earlier, motivation to learn the Norwegian language may be weak. Clearly, lack of knowledge of the Norwegian language makes participation in the Norwegian society and in the Norwegian model of workplace organization, with its focus on symmetries in power and empowerment, difficult. Fundamental in the Norwegian model of workplace organization is the right of all workers to participate in decision-making processes. For these adults, the motivation to learn the Norwegian language may lie in learning more about Norwegian society and politics rather than in the basic skills education provided through the BKA program. The education provided through BKA suits the needs of the employers and relates to completion of workplace tasks rather than to building individual competence.
For those adults with less than 10 years of education perhaps we need to return to more fundamental discussions of empowerment and emancipation rather than reproducing formal schooling for adults, which has had limited success. Family literacy programs and programs offering contextualized and embedded literacy and numeracy provision have shown to be successful in other countries (Windisch, 2015).
A recurring finding in the literature is that those who benefit most from adult education programs are not the target group (Harteis, Billett, Goller, Rausch, & Seifreid, 2015; Merrill, 2004; Nordhaug, 1986; OECD, 2013a; Rinne & Kivinen, 1993). The analyses of trends in participation in the Norwegian BKA program discussed earlier in this article support this finding.
The prevailing rhetoric in adult education policy in Norway has been a “second chance” rhetoric (Rinne & Kivinen, 1993). Indeed, the recent government white paper addressing the need for adult education is titled “From Exclusion to New Chance” (Meld.St.16, 2016). Belzer and Pickard (2015) suggest that there lies an unconscious bias in written documents that refer to adult literacy learners and that this bias potentially influences and shapes action within the field. The phrase “from exclusion to new chance” implies that one has failed the first time and thereby excluded, but will now generously receive a new opportunity. Our findings indicate that most low-performing adults, young, old, and foreign-born, are presently included in society through engagement in either work or formal schooling. We do not know if these adults are exercising their full potential in employment or their full entitlement to participation in society. Perhaps it is time to drop this rhetoric, with its connotations and implications and offer opportunities for advancement in line with the aspirations of adults, respecting the competencies, which adults possess.
A dominate policy in basic schooling in Norway, dating back to 1920, is termed enhetsskolen, literally translated as “one school for all” (Gabrielsen & Turmo, 2013; Høigård & Ruge, 1971). Students from all social groups regardless of gender, intellectual capacity, geographical, and ethnic background receive the same education. This principle reflects the social democratic ideals. The same principle may be counterproductive in adult education. Recognized principles of adult education (Knowles & Bradford, 1952) recommend individualized approaches that acknowledge the unique stories, experiences, and needs of adult learners. Previous research has indicated that traditional approaches to schooling may not function (Hanemann, 2015).
Open online educational resources now offer greater potential with regard to flexibility, adaptability, and tempo. However, these have a threshold that will exclude adults at very low skill level (Castaño Muñoz, Redecker, Vuorikari, & Punie, 2013). This is an obvious avenue to pursue actively, perhaps particularly for the relatively well-educated foreign-born adults.
Conclusion
Studies of results from international tests often focus on identifying predicting variables. Certain variables, such as having a parent with a low level of education, being a foreigner, and employment status, predict performance. While awareness of likely predicting variables may allow for targeting and designing of preemptive strategies, such studies often serve to confirm and reinforce inequalities rather than improve the opportunities for individuals. By identifying trends over a 9-year period, our study has shown that long-term investment with particular strategies has not reaped the expected or desired results. We have also profiled the group of low-performing adults and demonstrated that the composition of the group changes over time.
We hope that the findings presented in this study stimulate discussion, reflection, and further empirical and conceptual research. Empirical research could investigate trends in other countries. Critical examination of the measuring instruments is important. These evaluations, however, do not directly assist adults who may be struggling. Studies that systematically review the effects of different initiatives will give useful knowledge for further design. More fundamentally, we need to reflect over the values and approaches that underpin policy.
Present adult education programs and the education system more generally may not be in concord with the goal of including all in the communities of the literate. In summary, we recommend that educational initiatives directed toward the low-performing group be more targeted and more dynamic, but perhaps more importantly that these are based on humanistic values that in turn support the social democratic model.
Footnotes
Declaration of Conflicting Interests
The author(s) declared no potential conflicts of interest with respect to the research, authorship, and/or publication of this article.
Funding
The author(s) disclosed receipt of the following financial support for the research, authorship, and/or publication of this article: This work was supported by the Research Council of Norway (Grant 228298/H20).