
Abstract
The purpose of the present study is to show that an independent group contingency (GC) combined with self-management strategies and randomized-reinforcer components can increase the amount of written work and active classroom responding in high school students. Three remedial reading classes and a total of 15 students participated in this study. Students used self-management strategies during independent reading time to increase the amount of writing in their reading logs. They used self-monitoring strategies to record whether or not they performed expected behaviors in class. A token economy using points and tickets was included in the GC to provide positive reinforcement for target responses. The results were analyzed through visual inspection of graphs and effect size computations and showed that the intervention increased the total amount of written words in the students’ reading logs and overall classroom and individual student academic engagement.
Self-management is the application of self-directed behavior strategies to change behaviors in a desired way (Cooper, Heron, & Heward, 2007). An individual uses these skills to achieve an identified goal. These skills are varied and include identifying the steps needed to achieve such goal (e.g., planning, organizing, evaluating outcomes, revising strategies). Self-monitoring is part of this self-management process and requires a person to observe and record self-data linked to the target behavior (Ackerman & Shapiro, 1984). For example, a student uses a self-monitoring strategy when recording on a piece of paper if a task was completed at the end of the day. Self-management including self-monitoring strategies are common and effective approaches to improve students’ classroom behaviors although procedures vary a great deal and students do not often engage in monitoring independently of teacher supervision (see review by Briesch & Chafouleas, 2009).
The use of self-management strategies in secondary schools is limited but generally has shown positive outcomes such as increased on-task behaviors and following directions (e.g., Blick & Test, 1987; Graham-Day, Gardner, & Hsin, 2010; Mitchem, Young, West, & Benyo, 2001). Self-management and specifically self-monitoring strategies have been used to increase a variety of desirable behaviors in secondary schools such as productivity rate, study behaviors, correct punctuation, attention given to appropriate behavior, and treatment integrity (Alfassi, 1998; Jitendra, Cole, Hoppes, & Wilson, 1998); improved accuracy and work completion (Shimabukuro, Prater, Jenkins, & Edelen-Smith, 1999); and reading comprehension and writing (Alfassi, 1998; McCallum et al., 2011).
For example, the use of worksheets with visual prompts (e.g., asking questions directly linked to what was read) has been used to increase written output and improve academic skills (Ives, 2007; Ives & Hoy, 2003). Crabtree, Alber-Morgan, and Konrad (2010) similarly used visual supports in the form of a three-prompt self-management strategy to increase the reading performance of three at-risk high school seniors. The students were described to have difficulties completing work and following directions, and were receiving daily remedial reading support. The self-management intervention included visual prompts on a worksheet used during independent work time. The worksheet had three sections, each section to be completed after a passage was read (“Stop 1,” “Stop 2,” “end”). Students used the worksheet prompts to complete written information about the story read. The results showed that the self-management intervention with the use of visual prompts increased the reading comprehension performance of all three students.
In summary, self-management, including self-monitoring strategies, has been found effective at changing behavior and increasing academic work in secondary schools. They have been used with positive results alone and in combination with other behavioral interventions (e.g., Blick & Test, 1987; Crabtree et al., 2010; McCallum et al., 2011).
Group Contingency (GC) Interventions
GC is another evidence-based intervention showing promising results for changing classroom problem behavior (Maggin, Johnson, Chafouleas, Ruberto, & Berggren, 2012; Stage & Quiroz, 1997; Theodore, Bray, Kehle, & DioGuardi, 2004). GC strategies refer to a variety of behavioral classroom interventions where one or several specified contingencies are applied to the same behavior from all students in a classroom (Cooper et al., 2007). The literature defines three different types of GC methods (Litow & Pumroy, 1975; Theodore et al., 2004). The first type is the independent GC method in which students earn incentives based on their individual behavior. A second type, the dependent GC, is when a group or team of students earns incentives based on the behavior of one student or a small subgroup within the team. Finally, interdependent GC is the method that requires all team members to behave in a specified way to reach a criterion to earn incentives (Tingstrom, Sterling-Turner, & Wilczynski, 2006). These methods are a particularly effective approach among classroom management techniques because they efficiently and simultaneously address many students’ behaviors (Cashwell, Skinner, & Smith, 2001; Embry, 2002; Theodore, Bray, Kehle, & Jensen, 2001; Thorne & Kamps, 2008). GC studies have targeted increases in desirable classroom behaviors such as (a) on-task behaviors using teams, goal setting, and awarding points for appropriate behaviors (Kamps et al., 2011; Wills et al., 2010); (b) positive verbal interactions by goal setting and rewards for increased statements (Hansen & Lignugaris-Kraft, 2005); and (c) decreasing problem behaviors such as talking-out and bothering classmates by using penalty points against teams engaging in disruptions (Davies & Witte, 2000).
Although the majority of the GC research has been conducted in elementary school settings (see review by Maggin et al., 2012), GC interventions have also been successfully used in secondary schools (e.g., Foley & Epstein, 1993; Malone & McLaughlin, 1997). Many of these studies targeted the reduction of problem behaviors (e.g., Christ & Christ, 2006; Schanding & Sterling-Turner, 2010; Theodore et al., 2004). GC studies in secondary schools have also focused on (a) increasing appropriate behaviors and performance including active classroom engagement and on-task behaviors (Christ & Christ, 2006; Williamson, Campbell-Whatley, & Lo, 2009); (b) accuracy in academic assignments and quizzes (Popkin & Skinner, 2003); and (c) social skills such as sharing ideas, keeping the group focused, asking questions, and praising (Lew, Mesch, Johnson, & Johnson, 1986).
GC Plus Self-Management
Limited studies have combined the use of GC intervention with self-management and self-monitoring in secondary school settings. Coogan, Kehle, Bray, and Chafouleas (2007) used a package intervention consisting of a GC procedure, peer feedback, and self-monitoring of problem behaviors (e.g., inappropriate touching, inappropriate vocalizations, physical aggression, making noises, out of seat). The percentage of intervals observed to have problem behaviors decreased during the intervention. However, only one classroom and five students participated in this study, students were relatively young (12 years old), the self-monitoring component was actually a procedure where the teacher prompted the student to mark the problem behavior every time it was observed, and all the target behaviors focused on reducing inappropriate responses. The study did not include key behaviors linked to academic success and high school completion such as academic work completion and active engagement (Hammond, Linton, Smink, & Drew, 2007).
In spite of positive outcomes, limited information is available regarding the use of GC in secondary classrooms. In addition, limited studies have combined use of self-management, including self-monitoring, and GC strategies as an intervention package to increase desirable classroom behaviors.
Purpose
The purpose of this study was to experimentally demonstrate the relationship between an intervention package, consisting of an independent GC plus self-management strategies, and the amount of written work and active engagement for high school students in remedial reading classes. The study answers the following questions: (a) To what extent does the GC plus self-management intervention package change the amount of written work in independent reading logs? and (b) To what extent does the GC plus self-management intervention package change the classwide active engagement during independent reading time?
Method
Setting and Materials
The present study was conducted at a high school in a small Midwestern university town. The school’s demographics were as follows: the total student population was 1,205 with 71.4% of the student population White, 12% Black, 4.4% Hispanic, and 12.3% reported to be of “Other” minority status. Males were 49.9% of the population, females comprised 50.1%. Economically disadvantaged students (students who qualify for free or reduced lunch under the National School Lunch Program) comprised 37.4% of the total population. English Language Learner (ELL) students comprised 5% of the population, 0% were reported to have a migrant status, and 18.3% were classified as students with disabilities. The attendance rate was 87.9%, graduation rate was 81.6%, and drop-out rate was 7%.
The study took place in three course sections of a reading class called “literacy workshop.” This course was the school’s Tier 2 instruction program, a remedial reading class that was designed to use best practices for students reading at least two grade levels behind their current grade when compared to national norms as determined by (a) the Rasch unIT score (RIT) obtained in the reading portion of the Measures of Academic Progress (MAP; Cronin, Dahlin, Durant, & Xiang, 2010; Hauser, 2003) and (b) the score obtained in the Scholastic Reading Inventory (SRI; Knutson, 2002, 2008). The MAP RIT is a curriculum scale that uses the individual item difficulty values to estimate student achievement. Advantages to the RIT Scale are that it can relate the numbers on the scale directly to the difficulty of items on the tests and it is equal interval. Each score falls in an equal interval so that the difference between scores is the same regardless of whether a student is at the top, bottom, or middle of the RIT scale. Each score has the same meaning regardless of grade level (Cronin et al., 2010; Hauser, 2003). A MAP RIT range of 195 to 220 (about one and one-half standard deviation below the ninth-grade mean) and/or an SRI Lexile score range of 700 to 1,000 (which is considered to fall at around the fifth-grade level) were the enrollment criteria for this course. These scores showed that students were able to decode words independently, and that their reading skills were considered to fall between the fifth- through seventh-grade levels.
The course sections were typically comprised of 5 to 15 students. The last 20 min of class consisted of independent silent reading. Each student read a book selected from books at his or her independent reading level. The teacher assisted students with their selection. Students were given some choice in selection to increase their book reading interest. The teacher evaluated the students’ book reading progress based on the students’ daily and weekly completion of a reading log (Allen, 2000). The reading log was a worksheet that included a template to write information about the passage read. The teacher used a rubric to score the reading logs (see procedures).
The students also had a weekly ticket sheet that listed the expected tasks or target behaviors, and a place to record points for behaviors. Each day of the week was displayed in a different column, with a total of 4 days per week (maximum number of classes a student attended per week).
Participants
The classroom teacher identified three out of her six classes that were in need of the intervention. All students in the identified classes were recruited for participation. However, 7 students were dropped out of the study due to not getting parental consent to participate or having excessive absences (more than 16 for the semester). Fifteen students, 12 females and 3 males, participated in the current study (five students in each class). Students were in Grades 10 and 11. Eleven had a diagnosis of learning disability, and 4 had no special-education diagnosis. Student demographic information is provided in Table 1. The teacher was a Caucasian female licensed as a reading specialist and English teacher with a master’s degree in education and 7 years of experience as an educator, 5 of those years as a literacy workshop teacher in this particular high school.
Student Demographic Information.
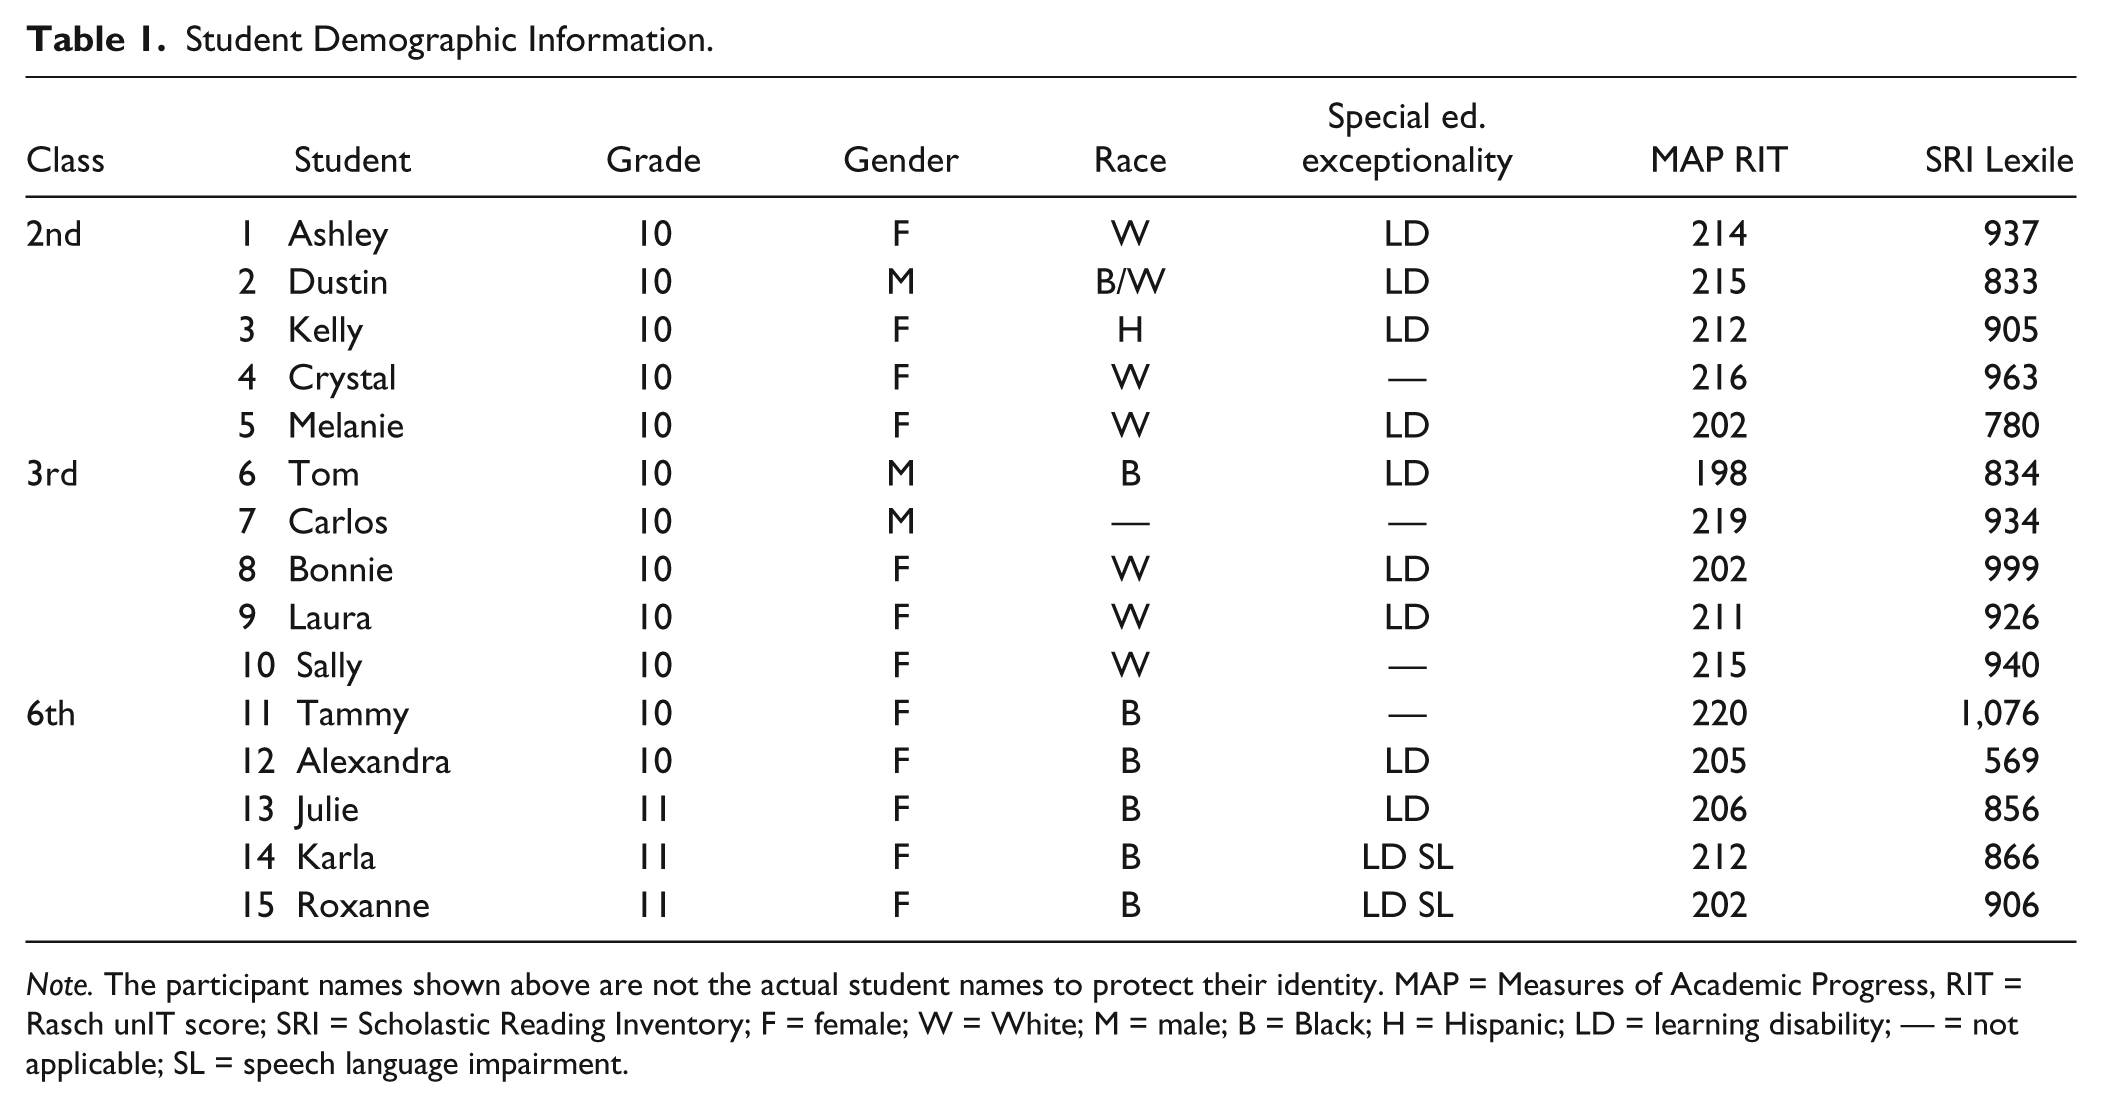
Note. The participant names shown above are not the actual student names to protect their identity. MAP = Measures of Academic Progress, RIT = Rasch unIT score; SRI = Scholastic Reading Inventory; F = female; W = White; M = male; B = Black; H = Hispanic; LD = learning disability; — = not applicable; SL = speech language impairment.
Dependent Variables
Total words written (TWW)
Students’ TWW in reading logs, including words written on sticky notes as part of their reading logs (Allen, 2000; Harvey & Goudvis, 2000) was the primary dependent variable. The teacher created the reading logs, which were worksheets that students used to write information about the book read. The reading logs were completed during independent reading time in class. The log had sections for students to write the date the entry was made, the title and author of the book read, page numbers read, and narrative information based on what they read using metacognitive strategies prompted with sentence starters such as “I’m wondering about X, I think that . . . ” and “I remember a time when Y, this tells me . . . ” (Allen, 2000; Harvey & Goudvis, 2000). The researcher scored the narrative portion of the reading logs, using the TWW procedures and format described by Powell-Smith and Shinn (2004). For example, every word was given 1 point regardless of spelling, including nonsense words. Morphemes were counted if they could stand alone when separated. Abbreviations and numbers were also counted.
Active engagement
Active engagement was the second dependent variable. It was defined as (a) reading aloud, (b) writing information that was related to what the teacher was presenting in class, (c) silent reading when the teacher asked the students to read (when it was observed that students were visually tracking written text and turning pages at a steady pace of about one page every 2 min), (d) answering questions that were related to what the teacher was presenting in class, and (e) talking about the topic. Absence of active engagement was defined as passively attending to tasks (e.g., listening, looking at the teacher or students during lesson, locating materials) and problem behaviors (e.g., disruptive, off-task behaviors, and off-topic comments). The focus of the study was on independent work time, so only observations that included independent work for at least 70% of the total duration of the observation were included in the data analysis.
Active engagement was measured using a 30-s momentary time sampling interval procedure (Cooper et al., 2007). Each student’s behavior was coded as active engagement “+” or no active engagement “−” at the end of every 30-s interval consecutively for 15 min total to obtain the student’s active engagement percent for that session. The session’s class mean was then computed by averaging the percentage of active engagement from the students observed. Class means have been used to document effects of group contingencies in multiple prior studies (e.g., Christ & Christ, 2006; Kamps et al., 2011).
Data Collection, Response Measurement, and Inter-Observer Agreement (IOA)
Each reading log entry was counted separately, so a weekly reading log had up to five TWW scores. Two graduate students were trained to score TWW. Training included verbal and written instructions regarding TWW definitions and data scoring and recording. The training continued until the reliability between the primary and secondary scorers was at least 90% or higher for at least three TWW scores. Scoring occurred at separate times and reliability scorers did not have access to the scores obtained by the primary scorer.
Four graduate students were trained as observers for active engagement. Training included verbal and written instructions regarding behavior definitions and data collection procedures. The training continued until the reliability between the primary and secondary observers was at least 90% or higher for at least three data sessions. Both observers viewed the classroom from the same position, but with data sheets out of view from each other. The primary observer quietly prompted the reliability person at each 30-s interval by starting with student number one (saying “one”), pausing for 2 s to observe and record, then saying student two and pausing, student three and pausing, and so on.
Reliability
For TWW, IOA for TWW was calculated by dividing the largest number of words by the smallest number of words as counted by the primary and secondary scorers and multiplied by 100. A reliability scorer was available to score TWW for an average of 40% of the reading log entries per student collected throughout the study. Reading log entries were randomly chosen for IOA scoring. The average IOA obtained for all students was 99.26%.
Reliability was computed for active engagement by using the “point by point” agreement method (Kennedy, 2005). That is, the observer calculating reliability looked at each cell independently (primary and secondary observer) to determine if there was an agreement (e.g., both observers coded “+” or “−”for the same cell) or disagreement (e.g., one observer coded “+” while the other observer coded “−”). IOA was calculated by dividing the number of scoring agreements by the number of agreements plus disagreements, and multiplying by 100. A second (reliability) observer was available for an average of 56% of all the observation sessions completed throughout all phases of the study. The second observer’s availability was different from week to week depending on factors outside this current study (e.g., academic demands). The average IOA obtained for all three classrooms was 98.4% (range: 98.11%–98.61%).
Social Validity
The teacher and students completed social validity surveys to gather information regarding the extent to which the intervention was perceived as valuable and effective in the classroom (Horner et al., 2005; Wolf, 1978). The teacher survey included 16 items answered using a 5-point Likert scale (1 = no familiarity/unacceptable/difficult/not very effective, 5 = high familiarity/acceptable/easy/effective), and three open-ended questions regarding the components of the intervention that she liked and disliked as well as suggestions for future implementation. Sample items included “How familiar were you with the components of this intervention before using them in the classroom?” “How satisfied are you with the training received?” “How satisfied are you with the support received?” “To what extent were the procedures easy to learn?” and “How effective do you feel the intervention was?” A higher rating meant higher acceptability. Questions were similar to prior GC social validity measures (Kamps et al., 2011).
The student questionnaire included 12 items using a 3-point Likert scale (1 = no/not at all, 2 = okay/all right, 3= yes/a lot). A higher rating meant higher acceptability. Sample items included “I liked the self-management strategy using the timers during reading logs,” “I liked earning points and tickets in my classroom,” “It was easy to do what I needed to do in order to earn tickets and reinforcers,” “I liked earning reinforcers,” and “I felt motivated to complete my work.”
Procedures
Prior to baseline and data collection, four 30-min meetings between the researcher and the teacher and five 1-hr classroom observations were completed to gather information to identify the target behaviors for the primary dependent variables, amount of writing, and classroom active engagement.
Baseline
During the baseline condition, the classroom was not altered in any way and was considered “business as usual.” Apart from verbal praise, no programmed incentives or other behavioral consequences were provided if the students followed expectations. The teacher typically walked around the classroom during instruction to monitor behavior and give feedback. The teacher verbally prompted students to start working if they did not do so immediately after instructions were given. The teacher asked students to step outside the classroom for a private talk and/or sent students to the main office if they were non-compliant with directions, nonresponsive to the verbal prompts, and/or disruptive (e.g., yelling, throwing materials to the table or floor, using foul language).
The teacher was awarding grade points for completion of the reading logs. A total of 25 points were possible for completing the entire reading log each week, 0 to 5 points per row or reading entry, and five rows included in every weekly reading log. To earn 5 points, students needed to write three or more sentences within the same reading log entry that showed the use of at least two sentence starters provided in the reading log. Four points were given to two sentences, 3 points for one sentence written using the sentence starters. Two points were given for multiple sentences about the story that did not use the sentence starters (story facts). One point was given for a single sentence not included as a sentence starter. Zero points were given to statements that made no sense or that lacked information to show that the book was read. Independent reading log completion accounted for the biggest portion of the final grade (at least 26%).
Once target behaviors were identified, observations were conducted during independent silent reading time in all three classes of the literacy workshop course during baseline. The teacher was informed when the observers were scheduled to watch the classroom to collect data on the students’ behaviors. Baseline data collection continued until the data indicated that classwide active engagement and reading log TWW were relatively stable or moving in the opposite direction of what was expected from intervention. A minimum of three observations per class section were collected during baseline (each class period lasted approximately 50 min and each observation 15 min).
Classwide GC plus self-management intervention
The first component of the intervention was the use of a self-monitoring strategy for task completion through the students’ completion of the ticket sheet. Throughout each class period, students recorded a point (e.g., tally) on their individual ticket sheet as each of the five tasks listed was completed: (a) retrieving the student binder and filling out the daily planner within the first 3 min of class, (b) writing notes and completing assignments during the first half of the class, (c) writing notes and completing assignments during the second half of the class, (d) reading and completing a reading log entry in class, and (e) completing a full weekly reading log with four different entries. Students could record (earn) up to 4 points daily and 5 on the last day each week. The classroom had a poster on the wall listing the target behaviors. The teacher identified these target behaviors as the most problematic ones affecting students’ grades (e.g., failure to complete reading logs could result in at least 26% decrease in the student’s final grade). The teacher verified students monitoring of task completed through reviews of permanent products (e.g., student wrote on the planner, notes were taken during class, reading logs were completed). Each point was exchanged for a ticket. The primary investigator trained the teacher to show no emotional reaction and provide clear and brief behavioral information when the teacher disagreed with the student’s points (e.g., when the student recorded the completion of a task that was not actually completed). The weekly ticket sheet was placed in each of the student’s binder. The students’ binders were kept in the classroom during and after class.
The second component of the intervention was the use of self-management supports in the form of visualization notes and silent timers for writing in reading logs. These supports occurred concurrently with the independent GC plus self-management procedures. During the 20 min of independent reading time, each student set a silent timer to vibrate every 6 min (e.g., timer was set three times for a total of 18 min of silent reading). When the timer vibrated, the student was to stop reading and write information from the book read during the last 6 min on sticky notes or in the designated section of their reading log (e.g., “Stop 1,” “Stop 2,” or “end”).
The third and final component of the intervention was the classwide independent GC strategy. The teacher chose the independent GC over the dependent and interdependent GC options to maximize each student’s potential for individual success. The GC consisted of classwide exchange of tickets earned for prizes (see self-monitoring description). Tickets were exchanged for rewards based on individual student performance. The students and teacher developed a list of possible rewards or prizes. The teacher chose the amount of tickets needed to earn these rewards. Five tickets were needed for a small reward (e.g., bag of chips, candy bar, Gatorade), 10 tickets for a medium reward (e.g., a bag of chips plus a Gatorade), and 12 tickets were needed for a large reward (e.g., three small reward or a fast-food restaurant coupon). Students had the choice of cashing their tickets for a reward at the end of class or “banking” the tickets for a larger reward at a later date.
As part of the independent GC strategy mentioned above (e.g., students earning tickets exchangeable for rewards when emitting target behaviors), the teacher used a lottery system to raffle additional rewards. Names of the students who were earning tickets for each day were entered in the lottery by placing their names on pieces of paper in a plastic container. This gave the opportunity for students who were receiving tickets to cash them for a prize and to also participate in the raffle. The teacher randomly chose pieces of paper with names of students from this container to earn additional rewards. The teacher used this lottery system to raffle three prizes during the day that the raffle took place for a total of five different days in each course section chosen randomly throughout the semester (e.g., one raffle every week or every other week).
During intervention, the students continued to earn up to 5 points per day for completion of their reading logs. These points did not contribute to earning rewards, but continued to count toward their grade.
Training procedures
The primary investigator met with the teacher in the teacher’s classroom for 45 min during the teacher’s planning time to discuss the main components of the present study. The teacher received information about the target behaviors identified for improvement (i.e., active engagement and written products) as well as the interventions to be introduced in the classrooms: independent GC plus self-management. They discussed the materials needed for the intervention, including the use of timers and visual supports to ensure that students increased their written work. The primary investigator provided the teacher with verbal and written information regarding the intervention, the experimental design, and the procedures in place to implement and withdraw the interventions. The teacher had the opportunity to ask questions throughout this meeting.
After baseline data were collected, the primary investigator and teacher met with the students during class time to introduce the intervention package using a script. The teacher explained that students would receive tickets for completing expected tasks during each class period. The teacher gave the students the reading logs and explained the rules and expectations to earn points. They discussed examples of good reading logs. The teacher also demonstrated the use of timers to remind students to stop reading when the timer vibrated and start writing in reading logs. The students practiced using the timers. The teacher introduced the ticket sheet and explained to the students that points tallied were exchanged for reinforcers. Students were told that they were expected to monitor their own behavior throughout the class period, making a tally each time a task was completed, and that the teacher would verify the accuracy of the points that each student awarded to himself/herself by signing on the sheet and, if accurate, exchanging the points for tickets to be exchanged for reinforcers. The teacher discussed the use of reinforcers and the number of tickets required to earn them. The students had the opportunity to ask questions and provide suggestions for possible rewards.
Procedural Fidelity
An 11-item checklist was used to measure the GC plus self-management procedural fidelity. The checklist was modified from fidelity checklists used in prior GC studies (Kamps et al., 2011). Sample items included “target behavior definitions are visually displayed for students to see,” “points were recorded in the weekly ticket sheet,” “points were tallied and verified by teacher,” “the timers were set at 6-min intervals and used during silent reading,” and so on. The procedural checklist score was recorded by the research observers and calculated by dividing the number of “yes” items by 11 (the total number of items). Procedural fidelity was recorded for an average of 73% of all the classroom observations completed. The average procedural fidelity scores obtained were 100% during the initial introduction of the intervention and 100% during reintroduction of the intervention. No items were observed during the baseline and withdrawal phases.
Experimental Design
The present study used an ABAB/withdrawal design to make comparisons between baseline and the classwide independent GC plus self-management intervention (Kennedy, 2005). Two dependent variables were measured: individual student’s TWW on reading logs, and percentage of classwide and individual student active engagement. The primary investigator analyzed TWW scores data from all students to make decisions on when the experimental conditions needed to change. The TWW data was chosen for these experimental condition decisions as it showed greater stability across students over time.
Data Analysis
The primary method of data analysis was visual inspection of the data plotted on graphs. During and after the study, the data were analyzed within and between conditions. Within phase patterns were analyzed to identify changes in level, trend, and variability patterns. Immediacy of effect and any data overlap were visually inspected from one condition to another to determine the functional relation of the intervention and dependent variables. Effect sizes were calculated as a secondary method of data analysis using the “Approach One: No Assumptions” model from Busk and Serlin (1992); the average of the two intervention means was subtracted from the average of the two baseline means and the difference was divided by the standard deviation of the initial baseline (Dunst, Hamby, & Trivette, 2004; Olive & Smith, 2005).
Results
The GC plus self-management intervention implemented in this study increased the students’ amount of written work completed in independent reading logs and classwide and individual student active engagement during independent reading time. Findings for each outcome are presented in the following sections.
TWW
Reading log TWW results were depicted numerically in Table 2 and graphically in Figures 1 and 2. These TWW results were based on data from completed reading logs that students gave to the teacher. The data showed no zero scores because the students did not give the teacher “blank” reading logs (reading logs with no writing from the student on them). The TWW scores for all three classes went from a mean of 24.19 during baseline (range: 8–62), to a mean of 55.34 (range: 22–106) during the initial implementation of the intervention. The TWW scores mean decreased to 21.8 (range: 8–40) when the implementation was withdrawn, but increased to a mean of 57.82 (range: 26–89) when the intervention was reinstated.
TWW Scores Per Student: Means, Ranges, Standard Deviations.
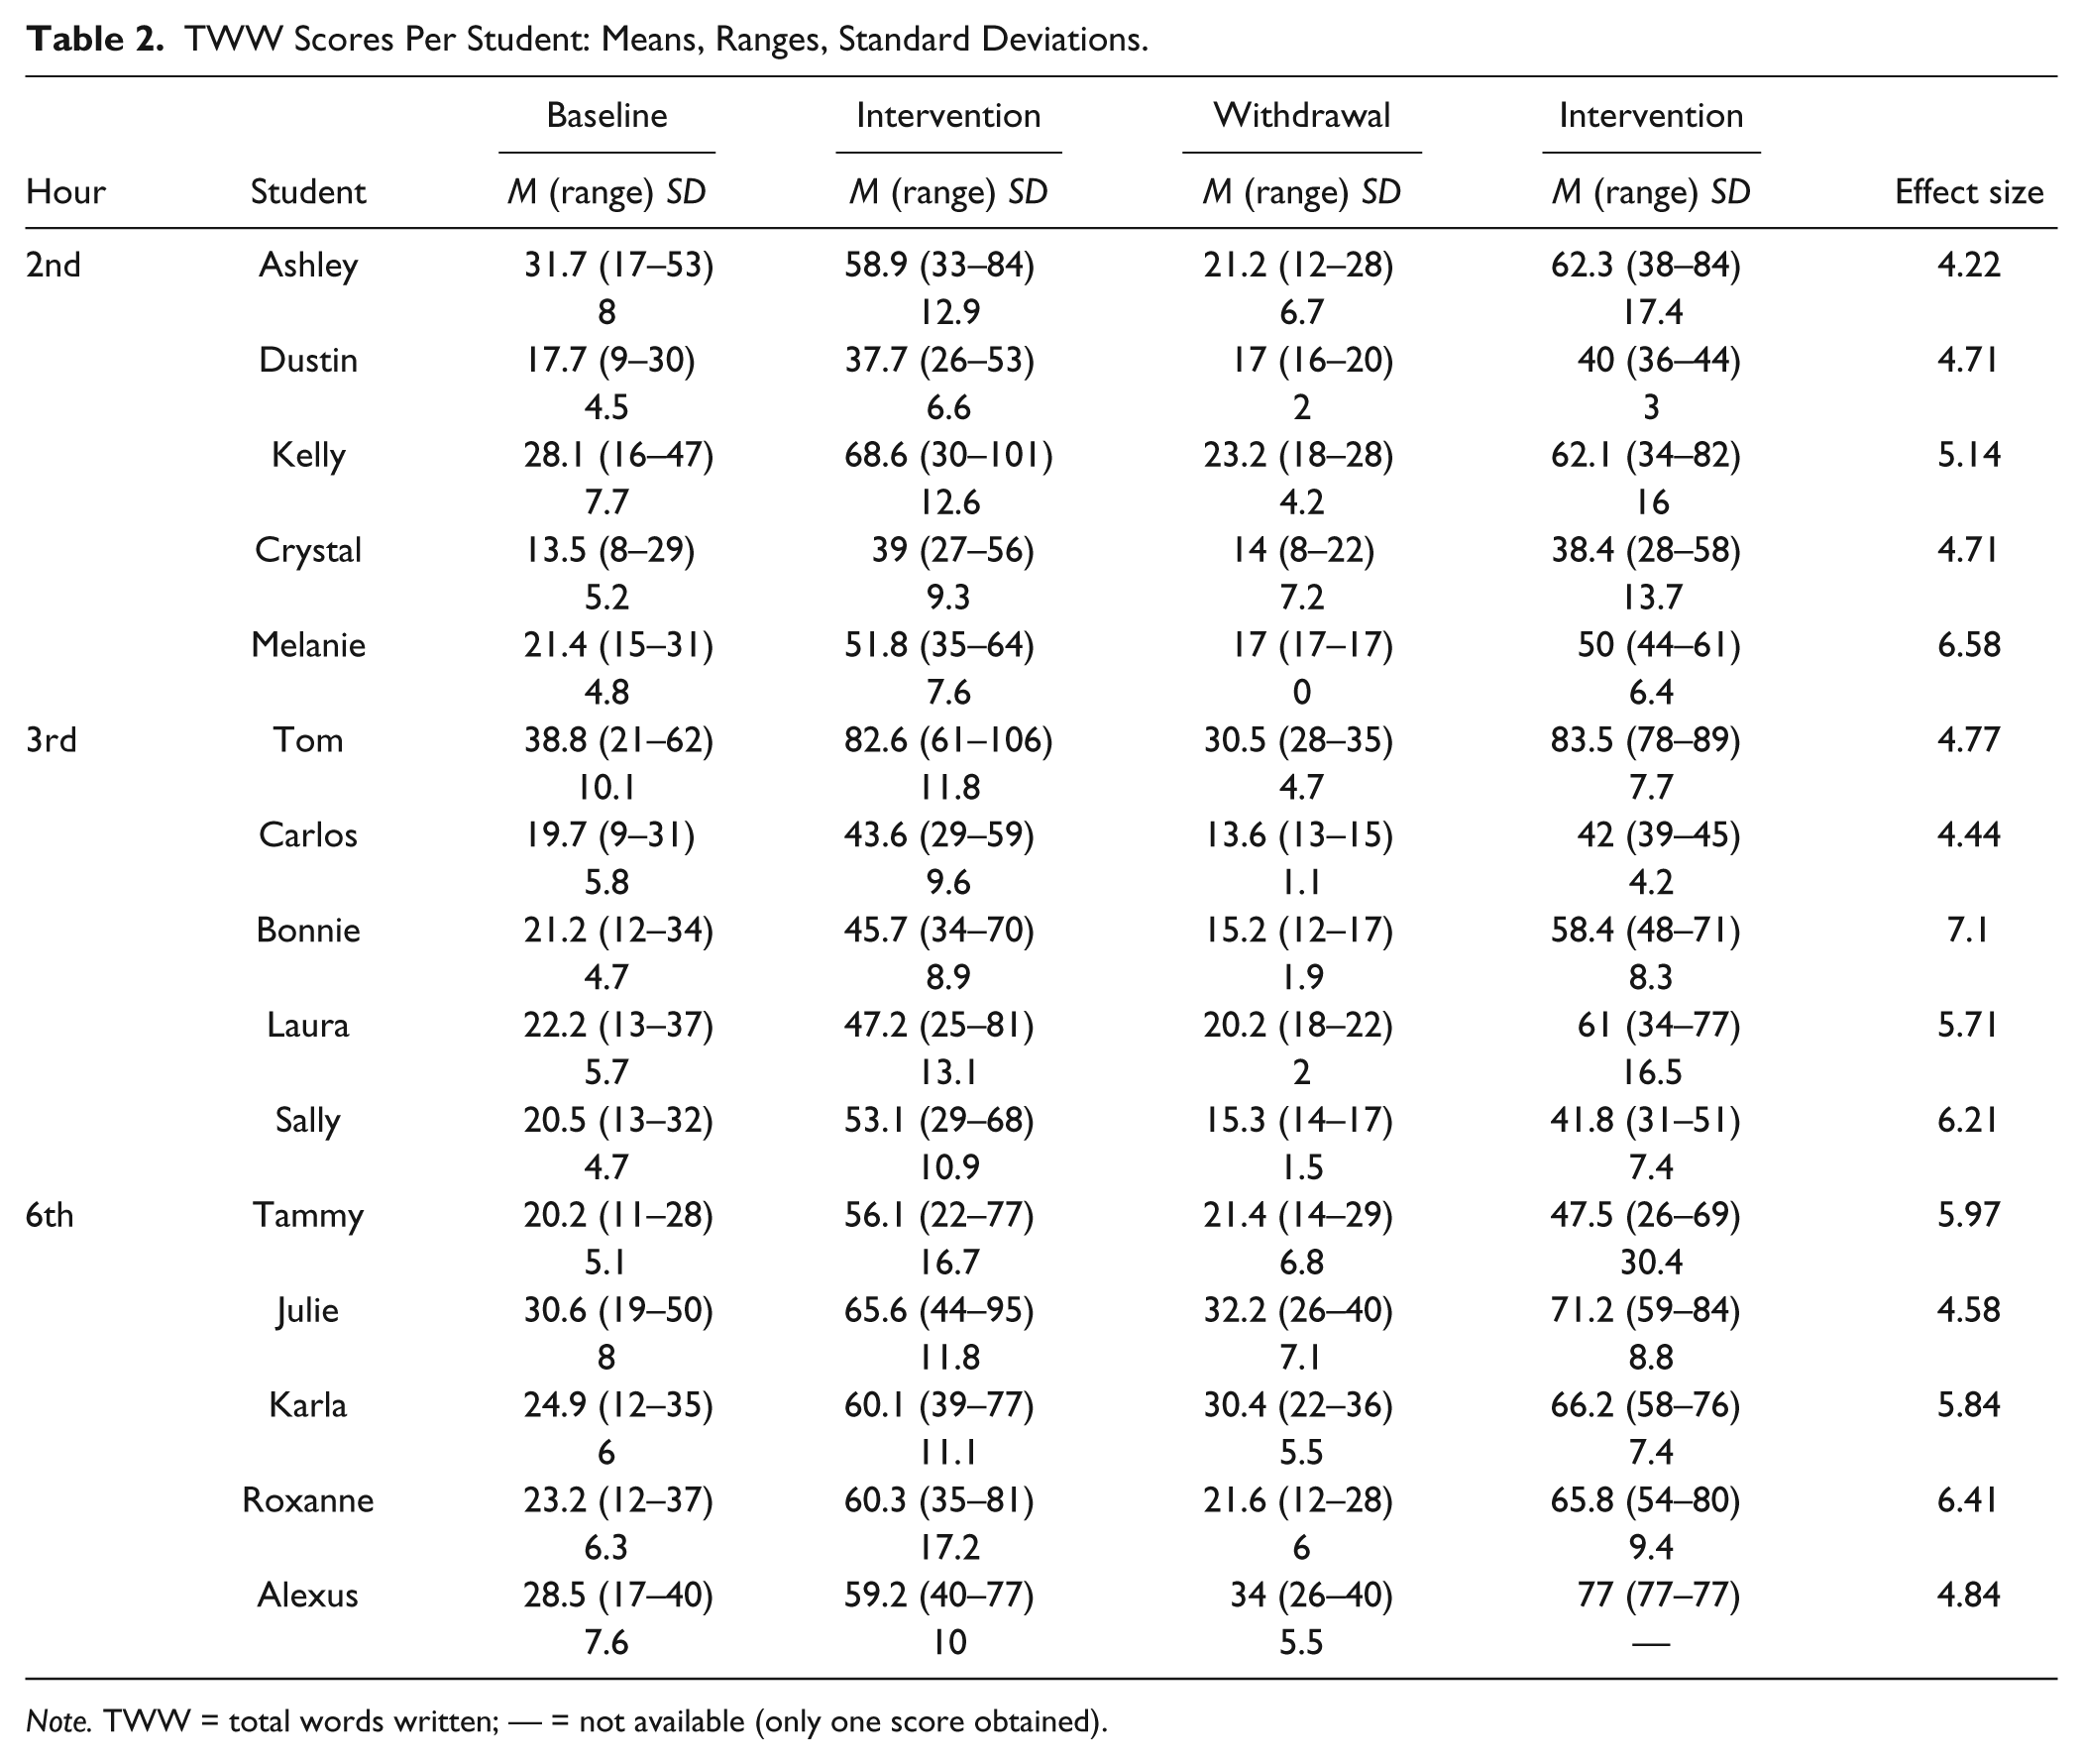
Note. TWW = total words written; — = not available (only one score obtained).

TWW Scores for Ashley, Dustin; Kelly, Crystal; Melanie, Tom; Carlos, Bonnie.
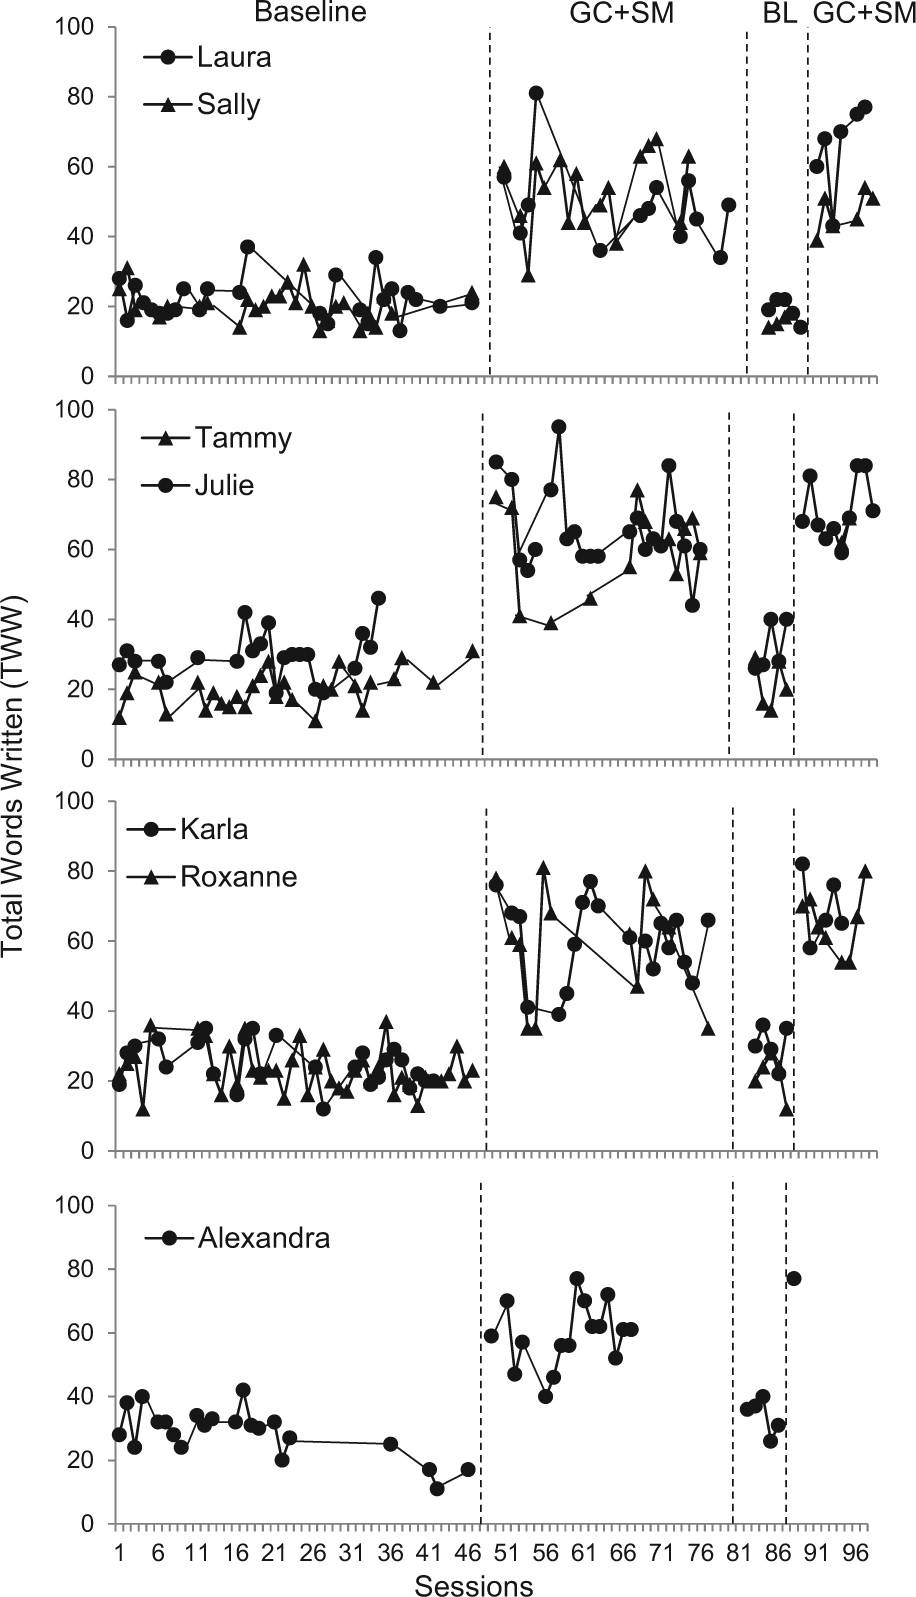
TWW Scores for Laura, Sally; Tammy, Julie; Karla, Roxanne; and Alexandra.
Visual inspection of the graphic data in Figures 1 and 2 also revealed that all the students’ levels of TWW scores were lower during the baseline and withdrawal conditions when compared with intervention levels. Most students showed only 1 or 2 overlapping data points between baseline and intervention. All students’ scores however showed variability in scores within and between conditions. Tom, Kelly, and Ashley showed the most variability, especially during the intervention conditions. For example, Ashley’s baseline scores had a slight upward trend during baseline, an increase during initial intervention that trended downward but then went back up again. Her scores’ trend went up again during the reintroduction of the intervention. Interestingly enough, other students such as Kelly and Bonnie showed a downward trend during the reintroduction of the intervention.
Student means were calculated to show overall levels by condition to account for the variability observed in the graphic data. For example, Ashley’s TWW mean during baseline was 31 (range: 17–53). Her TWW increased to a mean of 58 (range: 33–84) when the GC plus self-management intervention was implemented. The withdrawal of the intervention produced decreases in her TWW mean to 21 (range: 12–28), and a reintroduction to the intervention increased TWW to a mean of 62 (range: 28–84). Laura, a student from third hour (Figure 2), showed similar results. Her TWW mean during baseline was 22 (range: 13–37), which increased to a mean of 47 during the first introduction of the GC plus self-management intervention, decreased to a mean of 20 during withdrawal, and increased again to a mean of 61 during the reintroduction of the intervention. Effect sizes based on TWW scores are depicted in Table 2. All students showed large effect sizes, with the greatest scores noted for Bonnie, Melanie, and Roxanne (7.1, 6.58, and 6.41, respectively).
Active Engagement
Active engagement was presented in Figure 3 (classwide) and Table 3 (individual students). Visual inspection of the data revealed increasingly higher active engagement for all three classrooms when the intervention was in place when compared with the baseline and withdrawal conditions. For example, the second-hour class’ active engagement mean was 67% during baseline (range: 38%–88%), increasing to a mean of 84% (range: 61%–99%) during the initial introduction of the intervention, decreasing to 62% (range: 33%–86%) during the withdrawal of the intervention, and increasing again to 80% (range: 31%–100%) during the reintroduction of the intervention. Third-hour class’ active engagement mean was 64%, 87%, 77%, and 80% respectively across conditions. Finally, sixth-hour class’ active engagement mean was 56%, 78%, 58%, and 68% respectively across conditions. Although all classes showed upward trends in engagement during intervention, variability was noted especially for second and sixth hours.
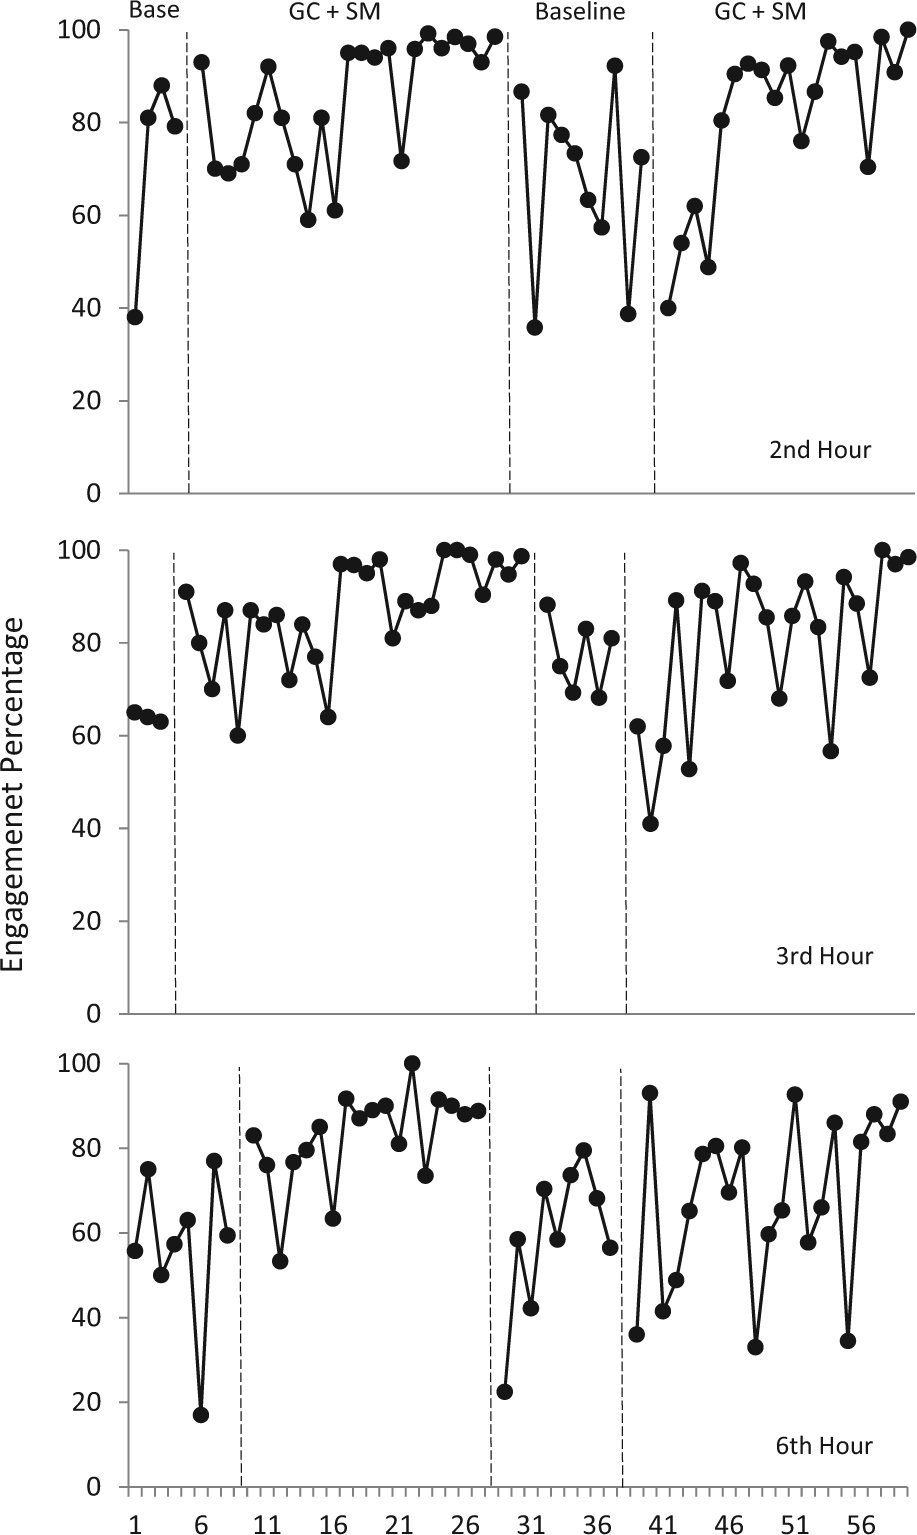
Mean percentage of active responding for the second-, third-, and sixth-hour classes across conditions.
Active Engagement for Individual Students: Means, Ranges, Standard Deviations.
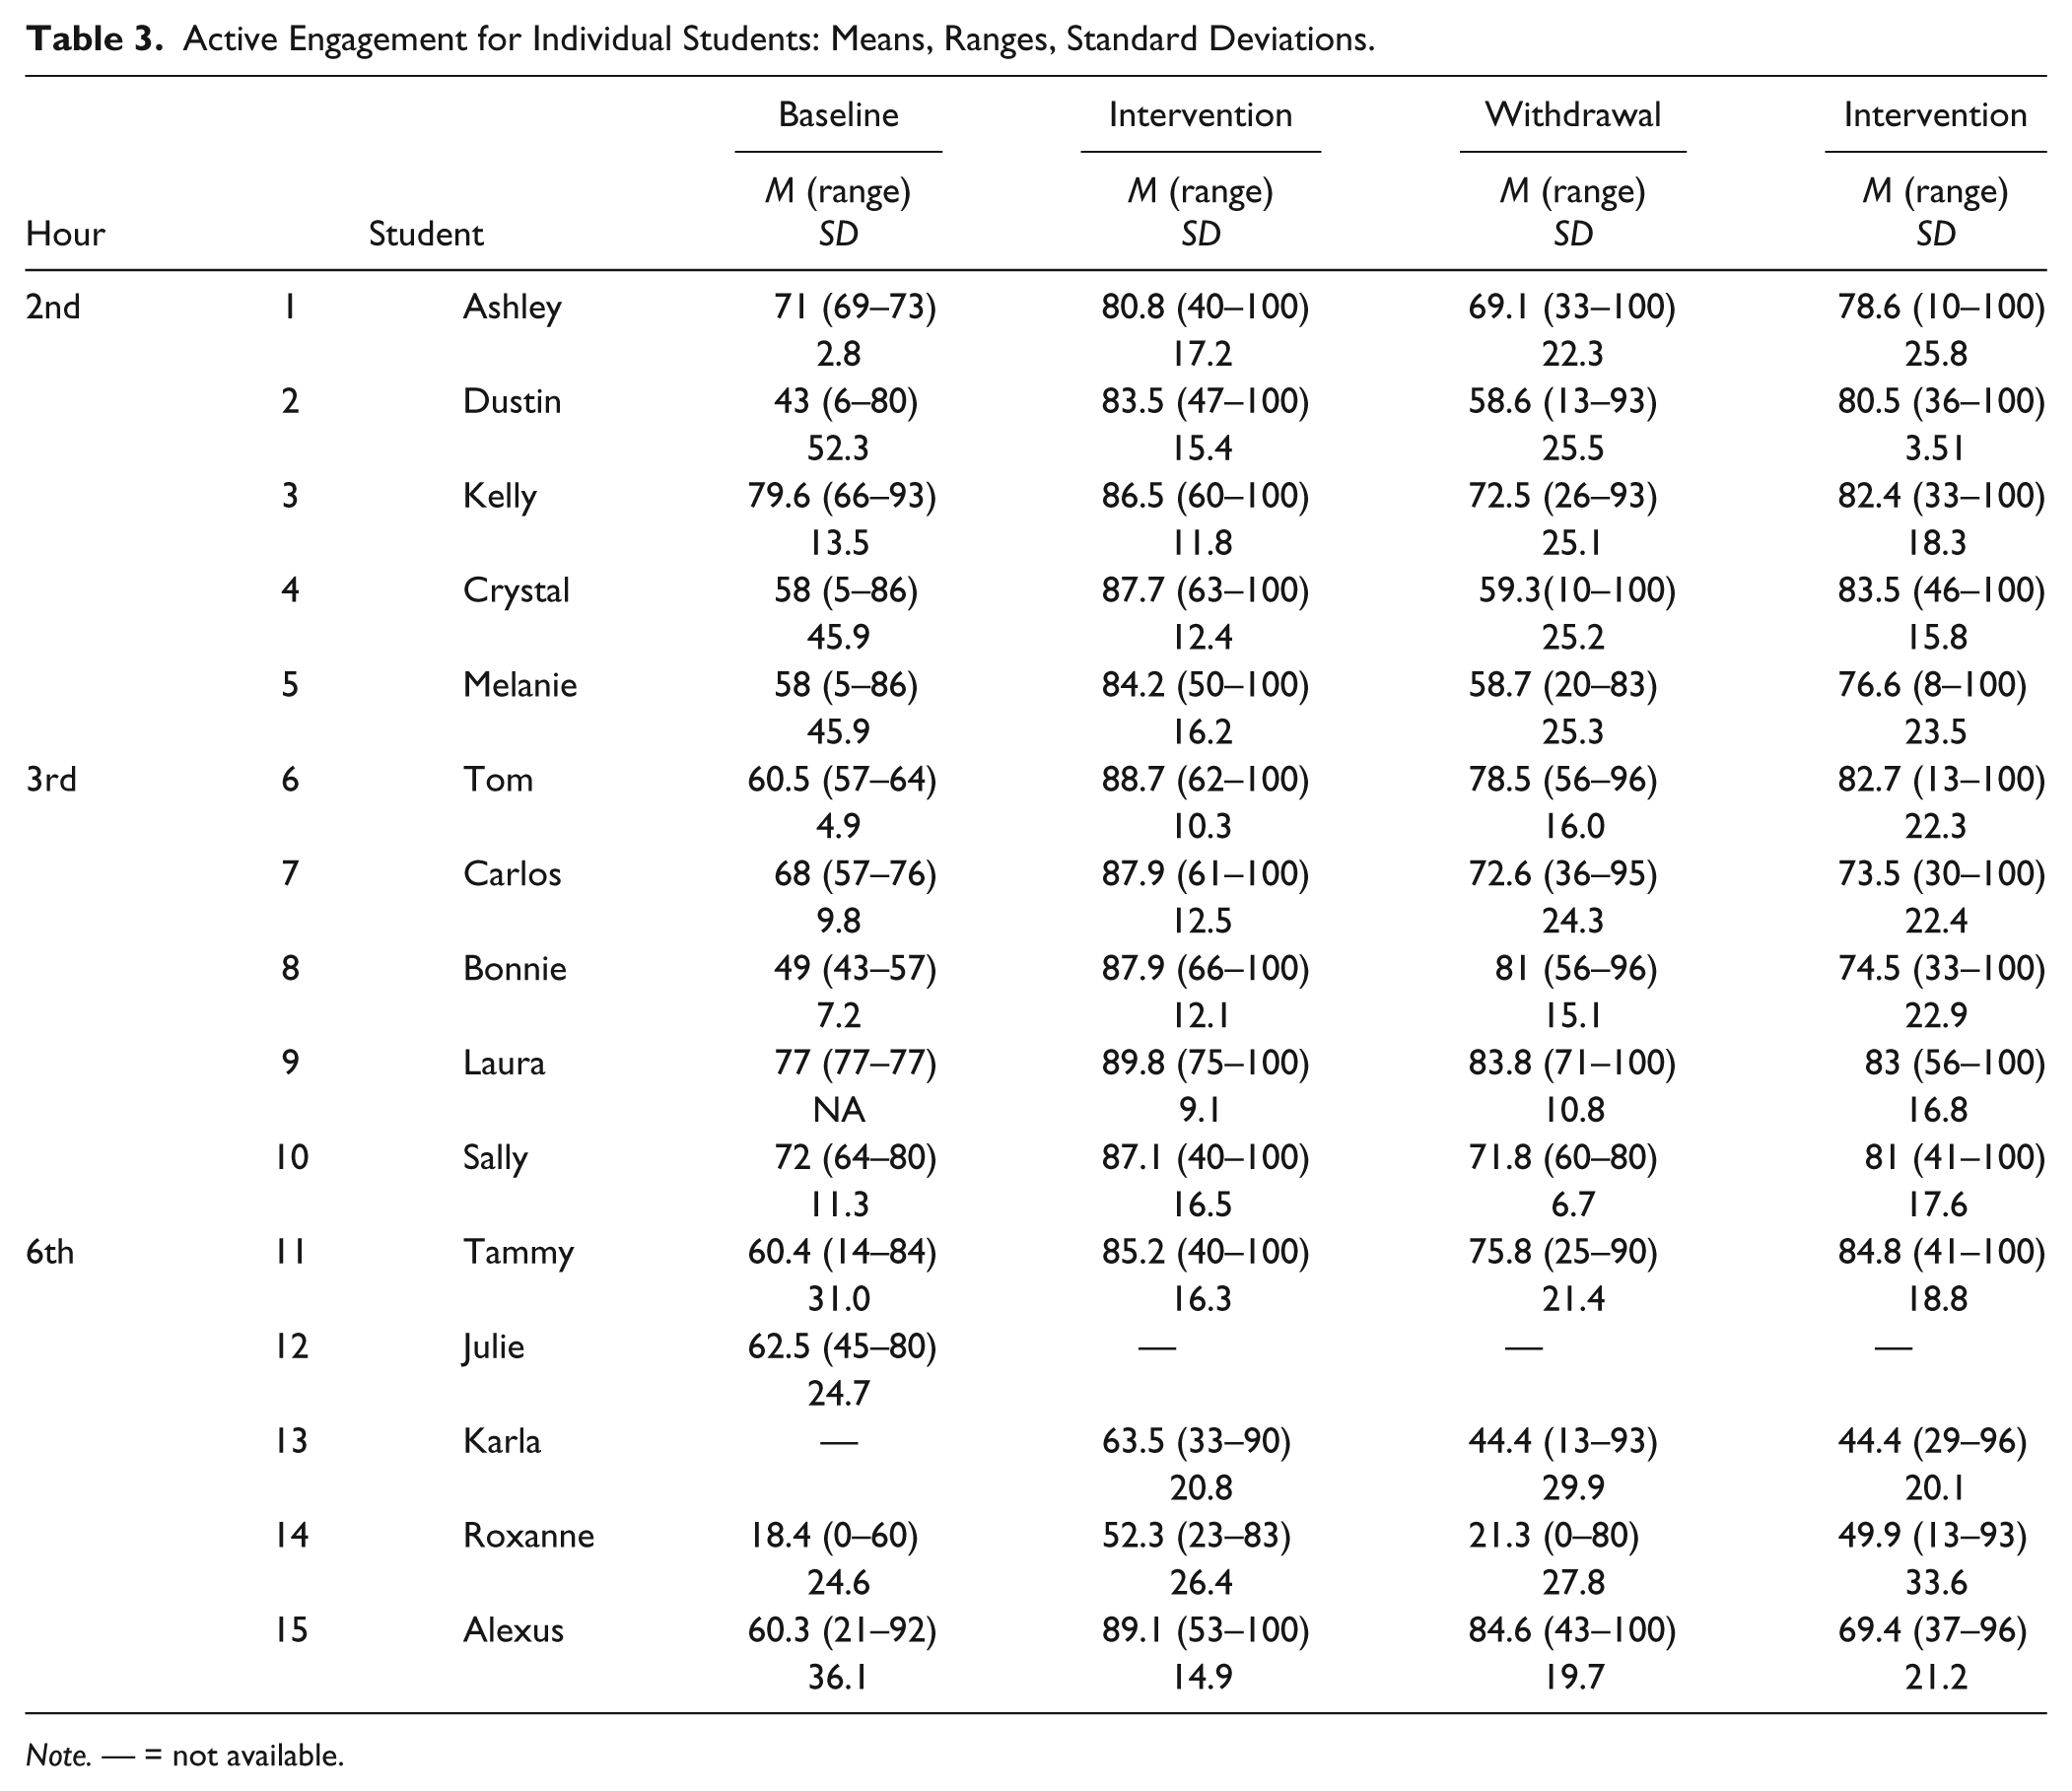
Note. — = not available.
Effect sizes calculated using the same procedure as TWW scores (Busk & Serlin, 1992) were 0.67, 13.05, and 0.86 for second, third, and sixth hours, respectively. It is important to note that third hour results should be interpreted with caution. The inflated effect size score obtained from third hour resulted from the lack of active engagement scores’ variability during the initial baseline (scores of 65%, 64%, and 63%; SD = 1) when compared with the highly variable scores obtained for second hour (SD = 26.33) and sixth hour (SD = 18.57).
Individual students’ engagement means are presented in Table 3. These confirm increased engagement for most students during use of GC plus self-management. Three of the students (Kelly, Crystal, and Laura), however, had fairly high baseline engagement. Withdrawal of intervention did result in a notable decrease for Crystal and slight decreases for Kelly and Laura. Two students’ engagement levels did not decrease or return to baseline levels with the withdrawal condition (Tom and Alexandra), and thus a functional relation was not established between the intervention and their active engagement.
Social Validity
Results from the teacher social validity scale showed that the teacher was not familiar with the components of the intervention (e.g., GC plus self-management) before using it in the classroom, but reported high familiarity with the components of the intervention at the conclusion of the study, with an overall rating of 3.9. She indicated the intervention was neither hard nor easy to implement, and that the procedures were very easy to learn. The intervention required little preparation time and very little time during instruction. She felt the intervention was effective, and that students frequently increased their on-task behavior and improved their work completion and reading skills during the intervention. The teacher reported that she is very likely to use the different components of the intervention on an individual basis in the future and she is also likely to recommend the intervention to a colleague. The things she liked the most about the intervention included the following: the students’ responsibility to track their own behaviors, use of timers, the immediate feedback students received when they were recording their own behaviors to earn tickets, and the teacher’s ability to verify points and award tickets. She indicated that it was a time-consuming process to check points and provide rewards; however, it gave her some tools to use with students that display difficult behaviors.
Overall, students reported satisfaction with the intervention implemented and felt like their academic performance increased as a result of it. Their average overall rating was 2.5 on a scale of 1 to 3 scoring. All students reported they liked earning tickets and rewards, and it was easy to learn the rules. Ninety-three percent of the students reported to feel motivated to complete work, and 92% reported that they followed more directions, stayed on-task more, and completed more work when tickets were awarded. Eighty-three percent of students reported that their writing increased when the self-management timer procedure was in place, and 79% reported they liked the procedure.
Discussion
The current GC plus self-management intervention package increased the target primary dependent variables, the TWW in reading logs, and the overall class active engagement. The intervention package consisted of an independent GC with students earning points and rewards for completion of reading activities in class plus self-management strategies such as the student’s use of a timer and visual prompts, and students’ monitoring of their task completion.
Increased TWW
A primary finding of the study is the functional relation between the GC plus self-management and increase in the number of TWW in students’ reading logs. This concurs with prior self-management studies showing improvements in work completion and on-task behavior for secondary students (Alfassi, 1998; Mitchem et al., 2001; Shimabukuro et al., 1999). Findings also concur with improved behaviors using GC interventions and combined GC plus self-management with secondary students (Christ & Christ, 2006; Coogan et al., 2007; Williamson et al., 2009). Several variables related to the intervention may have contributed to this outcome. First, students were rewarded for being organized with assignments and materials. Students reported whether they performed specific responses outlined in their weekly ticket sheet. These responses were discrete behaviors such as collecting their binder, writing in their planner, writing notes, and writing in their reading logs. The teacher was trained to verify if the behaviors were completed and how to respond when discrepancies arose between the student’s report and teacher’s observations. Accuracy of student responding was not documented and analyzed in the current study; however, past studies have indicated that participants are fairly accurate when reporting discrete behaviors (e.g., Ackerman & Shapiro, 1984). A limited number of studies report secondary students’ use of rating scales and rubrics to monitor their own behavior (e.g., Foley & Epstein, 1993; Mitchem et al., 2001; Peterson, Young, West, & Peterson, 1999). Second, students were able to provide more frequent responses with the use of self-monitoring within the self-management strategies as the timers were set a total of three times (“Stop 1,” “Stop 2,” “end”) to prompt students to stop reading and write answers linked to the story, instead of the general teacher prompt they had prior to the intervention. Dividing tasks into smaller chunks for quick and frequent responding has been documented as an effective strategy to increase response proficiency and skill acquisition (e.g., Porritt, Van Wagner, & Poling, 2009; Rhymer, Skinner, Henington, D’Reaux, & Sims, 1998). Breaking down the instruction into smaller segments has also been documented in the reading comprehension literature to increase students’ use of study strategies, comprehension of text, and test scores in content areas (e.g., Belfiore, Skinner, & Ferkis, 1995; Harvey & Goudvis, 2000; Worsdell et al., 2005).
A review of studies that have used TWW was completed to determine to what extent the TWW scores showed significant increases. However, the TWW scoring method reported in these prior studies required the use of timed written samples (e.g., Gansle et al., 2004; Jewell & Malecki, 2005). Effect sizes calculated for TWW scores in the study supported a strong effect for the GC plus self-management intervention. Further interpretation of the findings was made by comparing these effect sizes to the ones reported in previous studies. For example, using a variety of statistical methods, Stage and Quiroz’s (1997) meta-analytic study reported an average effect size of 0.9 for all studies analyzed, including the ones that provided a combination of interventions. Davies and Witte (2000) also used a different method for calculating effect sizes and reported an effect size of 2.16 in their peer feedback plus self-management interdependent GC study. In their randomized GC studies and using the same approach as the one presented in this study, Theodore et al. (2004) reported an effect size of 2.13, and Theodore et al. (2001) reported an effect size of 4.1. Coogan et al. (2007) also used the same method (Busk & Serlin, 1992) and reported an average of 1.8 effect size for the 5 participants in their study.
Increased Active Engagement
Improvements in active engagement in the current study are consistent with other studies showing improved engagement using GC interventions (e.g., Christ & Christ, 2006; Williamson et al., 2009). An important finding in this study was the precise measure of “active engagement” (e.g., reading, answering questions) rather than general on-task behavior as is commonly recorded that includes passive attending behaviors such as listening to teacher lectures. With implementation of intervention, all classes showed increased active engagement; however, the mean percentage of active engagement during the reintroduction of the intervention did not reach the scores initially obtained during the initial intervention condition. For example, second hour’s mean percentage of active engagement was 84% during the initial intervention and 80% during the reintroduction of the intervention; sixth hour’s was 78% during the initial intervention and 68% during the reintroduction. One possible explanation for this phenomenon was that students were aware that a “new procedure” was going to be introduced as the teacher presented the ticket system to them right before the initial intervention was implemented. Students were observed to ask about the tickets and make comments about how pleased they were that incentives were being offered. In contrast, during the final intervention phase, students were observed to comment on demands from other classes and were not observed to make as many positive comments about the incentives. In addition, it was also closer to the end of the school year which may have influenced their performance. In spite of these drops in engagement overall in third- and sixth-hour classes, all students’ TWW levels remained equal to levels during the first intervention phase. When reviewing individual engagement (Table 3), all 15 students increased engagement with intervention, with some variability. Effect sizes indicated moderate to strong effects for the GC plus self-management intervention on active engagement. These are similar to prior findings. For example, Kamps et al. (2011) reported increases in on-task behavior and an effect size of 0.93 using a GC intervention.
Limitations
In spite of positive improvements in students’ performance, several limitations should be noted. The total number of words written increased and this was a primary concern of the teacher. Qualitative analysis of the writing and comprehension of the reading material was not conducted, nor were any measures of reading skills monitored. The study did not collect accuracy checks of students’ self-monitoring. Self-monitoring accuracy or measures of immediacy of students’ writing in response to the timer prompting may have been correlated to the target responses such as active engagement or amount of writing. Reactivity to the observers collecting active engagement and IOA data is a potential factor that was not controlled for in this study. Another limitation is that students did not monitor their level of productivity which has been shown to also improve student performance (Foley & Epstein, 1993; Lloyd, Eberhardt, & Drake, 1996).
Conclusion and Future Research
In summary, the GC plus self-management intervention package, including the use of self-monitoring and randomization of reinforcers (during the raffles), increased the amount of written work observed in reading logs for 15 students in three different remedial reading classrooms. This intervention package also increased the classroom average active engagement for all three classes, and individual students’ engagement. Students were able to increase the frequency of writing through the use of a variety of strategies included in the package, including self-management techniques using timers and visual prompts. Students were also able to monitor their own behavior by completing a ticket sheet that showed the discrete behaviors (tasks) required to earn reinforcers.
Future studies are needed to conduct a component analysis to determine which strategies are the most effective and necessary to produce student behavior change. Future research might also introduce rewards that are activity based (free time, reduction in assignment length) or free or less costly for teachers to be able to access and implement. The students’ ability to access reinforcers immediately or save them for a later date should be further analyzed to determine if a “banking” procedure is more effective at changing students’ behaviors.
The current study extended previous findings by developing an effective intervention package for increasing secondary students’ active engagement and written work linked to reading comprehension activities in three different high school classrooms. The use of GC and incentives in combination with a self-management component is recommended for secondary-level students to improve their learning and school performance.
Footnotes
Acknowledgements
We gratefully acknowledge the participating teachers and students for their time and ongoing support.
Authors’ Note
Opinions expressed herein are those of the authors and do not necessarily reflect the position of the funding agency.
Declaration of Conflicting Interests
The author(s) declared no potential conflicts of interest with respect to the research, authorship, and/or publication of this article.
Funding
The author(s) disclosed receipt of the following financial support for the research, authorship, and/or publication of this article: The research was funded by the Institute of Education Sciences, Department of Education (R324A07181).