



Abstract
Students with disabilities are disproportionately involved within the bullying dynamic. However, few studies have investigated the interaction between victimization and proactive or reactive aggression, and psychosocial predictors for bullying involvement among school-aged youth with disabilities. This study used structural equation modeling to examine the predictive nature of depression, hostility, and self-esteem on victimization, bullying, fighting, bully-victimization, and reactive-victimization for a diverse sample of 1,183 adolescents with disabilities. Results suggest that victimization predicted bullying and fighting. In addition, lower levels of depression and higher levels of hostility predicted bullying and fighting; higher levels of depression, hostility, and lower levels of self-esteem predicted higher levels of victimization. Finally, higher levels of depression, hostility, and lower levels of self-esteem predicted bully-victim and reactive-victim status. Therefore, schools should begin to incorporate targeted interventions that address skill development, social and emotional learning, and emotion regulation to address escalated rates of bullying involvement for youth with disabilities.
Bullying has been recognized as a notable public health concern for school-aged youth, yet recent evidence suggests that students with disabilities are disproportionately involved within the bullying dynamic (Rose, Monda-Amaya, & Espelage, 2011). For example, Blake, Lund, Zhou, Kwok, and Benz (2012) suggested that students with disabilities are up to 1.5 times more likely to report victimization than the reported national average, where 24.5% of students with disabilities in elementary, 34.1% in middle, and 26.6% in high school reported increased levels of victimization. Students with disabilities have also been found to engage in higher levels of bully perpetration than their peers without disabilities (Rose, Espelage, & Monda-Amaya, 2009), but Farmer and colleagues (2012) argued that students with disabilities likely represent bully-victims, where conceivably this subpopulation of youth engage in perpetration in reaction to victimization or as a function of their disability (Rose & Espelage, 2012). Unfortunately, the disproportionate rates of bullying involvement begin in preschool (Son, Parish, & Peterson, 2012), and persist over time (Blake et al., 2012). Although an emerging body of literature supports disproportionate representation, few have examined the interaction between victimization and peer aggression (fighting, bullying), or psychosocial risk factors such as depression, self-esteem, and hostility.
Depression
Youth who are involved in bullying often experience common symptoms of psychosocial problems, including depression and anxiety (Cook, Williams, Guerra, Kim, & Sadek, 2010; Espelage, Low, & De La Rue, 2012; Hong & Espelage, 2012). For example, students who report higher rates of depressive symptoms also report higher bullying involvement when compared with youth who do not report depressive symptoms (Fekkes, Pijpers, & Verloove-Vanhorick, 2005; Holt & Espelage, 2007). Although few studies have examined the intersection between depression and victimization among students with disabilities, scholars have suggested that students with learning disabilities report significantly higher rates of depression than their peers without disabilities (Maag & Reid, 2006; Mishna, 2003). Rose, Forber-Pratt, Espelage, and Aragon (2013) argued that comorbidity between disability identification and depressive symptoms may be associated with higher rates of bullying involvement.
Hostility
Hostility or anger has frequently emerged as a predictor of bullying involvement (Camodeca & Goossens, 2005; O’Brennan, Bradshaw, & Sawyer, 2009; Rose & Espelage, 2012; Swearer, Espelage, Vaillancourt, & Hymel, 2010). For example, school-aged perpetrators and victims were found to score higher in the areas of hostile interpretation, anger, retaliation, and ease of aggression when compared with their uninvolved peers (Camodeca & Goossens, 2005). Conceivably, emotional regulation may be difficult for individuals who experience high levels of victimization, resulting in negative consequences or emotions, such as anger or hostility (Kochenderfer-Ladd, 2004; Shields & Cicchetti, 2001). For students with disabilities, anger predicted both proactive (bullying) and reactive (fighting) aggression, where as anger increased, bully perpetration also increased, especially for students with emotional and behavioral disorders (Rose & Espelage, 2012). These findings support the argument that risk factors for bullying are associated with characteristics of a disability; not the presence of a disability (Rose et al., 2013).
Self-Esteem
Rosenberg (1979) defined self-esteem as an individual’s sense of worthiness, adequacy, and self-respect, which can affect how an individual acts. Mixed results have been found in research on the effects of bullying on self-esteem. For example, some scholars have suggested that victims have lower levels of self-esteem than perpetrators (Duncan, 1999; Tritt & Duncan, 1997), and self-esteem buffers against bullying involvement for school-aged youth (O’Moore & Kirkham, 2001). However, some scholars have found that self-esteem is invariant between victims, perpetrators, and students who are uninvolved in bullying (Rigby & Slee, 1993; Salmon, James, & Smith, 1998). For students with disabilities, it is conceivable that disability status and self-esteem are linked, where as severity of the disability increases, self-esteem decreases, and victimization increases (Blood & Blood, 2004; Nosek, Hughes, Swedlund, Taylor, & Swank, 2003; Rose et al., 2011). However, it has been argued that the interactions between the contextual, social, and emotional dimensions of a disability are what affect self-esteem (Barnwell & Kavanagh, 1997; Walsh & Walsh, 1998).
Summary and Purpose
Although an emerging body of literature has established that students with disabilities are disproportionately involved within the bullying dynamic, few have examined psychosocial predictors of bullying involvement for this subpopulation of youth. However, from a social-ecological perspective, individual characteristics, such as depression, self-esteem, and hostility, are critical components of bullying involvement. Furthermore, students with disabilities report high levels of depressive symptoms, lower levels of self-esteem, and higher levels of hostility, which may be attributed to disability characteristics. Therefore, the current study sought to answer the following research questions for individuals with disabilities:
Method
Participants
Participants for this study were derived from a larger study on social-ecological predictors of bullying involvement for students with and without disabilities, with a total sample of 14,508 youth. For the current study, as presented in Table 1, the 1,183 students with disabilities were extracted from the total sample for direct analyses, which represents 8.2% of the total sample. This is notable because it is similar to the 8.4% national average of youth ages 6 through 21 with disabilities (U.S. Department of Education, 2014). These respondents included youth in Grades 6 through 12 from 17 middle schools, six high schools, and two alternative schools in five school districts from Southwestern United States with a mean age of 14.4 years. Respondent disabilities included 56.4% specific learning disability, 15.3% other health impairment, 9.9% intellectual disability, 7.7% emotional or behavioral disorder, and 5.2% with sensory-related or other low-incidence disability. Overall, the sample included approximately 25% more males than females, with a comparable racial distribution of African American, Latino/a, and White.
Descriptive Statistics for Students With Disabilities.
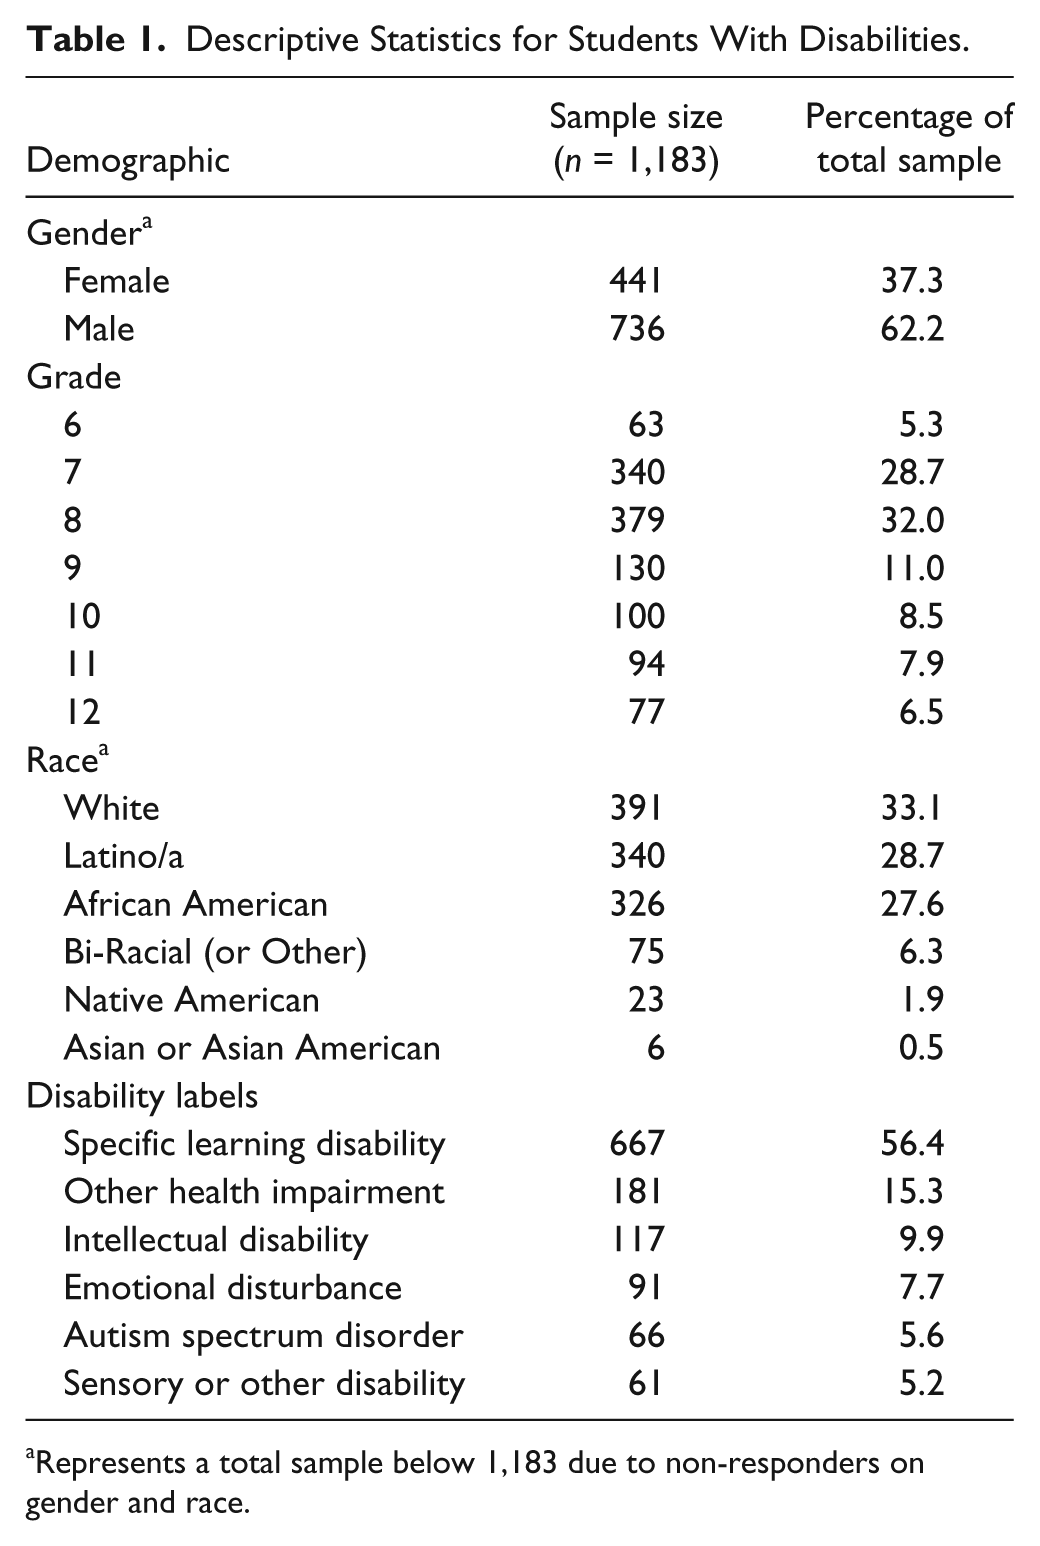
Represents a total sample below 1,183 due to non-responders on gender and race.
Procedure
Parental consent
Data were collected following the approval of the Institutional Review Board (IRB) from the primary author’s university during the initiation of the study, and in concert with school officials and school boards. A waiver of active consent was approved by both the university IRB and collaborating school officials for all 25 partner schools. Project information and waivers of active consent were distributed to parents or guardians of all students at least 1 week prior to data collection. Given the diversity of the sample, materials were available in both English and Spanish. Parents were asked to return the form only if they wanted their son or daughter to be exempt from survey administration.
Survey administration
Prior to survey administration, students who returned a waiver of active consent were removed from the classroom and placed in a predetermined centralized location for the duration of the survey administration. Students who were eligible for participation were provided with project information and provided assent by signing the first page of the survey instrument. Respondents were assured anonymity, where their names would be converted to a unique participant number and removed from the survey within 3 hr of survey completion. For each administration, a trained administrator read the survey over the school’s public announcement system, where the entire school completed the survey at once. To support respondents, including students with disabilities in inclusive settings, trained research assistants were assigned to no more than three classrooms, where they were available to respond to student questions, repeat items, and provide item clarification. Once the survey was complete, the trained research assistants collected their assigned classrooms’ surveys and placed them in a sealed envelope. The entire procedure lasted approximately 45 min.
Support for students with disabilities
For known self-contained classrooms or at the request of the student or teacher, individualized support was provided for students with disabilities. Research assistants, who were trained by a doctoral-level special education professional, administered the survey individually or in small groups. Students were provided with individualized supports that mirror typical testing accommodations for students identified with a disability, including, but not limited to, extended time, scribes, item elaboration, and item clarification. The same anonymity procedure was used for students with disabilities, where school officials connected the unique participant number to the disability data.
Measures
Data were collected using the University of Illinois and Wellesley College: Student Behavior Survey–Modified (Espelage & Stein, 2006). The survey instrument was designed to assess social-ecological factors related to bullying involvement among students with and without disabilities. For the current study, six constructs (i.e., bullying, victimization, fighting, depression, self-esteem, hostility) from the University of Illinois and Wellesley College: Student Behavior Survey–Modified were selected from the larger study. In addition to the selected constructs, demographic data included self-reported gender, grade level, age, and race.
University of Illinois Victimization Scale
Victimization from peers was assessed using the four-item University of Illinois Victimization Scale (UIVS; Espelage & Holt, 2001). Students were asked how often other students called them names, made fun of them, picked on them, and pushed or hit them in the past 30 days. Response options ranged from “never = 1” to “7 or more times = 5.” Cronbach’s alpha coefficient of .83 was found for students with disabilities.
University of Illinois Bully Scale
Bully perpetration was assessed using the eight-item University of Illinois Bully Scale (Espelage & Holt, 2001). Students were asked how often they perpetrated peer aggression in the past 30 days. Items included, “I upset other students for the fun of it,” “I helped harass other students,” and “I spread rumors about other students.” Response options ranged from “never = 1” to “7 or more times = 5.” Cronbach’s alpha coefficient of .84 was found for students with disabilities.
University of Illinois Fight Scale
Fighting was assessed using the four-item University of Illinois Fighting Scale (UIFS; Espelage & Holt, 2001). Students were asked how often they got in a physical fight, got in a physical fight because they were angry, hit back when someone hit them first, and fought others they could easily beat in the past 30 days. Response options ranged from “never = 1” to “7 or more times = 5.” Cronbach’s alpha coefficient of .75 was found for students with disabilities.
Modified Depression Scale
Depression was assessed using the nine-item Modified Depression Scale (Orpinas, 1993). Students responded to items that measure feelings of depression over the last 30 days, including “were you very sad,” “did you feel hopeless about the future,” and “did you worry a lot.” Response options ranged from “never = 1” to “always = 5.” Cronbach’s alpha coefficient of .83 was found for students with disabilities.
Weinberger Adjustment Inventory
Self-esteem was measured using four items from the Weinberger Adjustment Inventory (Weinberger & Schwartz, 1990). Students were asked how often they “feel I’m the kind of person I want to be,” “I can do things as well as other people can,” “that I am a special or important person,” and “I am really good at things I try to do.” Response options ranged from “never = 1” to “almost always = 5.” Cronbach’s alpha coefficient of .77 was found for students with disabilities.
Symptom Checklist–90
Hostility was measured using six items of the Symptom Checklist–90 (Derogatis, Rickels, & Rock, 1976). Students were asked how often they “feel easily annoyed or irritated,” “have temper outbursts [they] cannot control,” “have urges to beat, injure, or harm someone,” “have urges to break or smash things,” “get into frequent arguments,” and “shout or throw things.” Response options ranged from “never = 1” to “most of the time = 4.” Cronbach’s alpha coefficient of .83 was found for students with disabilities.
Disability data
Disability data were established in collaboration with school officials who provided an anonymized spreadsheet of primary disability labels and all special education services, as defined by the Individualized Education Program (IEP) committee. This spreadsheet was matched to the unique participant number established during survey administration. Disability status represents the legal educational diagnosis of the student based on the state’s eligibility criteria in reference to the Individuals With Disabilities Education Act (IDEA, 2004). Each student identified with a disability had an IEP and received special education services.
Missing Data
Because missingness can bias a sample (Davey, Savla, & Zupei, 2005; Rubin, 1976), and samples sizes for students with disabilities are typically limited (Blake et al., 2012), it was necessary to account for missing data. To address the issue of missing data, a multiple imputation (MI) procedure was executed using the fully conditional specification Markov chain Monte Carlo (MCMC) maximum likelihood procedure in SPSS Version 23 (IBM Corporation, 2015). Based on Enders (2010) recommendation, 10 complete data sets were replicated, where all estimates were pooled using Rubin’s (1987) rules to create one parsimonious data set. Total missingness ranged from 0% to 6.93%, with an average of 4.97%, which is manageable based on Luengo, García, and Herrera’s (2010) 5% threshold.
Analytic Procedure
Structural equation modeling (SEM) was used to evaluate the research questions because SEM procedures provide accurate estimates of unbiased parameters by examining latent constructs while controlling for measurement error (Little, 1997). As an initial step, the measurement model (i.e., confirmatory factor analysis) was established, followed by the structural model. The measurement model included six latent constructs (i.e., victimization, bullying, fighting, depression, self-esteem, hostility), where an item-to-construct balancing procedure was conducted to create parcels for each latent construct (Little, Cunningham, Shahar, & Widaman, 2002). An a priori decision was made to create parcels (i.e., aggregate-level indicators) because the focus of the current study was grounded in the assessment of latent constructs, not item-level indicators. Little (2013) argued that parcels maintain a number of psychometric and estimation benefits, including higher reliability, lower likelihood of distributional violations, lower likelihood of correlated residuals and dual factor loadings, and reduced sources of sampling error. In addition, by using parcels, a just-identified model could be established, which is important because a just-identified model has one solution, regardless of the constructs that are entered into the model (Little et al., 2002). To construct the parcels, a single fixed-factor exploratory factor analysis (EFA) using maximum likelihood estimation was conducted using SPSS Version 23 (IBM Corporation, 2015) for each construct. Following each EFA, the three highest loadings were used to anchor the parcels, where the next highest loadings were added to the anchors in reverse order (Little et al., 2002). In addition, an a priori decision was made to retain items if the factor loadings exceeded .30. Based on these decision rules, one item, “Did you feel happy (reverse coded),” on the depression construct produced a factor loading of .02, and was removed from further analyses. Overall, EFA loadings ranged from .74 to .56 for bullying, .68 to .50 for victimization, .81 to .57 for fighting, .70 to .52 for depression, .71 to .63 for self-esteem, and .78 to .48 for hostility.
Once the parcels were established, the measurement and structural models were evaluated by fixing (i.e., setting the scale) the latent variances of each construct to 1.0 using MPlus Version 7.11 (Muthén & Muthén, 2012). Model fit was initially evaluated through chi-square divided by degrees of freedom, where a ratio below 3 is often considered an acceptable fit (Kline, 1998). Although chi-square is generally the null-hypothesis significance test, it is sensitive to sample size (Cheung & Rensvold, 2002). Therefore, other fit indices may be more appropriate in assessing model fit because they are less affected by sample size (Hu & Bentler, 1999). For the current study, the Root Mean Square Error of Approximation (RMSEA), RMSEA 90% CI, Tucker–Lewis Index (TLI), and Comparative Fit Index (CFI) were used. RMSEA scores less than .05 (Hu & Bentler, 1999) and TLI and CFI scores greater or equal to .95 (Schermelleh-Engel, Moosbrugger, & Müller, 2003) are generally considered close fitting models.
Results
Measurement Model
After the parcels were established, the freely estimated measurement model was evaluated by fixing the latent variances of each construct to 1.0. This procedure was used to establish the utility and independence of each construct. Although the χ2/df fit statistic exceeded 3 (χ2/df = 3.26), the total sample size is relatively large, which may influence the model fit (Cheung & Rensvold, 2002). Therefore, as presented in Table 2, the RMSEA, TLI, and CFI were evaluated and demonstrated a close fitting model, χ2(120) = 391.47, RMSEA = .04 [.04, .05], TLI = .96, CFI = .97. The standardized factor loadings are presented in Table 3, and (λa) ranged from .88 to .76 for bullying, .82 to .74 for victimization, .75 to .79 for fighting, .82 to .76 for depression, .82 to .69 for self-esteem, and .82 to .78 for hostility. Latent mean scores and correlations, presented in Table 4, demonstrate the relative association between each construct. Overall, the measurement model demonstrates a close fit, which indicates that each construct is independently measured and represented.
Fit Indices for Measurement and Structural Models.

Note. RMSEA = root mean square error of approximation; CI = confidence interval; TLI = Tucker–Lewis Index; CFI = comparative fit index.
Loadings, Intercepts, Estimated Latent Variance, Mean Scores, Unique Residuals, and Squared Multiple Correlations for Measurement Model.
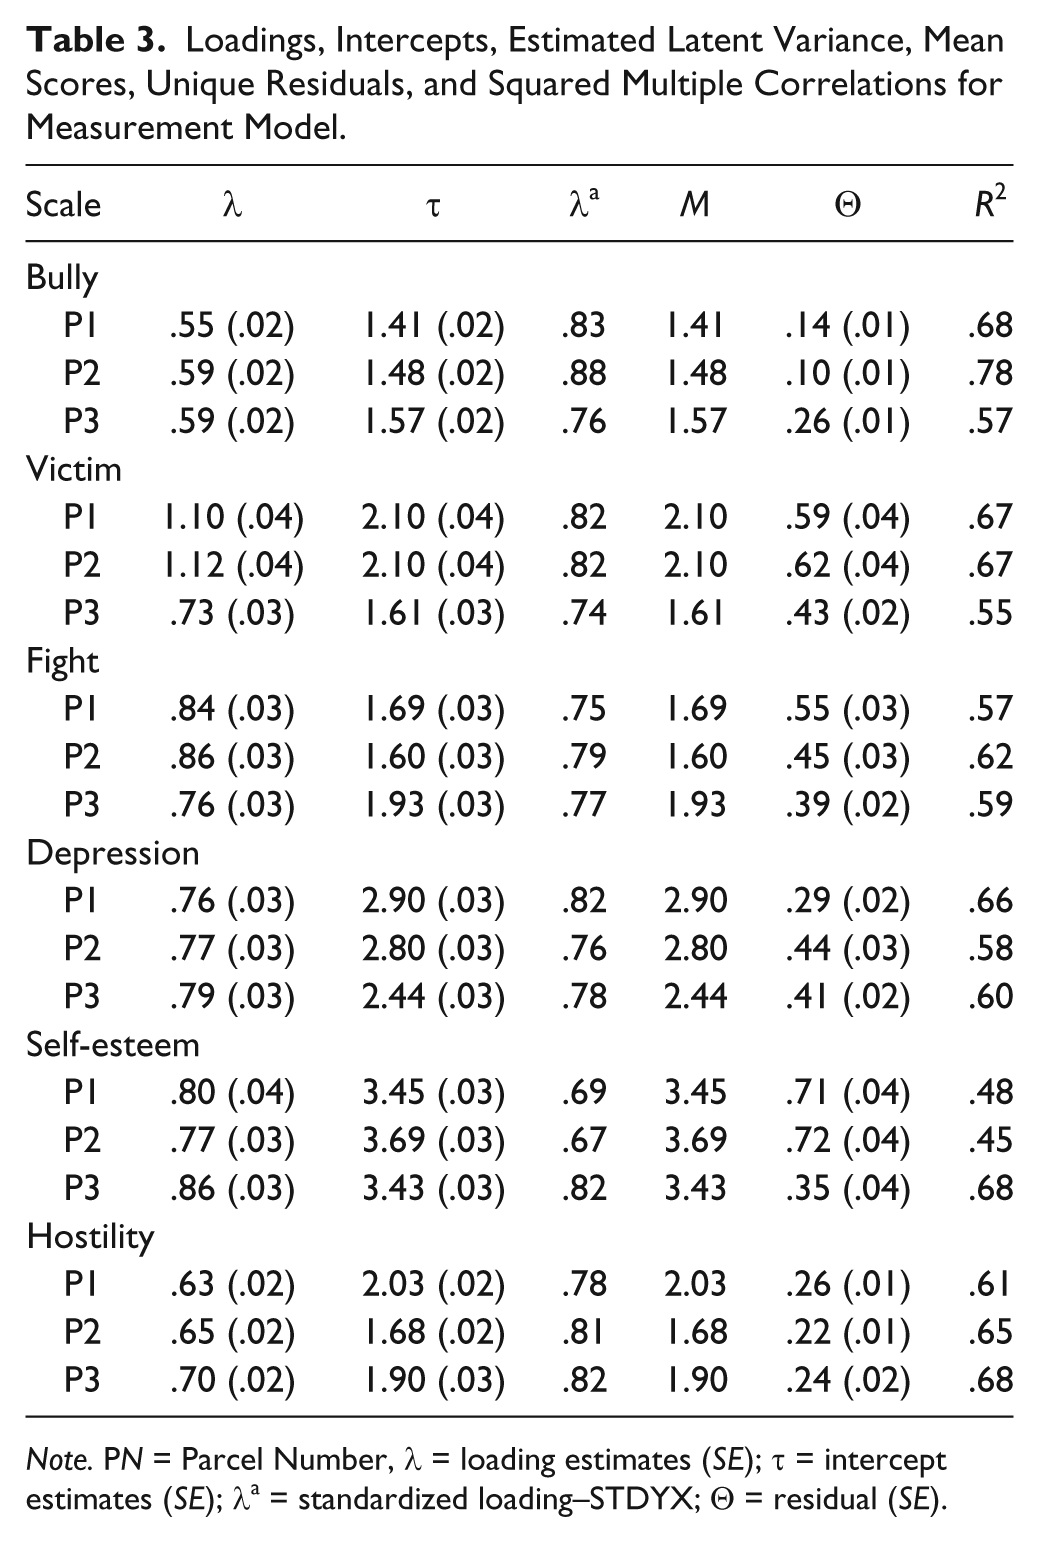
Note. PN = Parcel Number, λ = loading estimates (SE); τ = intercept estimates (SE); λa = standardized loading–STDYX; Θ = residual (SE).
Correlations Among the Latent Constructs.
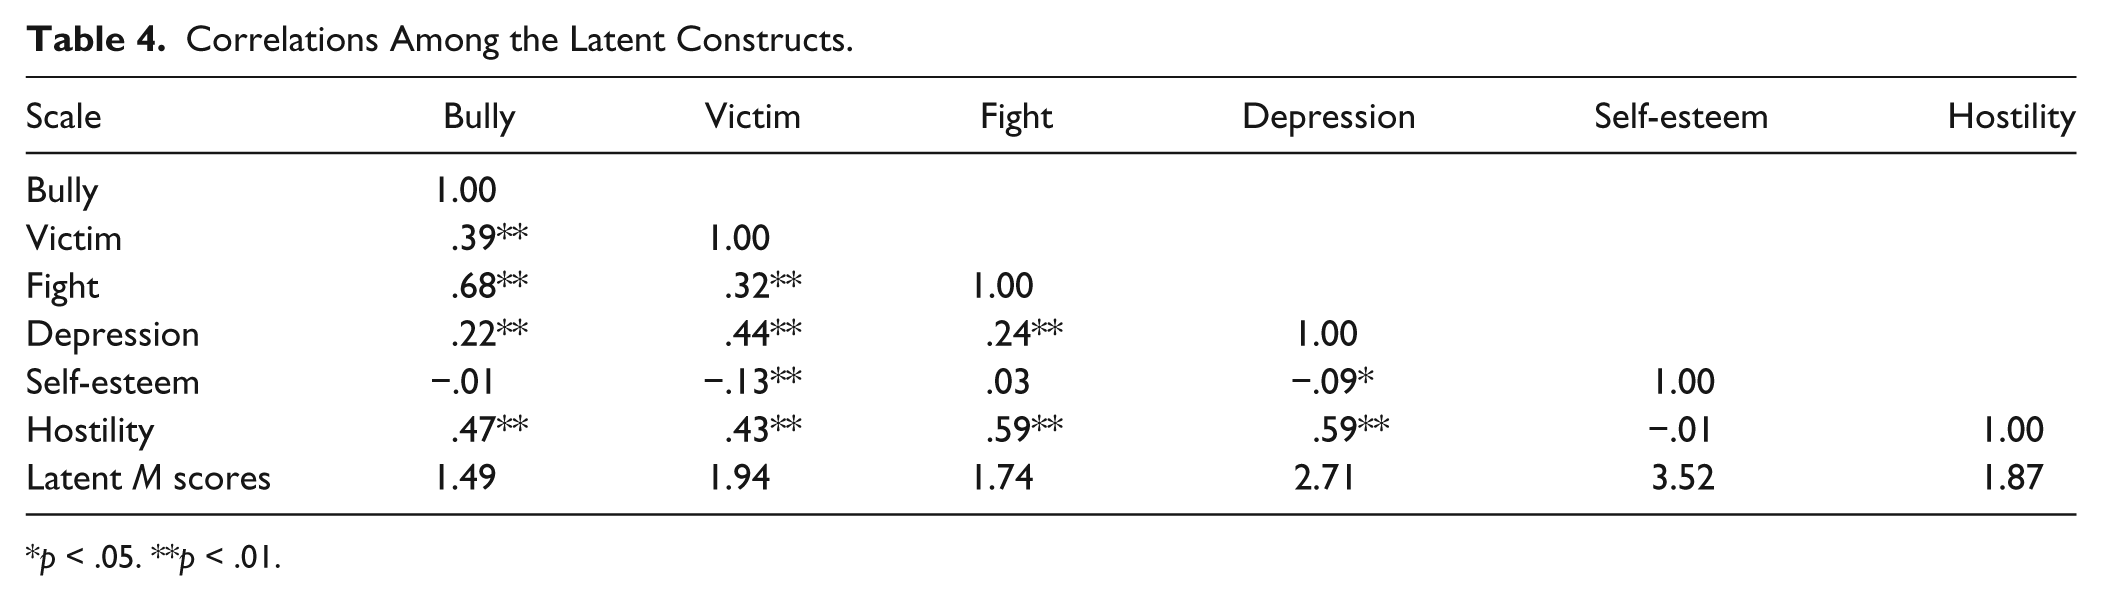
p < .05. **p < .01.
Structural Model
Based on the close fitting measurement model, the structural model was established by evaluating the direct paths from depression, self-esteem, and hostility to bullying, victimization, and fighting; the direct paths from victimization to bullying and fighting; and the indirect paths from depression, self-esteem, and hostility through victimization to bullying and fighting. As a preliminary step, all non-significant paths were sequentially removed, resulting in the removal of self-esteem to bullying, and self-esteem to fighting. After non-significant paths were removed, the model fit statistics were evaluated and presented in Table 2. Similar to the measurement model, the χ2/df fit statistic exceeded 3 (χ2/df = 3.22), yet the RMSEA, TLI, and CFI demonstrated a close fitting final structural model, χ2(122) = 392.35, RMSEA = .04 [.04, .05], TLI = .97, CFI = .97.
Direct effects
The final model examined the direct effects of depression; self-esteem (on victimization only); and hostility on bullying, fighting, and victimization. In addition, the direct effects of victimization on bullying and fighting were examined. All direct effects are presented in Table 5, and represented in Figure 1. Within the final model, lower levels of depression (β = −.16, z = −3.69, p < .01), higher levels of hostility (β = .45, z = 9.73, p < .01), and higher levels of victimization (β = .27, z = 7.21, p < .01) predicted higher levels of bully perpetration. Similarly, lower levels of depression (β = −.21, z = −4.64, p < .01), higher levels of hostility (β = .67, z = 12.62, p < .01), and higher levels of victimization (β = .13, z = 3.43, p < .01) predicted higher levels of fighting. Higher levels of depression (β = .27, z = 6.23, p < .01), higher levels of hostility (β = .26, z = 6.11, p < .01), and lower levels of self-esteem (β = −.11, z = −3.18, p < .01; see Table 5) predicted higher levels of victimization.
Beta Weights and Z Scores for the Final Structural Model.

Represents Research Questions 1, 2, and 3, respectively.
p < .05. **p < .01.
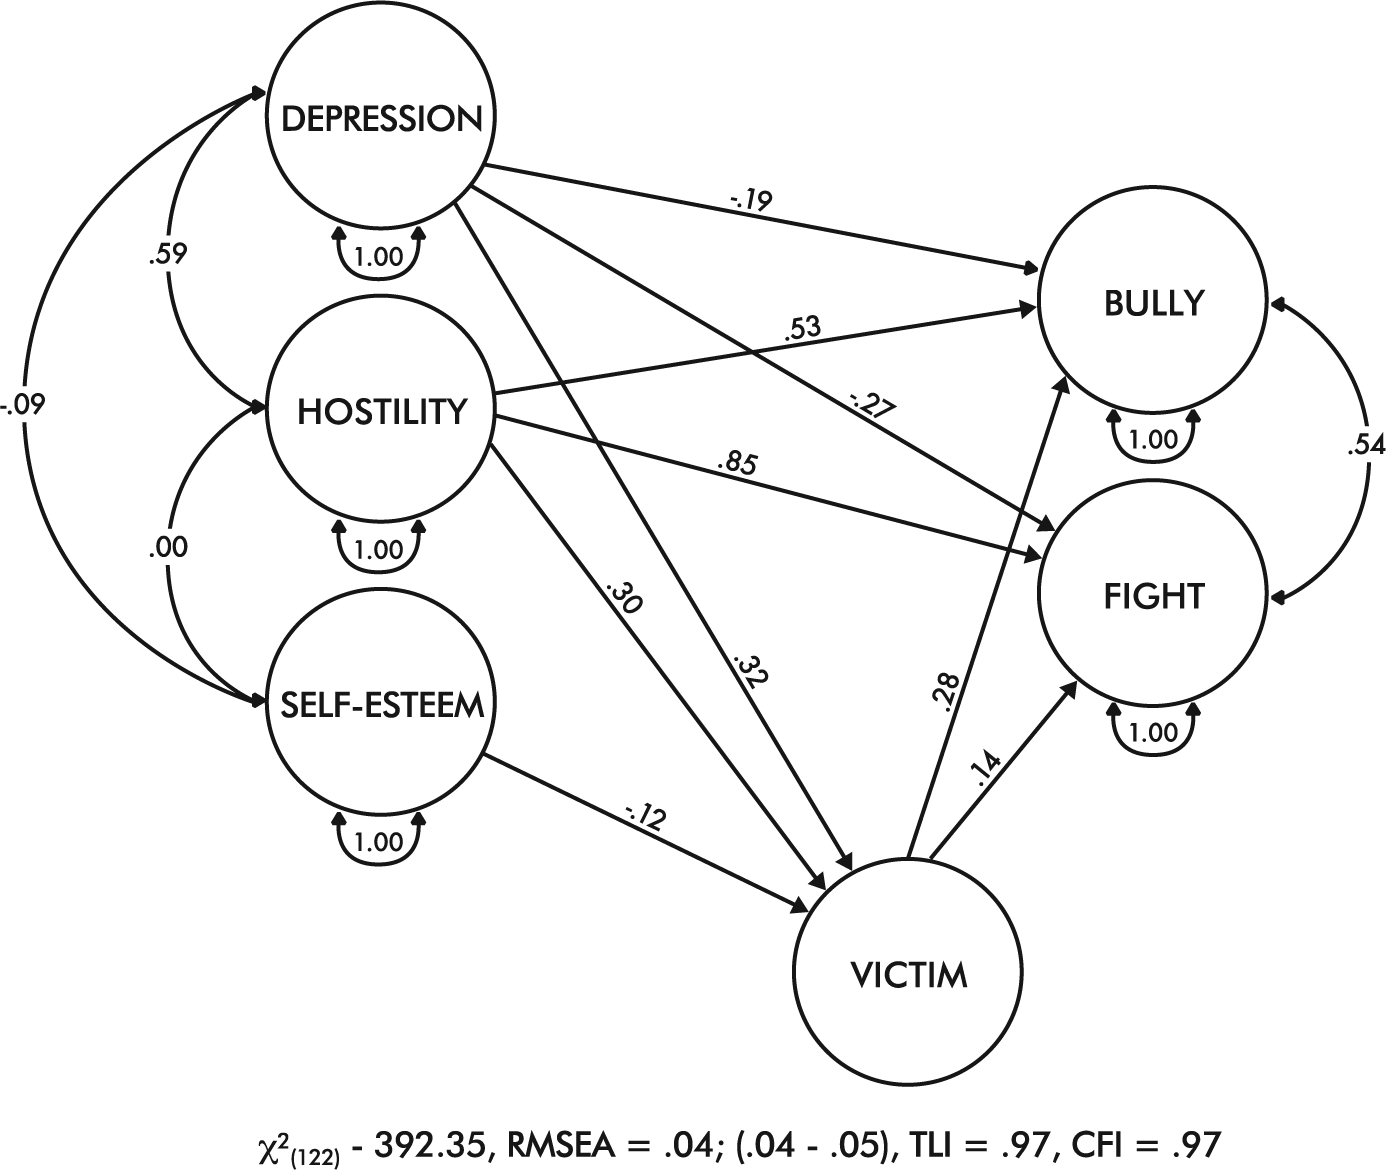
Final structural model with significant paths.
Indirect effects
In addition to the direct effects, the final model evaluated the indirect effects of depression, self-esteem, and hostility through victimization on bullying and fighting (i.e., bully-victim, reactive-victim). All indirect effects are presented in Table 5, and represented in Figure 1. The indirect effect for depression through victimization on bullying was significant (β = .08, z = 4.58, p < .01), suggesting that increases in depression predict increases in bully-victim status. Similarity, the indirect effect for depression through victimization on fighting was significant (β = .04, z = 2.88, p < .01), suggesting that increases in depression predict increases in reactive-victim status. The indirect effect for hostility through victimization on bullying was significant (β = .07, z = 4.97, p < .01), suggesting that increases in hostility predict increases in bully-victim status. The indirect effect for hostility through victimization on fighting was also significant (β = .03, z = 3.23, p < .01), suggesting that increases in hostility predict increases in reactive-victim status. Whereas direct effects for self-esteem were not significant for bully perpetration and fighting, indirect effect through victimization emerged as significant. Specifically, the indirect effect for self-esteem through victimization on bully perpetration was significant (β = −.03, z = −2.95, p < .01), suggesting that lower levels of self-esteem predict increases in bully-victim status. Indirect effects for self-esteem through victimization on fighting were also significant (β = −.01, z = −.237, p < .05), suggesting that lower levels of self-esteem predict increases in reactive-victim status.
Discussion
Bullying among students with disabilities has received increased attention in recent history, where much of the extant literature suggests that students with disabilities are disproportionately represented as victims (Blake et al., 2012, Rose et al., 2011), perpetrators (Rose & Espelage, 2012; Rose et al., 2009), and bully-victims (Farmer et al., 2012). Giving this expanding body of literature, this study sought to investigate the predictive nature of psychosocial outcomes (i.e., depression, hostility, self-esteem) on bullying involvement (i.e., bullying, fighting, victimization), the interaction between victimization and perpetration (i.e., proactive, reactive), and indirect effects of psychosocial outcomes through victimization on perpetration (i.e., bully-victim, reactive-victim) for a large sample of youth with disabilities.
Bully- and Reactive-Victim
Bullying involvement is not a static process that is defined by a linear relationship between a “pure” bully and “pure” victim (Hong & Espelage, 2012; Salmivalli, 2010), and is more likely defined by the fluidity of roles (Gumpel, Zioni-Koren, & Bekerman, 2014; Ryoo, Wang, & Swearer, 2015). If fluidity of roles does exist, it is conceivable that a relationship exists between victimization and perpetration, especially for students with disabilities. This hypothesis is supported by the current study, where victimization predicted both bully perpetration and fighting, representing bully-victims and reactive-victims. For example, Farmer and colleagues (2012) suggested that students with disabilities likely represent bully-victim, as opposed to “pure” bullies and “pure” victims. Rose and Espelage (2012) argued that students with emotional and behavioral disorders are more likely to represent reactive-victims, whereas students with other types of disabilities are more likely to represent bully-victims. This is an important distinction because it speaks to the nature of the disability, where some disabilities are grounded in characteristics that are more reactionary (e.g., impulsivity, anger, aggression; Rose & Espelage, 2012), and bully prevention programs should focus on supporting skill development, while addressing the fluidity of bullying roles.
Depression
The relationship between bullying involvement and depression, or depressive symptoms, has received increased research attention in recent years. For example, students who experience frequent victimization are 4.2 times more likely report depressive symptoms than school-aged youth who do not experience victimization (Kaltiala-Heino, Rimpelä, Marttunen, Rimpelä, & Rantanen, 1999), which has been corroborated in subsequent studies (Cook et al., 2010; Fekkes et al., 2005), and holds for the current population of students with disabilities. Holt and Espelage (2007) argued that direct involvement as a perpetrator, victim, or bully-victim predicted higher levels of depression. The current study parallels Holt and Espelage’s, where depression predicted higher levels of victimization, bully-victimization, and reactive-victimization, but conflicted in perpetration. More specifically, students with disabilities who reported high levels of depressive symptoms tended to engage in lower levels of proactive and reactive aggression.
Although this result was surprising, it conceivably speaks to the functionality of peer aggression for youth with disabilities. For example, bullying is a social construct (Hong & Espelage, 2012), and depressive symptoms are linked to peer social supports (Marroquín, 2011; Stice, Rohde, Gau, & Ochner, 2011), yet students with disabilities often experience greater peer rejection than youth without disabilities (Pavri & Luftig, 2000; Swearer, Wang, Maag, Siebecker, & Frerichs, 2012). To compound this issue, youth tend to associate with peers who exhibit similar aggressive behaviors (Espelage et al., 2012) to maintain social status within a dominant peer group (Witvliet, van Lier, Cuijpers, & Koot, 2009). Therefore, youth with disabilities who engage in aggressive behaviors may be attempting to assimilate into a peer group, where an increase in perceived belongingness could buffer depressive symptoms. However, increased levels of aggression may be a function of the disability characteristics (Rose & Espelage, 2012; Swearer et al., 2012), where students with disabilities are often involved in the bullying dynamic due to ineffective or insufficient social or communication skills (Rose et al., 2011), and may use aggressive behaviors as a communicative strategy.
Hostility
Hostility is a component of anger, and has been described as the attitudes that accompany feelings of anger (Ramirez & Andreu, 2005). The current study examined these attitudes as a predictor of bullying, fighting, victimization, bully-victimization, and reactive-victimization. The findings suggest that increased hostility predicted increases in bullying involvement, which is consistent with extant literature (Camodeca & Goossens, 2005; O’Brennan et al., 2009; Rose & Espelage, 2012; Swearer et al., 2010; Swearer et al., 2012). Although few studies have investigated hostility as a predictor of bullying involvement for students with disabilities, recent evidence suggests that students with behavior-oriented disabilities, which often have disability characteristics associated with anger and hostility, engage in higher rates of perpetration than their peers without disabilities and peers with other types of disabilities (Rose & Espelage, 2012; Swearer et al., 2012). Therefore, emotional regulation should be a component of bully prevention programs, especially for individuals with disabilities (Espelage, Rose, & Polanin, 2015; Kochenderfer-Ladd, 2004; Shields & Cicchetti, 2001).
Self-Esteem
Although conflicting results exist in extant literature regarding self-esteem, evidence suggests that students who experience victimization also report lower levels of self-esteem (Duncan, 1999; O’Moore & Kirkham, 2001; Tritt & Duncan, 1997). Results from the current study suggest that lower levels of self-esteem predicted higher levels of victimization, bully-victimization, and reactive-victimization for youth with disabilities. This is especially important because evidence suggests that as severity of disability increases, self-esteem decreases, which may lead to increased victimization (Blood & Blood, 2004; Nosek et al., 2003; Rose et al., 2011). Although it is conceivable that self-esteem is linked to disability characteristics (Barnwell & Kavanagh, 1997; Walsh & Walsh, 1998), findings from the current study suggest that when students with disabilities have a stronger self-concept, they are less likely to be involved within the bullying dynamic.
Limitations
Although this study makes a notable contribution to the literature, it is not without limitation. First, data were self-reported, which may reflect the perceived involvement of students with disabilities. Second, data were not disaggregated across disability type or restrictiveness of special education services. This is an important distinction because type of disability or restrictiveness of placement may provide a stronger understanding of the bullying involvement of specific subgroups of students with disabilities. Third, parcels, instead of item-level indicators, were used to establish the theoretical constructs. Although parcels represent “one’s philosophical stance regarding scientific inquiry and the substantive goal of the study” (Little et al., 2002, p. 151), parceling versus item-level indicators remains a statistical debate within the social science literature (Little, 2013). Fourth, students with and without disabilities were not directly compared in this study, which may over-represent or underrepresent the predictive nature of psychosocial factors on bullying involvement for students with disabilities. Finally, data were examined through a cross-sectional lens, where reciprocity could not be examined and a causal link could not be established. Future research should attempt to address these limitations to provide a better understanding of the predictive nature of psychosocial outcomes on bullying involvement for students with specific disabilities over time.
Conclusion
Students with disabilities are disproportionately represented in the bullying dynamic (Rose et al., 2011). The current study suggests that increased victimization predicts increased bully perpetration and fighting for students with disabilities. In addition, psychosocial outcomes predict escalated rates of involvement within the bullying dynamic, including victimization, bullying, fighting, bully-victimization, and reactive-victimization. Given the direct relationship between bullying involvement and psychosocial outcomes, schools should begin to incorporate targeted mental health supports for youth with disabilities.
Footnotes
Declaration of Conflicting Interests
The author(s) declared no potential conflicts of interest with respect to the research, authorship, and/or publication of this article.
Funding
The author(s) received no financial support for the research, authorship, and/or publication of this article.