




Abstract
We examined instructional processes in classrooms where students with and without disabilities received mathematics instruction to understand the relationship among key instructional process variables and achievement as measured by interim and end-of-year summative assessments. Teachers (N = 78) completed instructional logs daily and administered easyCBM probes quarterly to 162 students with disabilities and 165 students without disabilities. Examination of instructional data indicated both groups of students had nearly equal opportunities to learn (OTLs) the same mathematics content, yet there were significant differences in these students’ mathematics achievement on interim and summative tests. Special education status and instructional practices were found to be significant predictors of achievement growth. Furthermore, grade level and special education status, along with OTL scores, accounted for significant variance in end-of-year mathematics scores. Discussion of results focuses on instructional practice implications and the role these practices play in achievement gaps.
Most large-scale assessment and accountability systems assume that all participating students have an equal opportunity to learn (OTL) what they are expected to know and are tested on. This OTL assumption has rarely, if ever, been tested, for the many students with disabilities (SWD) receiving their mathematics instruction in the general education curriculum in the same classrooms with students without disabilities (SWOD). Although the proportion of SWD who spend 80% or more of their instructional time (IT) in inclusive education classrooms has increased substantially to over 61% (McLeskey, Landers, Williamson, & Hoppey, 2012), their achievement outcomes have remained far below desirable levels (National Center for Education Statistics, 2012; National Council on Disability, 2011). As a result, substantial mathematics achievement gaps continue to be present between SWD and their classmates without disabilities (e.g., Stevens, Schulte, Elliott, Nese, & Tindal, 2015).
For the present study, OTL was defined as the “degree to which a teacher dedicates instructional time and content coverage to the intended curriculum objectives emphasizing higher-order cognitive processes, evidence-based instructional practices, and alternative grouping formats” (Kurz, Elliott, Lemons, Zigmond, & Kloo, 2014, p. 14). Given this definition and the assumption about OTL and achievement test score validity, understanding the instructional processes related to the achievement of students with and without disabilities receiving instruction in the same general education classrooms is a research, policy, and practice issue worthy of investigation. This is a particular concern under federal mandates such as the Individuals With Disabilities Education Act (IDEA; 1997, 2004) that stress access for SWD to the same general curriculum offered to SWOD. McLaughlin (1999) argued that these federal mandates indicate “a clear presumption that that all students with disabilities should have access to the general curriculum and to the same opportunity to learn challenging and important content that is offered to all students” (p. 9). Moreover, Kurz (2011) asserted that equal OTL for students with and without disabilities may not be enough to close achievement gaps between them. Reauthorizations of the Elementary and Secondary Education Act (Improving America’s Schools Act, 1994; No Child Left Behind Act, 2001) and IDEA (1997, 2004) established the right of SWD to access the academic standards that define the general curriculum via individualized intended curricula. As such, OTL should be reflective of their individual abilities and needs to ensure SWD can be successful academically. Kurz, Elliott, Kettler, and Yel (2014) argued that “providing SWDs and SWODs equal OTL may lead to unequal outcomes for SWD; in part because the unique learning challenges of SWDs may require they receive more OTL than SWODs to be academically successful” (p. 24).
Recently, however, researchers examining OTL for SWD have reported mixed findings. Specifically, Kurz, Elliott, Kettler, and Yel (2014) found in classrooms sampled in Arizona, Pennsylvania, and South Carolina that SWD experienced significantly less time on standards, more non-IT, and less content coverage compared with their overall class. The differences in classwide and student-specific OTL scores for the SWD were statistically significant with effect sizes (ESs) in the medium to large range. In another study in Arizona and Oregon classrooms, Elliott, Kurz, Tindal, Stevens, and Yel (2014) found that SWD and SWOD who received mathematics instruction in the same classrooms had virtually equal OTL. However, significant differences existed in their mathematics achievement on both interim and summative tests, with the SWOD group achieving at significantly higher levels than the SWD group.
The goals of the present study were to (a) document key instructional processes in elementary classrooms where both students with and without disabilities received all their mathematics instruction and (b) examine the relationship among these instructional process variables and the achievement of students as measured by both interim curriculum-based measurement (CBM) probes and end-of-year summative assessments. To measure instructional processes, we used the My Instructional Learning Opportunities Guidance System (MyiLOGS®; Kurz & Elliott, 2011), an online teacher log used daily to document key instructional actions related to time, content, and quality associated with student achievement (e.g., Elliott & Kurz, 2013; Kurz, Elliott, Kettler, & Yel, 2014; Roach, Kurz, & Elliott, 2015). As measured by MyiLOGS, the instructional dimension of quality involves cognitive processes (CP) emphasized, instructional practices (IP) used, and grouping format (GF) used. Thus, MyiLOGS was used to measure the five variables—time used, content covered, CP emphasized, IP used, and GF used—articulated in our operational definition of OTL. To measure classroom achievement, we used easyCBM© throughout the school year to gain insights into students’ within-year achievement growth and also collected end-of-year achievement via state tests.
Research on OTL as a Predictor of Student Achievement
Decades of research have identified several OTL indices grouped along three dimensions of the enacted curriculum that are predictive of student achievement (see Kurz, 2011). These dimensions are the time, content, and quality of instruction. Although researchers have typically examined OTL indices separately for each dimension, MyiLOGS allows teachers to generate scores along all three dimensions. Based on a detailed discussion of research on OTL by Kurz (2011), we provide brief summaries on OTL indices related to the key dimensions of time, content, and quality of instruction.
Research on time has reported OTL indices to be moderately related to student achievement even after controlling for other variables such as student ability and socioeconomic status. A review by Fredrick and Walberg (1980), for example, reported moderate and persistent correlations across various time and outcome achievement measures ranging from .13 to .71. A meta-analysis by Scheerens and Bosker (1997) using allocated time (i.e., scheduled class time) found an average Cohen’s d ES of 0.39 when examining differences in achievement.
The research on content also indicated OTL indices were moderately related to student achievement, especially if the assessed content overlapped with the content of the outcome measure (e.g., Gamoran, Porter, Smithson, & White, 1997; Kurz, Elliott, Wehby, & Smithson, 2010). Several studies reported correlations ranging from .11 to .20 (e.g., Comber & Keeves, 1973; Husén, 1967) between teachers’ content coverage and student achievement in mathematics across multiple countries. In their meta-analysis, Scheerens and Bosker (1997) also reviewed 19 studies focused on teachers’ content coverage of tested content and reported an average Cohen’s d ES of 0.18.
Finally, research on the quality dimension of OTL has been mostly based on evidence-based IP. Walberg (1986), for example, reviewed 91 studies that examined the effect of quality indicators on student achievement, such as frequency of praise statements, corrective feedback, classroom climate, and instructional groupings. He reported the highest mean ESs for (positive) reinforcement and corrective feedback (ES = 1.17 and 0.97, respectively). Numerous other studies have included SWD. Based on the results from a meta-analysis of intervention studies for students with learning disabilities, for example, Swanson (2000) identified a combined strategy instruction and direct instruction model as an effective instructional procedure for positively influencing academic performance of students with learning disabilities (ES = 0.84).
Other OTL indices related to instructional quality that have been considered include instructional resources such as access to textbooks, calculators, and computers (e.g., Herman, Klein, & Abedi, 2000). Besides equipment use and availability of textbooks, researchers have also discussed numerous other indicators of quality associated with student achievement, such as teacher expectations for student learning, progress monitoring, and corrective feedback (e.g., Porter, 2002).
Research on CBM as a Predictor of Student Achievement
CBMs are brief assessments with test administration times generally ranging from 1 to 15 min. Originally developed for monitoring special education students’ response to different interventions across brief time periods (e.g., 6 weeks), CBMs allow repeated, within-year assessments of student achievement within an academic area (Deno, 1985). However, unlike teacher-constructed tests to assess student progress within a school year, CBMs are designed to (a) be technically adequate (i.e., reliable and valid), (b) sample widely from what a child is expected to learn across the year, and (c) be of equivalent difficulty across forms or measures (Stecker, Fuchs, & Fuchs, 2005).
Much of the initial CBM research focused on its use in assessing children’s reading skills (Marston, Mirkin, & Deno, 1984). Since that time, a body of research also has emerged supporting its utility in mathematics instruction, particularly in terms of predicting outcomes on summative measures of mathematics achievement. For example, Jiban and Deno (2007) found that the combined scores from two 1-min math facts CBM probes were moderately related to student state math test scores in third and fifth grade (.38–.59). Foegen (2008) reported that the mathematics concepts and applications probes from the Monitoring Basic Skills Progress CBM system (Fuchs, Hamlett, & Fuchs, 1999) were highly correlated (.71–.87) with middle school total math scores on the Iowa Test of Basic Skills. More recently, using the same measure as implemented in the current study, Nese et al. (2010) examined the predictive validity of easyCBM© National Council of Teachers of Mathematics (NCTM) measures for assessing student mathematics achievement on two states’ large-scale mathematics tests. They compared the fall and winter measures with spring 2010 administrations of the mathematics portion of the Oregon Assessment of Knowledge and Skills (OAKS) and the mathematics portion of the Measures of Student Progress (MSP) in the state of Washington. The sample included approximately 3,600 students per grade level in Oregon and 650 students per grade level in Washington. Results indicated regression models using fall and winter CBM scores as predictors accounted for 58% to 73% of the variance in OAKS math test scores, and 56% to 72% of the variance in MSP math test scores, with variance accounted for generally increasing with grade level.
Nese et al. (2010) also explored the predictive utility of within-year growth estimates, split by quartile, as well as the diagnostic efficiency of the tests for predicting whether or not students would meet proficiency on the Oregon state test. For students in the bottom quartile of normative performance, standardized coefficients for the predictive utility of the slope ranged from .47 to .82. For students in the second quartile, standardized coefficients ranged from .39 to .65. Finally, for students in the third quartile, standardized coefficients ranged from .38 to .83, and for students in the fourth quartile, standardized coefficients ranged from −.47 to .63 (the negative growth results were isolated to one grade in one state, and were likely sample specific). These coefficients imply that for every standard deviation increase in CBM scores, there was a corresponding increase of approximately .5 to .75 standard deviation increase in OAKS scores.
Research Questions and Expected Outcomes
Given the OTL practice concerns and policy context for SWD, the present study was motivated to explore answers to three questions:
To answer these questions, we had a volunteer sample of teachers in Arizona and Oregon schools (a) record via MyiLOGS their IT, content, CP emphasized, IP used, and GFs used and (b) administer online easyCBM© interim assessments to their students with and without disabilities on four occasions (September, December, February, and May). The MyiLOGS variables and special education status were used in a multilevel longitudinal model to explore their relationship with students’ mathematics achievement growth within the school year.
Based on the previous research on OTL and CBMs, coupled with our understanding of SWD’s learning, we expected that the instructional processes would be different (e.g., less IT on standards and cover less of the intended curriculum) for SWD, in comparison with SWOD in the same classrooms. Second, we also expected the OTL indices would meaningfully contribute to understanding growth in CBM mathematics scores and end-of-year achievement of students with and without disabilities.
Method
Design
This study was part of a larger exploration of general education teachers’ IP for students with and without disabilities. All the volunteering teachers received substantial training in logging their daily instruction for a given mathematics class. These teachers were cognizant that the reliability of their logging was important given they (a) had to pass a rigorous performance test with the logging software before using it and (b) were observed monthly throughout the entire school year by independent observers during an entire mathematics class. Given this was a descriptive study, rather than an intervention study; there was not a control or comparison group of teachers involved. These teachers, however, did record IP one day per week throughout the school year for a random sample of two students with and two SWOD. The details for this design follow.
Participants
Teachers (N = 78; 49 Arizona, 29 Oregon) from general education classrooms in Grades 4 through 8 in 18 Arizona and Oregon schools participated for an entire academic year. The schools were from nine school districts within 50 miles of a major university. All 92 teachers in Grades 4 through 8 from these schools were invited to participate. Of these 92 teachers, 83 volunteered to participate, but five dropped out during the MyiLOGS training phase do to difficulty in passing the required performance test or time requirements needed to learn how to use MyiLOGS. The final sample of teachers was representative of mathematics teachers at these grade levels in the selected schools; 90% female and with more than 3 years of experience teaching. All general education teachers who had two or more SWD on their class rosters were invited to participate via a research announcement sent to their school in August. As a result, teachers volunteered and were paid monthly for their data collection efforts once they demonstrated they could use MyiLOGS software reliably and knew how to access and use easyCBM©.
Students (N = 304; 188 Arizona, 116 Oregon) who participated were all in the classrooms of the teachers who qualified for the study and were grouped into two grade clusters (elementary Grades 4 and 5; secondary Grades 6 through 8). Of the total sample of students, 150 (52 in elementary cluster and based on district estimates 37 had learning disability [LD], two had emotional disturbance [ED], nine had speech-language disability [SLD], and four specific disability undetermined from existing files; 98 in secondary cluster and based on district estimates 70 were LD, nine ED, 11 SLD, and eight specific disability undetermined from existing files) were identified as SWD; that is, they had an Individualized Education Program (IEP) indicating they had a learning disability, emotional disturbance, or a speech-language disability. The remaining 154 students (53 in elementary cluster; 101 in secondary cluster) were not known to have a disability and were thus characterized as SWOD. Students in the SWD and SWOD groups received mathematics instruction in the same classroom and were selected from their class roster by their teachers, who used a common stratified random sampling procedure to identify students. Specifically, the SWD sample was selected at random from class rosters using the following process: (a) Teachers with a last name starting with A–M selected the first two SWD on their roster and (b) teachers with a last name starting with N–Z selected the last two SWD on their roster. The SWOD sample represented the fifth- and 11th-named student on the same class rosters but without disabilities. The resulting balanced sample of students with and without disabilities was representative of students in these two states with regard to gender, but not race in that there were significantly more non-White participants (81% in Arizona and 58% in Oregon).
Measures and Procedures
MyiLOGS®
This online measure (www.myilogs.com) is designed to assist teachers with the planning and implementation of intended curricula at the class and student levels. To this end, MyiLOGS provides teachers with a monthly instructional calendar that includes an expandable sidebar that lists all intended standards for a class. Teachers are expected to daily drag and drop standards that are the focus of lesson plans onto the respective Calendar Days and indicate the approximate number of minutes dedicated to each standard. After the lesson, teachers are required to confirm enacted standards, IT dedicated to each standard, and any time not available for instruction at the class level. In addition, one randomly selected Detail Day per week required further documentation for their two SWD and two SWOD; in other words, the day of each week when teachers recorded their detailed instruction actions varied throughout the school year so there was an equal likelihood of the day being a Monday, Tuesday, Wednesday, Thursday, or Friday. The Detail Days when teachers recorded instructional actions relative to their target students was the same day for all teachers in Arizona and Oregon. On these Detail Days, teachers reported on additional time emphases related to the standards listed on the calendar including cognitive expectations, IP, GFs, and time not available for instruction.
The instructional data collected via MyiLOGS were used to derive several OTL indices along each enacted curriculum dimension. First, IT was specified using three separate indices: (a) IT spent on state academic standards (Time on Standards), (b) IT spent on custom objectives (Time on Custom), and (c) non-IT (Non-Instructional Time). These time-based indices were calculated based on average minutes per day and as average percentages of allocated class time. The latter convention was used to allow for comparability between classes that differed in allocated class time. In the present study, we combined time on state academic standards and time on custom objectives to create an IT index. Second, the content coverage index (Content Coverage or CC) was based on the percentage of state-specific academic standards a teacher addressed for at least 1 min or more throughout the entire logging period. Finally, all time-based and content-based OTL indices were calculated on the basis of calendar days and detail days with the former representing the largest set of data points. Quality-related indices were based on IT emphases allocated to the various CP, IP, and GFs. Given the focus on high-order thinking skills, evidence-based IP, and GFs other than whole class, end-of-year summary scores were calculated for CP, IP, and GF reflective of the respective emphases. The CP, IP, and GF scores range between 1.00 and 2.00, which simply indicates a proportion of time spent on one of two categories. Specifically, CP represents a score between 1.00 and 2.00, which represents the proportion of time spent on higher order processes. For example, a CP score of 1.55 based on a 60-min math class indicates that a teacher typically spends about 55% of the allocated class time expecting high-order cognitive process during instruction (i.e., about 33 min per day). An IP Score between 1.00 and 2.00 represents the proportion of time spent on evidence-based IP. For example, an IP score of 1.80 based on a 90-min English class indicates that a teacher typically spends about 80% of the allocated class time using certain evidence-based practices during instruction (i.e., about 72 min per day). A GF score between 1.00 and 2.00 represents the proportion of time spent using individual and/or small GFs. For example, a GF score of 1.10 based on a 60-min math class indicates that a teacher typically spends about 10% of the allocated class time using individual and/or small GFs during instruction (i.e., about 6 min per day).
The reliability and validity of MyiLOGS scores has been examined in a number of studies (e.g., Kurz, Elliott, Kettler, & Yel, 2014; Kurz, Elliott, Lemons, et al., 2014). The evidence indicates that (a) MyiLOGS has high usability, (b) its quarterly summary scores are relatively consistent across time, and (c) summary scores based on randomly sampled days of 10 to 20 log days can provide reliable estimates of teacher’s respective yearly summary scores. Agreements between log data from teachers and independent observers were comparable to agreements reported in similar studies. Moreover, the OTL IT and CC scores exhibit moderate correlations with achievement and virtually non-existent correlations with a curricular alignment index.
All teachers had to complete a training course and pass both a knowledge test and a performance test. Then, to estimate the extent to which teachers’ log data represented a valid account of their classroom instruction in this study, we used (a) bi-weekly procedural fidelity data and website user statistics across 30 weeks of instructional logging and (b) agreement percentages between teachers and trained classroom observers.
MyiLOGS observations
To establish the reliability of teachers’ MyiLOGS logging reports, teachers in both states were observed, on average, 6 times during the school year. Trained observers used an observation form that mirrored both two-dimensional matrices used in the MyiLOGS software to code the dominant cognitive process and instructional practice observed during 1-min intervals for an entire class period. For training purposes, observers had to obtain an overall agreement percentage of 80% or higher on two consecutive 30-min sessions. Cell-by-cell agreement was calculated for each matrix based on cell estimates within a 3-min range or less. For each matrix, inter-observer agreement was calculated as the total number of agreements divided by the sum of agreements and disagreements. In addition, overall agreement was calculated as the total number of agreements across both matrices divided by the sum of agreements and disagreements across both matrices. Overall agreement was used in establishing the training (at or above 80%) and retraining criteria (below 80%) for observers.
Observation sessions in actual classrooms lasted for the entire class period. All agreement percentages between teachers and observers were calculated based on detail days at the class level related to five cognitive process expectations per standard/objective and nine IP per three GFs. Across sessions, agreement between teachers and observers for CP per standard/objective averaged 54%. Across sessions, agreement for IP per GF averaged 78%. Overall agreement between teachers and observers across sessions ranged between 63% and 87% with an average of 73%. Inter-observer agreement was estimated periodically throughout the study. These occurred in a random sample of 15 classrooms and resulted in inter-observer agreement percentages ranging between 82% and 100% with an average of 94%. In the context of prior validity research using teacher logs, Camburn and Barnes (2004) reported agreement percentage between teachers and observers that ranged between 37% and 75% with an average agreement of 52%. The current findings thus exceeded prior research. The current study’s gap in average agreement between teachers and observers (i.e., 73%) and two observers (i.e., 94%) is most likely related to differences in methods. That is, both observers used the same 1-min interval recording method to gather OTL data, whereas teachers gathered OTL at the end of each day.
easyCBM©
This set of online interim assessments provided teachers with brief tests aligned with the NCTM mathematics standards. Each assessment form was comprised of 48 multiple-choice items. We used four equivalent forms of the assessments within each grade. Within grade, form difficulty has been equated using item response theory (IRT). The easyCBM© forms are not equated across grades, however, and are not on a vertical scale. To facilitate comparisons of students’ achievement within and across grades, we standardized easyCBM© scores within each grade. Because our interest was in academic growth within the year, we computed standard scores with a mean of 500 and a standard deviation of 100 based on September mean and SD within each grade. Thus, a score of 600 at any occasion within any grade would indicate a performance one SD higher than the average fall score for that grade.
The internal consistency of the easyCBM© NCTM Math measures has been documented by Anderson, Lai, et al. (2010) and Nese et al. (2010), using Cronbach’s alpha and split-half reliability analyses. For all time points and grades in each study, Cronbach’s alpha ranged from .78 to .91, indicating acceptable to high reliability. For split-half reliability, coefficients ranged from .71 to .89, with a median of .82, which indicated acceptable to high reliability. Overall, this measure predicts 50% to 65% of the variance in end-of-year mathematics achievement measures.
State mathematics achievement tests
Participating students took their respective state’s mandated 2013 summative assessment. The versions of the mathematics test in both Arizona and Oregon had been in use for 4 years and used for student and school accountability. The reliability and validity evidence for the Arizona Instrument for Measuring Standards (AIMS) is reported at http://www.azed.gov/assessment/azmerit/ and for the OAKS it is reported at (http://www.oaks.k12.or.us/portal/). Both of these state assessments met the technical standards mandated by the U.S. Department of Education and monitored by established Technical Advisory Committees within each state.
Data Analysis
Descriptive analysis of the five MyiLOGS instructional indices (IT, CC, CP, IP, and GF), easyCBM achievement scores for testing times 1 to 4, along with grade cluster (Elementary 4–5 and Secondary 6–8), and disability status (SWD or SWOD) are reported. These descriptive analyses provided evidence to test our first prediction. To test our section prediction, these variables were analyzed using two-level unconditional hierarchical linear modeling (HLM) models and two multiple regression analyses to examine the influence of variables on interim and end-of-year achievement as measured by either the Arizona state test (AIMS) or the Oregon state test (OAKS). The HLM approach is a complex form of an ordinary least squares regression used to analyze variance in the outcome variables (mathematics test scores) when the predictor variables (OTL indices, grade cluster, and special education status) are at varying hierarchical levels, that is, students nested in a classroom share variance according to their common teacher and common classroom.
Results
Teachers in Arizona reported on their IT and content standards coverage an average of 163.8 days and provided detailed instructional data for two target students with and two without disabilities for a random subset of 40.7 days, on average. The Oregon teachers reported on their IT and content standard coverage an average of 158 days and provided detailed instructional data for their four target students with and without disabilities for a subset of 43.8 days, on average. This instructional data, respectively, represented 91% and 87.8% of the possible school days in Arizona and Oregon during the 2013–2014 academic year.
Each teacher was observed a minimum of 5 times during the school year on a day when they record instructional details for their entire class and the four target students. As noted earlier, these observations provided evidence that teachers’ self-reports regarding instructional actions with both students with and without disabilities were moderately reliable when compared with highly trained observers.
Descriptive Statistics
Descriptive statistics for the Arizona and Oregon subsamples are displayed in Tables 1 and 2, respectively. An examination of these student samples indicates that the elementary (Grades 4–5) subsample in Arizona was relatively small and noticeably smaller than either the Arizona secondary (Grades 6–8) subsample or elementary or secondary students in Oregon schools. Inspection of the MyiLOGS instructional indices indicates there were negligible differences between them for SWD and SWOD subsamples in both Arizona and Oregon. Conversely, we found substantial differences (i.e., ES ≥ 0.75) between the achievement measures of SWD and SWOD for all comparisons.
Descriptive Statistics for Arizona Students.
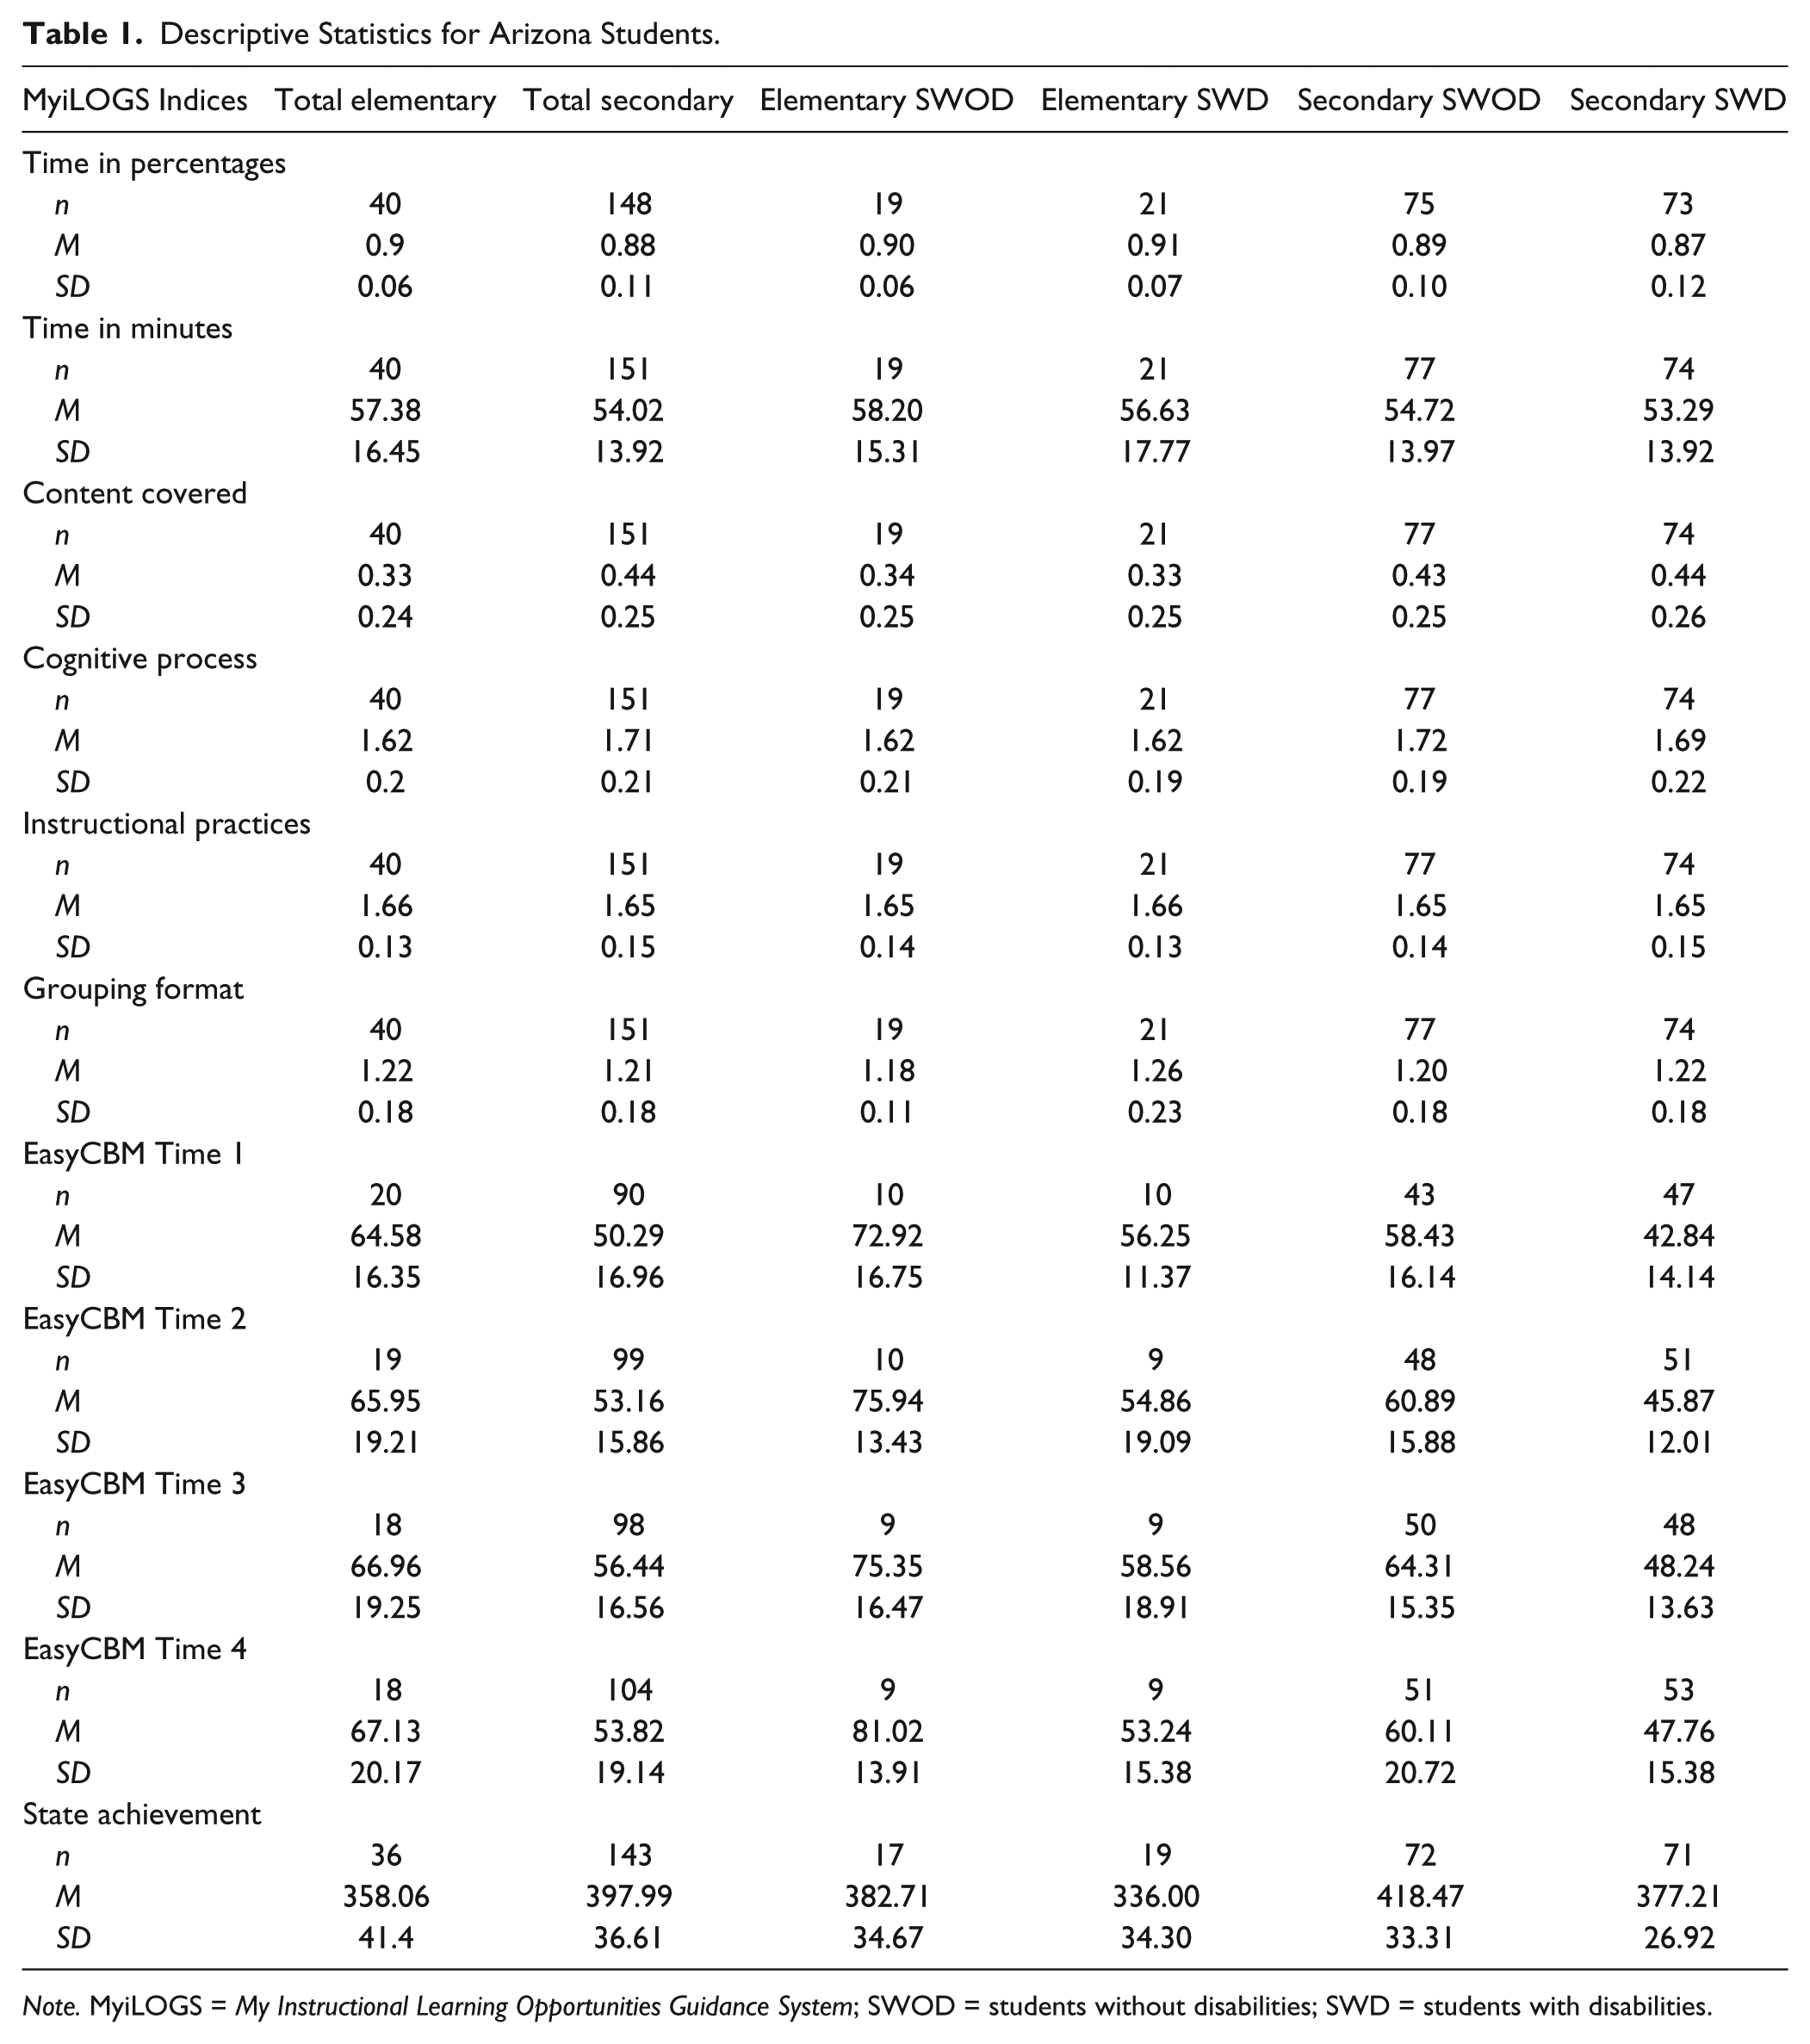
Note. MyiLOGS = My Instructional Learning Opportunities Guidance System; SWOD = students without disabilities; SWD = students with disabilities.
Descriptive Statistics for Oregon Students.
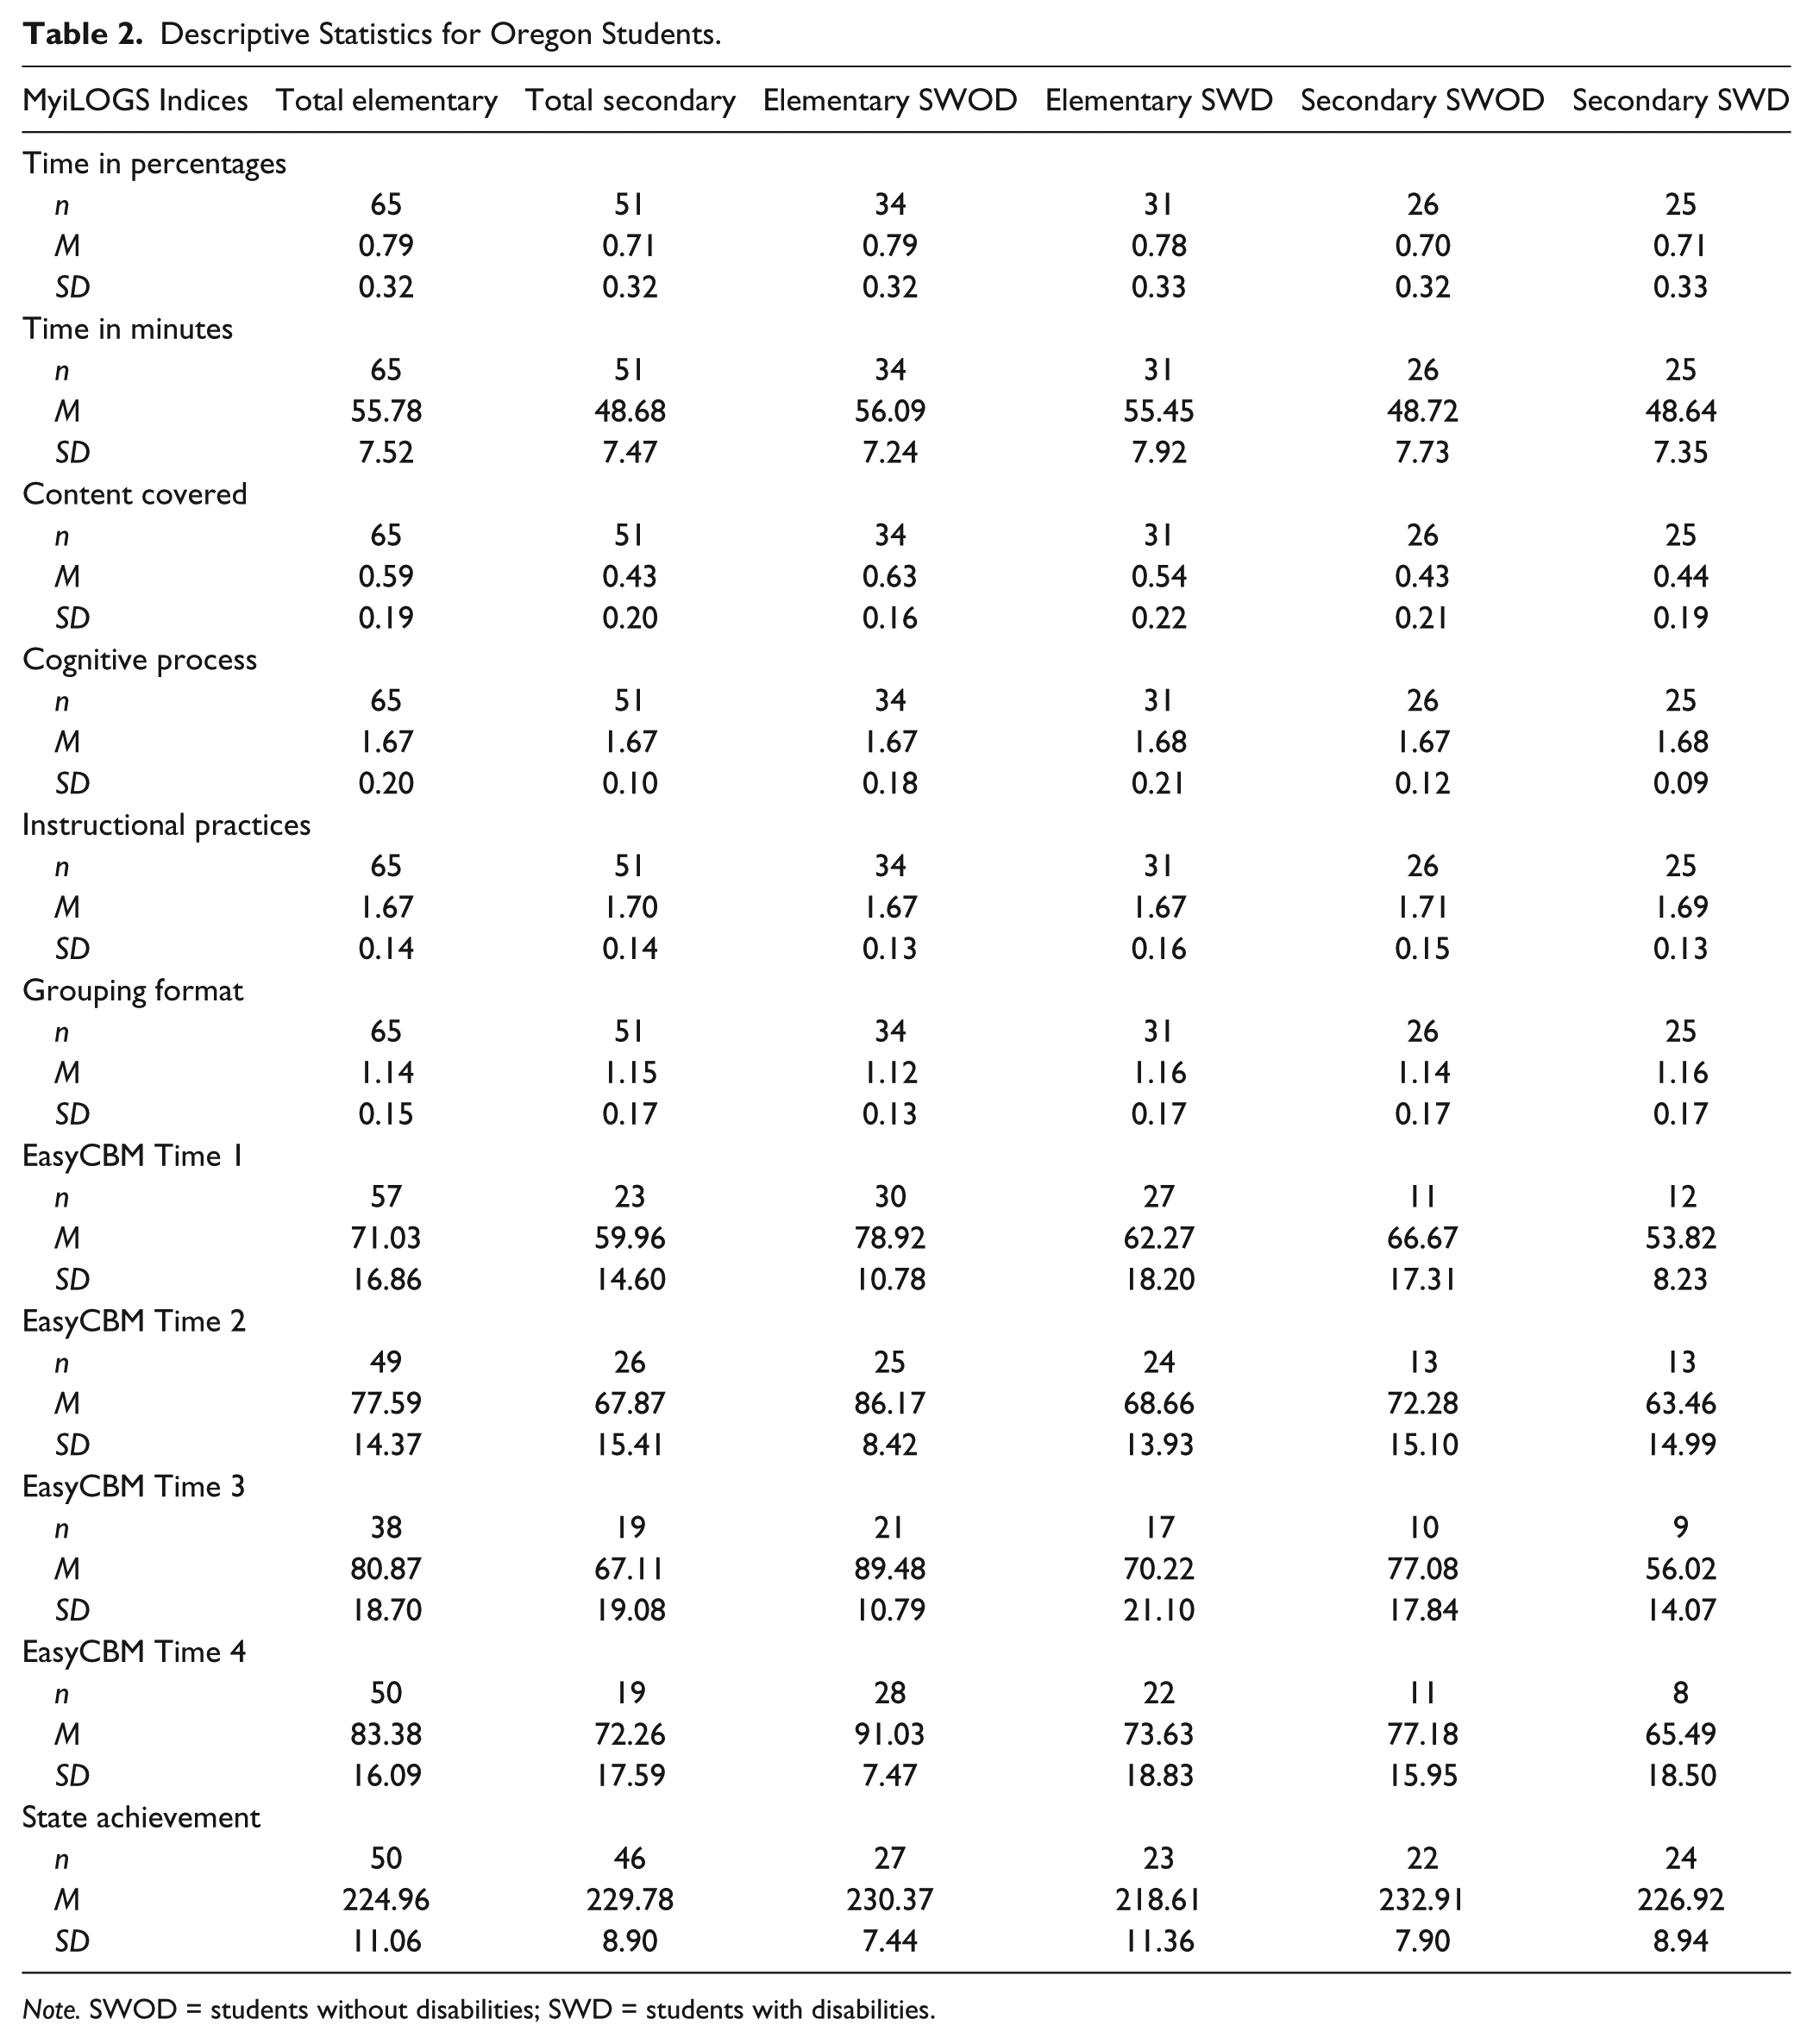
Note. SWOD = students without disabilities; SWD = students with disabilities.
HLM Analysis
The presence of missing data at each of the easyCBM measurement occasions was determined to be missing at random based on Little’s Missing Completely at Random (MCAR) test, χ2(25) = 34.66, p = .095.To address these issues, we used multiple imputations (MI) to estimate missing values for the CBM scores (Enders, 2010). Grade, state, special education status, and all four easyCBM measures were used as predictors in estimating five imputations of missing data. The average of the five imputations was used to replace any missing CBM scores. The resulting CBM mean scores for SWD and SWOD in both states at four assessment occasions are plotted in Figure 1. As indicated in this figure, the SWD group at each measurement occasion within the year performed 10 or more points below the SWOD group on the standardized easyCBM score.
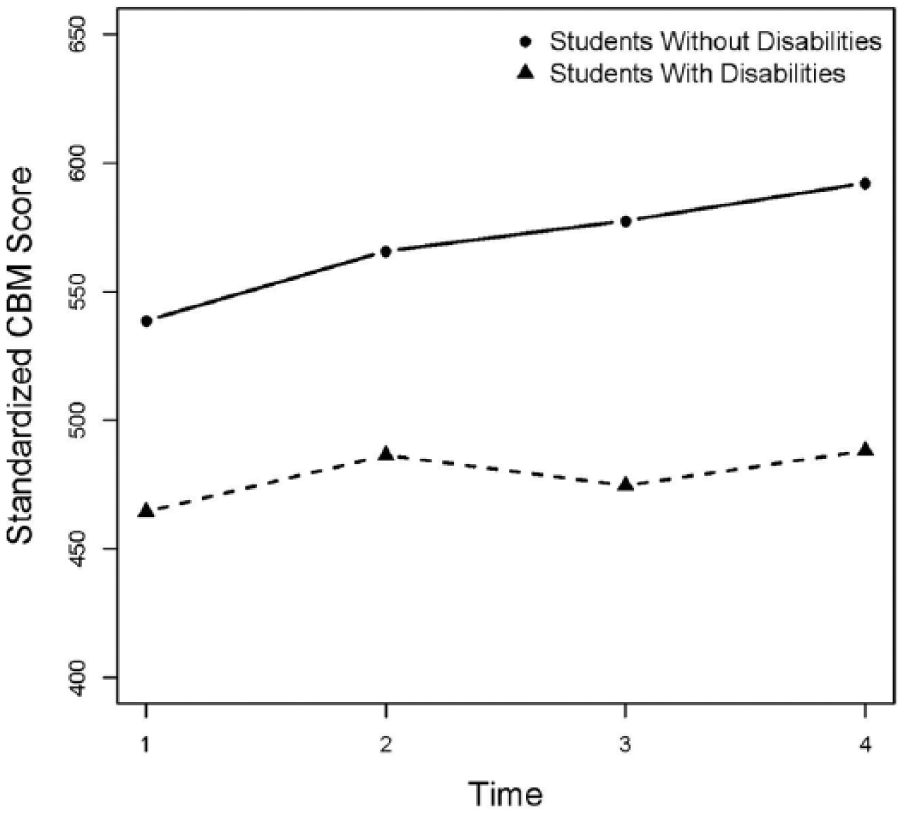
Within year standardized mathematics CBM growth for SWOD and SWD.
After estimating complete CBM data, the HLM program HLM7 with full maximum likelihood estimation was used to estimate two-level hierarchical linear models. Level 1 was comprised of the easyCBM© scores at the four occasions during the year (fall, winter, spring, end-of-year). Because the same measures were used in both states, all students were analyzed together. Level 2 was comprised of individual students and their demographic characteristics. An unconditional two-level HLM analysis was conducted to quantify the proportion of variance at Level 2 and to establish a baseline for model comparison. The intra-class correlation coefficient (ICC) was .499.
Our next step was to evaluate the functional form of the longitudinal model specified at Level 1. Specifically, we ran a linear model that resulted in statistically significant parameters for intercept, slope, and their random effects. We then added a curvilinear term and found that it was not statistically significant (p > .05). A deviance test comparing the curvilinear model to the linear model did not result in a significant reduction in unexplained variance. As a result, we adopted the linear longitudinal model as a baseline for further model comparisons.
Next, we ran a conditional model including grade, special education status, and the five OTL indices as Level 2 predictors of CBM intercepts and slopes. Special education was uncentered; all remaining predictors were grand-mean centered. Equation 1 specifies the Level 1 model:

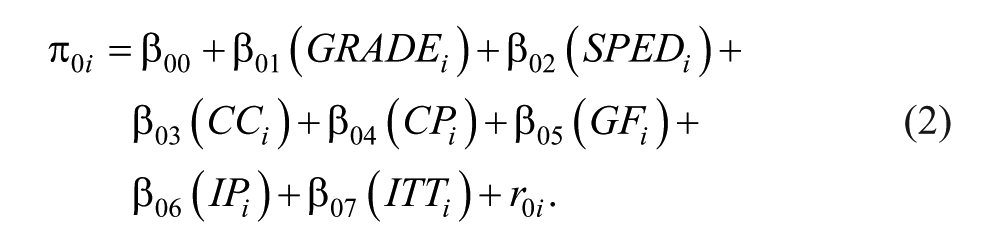
As written, MATH ti is the outcome (i.e., mathematics achievement) at time t for student i, π 0i is the initial fall status of student i, π 1i is the linear growth rate across administration times for student i, and eti is a residual term representing unexplained variation from the latent growth trajectory. The Level 2 model estimated the mean growth trajectories in terms of initial status and growth rate across all students and, as shown in Equations 2 and 3, including the following student level predictors: Grade (lower grade = 0, upper grade = 1), special education status (SWD = 1, SWOD = 0), Instructional Time Total OTL Score (ITT), Content Coverage OTL Score (CC), Cognitive Process OTL Score (CP), Instructional Practice OTL Score (IP), and Grouping Format OTL Score (GF). Equations 2 and 3 specify the Level 2 model:
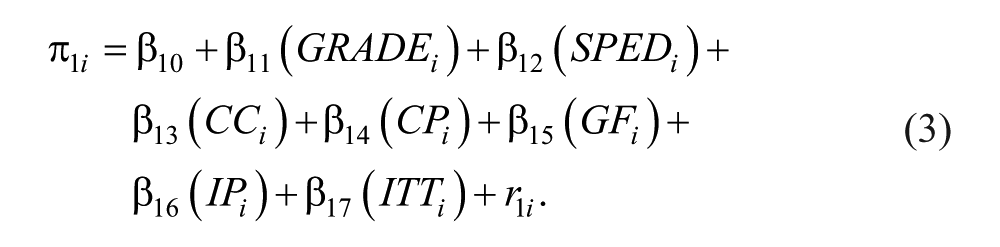
The conditional model was compared with the unconditional longitudinal model using a deviance test. The conditional model resulted in a significant reduction in unexplained variance, χ2(14) = 113.14, p < .001. The conditional model results are presented in Table 3. The intercept of 533.00 represents the average standardized CBM score for lower grade students (Grades 4 and 5), SWOD, and students with average values on the OTL predictors. It can be seen that special education status was the only statistically significant predictor of initial status with SWD scoring on average, almost 72 score points lower than SWOD. This represented almost three quarters of an SD lower performance for this group at the initial fall assessment.
Two-Level Conditional Model for easyCBM Arizona and Oregon.

p < .05. **p < .001.
The average increase of about 21 points per measurement occasion was statistically significant t(296) = 4.17, p < .001. Special education status was also a statistically significant predictor of growth. Of the OTL predictors, only IP was a significant predictor of student growth rate, t(296) = 2.28, p < .05. For every 10th of a point increase in IP score, on average the CBM score was about 3.3 points higher.
Inspection of the random effects showed there was significant variation in the value for student intercepts (p < .001) even after inclusion of the conditional model predictors. The variance components from the conditional model were compared with the initial unconditional longitudinal model variance components through calculation of pseudo-R2. We found an R2 of .489 for intercepts indicating the predictors in the conditional model accounted for substantial proportions of the variance in model parameters over the unconditional longitudinal model.
Multiple Regression Analyses
We conducted multiple regression analyses separately for each state investigating the relations between state math test performance, grade, special education status, and the five OTL predictors. The separate analyses were necessary because the two states used different testing programs, procedures, and tests.
Arizona sample results
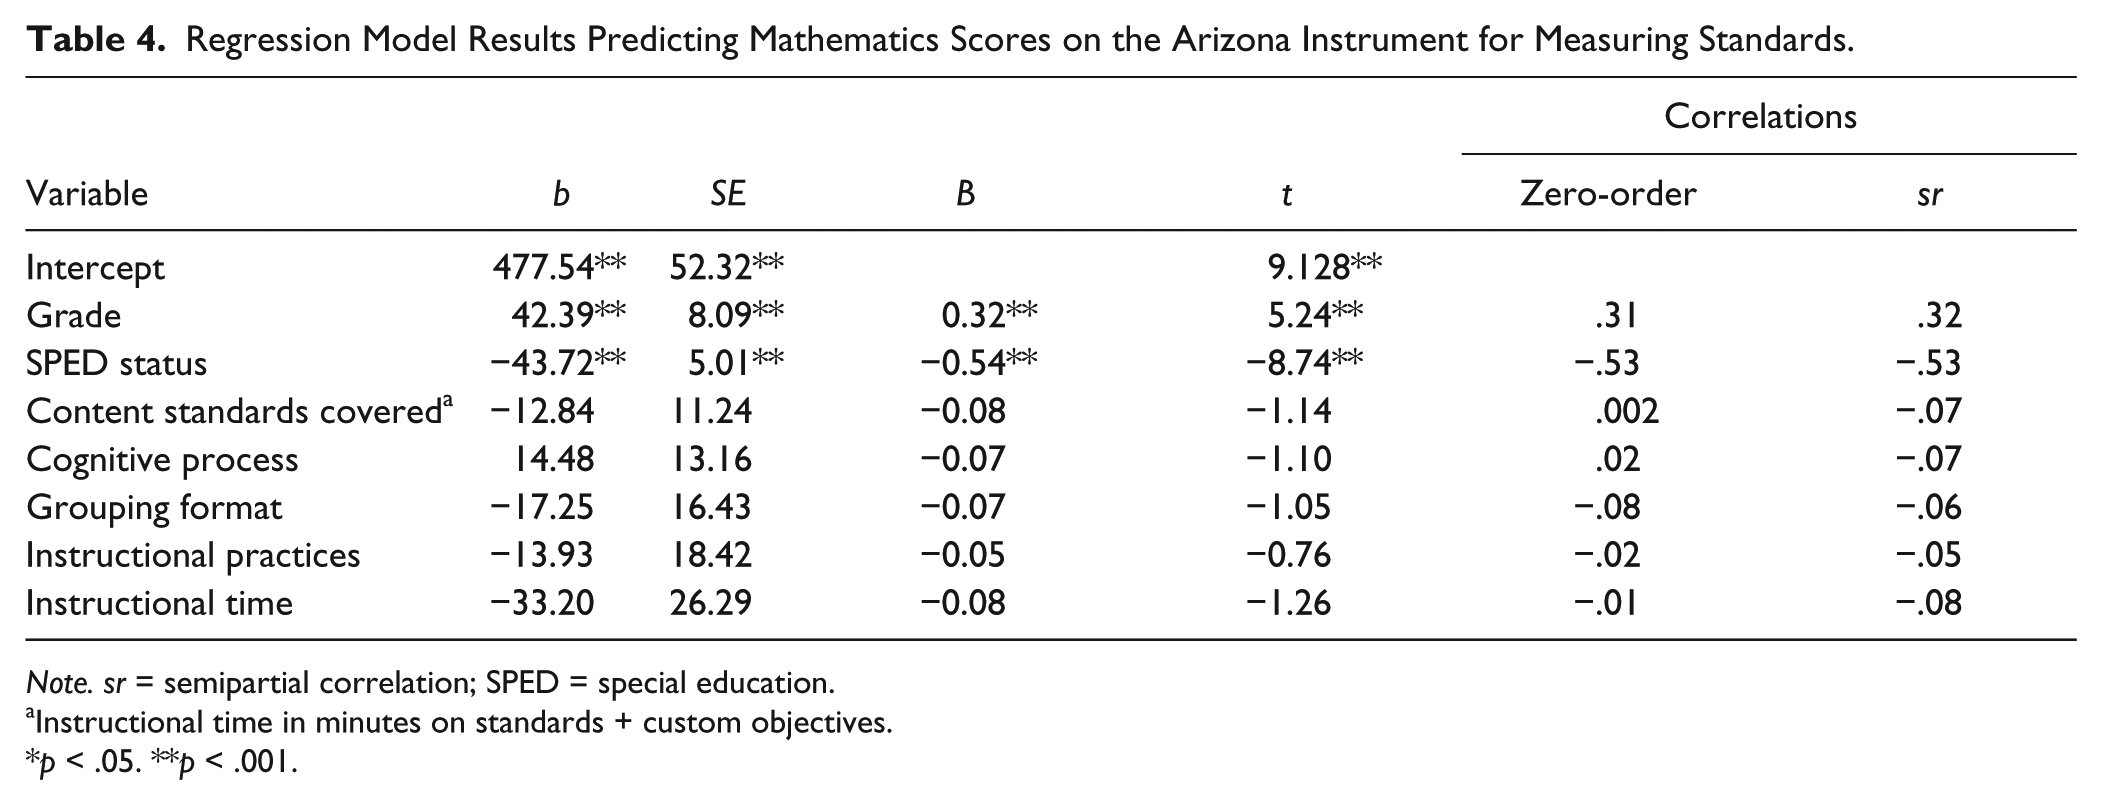
The regression analysis for the Arizona general education classrooms was statistically significant, F(7, 169) = 15.338, p < .001, accounting for nearly 39% of the variance in students’ end-of-year mathematics achievement as measured by the Arizona Instructional Measurement of Skills test (see Table 4). Detailed regression results are presented in Table 4 for each of the seven-predictor variables for the Arizona sample of classrooms. As with the multilevel analysis, we centered all predictors except the dichotomous special education status variable. As can be seen in Table 4, grade cluster and special education status were both statistically significant predictors (p < .001) of mathematics scores with SWD scoring about 44 scale score points lower than SWOD students, controlling for all other variables. None of the five OTL predictors was a statistically significant predictor of the Arizona state math score.
Regression Model Results Predicting Mathematics Scores on the Arizona Instrument for Measuring Standards.
Note. sr = semipartial correlation; SPED = special education.
Instructional time in minutes on standards + custom objectives.
p < .05. **p < .001.
Table 4 also shows semipartial correlation for each predictor; the correlation between the unaltered criterion mathematics score and a given predictor residualized with respect to all other predictors. When squared and multiplied by 100, the semipartial correlation indicates the percentage of the criterion variable associated uniquely with the predictor. Thus, in our sample, grade cluster accounted for over 10% of the variance in mathematics score, special education status accounted for about 28%, and the OTL measures as a group accounted for about 2.2% of the variance in students’ end-of-year mathematics achievement.
Oregon sample results
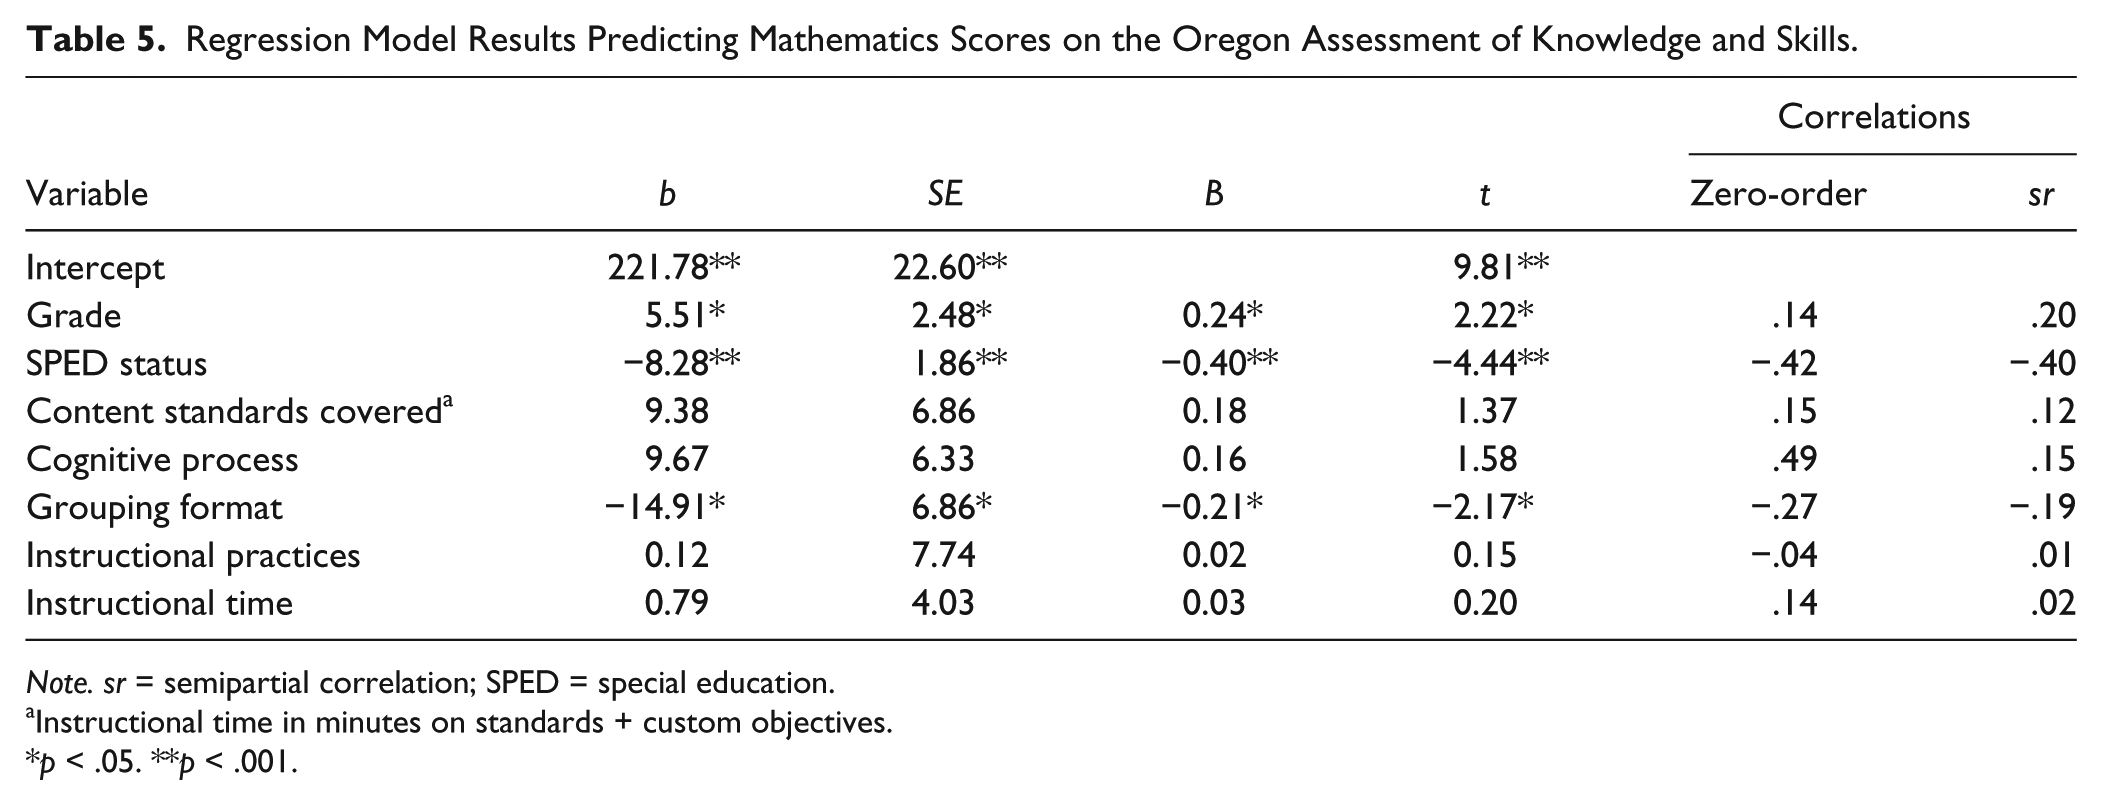
The same multiple regression analysis was conducted with the Oregon sample as well. The regression analysis was statistically significant, F(7, 88) = 5.303, p < .001, accounting for 30% of the variance in students’ end-of-year mathematics achievement as measured by the OAKS in Mathematics test (see Table 5). The detailed regression results are presented in Table 5 for each of the seven-predictor variables in the regression model. As with the Arizona model, we centered all predictors except special education status. Grade cluster and special education status of the Oregon students were both statistically significant predictors (p < .05 and p < .001) of mathematics scores with SWD scoring about 8.3 scale score points lower than SWOD students, controlling for all other variables. In this sample, one of the five OTL predictors, GF, was a statistically significant predictor of state mathematics test score (p = .032). A one tenth of a point increase in GF was associated with a 1.5-point decrease in test score, suggesting that students experiencing difficulty with mathematics received more of their instruction in small groups or individually although it may not have helped in terms of test performance. Inspection of semipartial correlations showed that grade cluster accounted for 4% of the variance in OAKS scores, special education status accounted for 16%, and the OTL measures as a group accounted for 7.4% of the variance in students’ end-of-year Oregon mathematics achievement.
Regression Model Results Predicting Mathematics Scores on the Oregon Assessment of Knowledge and Skills.
Note. sr = semipartial correlation; SPED = special education.
Instructional time in minutes on standards + custom objectives.
p < .05. **p < .001.
Discussion
This correlational, yearlong study explored the equality of instructional processes and achievement gaps between students with and without disabilities receiving all their mathematics instruction in the same general education classrooms where the same grade-level content standards were taught. In addition, we explored the relations among OTL scores, interim CBM scores, and end-of-year mathematics achievement scores in these inclusive classrooms. We expected to find, on average, differences in the mathematics test performances of students with and without disabilities as measured by both interim and summative assessments. We also expected, based on previous research, to find that these differences in test performances would be associated with some differences in the instructional processes with SWD receiving less IT and taught less content than classmates without disabilities in the same general education classroom.
Key Findings
As expected, we observed the achievement gaps between students with and without disabilities on the four interim CBM assessments and the end-of-year achievement state tests. However, we did not find significant differences in the instruction afforded these two groups of elementary and secondary students in either Arizona or Oregon classrooms. To the contrary, over the course of an entire school year, teachers in both states reliably reported very similar OTLs the intended mathematics curriculum standards for students in general education classrooms, regardless of disability status. Specifically, elementary teachers reported spending slightly more time (approximately 85%) than secondary teachers (approximately 81%) providing instruction on the Common Core State Standards (CCSS) and custom mathematics standards; collectively, the elementary and secondary teachers reported covering approximately 45% of the intended content standards within the allocated IT. Within the grade levels studied, teachers also reported the CP emphasized, IP used, and GFs employed were not significantly different for students with and without disabilities.
The failure to find significant differences in the OTL indices for SWD and SWOD students was consistent with the previous year’s investigation in many of these same classrooms. These findings, however, are at odds with one previous research report that documented statistically significant differences for instructional indices concerning time, content covered, cognitive practices, and IP with SWD and SWOD groups (e.g., Kurz, Elliott, Kettler, & Yel, 2014). The teachers in the present study were aware that one of the purposes of the study was to understand potential differences in instruction for students with and without disabilities, whereas in the earlier Kurz, Elliott, Kettler, and Yel (2014) study this purpose may not have been as salient to most teachers because they were observed significantly less often and the MyiLOGS training was not as focused on SWOD. Regardless, teachers in neither study experienced any external consequences for the specifics of their instructional actions or reports of them.
With regard to the prediction of end-of-year achievement, we found that grade cluster and special education status, along with the five OTL indices, accounted for 30% to 38% of the variance in student’s end-of-year mathematics scores. Detailed examination of the analyses indicated that OTL indices, however, explained a relatively small portion of the unique variance in the end-of-year mathematics scores. The results suggest additional sources of variance need to be identified to better understand the variability in students’ end-of-year achievement test scores.
Limitations and Future Research
Although this study utilized appropriate analysis to address hierarchical nesting effects of classrooms and provides new descriptive evidence about daily instruction and mathematics achievement for SWD in inclusive general education classrooms, its findings are constrained by several limitations. First, the power and generalizability of its findings are limited by a relatively small sample of elementary students in one state and moderate levels of reliability (as operationalized by agreement between teachers and observers) for MyiLOGS Detail Day reports. Second, more special details on the nature of the students’ disability relative to the content area studied—that is, mathematics, language arts, and so forth—would be helpful. Finally, the lack of documentation within the MyiLOGS software for the complexity and length of instructional materials and tasks for SWD resulted in no evidence about an instructional action commonly used to differentiate instruction and better support the learning needs of SWD. The complexity or length of instructional material and tasks is a likely source of variance among students with and without disabilities and should be directly measured in future studies with the recently revised MyiLOGS indices.
Future researchers are encouraged to increase the number of students selected for detailed instructional process reports, refine the MyiLOGS training so that teachers and observers’ reports are consistently above a rigorous agreement criterion of 80%, and document the nature of the instructional materials and tasks provided to SWD. Finally, multiyear examinations of students’ OTL are also needed to gain insights into its long-term effects on achievement and related gaps.
Conclusion
This study addressed questions about the mathematics instruction of SWD in inclusive general education classrooms in two states. Given the legislative press for instructional equity, but the mixed research findings from previous studies regarding equal OTL for these students, the study was designed to address the following questions: Do students with and without disabilities who received instruction in the same general education classrooms have an equal OTL mathematics? What is the predictive relationship among key OTL variables, grade, and special education status and students’ performance on interim academic measures? What is the predictive relationship among key OTL variables, grade, and special education status and students’ end-of-year mathematics achievement scores on state tests? To answer these questions, we provided a detailed, yearlong examination of instructional process variables and their relationship to students’ achievement in mathematics measured by interim and summative tests.
In answering the first research question, we found nearly equal OTL for both groups of students. However, given that SWD consistently performed lower on both interim and summative measures of mathematics achievement, it may be that these students actually need more rather than equal OTL to close the mathematics achievement gap. This finding confirms a prior research hypothesis by Kurz, Elliott, Lemons, et al. (2014), who argued “providing SWDs and SWODs equal OTL may lead to unequal outcomes for SWDs; in part because the unique learning challenges of SWDs may require they receive more OTL than SWODs to be academically successful” (p. 26).
For the second research question, we found that the OTL indices of IT, CC, IP, and GF, as measured by MyiLOGS, contributed a relatively small amount of variance accounted for in students’ achievement scores. These OTL variables, however, are malleable and under the control of teachers so they hold promise as part of instructional efforts to improve student achievement.
Finally, with regard to our third question, we found that providing SWD the same instruction on the same content standards in the same general education classrooms resulted in the same historic outcomes—large and persistent gaps in achievement—in comparison with SWOD. The findings in this study replicated findings from the previous year of data in these same schools. As a result, they suggest that SWD need more IT on the intended curriculum, and perhaps more differentiated instruction, to increase their rate of achievement enough to close gaps that currently exist between them and SWOD. Such an individualized approach to the instruction of SWD is often planned for and verbally reported but was not observed in the current study of inclusive classrooms for mathematics instruction. More refined measures of instruction and its effects, however, are needed to advance research beyond an examination of instructional differences to differentiated instruction and what it takes to achieve more equitable outcomes for SWD.
Footnotes
Authors’ Note
The study reported is part of a series of research studies examining the achievement growth of students with disabilities conducted by investigators at the National Center on Assessment and Accountability for Special Education (NCAASE). All authors are principal investigators (PIs) or investigators in NCAASE.
Declaration of Conflicting Interests
The author(s) declared the following potential conflicts of interest with respect to the research, authorship, and/or publication of this article: Co-authors Kurz and Elliott are authors of MyiLOGS, the measure of OTL used in this study. Co-author Tindal is a co-author of easyCBM, the interim measure of mathematics achievement used in the study. The U.S. Department of Education (DE) and Institute of Education Sciences (IES) approved these measures for use in this study. The data for both of these measures were collected directly online, and by having all data analysis conducted by Nedim Yel, rather than the authors of MyiLOGS and easyCBM, concerns about bias because of a conflict of interest were addressed. No royalty or other financial benefit from the use of these measures was allowed the authors based on the cooperative agreement with the IES.
Funding
The author(s) disclosed receipt of the following financial support for the research, authorship, and/or publication of this article. The study was funded by the U.S. Department of Education’s Institute of Education Sciences through a cooperative agreement with the University of Oregon via grant number R324C110004.