
Abstract
Instructional choice is a low-intensity strategy that can improve academic engagement. In this study, we investigated the effects of within-activity choices offered during math by third-grade teachers to participating students with behavioral and academic needs. We utilized a professional development model to train teachers to implement instructional choice in the classroom while collecting direct observation data on student’s academic engagement. Teachers were able to implement practices with high levels of integrity and collect momentary time sampling data on one student with high levels of reliability. Using a withdrawal design, we found no clear functional relation between instructional choice and increases in student’s academic engagement. However, some students demonstrated an increase in level upon the introduction of the intervention. Both teachers and students rated the intervention goals, procedures, and outcomes as acceptable. Possible reasons for a lack of treatment effect on student academic engagement are discussed.
Students with and at-risk for emotional and behavioral disorders (EBD) include a broad range of individuals, with 20% of school-aged students having mild-to-severe EBD (Forness, Freeman, Paparella, Kauffman, & Walker, 2012). These students present with a range of behavioral, social, and academic needs (Ennis, Evanovich, Losinski, Jolivette, & Kimball, 2017; Lane, Wehby, Little, & Cooley, 2005). For example, students with and at-risk for EBD are less academically engaged in the classroom than their peers, both typically developing and with disabilities (Wagner & Cameto, 2004). As a result, students with EBD often have low levels of academic engaged time of 50% or less whereas high-achieving students may engage for 75% or more of the time (Johns, Crowley, & Guetzloe, 2008; Kauchak & Eggen, 1993). Furthermore, research suggests students who are low achievers often have low levels of active engagement even when they appear engaged (Shapiro, 2013). Therefore, strategies that seek to increase students’ engagement, in particular their active engagement, have a potential to have positive impact on their academic performance.
Currently, only a subset of students with and at-risk for EBD—less than 1%—are served under the Individuals With Disabilities Education Act (IDEA; 2004) under the eligibility category of emotionally disturbed (National Center for Education Statistics, 2016). Given this small percentage of students identified and receiving special education services, general educators are faced with the challenge of meeting the needs of the majority of students with EBD in general education settings (Kauffman & Landrum, 2018; Walker, Ramsey, & Gresham, 2004). Therefore, it is essential that general educators be familiar with how to effectively and efficiently support the needs of students with and at-risk for EBD in their classrooms.
Students with and at-risk for EBD benefit most from early intervention efforts and early identification as problems not addressed before third grade should be treated as chronic conditions (i.e., they can be treated but not alleviated; Lane & Walker, 2015). Schools have responded to this need by developing and implementing tiered models of support involving a proactive and preventive approach to school discipline, such as school-wide positive behavioral interventions and supports (PBIS; Sugai & Horner, 2002), which focuses on behavioral performance, and comprehensive, integrated, three-tiered models of support (Ci3T; Lane, Oakes, & Menzies, 2010), which focuses on academic, behavioral, and social performance. Typically, tiered systems of support include three levels: Tier 1 to support all students, Tier 2 for students (10%−15%) for whom primary prevention efforts are insufficient (e.g., low-intensity research-based practices), and Tier 3 for students (5%) with multiple risk factors requiring more intensive supports (e.g., functional assessment-based interventions; Lane et al., 2010). These models rely on data-informed decision making, screening all students using academic and behavioral tools to identify those students for whom primary prevention efforts are insufficient. Within this model, low-intensity, classroom management strategies can be used to provide students with increased opportunities to have positive interactions with teachers and peers throughout the school day and more frequent feedback (i.e., corrective or praise) for their behavior (Lane, Menzies, Ennis, & Oakes, 2015; Sugai & Horner, 2006).
Instructional Choice
Instructional choice is one such low-intensity support: a flexible strategy for use as an antecedent or consequence defined as an individual choosing between two or more activities under specific conditions (Jolivette, Wehby, Canale, & Massey, 2001). Instructional choice is a strategy that may serve as a motivating operation for a given task (Laraway, Snycerski, Michael, & Poling, 2003). Providing students with choices in what activity to engage or how to engage in a predetermined activity can both establish the activity as a reinforcer and/or abolish the punishing effects (Michael, 2007). For example, if a student has a choice of where to sit to complete their math work, it is possible that this choice of seat may serve to make the previously punishing activity more reinforcing. Providing instructional choice is a versatile strategy for use in the classroom as choices may be offered to individuals, small groups, or to an entire class throughout the day to promote engagement in classroom activities (Lane, Menzies, et al., 2015). It is important to note that as a motivating operation, a choice offered in the morning is not likely to affect behavior later in the day but has positively affected behavior displayed immediately following the choice offering (e.g., Romaniuk et al., 2002).
Choices implemented in the classroom can be divided into two categories, across-activity and within-activity choices (Dibley & Lim, 1999; Rispoli et al., 2013). Across-activity choices involve giving students a choice of what activities they would like to do (e.g., Would you like to work at the technology station or the listening station today?), in what order they would like to do them, or what future activity they would like to engage in following a required task. Within-activity choices involve giving students a choice of materials, location, or partner for a specified activity (e.g., Would you like to use crayons or color pencils to color you map today?). Results on which type of choice is more effective are mixed. For example, both Dibley and Lim (1999) and Rispoli et al. (2013) found across task choices to be more effective. However, Lane, Royer, et al. (2015) found different participants responded better to different choice types. Instructional choice has been used within a variety of classroom types. Shogren, Faggella-Luby, Bae, and Wehmeyer (2004) conducted a meta-analysis to evaluate the evidence base for implementing instructional choice with students with emotional disturbance (ED), yielding 13 studies that met their inclusion criteria. Collective findings of the studies included in this systematic review indicated the introduction of choice resulted in substantial reductions in problem behavior. More recently, Royer, Lane, Cantwell, and Messenger (2017) conducted a systematic review of the evidence base for instructional choice by applying the Council for Exceptional Children (CEC; 2014) Standards for Evidence-Based Practices in Special Education to the choice literature base for students in K-12 settings, identifying 12 articles utilizing instructional choice. Three studies met all quality indicators and an additional nine met 80% or higher, both signifying the methodological soundness of a given study. Despite 12 studies meeting an 80% criterion, they determined instructional choice to be a practice with insufficient evidence to be determined an evidence-based practice, noting issues such as a small number of participants represented and modest effect sizes.
Of the 12 studies identified by Royer et al. (2017), only three investigated offering choice to elementary students with and at-risk for EBD in math. Jolivette et al. (2001) offered first- and second-grade students with EBD a choice of which task to complete during independent math work (across-activity choice). Using a multiple-baseline across subjects design, results indicated two of the three participants demonstrated increased improved academic and social behaviors. Carson and Eckert (2003) examined the effects of student-selected versus research-based math interventions (across-activity choice) on the number of digits correct per minute of three fourth-grade students. Using an alternating treatment design, results indicated that although students respond differently to different interventions, empirically selected math interventions resulted in increased digits correct per minute. Lannie and Martens (2008) investigated the effects of a self-monitoring intervention with a choice a reward (across-activity choice) for meeting goals on the digits correct per minute and on-task behavior of four fifth-grade students. Using a multiple-baseline across participants design, results indicated the intervention package resulted in increased digits correct per minute. All of these studies explored across-activity choice, with no identified studies evaluating within-activity choice during math—the focus of this study.
Although research has demonstrated the utility of instructional choice for some students with and at-risk for EBD, descriptive studies suggest that without professional development training teachers do not provide choices during instruction as often as they perceive (Jolivette, Stichter, Sibilsky, Scott, & Ridgley, 2002). Furthermore, many students are served by classroom teachers who do not feel equipped to implement effective classroom management strategies (Chesley & Jordan, 2012). Clearly, there is a gap between what is known in the research literature and what practices are routinely being implemented in the classroom (Cook & Cook, 2013).
Purpose
This study addresses three key questions. First, to what extent can general education, third-grade teachers implement instructional choice with integrity with limited researcher support while collecting direct observation data reliably? Second, does a functional relation exist between the introduction of instructional choice and increases in students’ academic engagement under these conditions? Third, to what extent do teachers and students perceive instructional choice as a socially valid intervention, addressing socially important goals, acceptable procedures, and achieving important outcomes?
Method
Participants
Students
Participants included four, third-grade students (three boys) attending two public elementary schools in the Southeast United States (see Table 1). We identified students for possible participation using systematic screening procedures to detect students with or at-risk for behavioral challenges and academic underachievement (screening procedures to follow). Participants were not currently receiving special education services. However, Elle, José, and Phillip (pseudonyms) were participating in Tier 2 academic supports through a prereferral intervention (e.g., within class intervention time for math, small group support for reading), and Carlo and José received services for learning English as a second language (ESL).
Student Demographics.
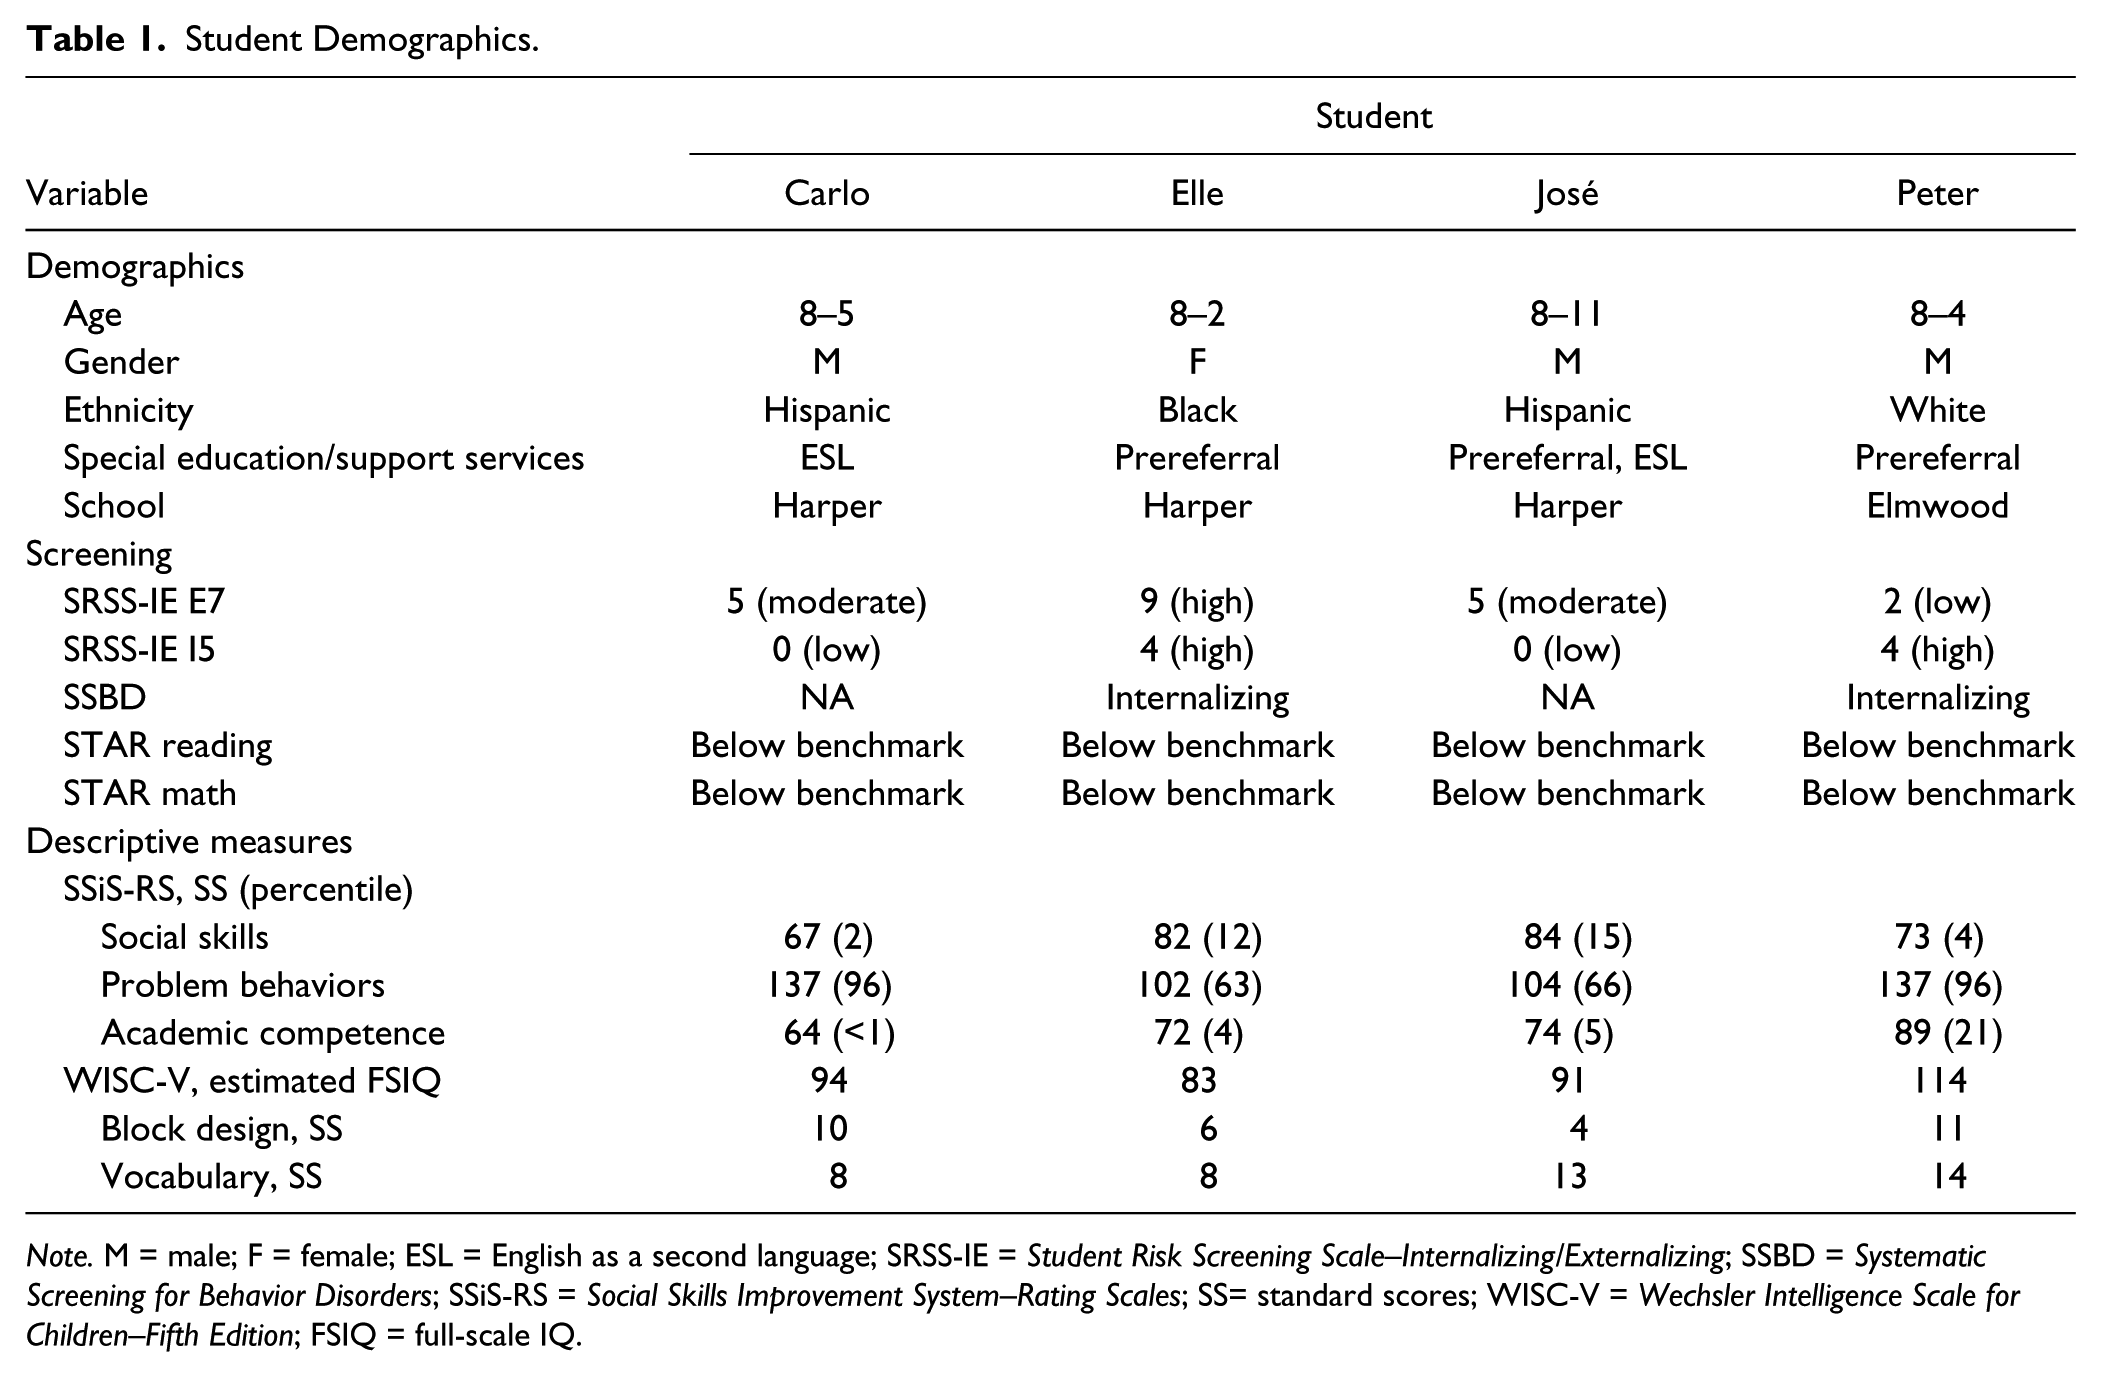
Note. M = male; F = female; ESL = English as a second language; SRSS-IE = Student Risk Screening Scale–Internalizing/Externalizing; SSBD = Systematic Screening for Behavior Disorders; SSiS-RS = Social Skills Improvement System–Rating Scales; SS= standard scores; WISC-V = Wechsler Intelligence Scale for Children–Fifth Edition; FSIQ = full-scale IQ.
Teachers
Teacher participants included four, third-grade teachers serving the identified participating students (see Table 2 for teacher characteristics). All teachers—Chappell (Carlo), Ellison (Elle), Jensen (José), and Perry (Phillip)—were White females and were certified in elementary education, with an average teaching experience of 7.25 (SD = 3.6) years. All teachers reported they had taken a classroom management course as a part of their degree coursework. All teachers had some prior knowledge of and confidence using low-intensity strategies, including instructional choice.
School/Teacher Demographics.
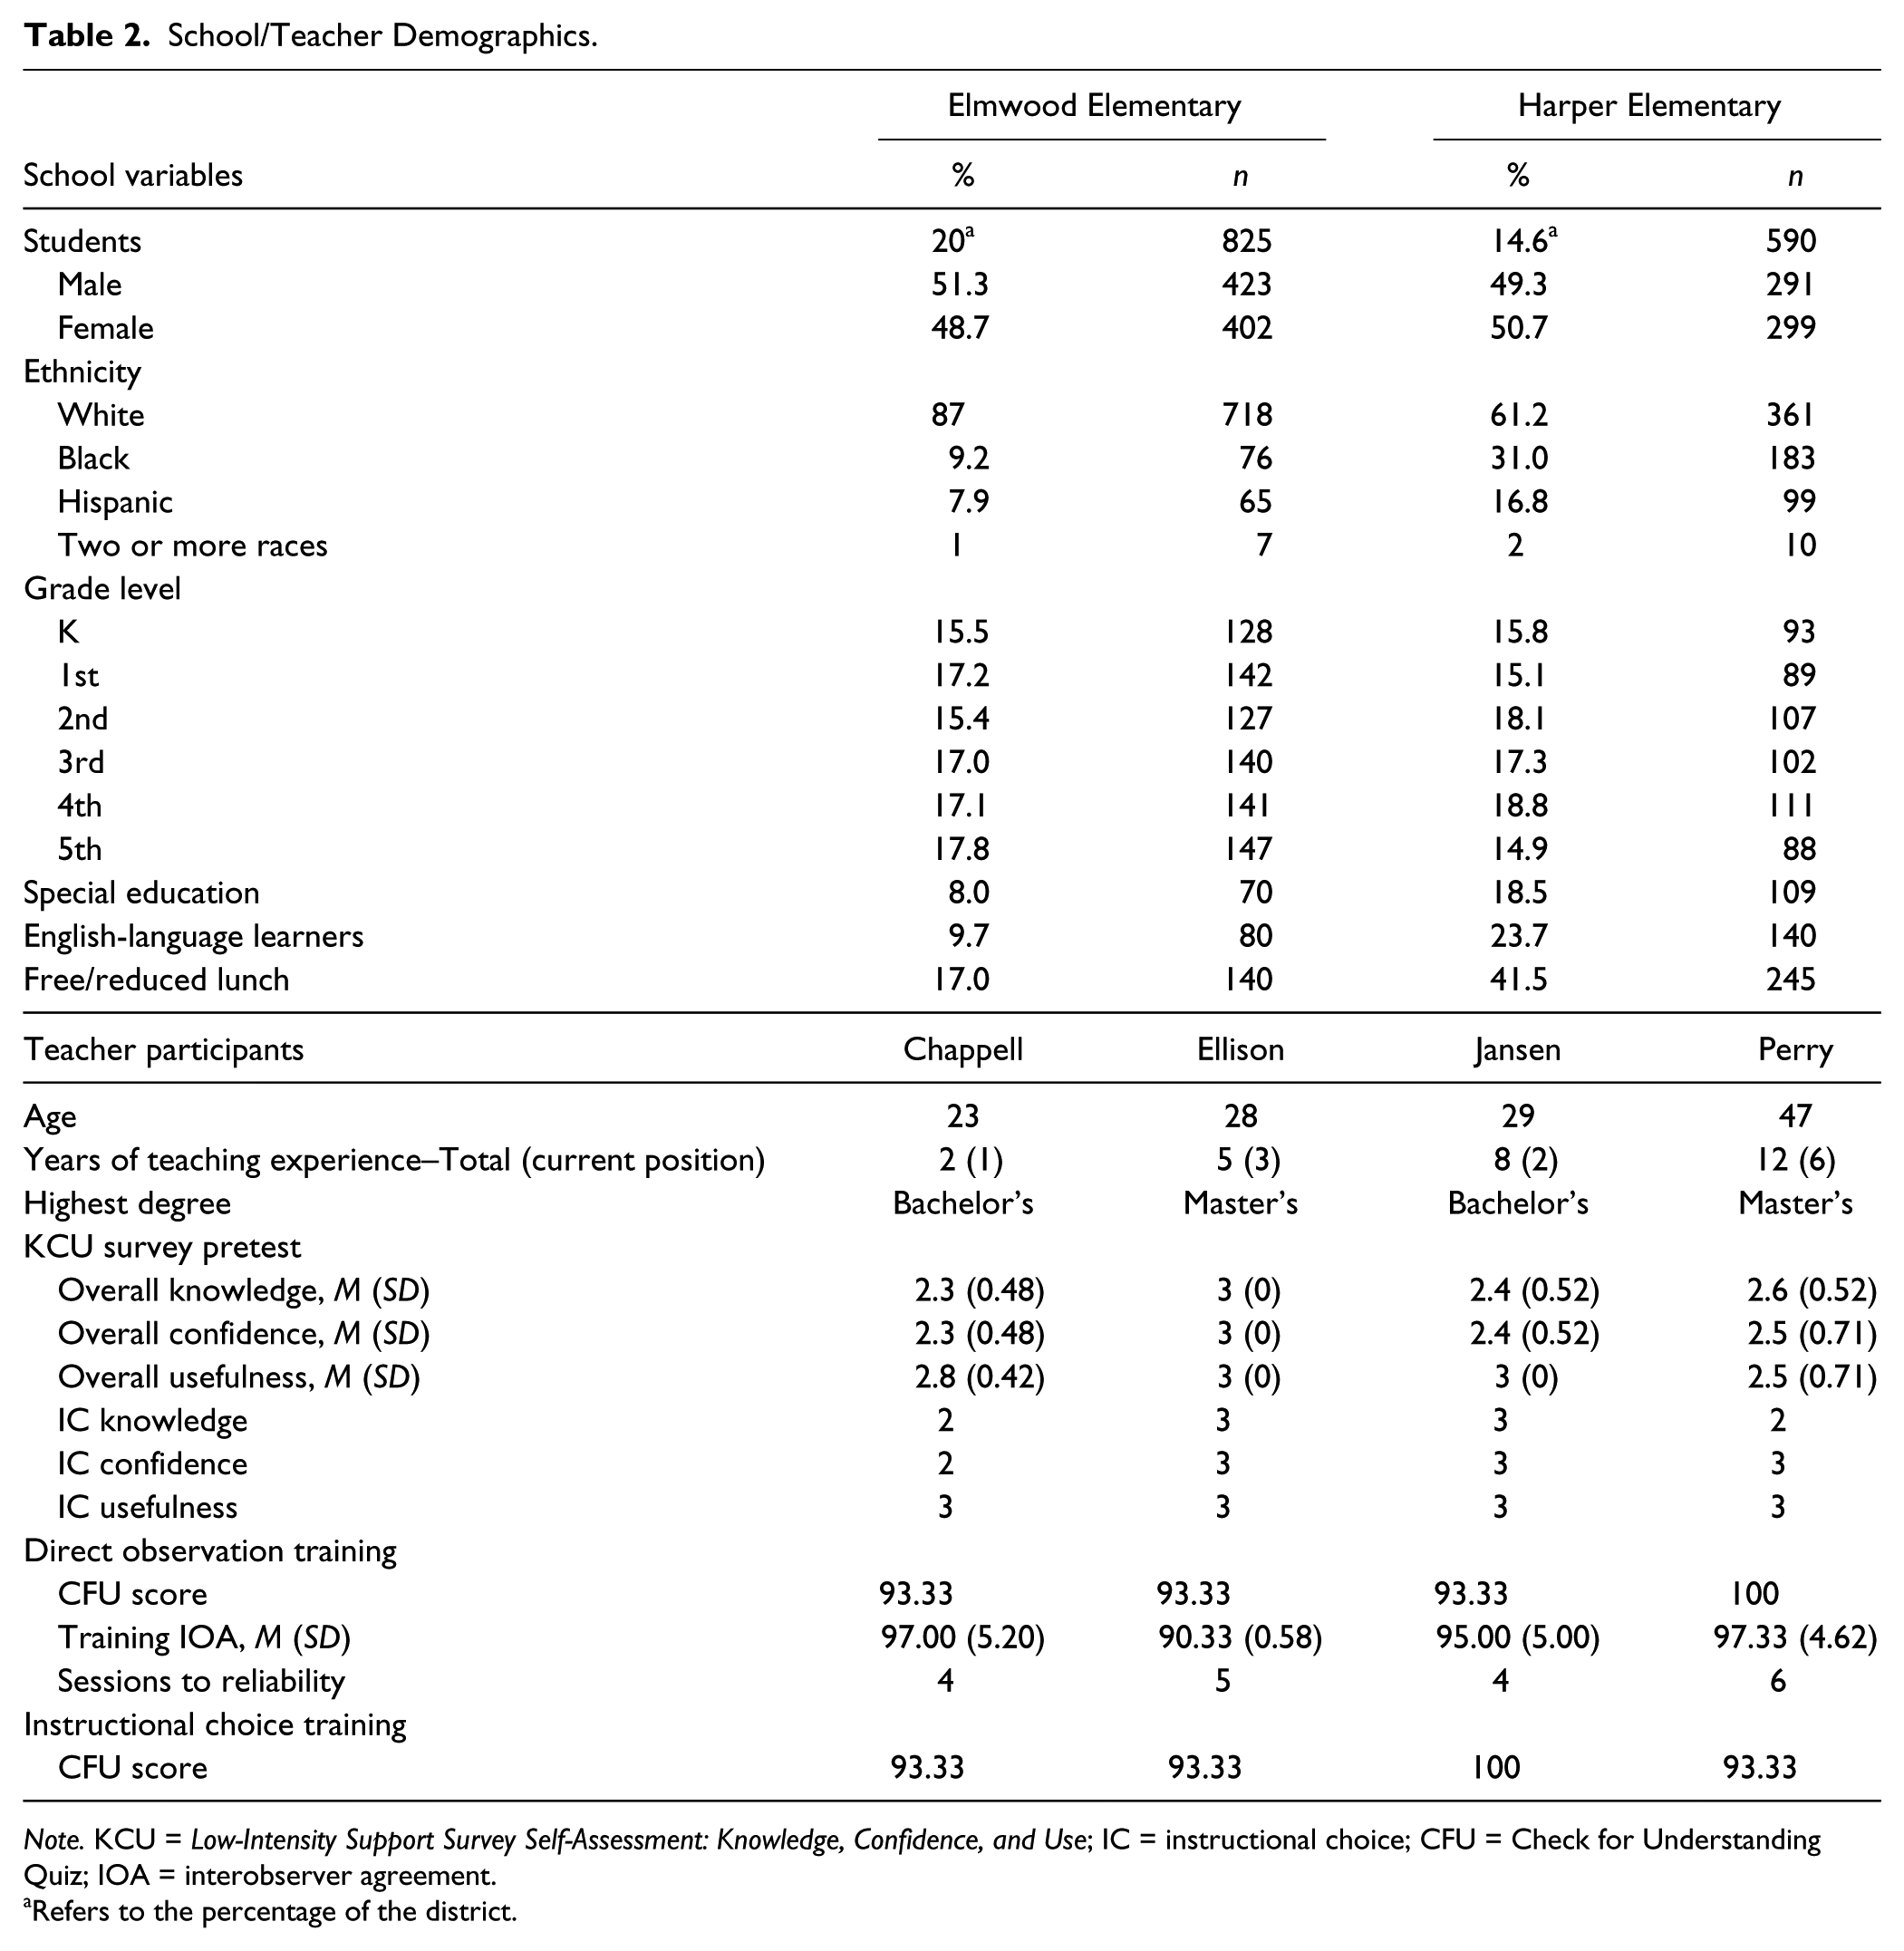
Note. KCU = Low-Intensity Support Survey Self-Assessment: Knowledge, Confidence, and Use; IC = instructional choice; CFU = Check for Understanding Quiz; IOA = interobserver agreement.
Refers to the percentage of the district.
Setting
School
Students attended two elementary schools, Elmwood Elementary and Harper Elementary, within a large, suburban public elementary school district in the Southeastern United States (National Center for Education Statistics, 2014). Both schools served students in Grades K-5 (see Table 2) and a predominantly White student body (Elmwood, 87%; Harper, 61.2%). Elmwood was significantly larger than Harper, with enrollment of 825 and 590 students, respectively. The schools also varied in the percentage of students receiving special education (Elmwood, 8%; Harper, 18.5%) and ESL services (Elmwood, 9.7%; Harper, 23.7%). Likewise, Elmwood (17.0%) served a smaller percentage of students needing free/reduced lunch than Harper (41.5%).
Classes
All students were being served in the general education classroom, where data collection took place throughout the study. Classes ranged in size from 21 to 24 students. Each teacher targeted math instruction, as it was a content area in which the students were both below benchmark and displaying low levels of academic engagement. Math content also was consistently taught and followed a predictable pattern each day (45–60 min math lessons). Tier 1 math instruction involved whole-class instruction with modeling of target math skills (15–20 min). Next, students began guided practice activities following the adopted textbook curriculum (15–20 min). Upon completion of the daily assignment, students began rotations to math stations, which included partner activities, electronic skill games, and teacher-supported small group activities (15–20 min).
Procedures
Prior to the start of data collection, the first author met with district leadership to discuss the proposed project and, after securing necessary agreements, met with participating principals. Once the school district and school-site leaders confirmed their willingness to partner with the research team on this project, we sought Institutional Review Board approval from all three institutions on our team.
Participant selection procedures
As a part of their Ci3T model of prevention planning process, schools were piloting two different screening tools, the Student Risk Screening Scale–Internalizing/Externalizing (SRSS-IE) and Systematic Screening for Behavior Disorders (SSBD). At 6 weeks into the school year, all third-grade teachers at the district’s three elementary schools completed the SRSS-IE and SSBD behavioral screening measures as a part of regular school practices. During this same week, also as a part of regular school practices, all students completed the math and reading STAR Assessments of academic progress monitoring. Participants were identified who met the following inclusion criteria: (a) behavioral risk, that is, moderate or high risk on the SRSS-IE (Lane, Menzies, et al., 2012) and/or internalizing/externalizing nomination on the SSBD (Walker, Severson, & Feil, 2014), and (b) academic risk, that is, below benchmark on the math STAR Assessments (Renaissance Learning, 2016).
Once students meeting the above criteria were screened, teachers of the identified students were invited to participate during consenting meetings held in person by the first author. She explained the intent of the project and steps of the intervention were outlined, including the teacher’s role in this process. Teachers were provided time estimates for all aspects of the study, an overview benefits and risks, and information regarding confidentiality and withdrawal processes. Teachers who voluntarily consented to participate sent home parental consent forms. If parents gave consent for their child to participate, only then were researchers given the identities of the students who were invited to assent their participation. To be clear, researchers were not provided with students’ names until after parental consent was secured. Of the 17 teachers invited, seven elected to participate. Of the seven parents invited, six consented and one did not return their consent. All six invited students assented to participate. Of these students, four teachers targeted math for intervention (as noted previously). Results of the reading investigation are reported elsewhere (Ennis, Lane, & Oakes, 2017).
Planning
Following the consent/assent process, the first author conducted informal observation of reading or math lessons and met with the teacher afterward to develop a baseline treatment fidelity checklist with each teacher. This checklist detailed activities teachers routinely implemented (e.g., Teacher prompted students to meet on the carpet and wait quietly. Teacher led the lesson at teacher table. Teacher offered earned reinforcement to applicable students.). At the end of this meeting, teachers completed a survey called the Low-Intensity Support Survey Self-Assessment: Knowledge, Confidence, and Use (KCU; Lane, Oakes, & Ennis, 2012; see Table 2) to evaluate each teacher’s knowledge about, confidence implementing, and perceived usefulness of low-intensity strategies, including instructional choice.
Dependent variable training
Following this meeting, teachers and secondary data collectors completed a standardized training module on collecting direct observation data (approximately 30 min), which included a voiceover PowerPoint that reviewed the following topics: overview of direct observation, behavioral definitions, momentary time sampling procedures, interobserver agreement (IOA) procedures, and daily data storage/sharing procedures. Following completion of the module, participants completed a 15-item check for understanding quiz (true/false and multiple choice), for which a score 90% or better was required or the module was to be repeated. Next, participant teachers completed video training observations with the research staff. Finally, participating teachers completed independent, in vivo observations with 90% reliability or better with the research staff for three consecutive sessions. Once training was complete for the teacher, baseline data collection began for the target student. See Table 2 for results of this incremental training process.
Baseline
During baseline, teachers followed the procedures outlined during their planning meeting and completed daily treatment fidelity checklists to verify this adherence (see Table 3). For examples of these checklists, please contact the first author or visit http://Ci3T.org/pl. All data were collected daily by teachers and stored on a clipboard which was picked up by research staff 1 to 2 times per week. Research staff graphed data and shared results with teachers on a weekly basis. Baseline data collection continued following these procedures until phase change decision rules were met.
Treatment Fidelity and IOA Outcomes.
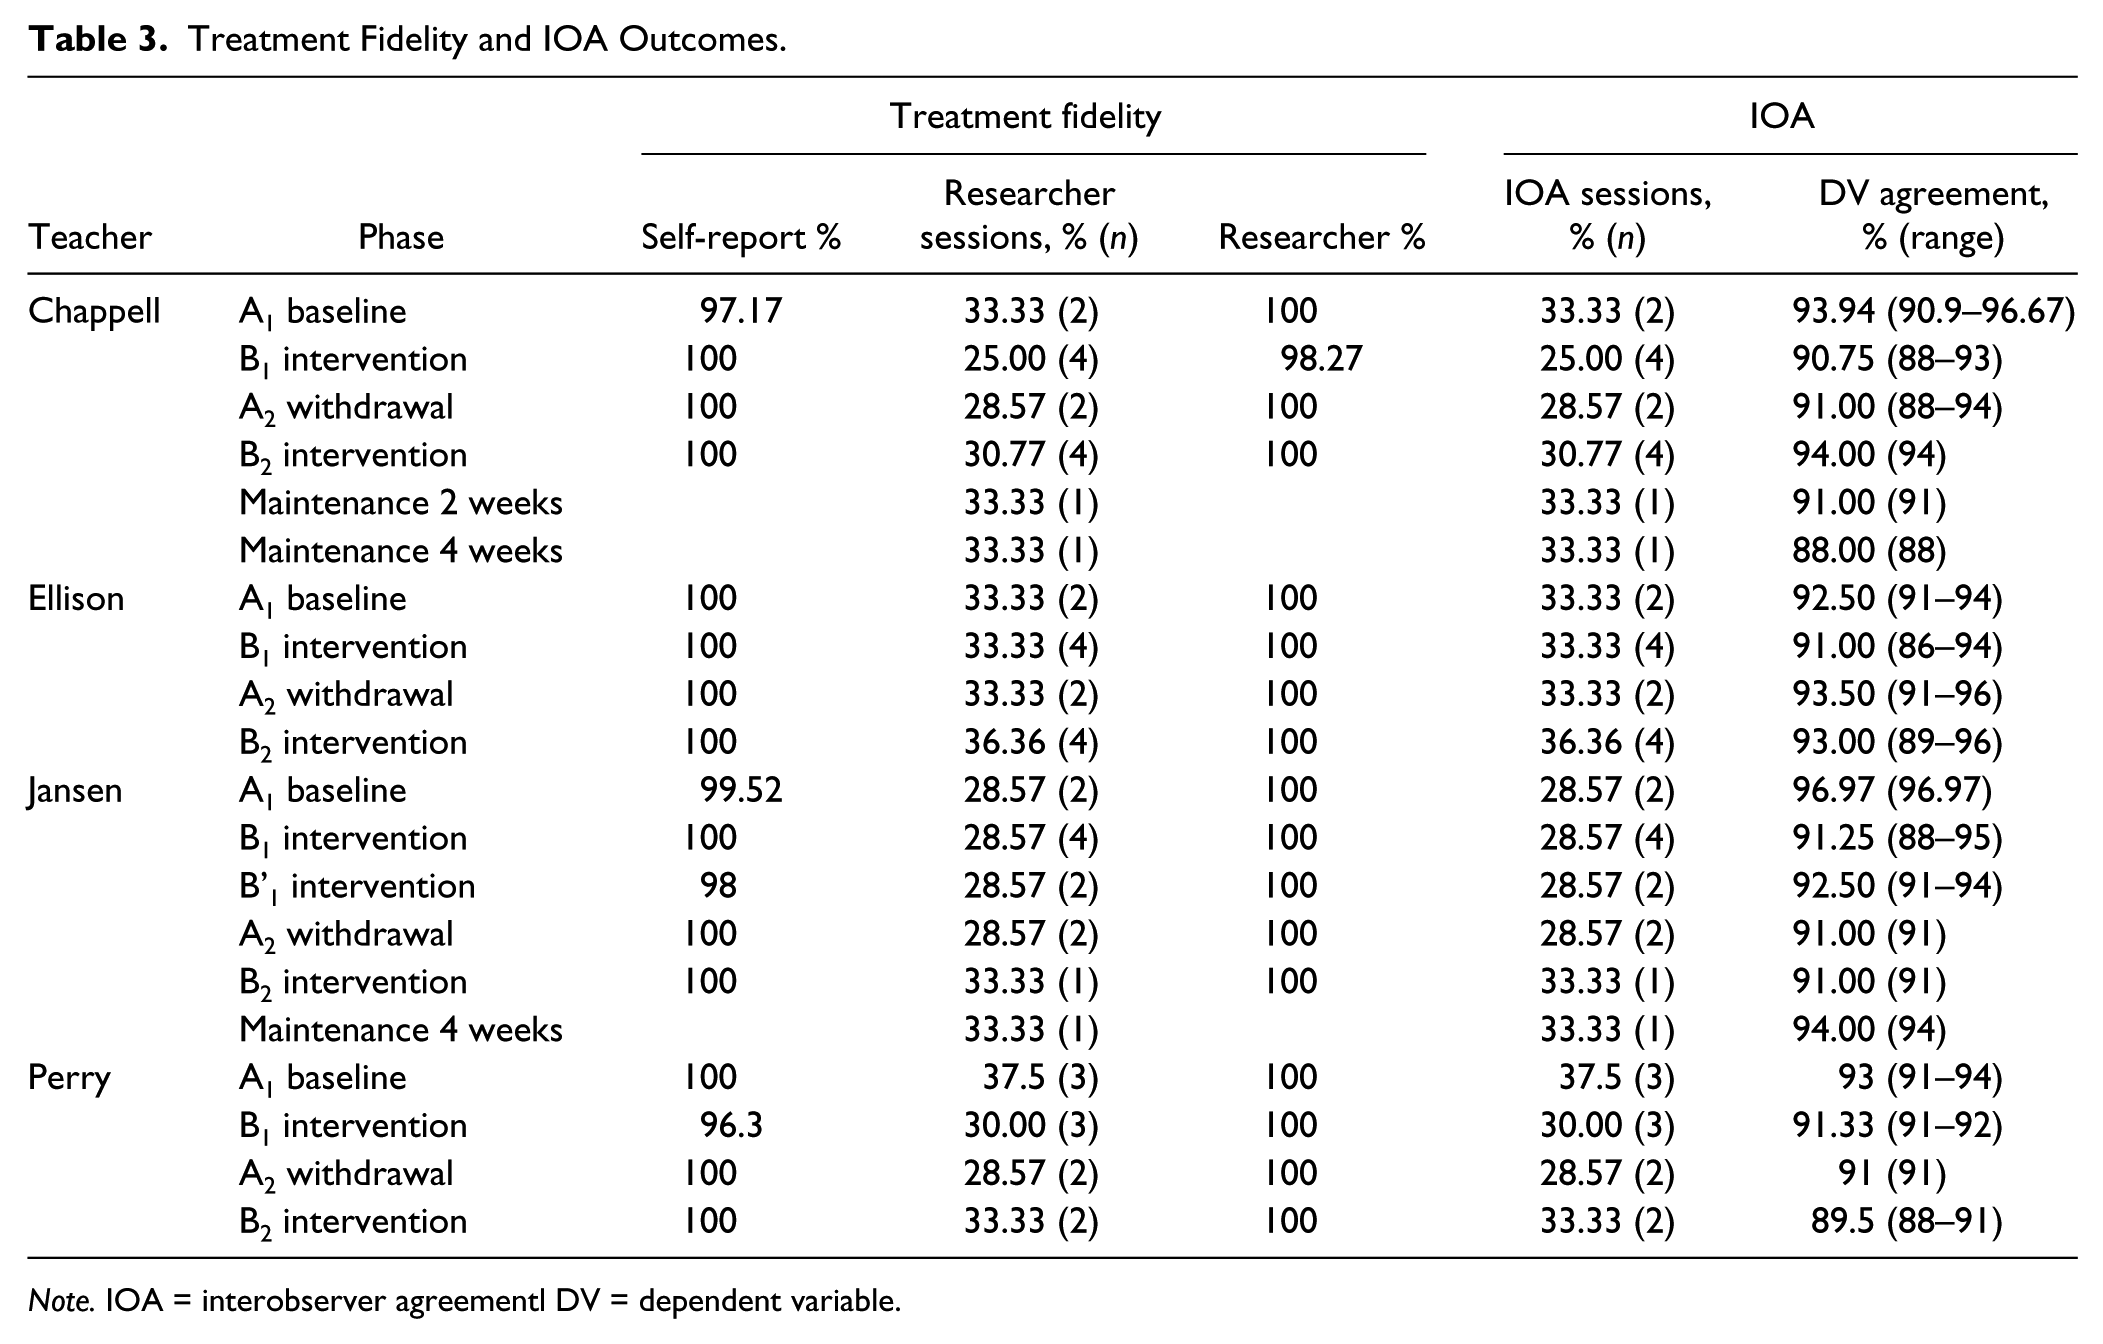
Note. IOA = interobserver agreementl DV = dependent variable.
Instructional choice
The targeted intervention for this project was instructional choice, which was implemented using the following nine steps: (a) determine which types of choices you feel comfortable offering and create a menu of choice; (b) use the menu to determine which types of choice to add to a particular lesson; (c) after choice is built in the lesson, offer the established choices; (d) ask the student to make his or her choice; (e) provide wait time for the student to make his or her choice; (f) listen to (or observe) the student’s response; (g) prompt the student to make a choice from one of the available options if the student has not made a choice in the time allotted; (h) reinforce the student’s choice, providing them with the option they selected; and (i) offer students an opportunity to give feedback on the choice they selected (Lane, Menzies, et al., 2015). Each teacher chose to implement either across- or within-activity choices at the onset of the intervention and consistently implemented their choice type throughout.
Independent variables training and planning
At the conclusion of baseline, classroom teachers completed a standardized training module on implementing the instructional choice independent variable (approximately 30 min), which included a voiceover PowerPoint with the following topics: overview of instructional choice, research to support the effectiveness of using choice in the classroom, a step-by-step guide to implementing instructional choice, directions for completing treatment integrity forms, and daily data storage/sharing procedures. Following completion of the module, participants completed a 15-item check for understanding quiz with the same criterion as the dependent variable training.
At the conclusion of the module and check for understanding, research staff provided teachers with two menus of choices, one for across-activity choices (e.g., task type, task order) and one for within-activity choices (e.g., task materials, task partners, task location). Teachers were instructed to pick the menu of choices that best fit the structure of their classroom math time and select options they would be comfortable offering students. Teachers were also permitted to create their own menu offerings, but if new options were added researcher staff confirmed the accurate classification of the choice option. For purposes of consistency and prompt decision making, students were only provided with two to three options each day. Teachers prepared and/or gathered any needed materials for providing choices. Three teachers elected to present students with choices using index cards with pictures of their choices. For example, for a choice of which problems to complete, they presented a card with a picture of a worksheet with evens circled and a picture with odds circled; for a choice of where to work, they presented a card with a picture of the class library and a picture of the teacher table. Teachers also purchased mechanical pencils or colored dry erase markers for the target students to choose from when choosing materials. Training on the independent variable was held following baseline data collection to prevent the intervention from being introduced prior to the conclusion of the baseline phase (to avoid contamination between phases).
Descriptive Measures
Social Skills Improvement System–Rating Scales (SSiS-RS)
The Teacher Report version of the SSiS-RS (Gresham & Elliott, 2008) is an 83-item rating scale. Teachers completed a Likert-type scale where they rated how often a behavior occurs (never, sometimes, often, or always) across two domains: Social Skills (46 items) and Screening Measures.
Both schools conducted three screening tools as part of regular school practices which were used to select participants. Teacher completed two behavioral and one academic screener 6 weeks into the school year.
For the social skills domain, teachers rated how important the behavior is for school success (not important, important, or critical). Teachers also rated students’ Academic Competence (seven items) by ranking their performance as compared with their same age peers (1 = lowest 10%–5 = highest 10%). The SSiS-RS is designed for use with students ages 3 to 18. Studies have demonstrated the SSiS-RS to be reliable and valid (Gresham, Elliott, Vance & Cook, 2011).
SRSS-IE
The SRSS-IE12 (Lane, Menzies, et al., 2012) is an adapted version of the SRSS (Drummond, 1994). The elementary version of the SRSS-IE elementary scale includes the original seven items and five new items reflecting internalizing behaviors. The SRSS-IE contains two subscale scores: the SRSS-E and the SRSS-I. The SRSS-E items are (a) steal; (b) lie, cheat, sneak; (c) behavior problems; (d) peer rejection; (e) low academic achievement; (f) negative attitude; and (g) aggressive behavior. The SRSS-I items are (a) emotionally flat; (b) shy, withdrawn; (c) sad, depressed; (d) anxious; and (e) lonely. Teachers rated each student’s behavior on each item from 0 = never to 3 = frequently. SRSS-E and SRSS-I subscales are computed by summing subscale items. Risk on the SRSS-E is defined as 0–3 low, 4–8 moderate, and 9–21 high risk for antisocial behavior. Risk on the SRSS-I is defined as 0–1 low, 2–3 moderate, and 4–15 high risk for internalizing behavior.
SSBD–Second Edition
The SSBD (Walker et al., 2014) is a multiple-gating screening process. For purposes of this project, Stages 1 and 2 were used to identify students who were nominated as displaying either externalizing or internalizing behavior patterns. In Stage 1, teachers categorized students on their classroom roster as either internalizing or externalizing and then rank order them from most severe to least severe based on examples and nonexamples of behavioral characteristics. In Stage 2, teachers provided additional information about their three highest rated students in each category by completing the Critical Events Index (a listing of 33 critical events that teachers mark if the student has exhibited the behavior during the current school year) and the Combined Frequency Index of Adaptive and Maladaptive Behavior (a 23-item—11 maladaptive, 12 adaptive—using a Likert-type scale, 1–5 Never, Sometimes, Frequently) in which teachers responded to the degree that a given statement reflects the child’s behavior. The SSBD has strong test–retest stability estimates, internal consistency, and mean rho coefficients (Walker et al., 2014).
STAR Assessments
STAR Assessments (Renaissance Learning, 2016) are screening and progress monitoring assessments that are administered electronically and yield a score that is normed to a nationally representative sample of above, within, or below mastery. STAR Assessments are designed for students in Grades K-12. Reading and math STAR Assessments take approximately 20 min to complete and are administered 3 times a year at each elementary school.
Wechsler Intelligence Scale for Children, Fifth Edition, Short Form (WISC-V)
A short form of the WISC-V (Wechsler, 2014) that uses the Vocabulary and Block Design subtests was used to estimate a standard score of students’ cognitive ability (Sattler, 1991). Reliability estimate is .91. The Vocabulary subtest measured verbal fluency, concept formation, word knowledge, and word usage. This subtest is untimed. An example item asked students to say a word aloud upon seeing a picture of the word or to define a given word aloud. The Block Design subtest measures spatial visualization and analysis; simultaneous processing, visual-motor coordination, dexterity, and nonverbal concept formation are involved in this subtest. The students used colored plastic blocks to analyze, synthesize, and reproduce an abstract design using logic and reasoning to successfully complete the items.
KCU
The KCU Survey (Lane, Oakes, & Ennis, 2012) asked teachers to respond to a 4-point, Likert-type scale ranging from 0 = I have no knowledge of/confidence in using/perceived usefulness and/or relevance in this concept or strategy to 3 = I have a substantial knowledge of/confidence in using/perceived usefulness and/or relevance in this concept or strategy about 10 low-intensity behavioral strategies (including instructional choice). Scores are summed, with higher scores indicated higher levels of knowledge, confidence, and usefulness.
Outcome Measures
Treatment integrity
Teachers completed treatment integrity checklists for each day that direct observation data were collected during baseline and intervention phases. For a minimum of 25% of sessions (i.e., the math lessons where choice was provided), a research staff member completed an identical checklist to verify implementation of elements.
Baseline
All teachers had a baseline treatment integrity checklist tailored to their daily routines in math (e.g., “Teacher had materials prepared for lesson [student materials, teacher materials]”; “Teacher conducted whole group lesson [introduces or reviews key concepts]”). Checklist items for each teacher ranged from 11 to 16 items. Teachers rated each item as 0 = not implemented, 1 = partially implemented, or 2 = fully implemented. A percentage of implementation was calculated by dividing the total number of points earned by the total number of possible points (range = 22–32) multiplied by 100.
Within-activity choice
When the intervention began, teachers continued to rate themselves on the above items implemented during baseline. Teachers also completed an additional seven items related to offering within-activity choices (e.g., “Teacher made materials and/or environmental choices available”; “Teacher honored the student’s selected choice”) for a total of 18 to 23 items. Teachers rated each item as 0 = not implemented, 1 = partially implemented, or 2 = fully implemented. A percentage of implementation was calculated by dividing the total number of points earned by the total number of possible points (range = 36–46) multiplied by 100.
Direct observation
Direct observation of academic engagement/off-task (OFF) behavior was the primary outcome data. As all teachers were novice to data collection, we focused on academic engagement rather than problem behaviors given the use of momentary time sampling and the mutually exclusive nature of engagement and problem behaviors. Academic engagement was collected by teachers using 2 min interval momentary time sampling during daily math lessons. Data collectors wore a MotivAider®, a small device programmed to pulse at set intervals, to prompt her to observe student’s behavior. Teachers then recorded what behavior was observed at the time of the pulse only: active academic engagement (AAE), passive academic engagement (PAE), or OFF. Each behavior is mutually exclusive, meaning a student can only be marked as exhibiting one of the defined behaviors at a time (i.e., you cannot be AAE and PAE at the same time). A percentage of each variable was calculated by adding up the number of observed intervals by the total number of intervals and multiplied by 100. For a minimum of 25% of sessions, a research staff member completed IOA observations, independently of the teacher to verify reliability of direct observation data recording. IOA observations were conducted for the entirety of the math lesson. The following behavioral definitions were used, as adapted from the Behavior Observation of Students in School (BOSS; Shapiro, 2013).
AAE
AAE is defined as actively engaging in academic responding (i.e., writing, reading aloud, raising a hand to answer a teacher’s question, talking to a teacher and/or peer about the assigned material, typing or writing an answer, looking up a word in a dictionary/book). Nonexamples of AAE are any behavior defined as PAE or OFF.
PAE
PAE is defined as passively attending to an assigned task (i.e., listening to a lecture, looking at an academic worksheet, reading assigned material silently, looking at the blackboard during teacher instruction, listening to a peer respond to a question). Nonexamples of PAE are any behavior defined as AAE or OFF. For purposes of this study, academic engagement (AE [AAE + PAE]) was graphed as decreases in PAE due to increased AAE may have been misinterpreted.
OFF
OFF is defined as engaging in activities unrelated to the task at hand (e.g., doodling, sleeping, fidgeting without working, aimlessly looking around the classroom, reading, drawing or writing on unassigned materials, talking about nonacademic materials or without permission, walking to another area of the room, calling out, physically touching another student when not related to an academic task). Nonexamples of OFF are any behaviors defined as AAE or PAE.
Social validity
Social validity was assessed both pre- and postintervention from both the teacher and student perspective using social validity measures. Measures had strong psychometric properties and assessed stakeholders’ opinions on addressing socially important goals, acceptable procedures, and achieving important outcomes.
Intervention Rating Profile–15 (IRP-15)
Teachers completed a modified version of IRP-15 (Witt & Elliott, 1985). Teachers rated 15 items (e.g., “This would be an acceptable intervention for the child’s needs”) on a 6-point Likert-type scale ranging from 1 = strongly disagree to 6 = strongly agree yielding a score of 15 to 90 with higher scores suggesting higher acceptability. Teacher provided preintervention feedback at the conclusion of instructional choice training. Teachers provided postintervention feedback within a week of the conclusion of the intervention.
Children’s Intervention Rating Profile (CIRP)
Students completed a modified version of the CIRP (Witt & Elliott, 1985) to obtain their views on the intervention. Students rated seven items (e.g., “I like the strategy my teacher used to help my behavior”) on a 6-point Likert-type scale ranging from 1 = I do not agree to 6 = I agree. The CIRP yields a score 7 to 42, with higher scores suggesting higher acceptability. At preintervention, the teachers individually explained the proposed instructional choice intervention to the target student, read aloud the CIRP, and recoded student responses. This same procedure was followed at the conclusion of the intervention to assess student feedback postintervention.
Experimental Design and Analysis
We used an A1–B1–A2–B2–C single case research withdrawal design: A = baseline, B = instructional choice, and C = maintenance (Gast & Ledford, 2014) to evaluate the effectiveness of instructional choice on student’s AAE and total AE (PAE + AAE). A withdrawal design was chosen over other single case designs for two key reasons: (a) It allowed phase change decisions to be made separately for each teacher and (b) it prevented extended delays in the introduction of the intervention for students in later tiers of the multiple-baseline design (which is also less than ideal for teachers eager to learn and utilize new strategies). Traditional visual analysis techniques were employed to examine stability (standard deviation [SD], standard error [SEyx]), level (mean [M]) and trend (slope) of data, and to determine whether a functional relation existed between the introduction of the intervention and improvements in students’ academic engagement (cf. Gast & Ledford, 2014). Phase change decisions were made based on students’ AAE (the most proximal variable of interest) as changes in AAE may be a more accurate measure of engagement for target students, as it reflected when students were actively involved in classroom activities. Maintenance was assessed for two teachers only, as the school calendar did not permit further observations for the remaining teachers. Although 2- and 4-week follow-ups were planned, Ms. Jensen’s maintenance checks were conducted at 4- and 6-week intervals due to unplanned medical leave following the final intervention phase. Treatment integrity and social validity data were analyzed using descriptive statistics (e.g., measures of central tendency [M scores] and variation [SD]).
Results
Treatment Integrity
Treatment integrity results are reported by teacher by phase in Table 3. In general, teachers implemented classroom practices with notably high levels of fidelity during the baseline/withdrawal phases with a mean level of implementation 99.58% (range = 97.17%−100%) across teachers and phases. Likewise, once the intervention was introduced, teachers implemented classroom practices and intervention components with notably high levels of fidelity during the intervention phases with a mean level of implementation 99.58% (range = 96.3%−100%) across teachers and phases (see Table 3).
AE
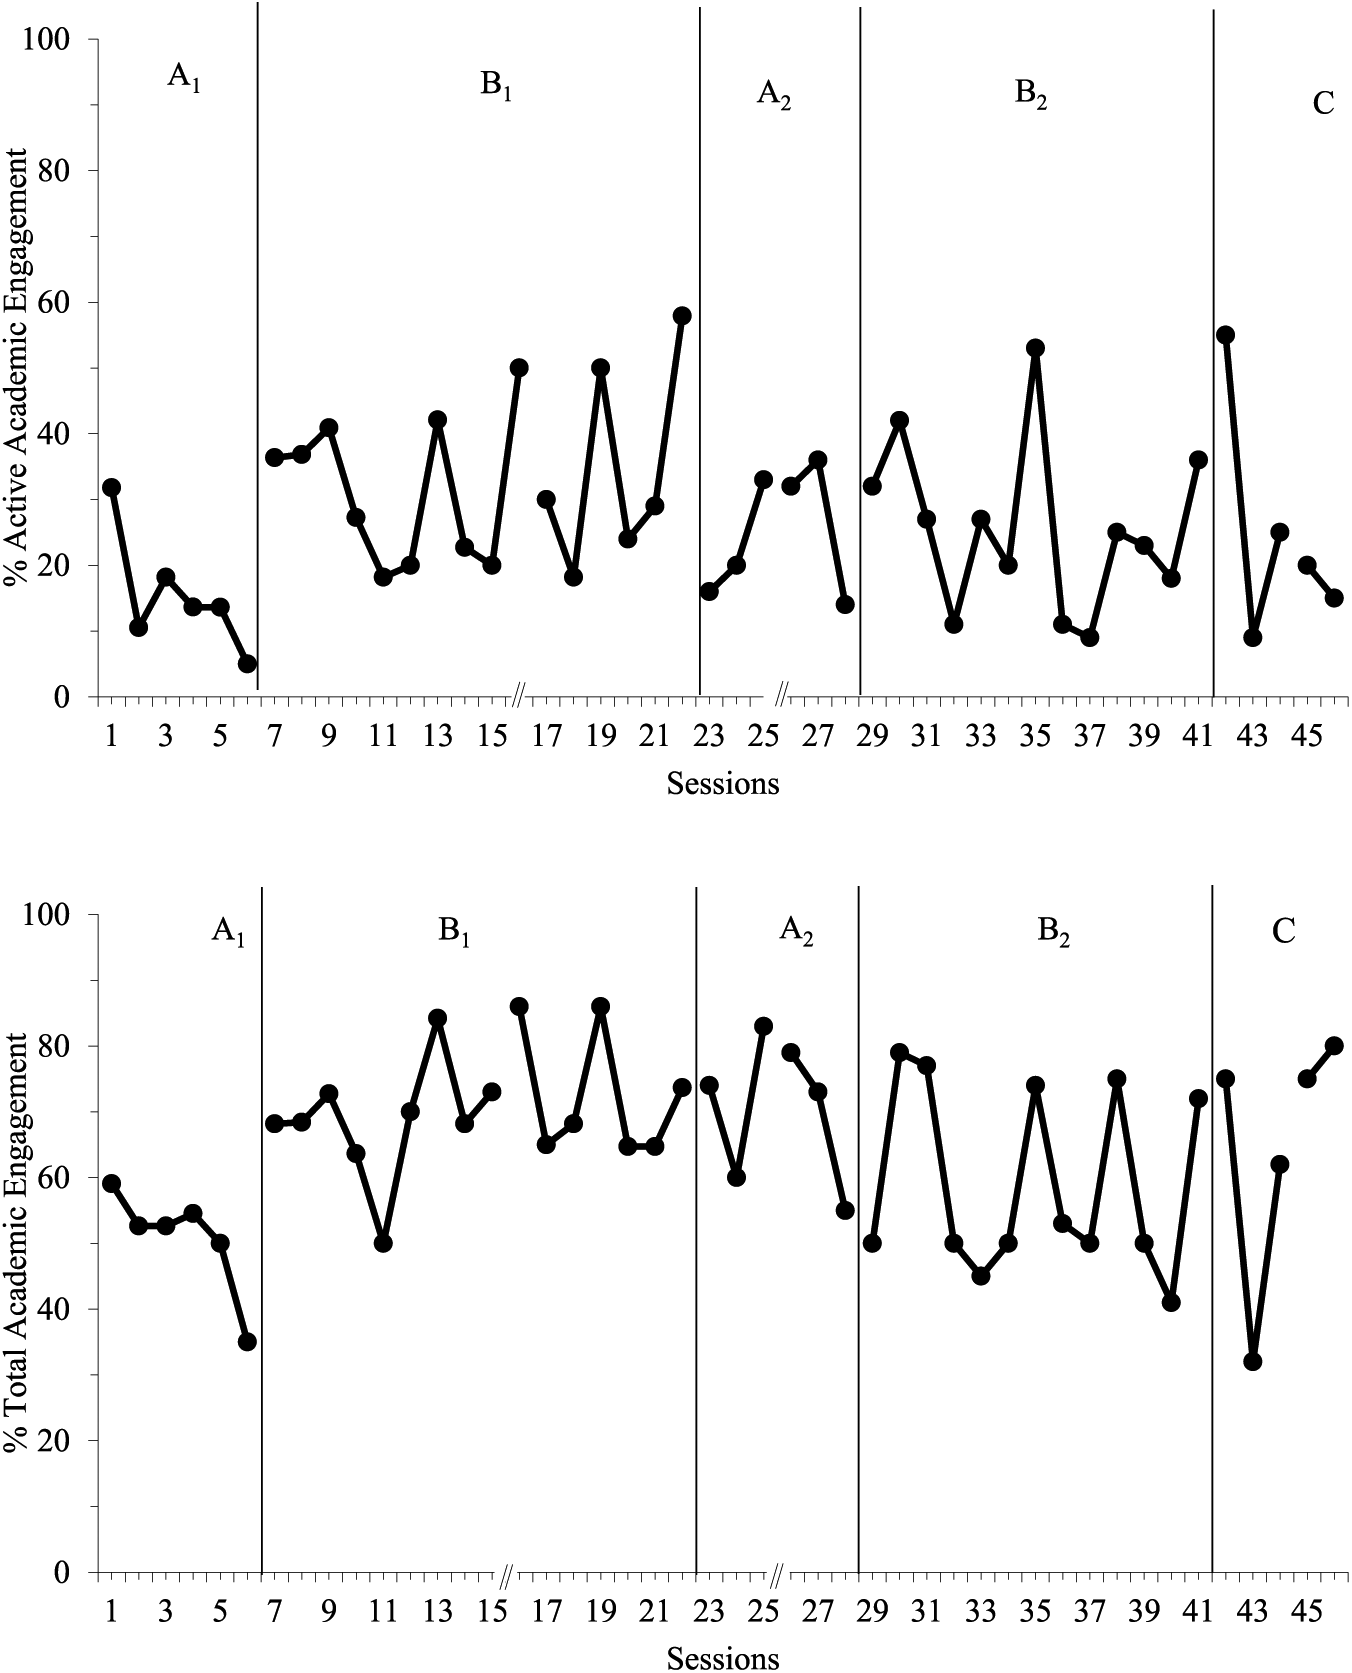
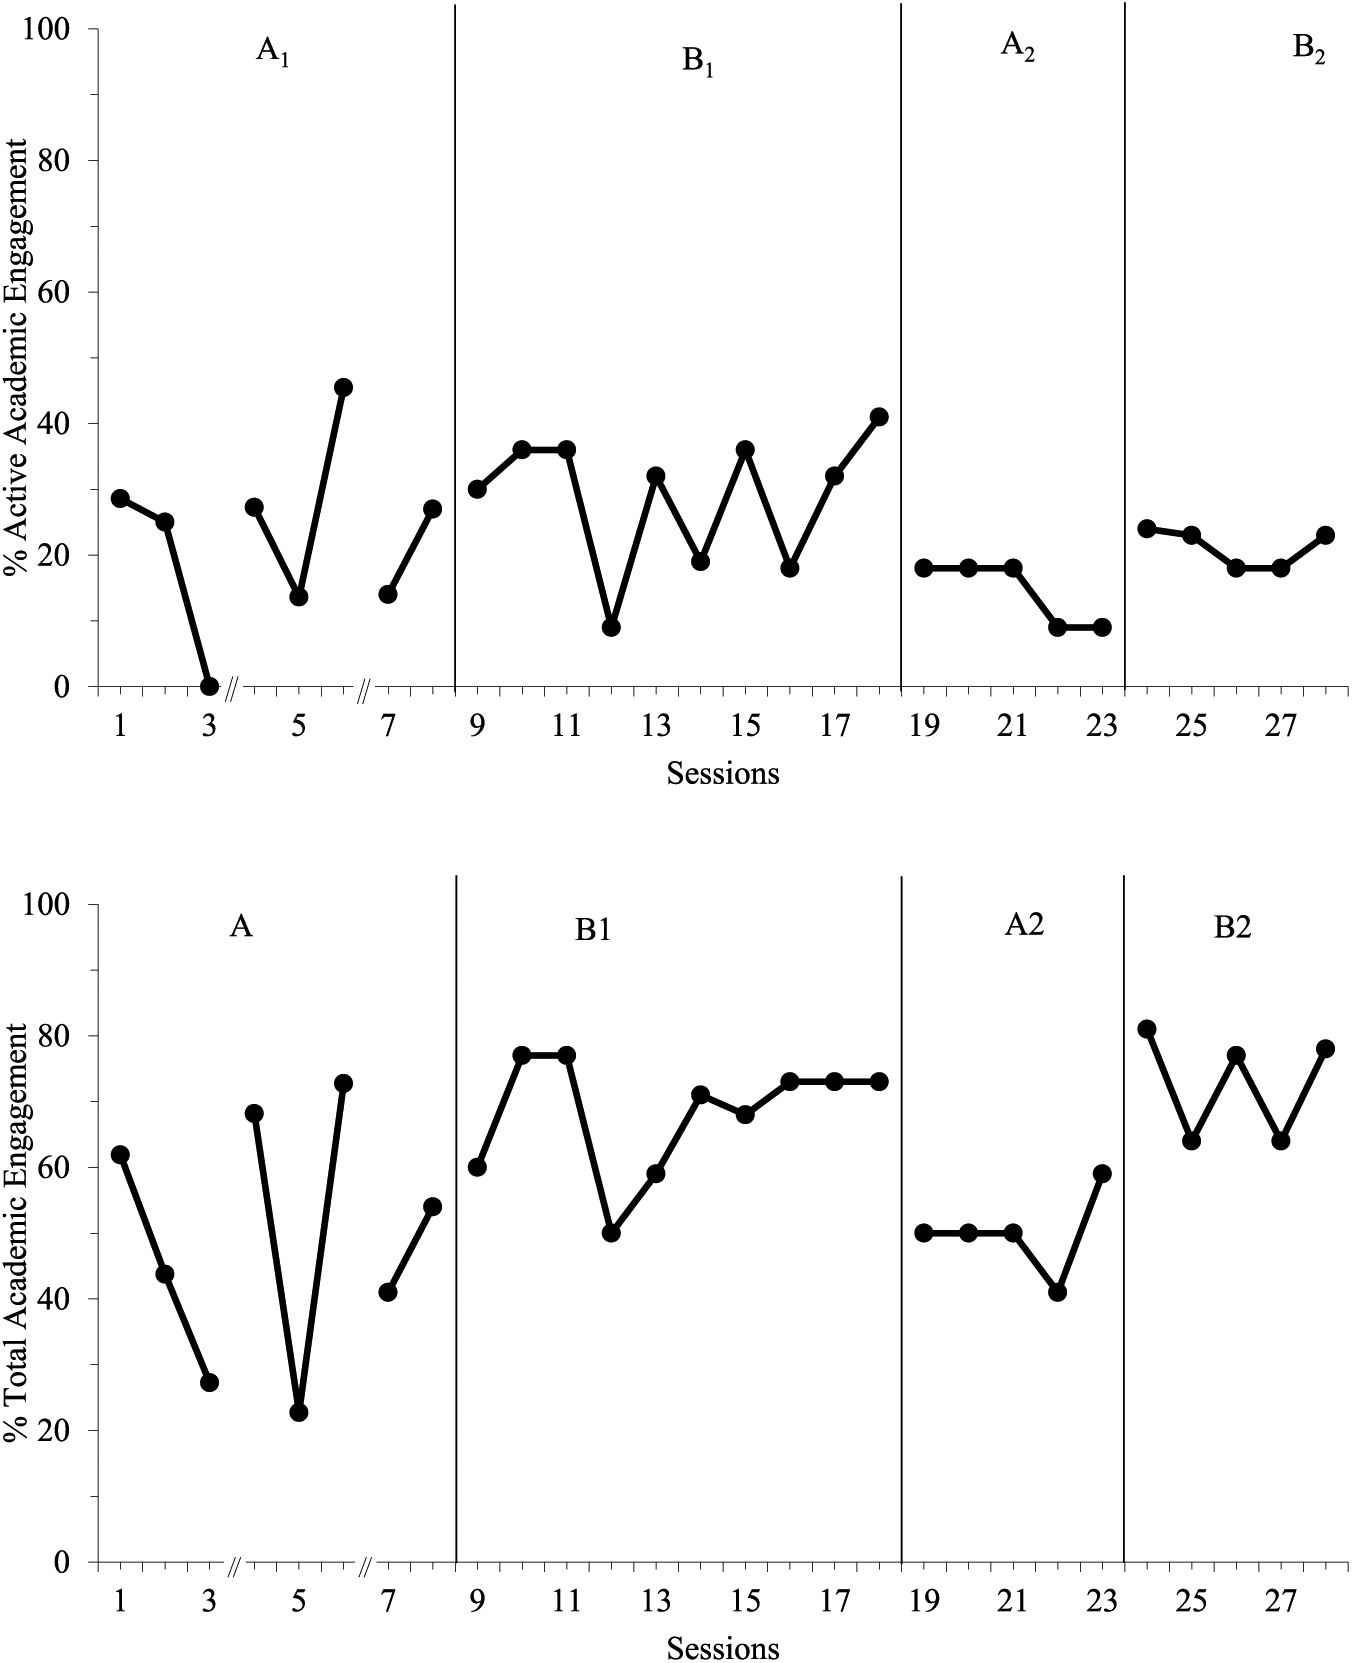
Intervention results are reported by student by phase in Table 4. Data on AAE, AE (AAE + PAE), and OFF were measured across all phases (see Table 3, columns 6 and 7, for IOA for each student for each phase). Results of visual analysis of graphed data showed no functional relation between the introduction of instructional choice and improvements in academic engagement (AAE or AE) for all students (see Figures 1–4).
Intervention Outcomes AAE, AE, and OFF.
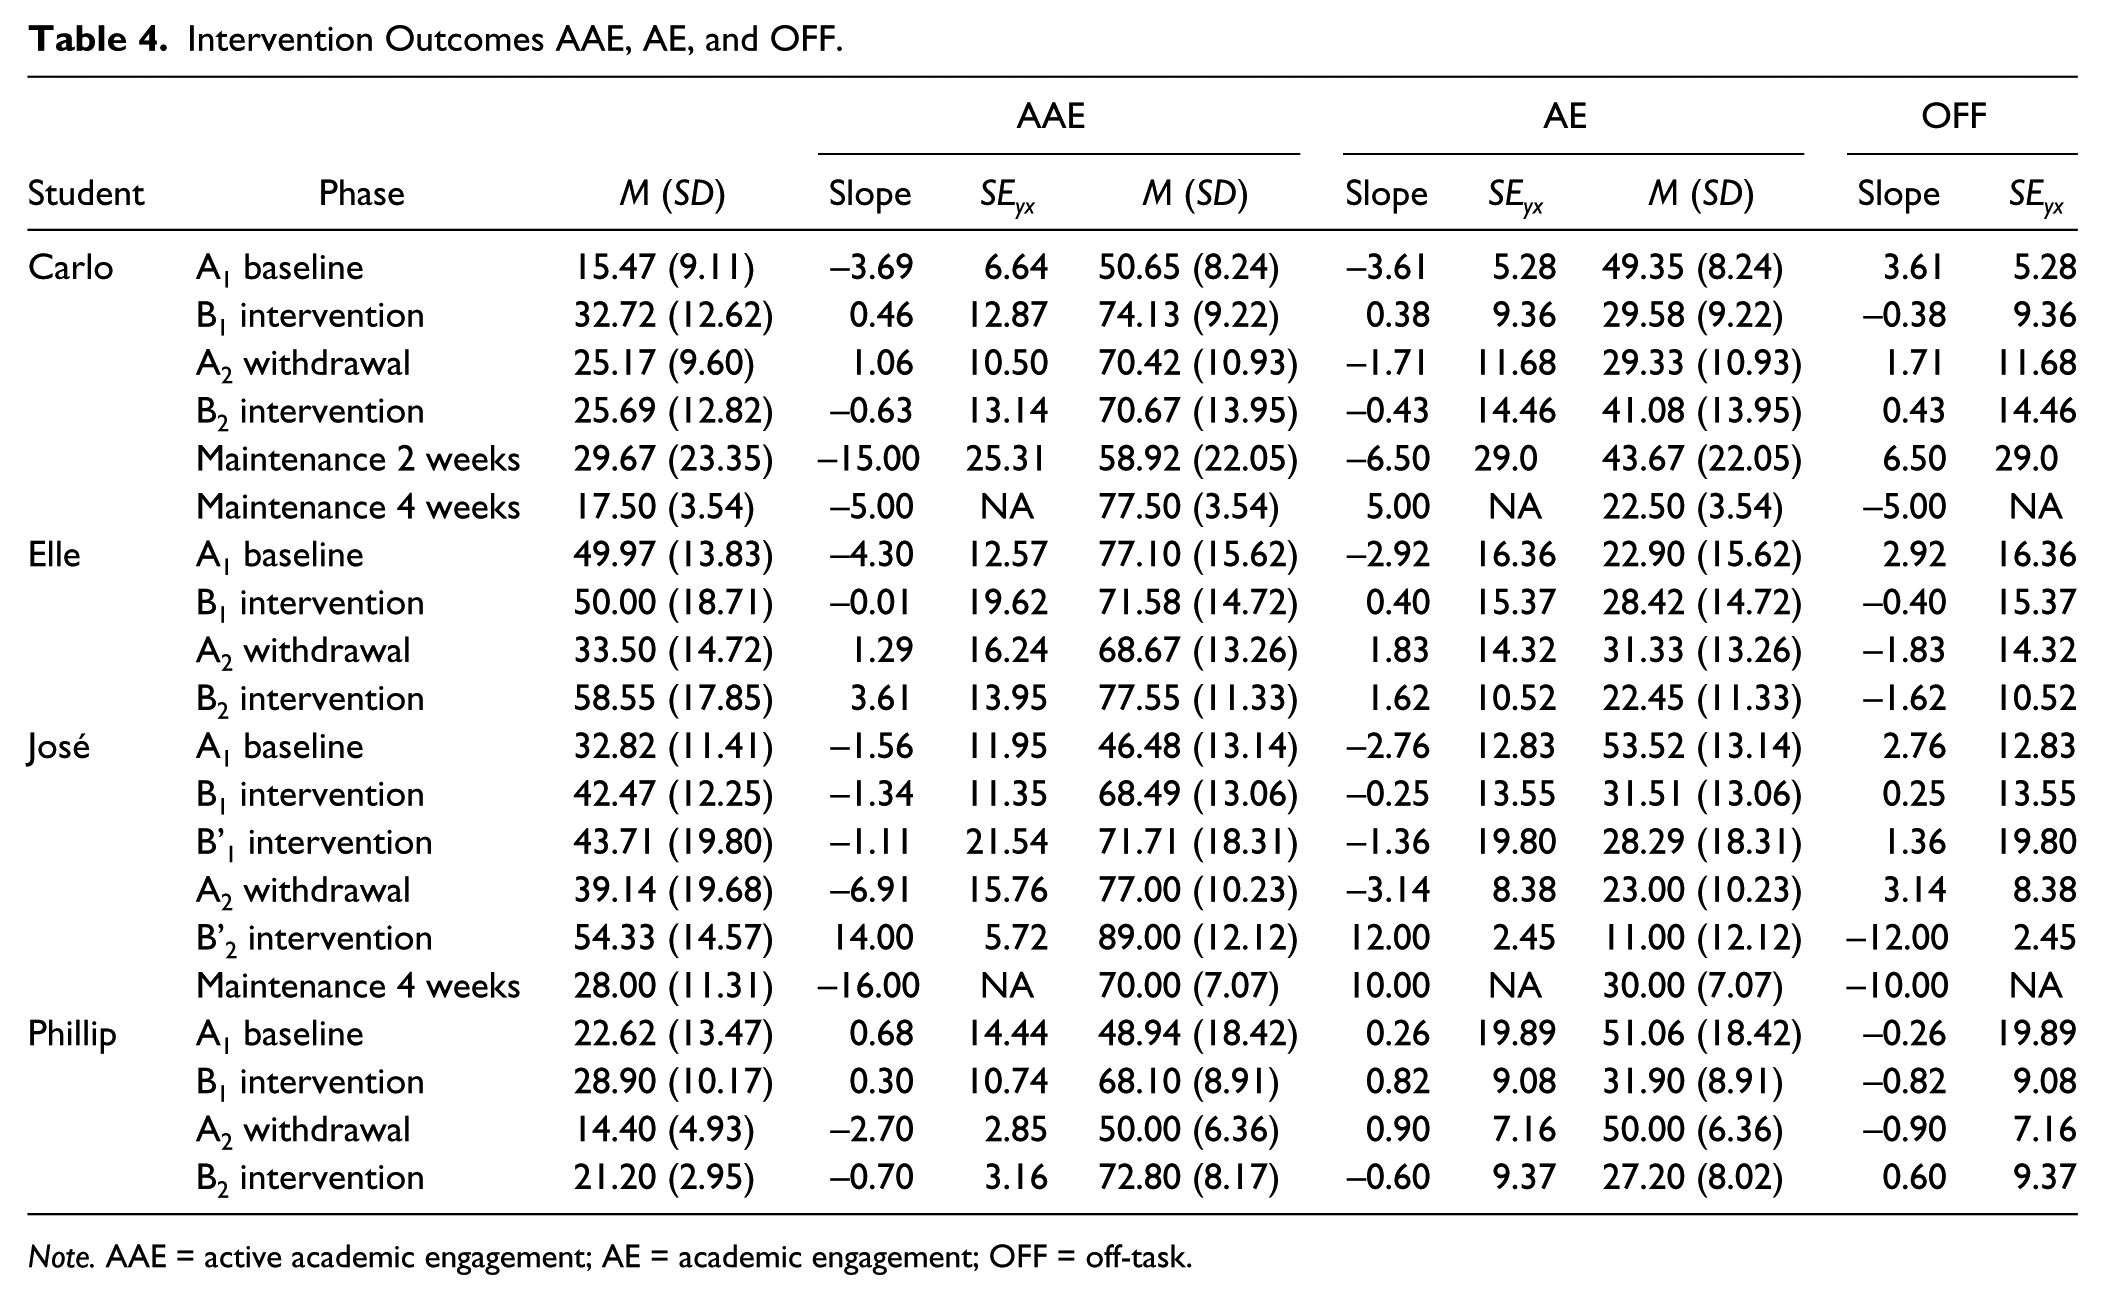
Note. AAE = active academic engagement; AE = academic engagement; OFF = off-task.
Carlo’s academic engagement performance over time.

Elle’s academic engagement performance over time.

José’s academic engagement performance over time.
Phillip’s academic engagement performance over time.
Carlo
Carlo’s AAE increased from baseline (M = 15.47, SD = 9.11) upon introduction of the intervention (M = 31.96, SD = 10.92). However, his AAE did not return to baseline levels when the intervention was withdrawn (M = 25.17, SD = 9.60), suggesting a lack of functional relation. There was no change in level observed upon reintroduction (M = 25.69, SD = 12.82). Maintenance data at 2-week follow-up were slightly higher than in reintroduction (M = 29.67, SD = 23.25); at 4-week follow-up they had returned to baseline levels (M = 17.50, SD = 3.54). Similar patterns were observed for AE data with converse patterns observed for OFF. Furthermore, SD and SEyx data suggest that responding became more variable the longer the intervention was in place (see Table 4 and Figure 1). Note that there were extended days without data collection between Data Points 15 and 16 for fall break and between Data Points 25 and 26 for winter break.
Elle
There was no change in level from baseline (M = 49.97, SD = 13.83) to intervention (M = 50.00, SD = 18.71) for Elle’s AAE. During the withdrawal phase, her AAE decreased to below baseline levels (M = 33.50, SD = 14.72) and increased again during reintroduction (M = 58.55, SD = 17.85). Although these changes in level are encouraging, without another withdrawal and reintroduction, a functional relation could not be established. Elle’s AE decreased upon introduction of the intervention (A1: M = 77.10, SD =15.62; B1: M = 71.67, SD = 14.79) and her OFF increased (A1: M = 22.90, SD =15.62; B1: M = 28.08, SD = 14.64), but a therapeutic change in level was observed for both AE and OFF in the reintroduction phase. Furthermore, SD and SEyx data suggest that responding became more variable when the intervention was in place (see Table 4 and Figure 2). Note there were extended days without data collection between Data Points 5 and 6 for winter break.
José
José’s AAE increased from baseline (M = 32.82, SD = 11.41) upon introduction of the intervention (M = 42.47, SD = 12.25). Because of patterns of responding based on the choice offered, a B’ phase was introduced that only provided José with choice of evens or odds or which math tools to use. However, this change only resulted in a slight change in his AAE (M = 43.71, SD = 19.80). When the intervention was withdrawn, only a slight decrease was observed (M = 39.14, SD = 19.68). When the intervention was reintroduced, the B’ procedures were used. José demonstrated a change in level (M = 54.33, SD = 14.57); however, only three data points were collected due to the teacher’s unplanned medical leave. Results did not maintain at 4- and 6-week follow-ups. Similar patterns were observed for AE data with converse patterns observed for OFF. Furthermore, SD and SEyx data suggest responding only became less variable during the second, short intervention phase (see Table 4 and Figure 3). Note there were extended days without data collection between Data Points 15 and 16 for fall break and between Data Points 24 and 25 for winter break.
Phillip
Phillip’s mean AAE increased from baseline (M = 22.62, SD = 13.47) upon introduction of the intervention (M = 28.90, SD = 10.17). During the withdrawal phase, his AAE decreased to below baseline levels (M = 14.40, SD = 4.93). However, upon reintroduction, his AAE did not increase to above baseline levels (M = 21.20, SD = 2.95). Similar patterns were observed for AE data; however, his AE data did increase to above baseline levels during reintroduction. Although this pattern of change in level may suggest a functional relation between the intervention and AE, there is significant overlap between baseline and both intervention phases. OFF data displayed converse patterns to AE. Furthermore, SD and SEyx data suggest that responding became less variable over the course of data collection (see Table 4 and Figure 4). Note that there were extended days without data collection between Data Points 3 and 4 for student illness followed by fall break and between Data Points 6 and 7 for winter break.
Social Validity
Social validity ratings for teachers suggest moderate to high levels of acceptability at pretest. Most teachers’ social validity rating decreased slightly following intervention. This acceptability level was confirmed by the teacher’s KCU scores at pretest (see Table 2). Social validity ratings for students suggest moderate to high levels of acceptability at pretest. Furthermore, most students’ ratings improved at posttest. Social validity scores are included in Table 5.
Social Validity Outcomes.
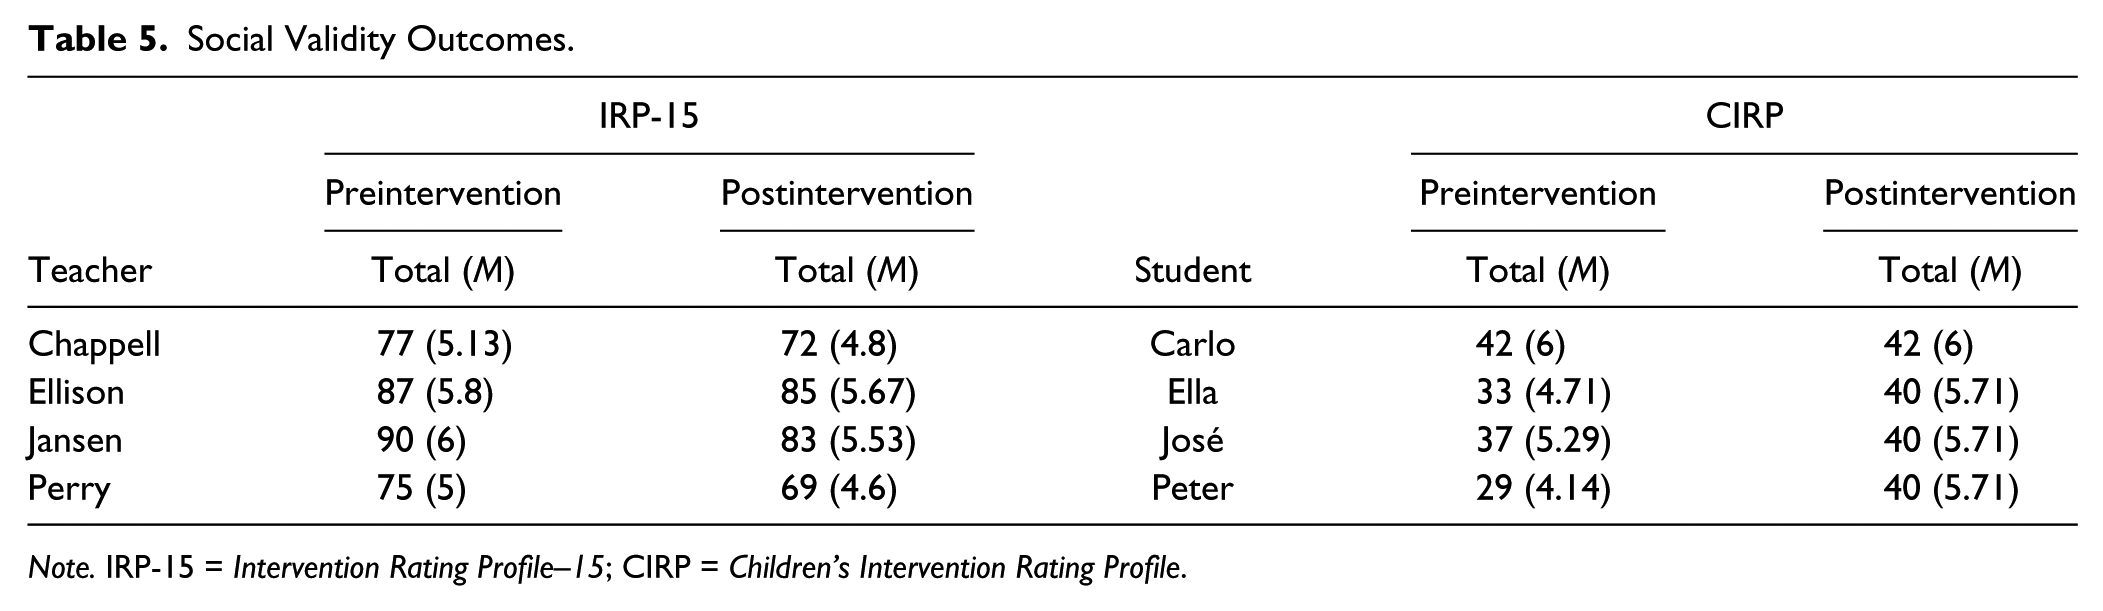
Note. IRP-15 = Intervention Rating Profile–15; CIRP = Children’s Intervention Rating Profile.
Discussion
This project evaluated the effects of instructional choice implemented with limited university supports. To summarize, teachers were responsible for the following aspects of this research project: intervention planning (i.e., targeting times/activities for intervention, providing screening and descriptive data on students, providing feedback to develop baseline treatment fidelity checklists), intervention implementation, direct observation data collection, and treatment fidelity data collection. Research staff were responsible for developing training materials, training teachers, graphing data, making phase change decisions, and conducting IOA checks of direct observation and treatment fidelity. This model involves providing only limited university supports (Lane, Royer, et al., 2015; Messenger et al., 2017), as compared with other investigations using instructional choice and other low-intensity strategies.
In an effort to close the research-to-practice gap by empowering teachers to use low-intensity strategies in their classroom, the goals of the study were threefold: (a) to determine whether teachers could collect direct observation data with reliability while implementing and intervention with integrity, (b) to determine whether there was a functional relation between student engagement and the instructional choice intervention, and (c) to determine whether the procedures, outcomes, and goals were socially acceptable to teacher and student participants. Below we discuss outcomes and interpretations in each of these areas, including limitations and directions for future researchers.
Data Collection Reliability and Treatment Integrity
Perhaps the most significant finding from this study is the fact that teachers were able to simultaneously implement baseline and intervention practices with high integrity while collecting direct observation data reliably using momentary time sampling. As such, this study demonstrates that a professional development model, involving voiceover PowerPoint, check for understanding quizzes, and, in the case of direct observation, video and in vivo training procedures, was successful in terms of teachers being able to implement these procedures during their typical day. This is consistent with prior research using a similar professional development model to implement and evaluate low-intensity strategies Lane, Royer, et al., 2015; Messenger et al., 2017). This study extends prior research by involving teachers who were novice data collectors. Despite these encouraging outcomes, it is important to note that the strength of this study is also a potential limitation. As teachers were responsible for both data collection and implementation, they were obviously not blinded to the intent of the study. However, the high rates of reliability with the research team suggest if this effect was present, it was limited.
Another encouraging thing about these outcomes is that they suggest teachers can collect data and implement the intervention with levels of reliability and integrity required to meet core quality indicators for high-quality research (e.g., CEC, 2014), as the research community should support our practitioner partners with the skills to test interventions in their district and classrooms. This is a step forward in the effort to bridge the research to practice gap. For example, one teacher shared that she had used momentary time sampling with another student who engaged in OFF behavior in the classroom while chewing on his pencils. She collected baseline data and then gave him a choice of more appropriate objects to chew (e.g., gum). In addition, two of the other teacher participants made anecdotal comments that they planned to use the data collection methods with other students and the choice activities at other times of the school day. Similarly, three of the teacher participants shared plans to use momentary time sampling to monitor their use of other low-intensity strategies in the classroom. Researchers may want to consider replicating these findings to examine the extent to which these findings are generalizable. In addition, future researchers may want to continue to consider ways to involve teachers and other school personnel in the research process to further bridge the research-to-practice gap.
Instructional Choice and AE
Despite the positive impact the professional development model had on teacher behavior, there were limited treatment effects on student behavior. Although changes in level for AAE, AE, and OFF behaviors were observed for upon introduction of the first intervention phase for most students, these levels did not appear to have a functional relation with the intervention, as engagement either did not reverse when the intervention was withdrawn or did not improve when the intervention was reintroduced. These findings are consistent with the current research investigating instructional choice in math. To begin, Jolivette et al. (2001) only observed increased performance for two of three participants. Second, Carson and Eckert (2003) found that empirically selected intervention were more effective than student-selected. Finally, Lannie and Martens (2008) saw increased digits correct per minute for all participants, but we cannot distinguish if the effect was from choice making alone because of the intervention package used.
Although a lack of therapeutic effect is rarely, if ever, the goal of school-based intervention research, we can still learn from null findings. Unfortunately, there are few published studies with a lack of treatment effect and/or functional relation in special education (Maag & Losinski, 2016). As we consider under what conditions an intervention does or does not work, the current study adds valuable information to researchers and practitioners on the use of instructional choice. It is equally important to learn from interventions that yield desirable effects as well as those that do not yield favorable outcomes to address issues of publication bias (Cook, 2016).
One possible reason for the lack of treatment effect could be attributed to the type of choice provided. Prior to this study, all investigations using choice in math for students with and at-risk for EBD has involved across-activity choices. Although research has shown that within-activity choices can be effective for students (e.g., Lane, Royer, et al., 2015), some research has demonstrated that across-activity choices are more powerful (Dibley & Lim, 1999; Rispoli et al., 2013). This is perhaps because across-activity choices allow students to have control over in what activity they engage and within-activity choices only give students control over how they engage in a teacher-selected activity. Researchers may want to continue the work of Dibley and Lim (1999) and Rispoli and colleagues (2013) by making direct comparisons between choice types. One way researchers have responded to this is by aligning choice type with the estimated function of a student’s behavior, thus increasing the value- and behavior-altering effects of the motivating operation (Michael, 2007), and by providing choices that allow students to access (positive reinforcement) something preferred (e.g., with whom to work, which materials to use) or avoid something that is nonpreferred (e.g., choosing which problems to complete, choosing the order in which tasks are completed; Jolivette, Ennis, & Swoszowski, in press). Although this was not a planned component for the current study—supporting teachers to implement and collect data on outcomes of a low-intensity strategy—future researchers may want to consider evaluating the function of participants’ behavior.
Another possible explanation for a lack of functional relation is related to the lack of a significant decrease during the withdrawal phase for most students. This can potentially be affected by the fact that most teachers reported offering choice in other activities throughout the day. Furthermore, on one occasion during an IOA observation during the withdrawal phase, Ms. Chappell provided a choice to the whole class that allowed Carlo to choose with whom to work and later within the same observation session where he wanted to work. The first author provided coaching at the end of the class and explained to her that providing choices to the whole class that allowed Carlo to individually make choices was similar to the intervention conditions and should be avoided for the remainder of the phase. The teacher shared that it had not occurred to her that a class choice may affect data collection during the withdrawal phase. As teachers were primary data collectors, it is unknown whether or not they provided choices during the withdraw phase during math. However, this was not observed during reliability checks in any other classrooms. Similarly, on one occasion, Mrs. Perry told Phillip that he could work with a partner during math. Although Perry did not get to choose a partner, Ms. Perry assigned him to work with the same partner he routinely selected during the intervention phase. Although this threat to experimental control is not uncommon in applied settings, such as classrooms, researchers should make every effort to prevent the possibility of carryover affects. In this study, during the withdrawal phase, teachers continued collecting treatment integrity data on their baseline practices only. Future researchers may want to consider collecting treatment integrity data on intervention practices during withdrawal phases so that teachers can note if they inadvertently provided choices. Collecting these data will provide needed information to determine whether contamination occurred between during baseline and withdrawal phases (see Messenger et al., in press).
Another potential impact on the level of engagement is related to the difficulty and variability of math tasks presented over the course of data collection and the students’ academic achievement. Ms. Ellison and Ms. Jansen both shared that the intervention was introduced at a time when math tasks were difficult (i.e., word problems involving fractions, word problems involving unknown variables). Given that the students were at-risk for both academic and behavior difficulties, their limited ability in math may have affected their engagement in the lesson. For example, all students were below benchmark in both reading and math according to the STAR Assessments, and Elle had a below average estimated full-scale IQ. Similarly, there was variability in the daily tasks in math which could have resulted in students enjoying or being more motivated to participate in preferred activities. Again, these are common issues in school-based research where only behavioral variables are manipulated and the content of the lesson is unchanged, following the standard course of study.
A possible limitation that may or may not have affected these findings is related to the interruptions in data collection due to teacher absences, student absences, weather days, and holiday breaks. Although this is a common occurrence in school-based intervention research, studies involving teachers as data collectors may be more susceptible to this threat as data cannot be collected in their absence. Similarly, Ms. Jensen had to go on an unplanned medical leave during the second intervention phase, which is why her second intervention phase only has three data points and her maintenance phases are at longer intervals than originally planned. Her regular data collection was near conclusion, but situations such as this can affect class routines and data collection. Likewise, there were days prior to and following holiday breaks where remediation activities were implemented, disrupting the regular routine and preventing data collection. Furthermore, maintenance data were only collected with two teachers, as the other two teachers completed data collection just before the beginning of state testing review and subsequent testing.
Another limitation is related to the lack of information on the engagement of other students in the class. Although there are no recent studies on expected levels of engagement in traditional classrooms, previous researchers have found that high-achieving students display levels of engagement of 75% or higher; whereas low-achieving students display levels of engagement below 50% (Kauchak & Eggen, 1993). Although Elle’s AE in baseline was 77.10%, her AE did not return to that level until the second intervention phase (77.55%). Although Ms. Ellison was advised that Elle’s engagement did not warrant intervention, she wanted to continue in the process for her own professional development and because she felt that Elle was unlikely to sustain such high levels of engagement. Carlo’s AE surpassed 75% only during the 4-week maintenance phase (77.50%). José’s AE exceeded 75% during the withdrawal (77.00%) and second intervention phases (89.00%). Future researchers may want to consider collecting data on the engagement of comparison peer(s) to determine the typical level of engagement for that classroom (Ennis, Jolivette, Fredrick, & Alberto, 2013).
Social Validity
The social validity findings from both the teacher and student perspective demonstrate moderate to high levels of acceptability of the goal, procedures, and outcomes of the intervention. This is an important and promising finding that is also consistent with previous research using limited university supports (Lane, Royer, et al., 2015; Messenger et al., 2017). One potentially discouraging finding, however, is that most teachers rated the intervention lower at posttest than at pretest. This is not surprising given the lack of a treatment effect. Conversely, most student’s posttest evaluation increased over their pretest responses, suggesting that even if the intervention was not successful in improving engagement, students were overwhelmingly satisfied with the procedures. Researchers should continue to collect data both pre- and postintervention to garner information on participants’ overall perceptions of the intervention and determine whether those perceptions change as a result of implementation.
Summary
Professional development models can be used to empower teachers to use low-intensity strategies to support instruction and collect data to evaluate their effectiveness using socially valid procedures. This has promise for helping to bridge the research-to-practice gap. Although a functional relation was not observed between the instructional choice intervention and students’ engagement, we can still learn a great deal from studies with null findings.
Footnotes
Declaration of Conflicting Interests
The author(s) declared no potential conflicts of interest with respect to the research, authorship, and/or publication of this article.
Funding
The author(s) disclosed receipt of the following financial support for the research, authorship, and/or publication of this article: This project is funded by the Institute of Education Sciences Special Education—Research and Innovation to Improve Services and Results for Children With Disabilities—Project Empowering Teachers With Low-Intensity Strategies to Support Instruction II–R324B150028.