
Abstract
Extended time to complete course examinations is the most commonly provided accommodation to students with disabilities in postsecondary institutions. However, there is a paucity of studies that examine the use and influence of extended time in true testing situations. The present study examined test accommodation used by 596 students with disabilities at a large research university. These students completed a total of 3,726 exams in 1,517 unique courses. Results indicated that extended time was used in approximately half of the tests, and of these, a nearly there was an even split between the use of less than and more than 50% additional time. In a statistical model predicting whether a participant used extended time at least once in a course, having a learning disability, having attention-deficit/hyperactivity disorder (ADHD), and taking a science, technology, engineering, and mathematics (STEM) course were statistically significant predictors of whether a participant used extended time in a course. Implications and areas for future research are presented.
Section 504 of the Rehabilitation Act of 1973 and the Americans with Disabilities Act (ADA) Amendments Act of 2008 mandate that otherwise qualified college students with disabilities be provided with appropriate academic adjustments, or accommodations, if requested (U.S. Department of Education, Office for Civil Rights, 2011; U.S. Government Accountability Office, 2009). Specifically, Section 36.309 of the ADA regulations state that any entity that “offers exams related to . . . credentialing for secondary or postsecondary education” (§36.309(a)) must make accommodations on exams, including “changes in the length of time permitted for completion of the examination” (§36.309(2)). The accompanying regulations note extended test time as a possible manner to make a program accessible.
Data from several sources reveal that providing additional time to complete exams is the most commonly provided academic accommodation by colleges throughout the United States and Canada (Raue & Lewis, 2011; Sokal & Wilson, 2017). The U.S. Department of Education (2014) defined this as “changes to the regular testing environment and auxiliary aids and services that allow individuals with disabilities to demonstrate their true aptitude or achievement level” (p. 2). The most recent available statistics from the National Center on Education Statistics (Raue & Lewis, 2011) indicate that 93% of all degree-granting institutions in the United States provided additional exam time to students during the 2008–2009 academic year. This included 97% of public 2-year schools and 99% of public 4-year schools. In a survey of student accessibility coordinators from 48 postsecondary institutions across Canada, Sokal and Wilson (2017) reported that 94% of participants reported providing extended test time to students, most often 50% extended time (also known as “time and a half”) which was offered by 54% of institutions.
From an individual student perspective, 21% of all students with disabilities who attend college and self-disclose reported receiving extended time on tests making it the most commonly used accommodation. By comparison, the next most commonly reported accommodations were extended time for assignments (6%) and use of a reader (4%; Newman & Madaus, 2015). Institutional specific data from two other studies show that roughly three quarters of students with disabilities who were registered with their accessibility services office used extended test time (79.9%; Pingry-O’Neill et al., 2012; 75.9%; Kim & Lee, 2016).
Multiple studies have examined the question of fairness of extended test time, primarily in relation to students with learning disabilities (LDs) and attention-deficit/hyperactivity disorder (ADHD), and specifically, how college students with these disabilities compare with their peers without disabilities when given standard time, 50% extended time (also known as “time and a half”), or 100% extended time (also known as “double time”; Alster, 1997; Lewandowski et al., 2013; Lovett & Leja, 2015; Miller et al., 2015; Ofiesh, 2000; Runyan, 1991; Spenceley et al., 2020; Wadley & Liljequist, 2013). Although research focusing on the relationship of extended test time on performance and fairness is indeed important to explore, each of these studies occurred in simulated settings and did not include how much time students use in actual college testing situations, nor the variables that predict the time used (Holmes & Silvestri, 2019; Sokal & Vermette, 2017; Spenceley & Wheeler, 2016). Sokal and Wilson (2017) also pointed out that many of the studies on extended time assume that homogeneity exists among students with disabilities, ignoring the diversity of students with disabilities.
Many of these studies sought to fill in gaps that are present in the literature concerning the validity of the extended time accommodation and other testing accommodations at both the K–12 and postsecondary levels. An early meta-analysis (Chiu & Pearson, 1999) noted that testing accommodation slightly benefited students with disabilities more than students without disabilities, but noted that the evidence supporting this contention was sparse. Most of the literature has examined these accommodations for individuals with LDs, and often accommodations are packaged together so it is difficult to determine the differential impact of specific accommodations (Lai & Berkeley, 2012). Fletcher and colleagues (2006, 2009) were able to demonstrate that extended time improved the performance of students with disabilities at both the elementary and middle school levels, respectively, versus taking assessments in standard time. Students with disabilities show slightly more improvement than students without disabilities in the two conditions. A more recent meta-analysis (Vanchu-Orosco, 2012) indicated that extended time benefit students with disabilities more than students without disabilities. Feldman and colleagues (2011) demonstrated that the gain in academic achievement from extended time is linked to an improvement in students’ self-efficacy in this condition.
A small but growing body of research has begun to examine the use of extended test time by college students with disabilities based on test accommodation records from accessibility services offices records. Spenceley and Wheeler (2016) reviewed records on 1,093 exams taken over two semesters by 187 students with disabilities at a public university in the northeast United States and found that 54.6% completed their exams within the standard time allotment. Holmes and Silvestri (2019) examined records of 2,860 tests taken over 2 academic years by a sample of 166 full- and part-time students at a community college in Canada. Results indicated that 69% of the exams taken by students with LD were completed within the standard class time, as were 69.9% of exams taken by students with ADHD and 68.3% of exams taken by students with psychological disabilities. The authors found that more than 80% of students in each group who used extended time did so within 1%–25% of the extended time period, and 88% of students with LD who used text to speech assistive technology finished within standard time limits. Sokal and Vermette (2017) analyzed records of 8,857 exams taken over 2 academic years by students at two Canadian universities and found that 35.5% of the exams were completed within standard time, with 19% completing with 25% extended time and an additional 29.5% completing within 50% extended time. The researchers also discovered that students used more test time in Year 2 of their program of student than in Year 1, and likewise, more test time in Year 3 in comparison with Year 2. Time used remained consistent between Years 3 and 4.
To understand the experience of students receiving this accommodation, Slaughter et al. (2020) conducted one-on-one interviews with 21 undergraduate students with a range of disabilities. Each of the students commented on the benefit of using extended time, with responses clustered into three areas. Several students noted that it reduced their anxiety, making “them feel less rushed” (p. 8) or giving them the opportunity to take breaks if their anxiety was affecting their ability to think. Second, other students stated that the extra time enabled them to be able to “demonstrate their true knowledge and ability” (p. 8) because of a need to read and process questions. Third, several students specifically linked the use of extra time to improved grades, with one noting “I think it’s definitely one of the things in my college career that’s helped me the most” (p. 9). Some (57%) of the students also described some drawbacks to the use of extended time, including changing answers from correct to incorrect, scheduling concerns, lack of access to the instructor and missing information provided to the class, and peer stigma and perceptions of possibly unfair advantages.
These studies, conducted with data from real students in natural settings, are important foundational steps to help determine what levels of extended time are really used, and needed, by college students with disabilities. Such data can help to provide better guidance to service providers regarding how much test time to provide, decisions that are made locally by each service provider (Ofiesh & Hughes, 2002). Several researchers have noted that to 50% or 100% extended time is a default, or blanket accommodation, provided to students (Lewandowski et al., 2013; Sokal & Vermette, 2017; Sokal & Wilson, 2017). Likewise, in a review of studies on extended test time and students with LDs dated to 2000, Ofiesh and Hughes (2002) found that the analyzed studies recommended “time and one-half to double time as a general rule” (p. 10).
However, Lewandowski et al. (2013) commented that case-by-case decisions based on clinical judgment are required because there currently is no standardized method for determining the proper amount of time. Ofiesh and Hughes (2002) also pointed out that differences among postsecondary institutions should be considered in making these decisions. They recommended that service providers create a database on their own student body that examines such questions as the amount of time provided, the amount of time used, and the amount of time used per subject. In so doing, the service providers could make systematic decision that were based in data and their judgment. Follow-up on this recommendation, offered nearly two decades ago, remains limited in the current professional literature. As a result, Sokal and Wilson (2017) observed that service providers who make these extended time decisions “have little guidance from the research regarding appropriate duration” (p. 40).
In addition to questions of fairness, practical considerations exist regarding determining proper amounts of extended time. As noted, in the study by Holmes and Silvestri (2019), most students approved for extended time did not use it. The authors commented that this trend should be “contrasted against the fiscal, space and personnel restraints that exist within many postsecondary institutions” (p. 13), and they called for review of current procedures for making these determinations. To do this, testing data used by college students in natural test environments and demands must be examined, rather than testing in controlled settings and using standardized tests as proxy measures. Sokal and Wilson (2017) note these approaches raise questions regarding whether the results can be generalized into actual course-based settings.
Thus, the present study seeks to extend this research and examine the use of extended test time in a sample of students with disabilities in a large public research university in the northeast. It is the first such study to employ inferential statistics and to study a broad range of potential predictors and the second study to gather data from a U.S. sample. The following questions guided this investigation:
How much extended time on exams is used by college students with disabilities who self-disclose?
What student factors (e.g., gender, class standing, disability type, and number of disabilities) are associated with the use of extended test time in a sample of college students with disabilities who self-disclose?
What course factors (e.g., science, technology, engineering, and mathematics [STEM] vs. non-STEM, course level) are related to the use of extended time in a sample of college students with disabilities who self-disclose?
What student and course factors are statistically significant predictors of whether a college student with a disability who self-disclose actually uses extended time at least once in a course?
Method
De-identified data from the Spring 2019 semester were gathered from a disability service office at a large public university in the northeast United States to answer these research questions. Accessibility services professionals proctor exams within their setting and require students to clock in and out of each exam to collect reliable data concerning the length of time that students actually require to complete exams. It is important to note that not all exams are proctored within this setting as professors or teaching assistants can choose to provide this accommodation on their own; the data from this study only include the tests proctored at the accessibility services office.
Institutional review board (IRB) approval for this study was not required as it was determined that it did not qualify as human subjects research as it solely involved the analysis of de-identified data. After this determination, the researchers worked with the staff at the disability office to indicate the fields from their internal databases that should be included in the final de-identified database. Data were gathered by staff at the disability service office who removed all identifiable information before sending it to the researchers.
The database included the participants’ gender, class standing, disability diagnoses, and the testing accommodations for which they were approved. It also indicated the course number and subject for each exam as well as the actual time students needed to complete the exam and another variable that indicated the amount of time they would have had in class to complete the examination. A variable indicating the type of examination (i.e., quiz, examination, or final examination) was also included in the database. Variables with the students’ final course grade, semester GPA, and cumulative GPA were also present in the initial database.
Data Cleaning
The initial database provided to the researchers included information for 4,311 exams that were proctored during the Spring 2019 semester. These exams were taken by 677 students. This data file included information from exams that were denoted by the instructors as quizzes. As quizzes are shorter assessments, the researchers removed these data from the analysis. In addition, the team removed graduate students and nondegree students from the database as well as exams taken in graduate courses taken by advanced undergraduates (n = 47 exams). The database also included exams taken by students in a small associate degree program at the university, and the researchers excluded these data from the final analysis (n = 34 examinations). Participants in the database who did not have extended time as a testing accommodation were also excluded. Finally, exams were removed from the database if the course grade indicated that the student withdrew before the end of the term, was incomplete, or was listed as being a pass/fail. This exclusion allowed the researchers to include course grade as a co-variate in the model. In total, records remained on 596 students from in a total of 1,517 courses and 3,726 exams.
Procedures
Once the database was narrowed to include exams taken by undergraduate students in undergraduate courses in which they qualified for extended time as an accommodation and earned a numerical grade, several fields in the database had to be recoded to allow for meaningful analyses. First, course grades were converted to the 4.0 grade scale utilized by the institution (i.e., F = 0, D− = 0.7, . . .A = 4.0).
Second, the database provided to the researchers included the specific diagnoses for each individual participant, and up to 13 diagnoses could be listed. These data were collapsed into the following six binary disability categories to ensure the anonymity of participants and to provide for meaningful analyses. Any form of LD or ADHD diagnosis was categorized as a LD or ADHD, respectively. Any other diagnosis that appears in the Diagnostic and Statistical Manual of Mental Disorders (American Psychiatric Association, 2013) was coded as a psychiatric disorder with the exception of developmental disorders. Developmental (including autism spectrum disorder) and language-based disabilities as well as acquired brain injuries were coded as other-invisible. All sensory and orthopedic impairments were coded as other-visible. All remaining medical diagnoses were coded as health disabilities. It is important to note that individuals could have diagnoses in more than one disability category. In addition, variables were calculated for the total number of disability categories present for each participant and a binary variable that was coded if the participant had disabilities in two or more categories.
Third, a variable was calculated that divided the amount of time a participant used to take an exam by the amount of time their classmates had to take the exam in class. Based on this ratio, another variable was calculated that indicated whether the participant used standard time, 25% extended time (ratio 1.01:1.25), 50% extended time (ratio 1.26:1.50), 100% extended time (1.51:2.00), or greater than 100% extended time (ratio of 2.01 or greater). Fourth, data regarding the testing accommodations received by the participants were coded into a variable that indicated how much extended time for which they qualified (i.e., 50%, 100%, or 200%). For each exam, a binary variable was also calculated that indicated whether they actually used the time for which they qualified.
Finally, variables were calculated based on the course name and number for each exam. The university has an STEM initiative, so their list of STEM majors was used to calculate a binary variable indicating whether an exam was taken in an STEM course or not. Because this university uses a course number system that designates courses as being primarily for freshmen, sophomores, juniors, or seniors and ordinal variable was also calculated based on the course level (i.e., freshmen = 1, sophomore = 2, etc.).
The database was then separated into two additional files. The original database was maintained to allow for analysis at the exam level. An additional file with one entry per course was also created, and a variable was computed that indicated whether the participant actually used extended time at least once on an examination in the course. Finally, the third database had one entry per student so demographic characteristics of the sample could be analyzed.
Data Analysis
To investigate the first three research questions, descriptive statistics were calculated in SPSS Version 26. No inferential statistics were calculated to answer the first three research questions. Due to the complexity of the data and because students could have multiple examinations across multiple courses, the decision was made to focus on the course-level database to answer the fourth research question. Because these data violated the assumption of independence as there were a variable number of entries per student, a generalized linear mixed model (GLMM) was used. The dependent variable was whether students actually used extended time at least once in a course, so the model was actually a generalized form of logistic regression. Participants and courses were included as random factors in the model. Student gender, the six binary disability category variables, and the final course grade were included as fixed predictors in the model. In addition, course level and the binary variable indicating whether it was an STEM course were included as fixed predictors in the model. Class standing was intended to be included as a factor a priori, but prior to running the analysis, the correlation table (see Table 1) was reviewed. Class standing and course level are highly correlated (r = .55), so the decision was made to only include course level in the final model.
Correlation Table for Predictors in GLMM Model.
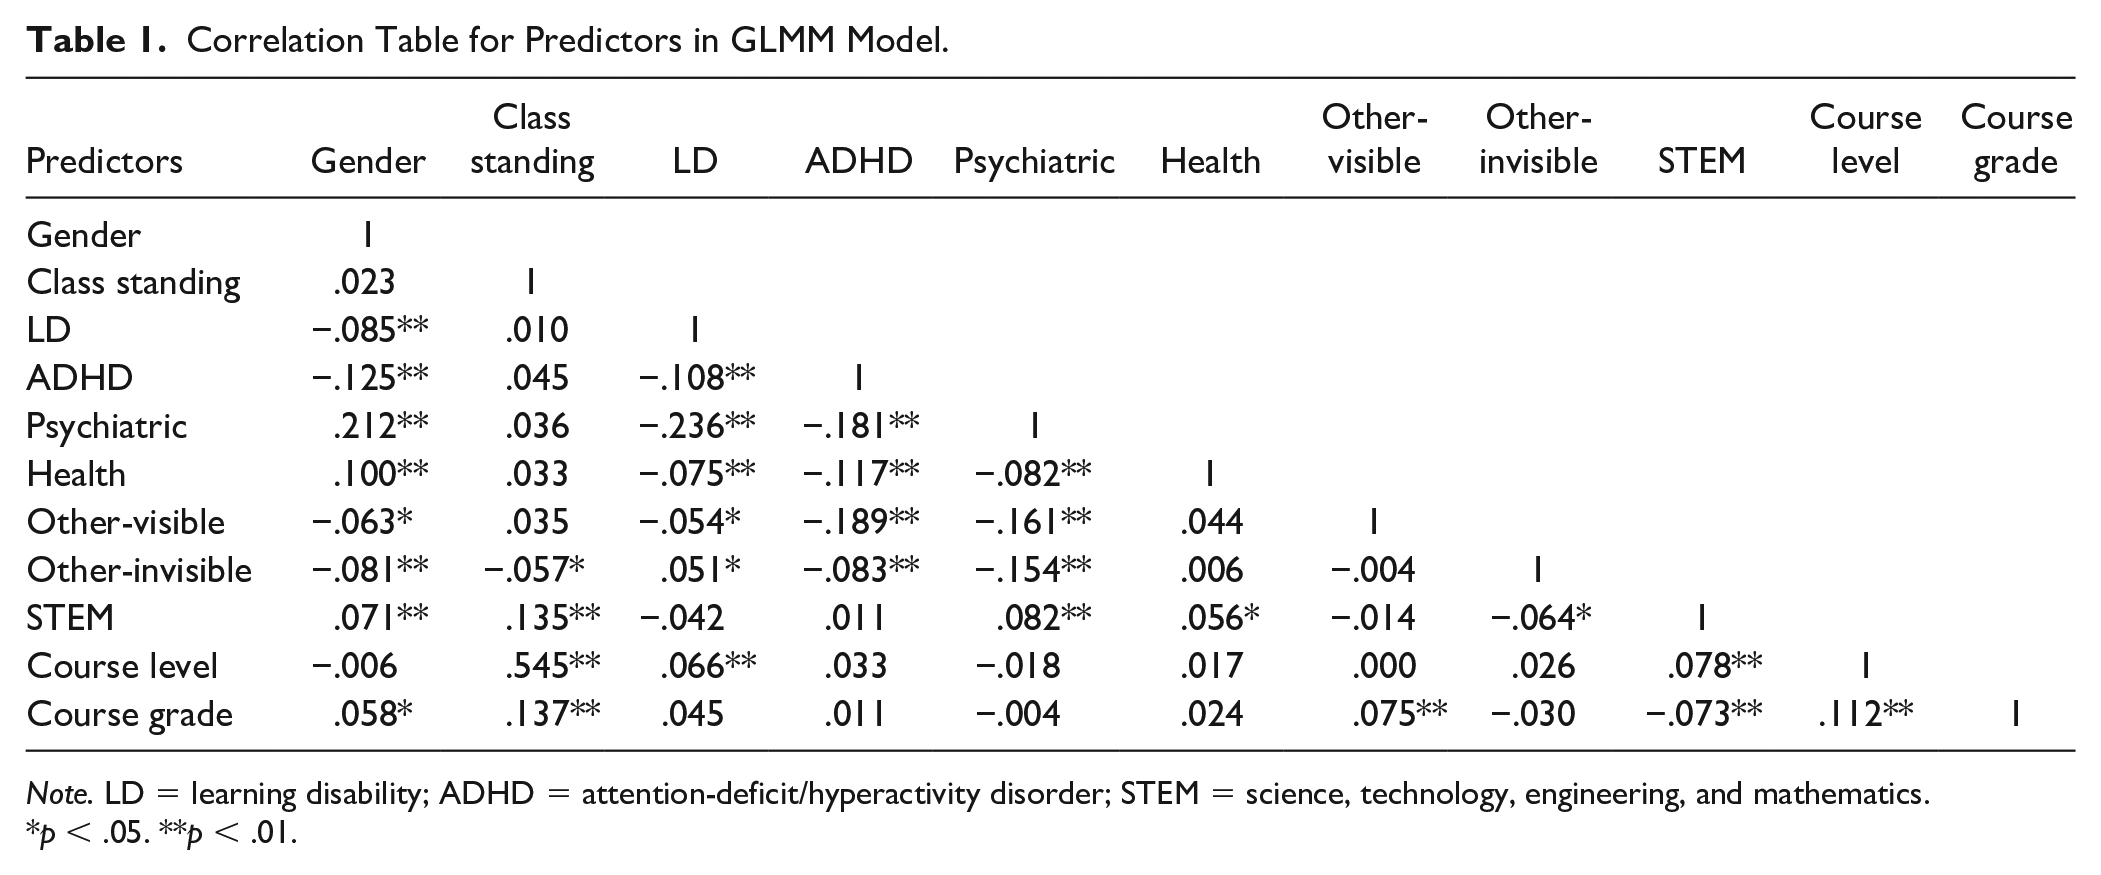
Note. LD = learning disability; ADHD = attention-deficit/hyperactivity disorder; STEM = science, technology, engineering, and mathematics.
p < .05. **p < .01.
The GLMM model was analyzed in R (Version 3.6.2). Although the “nloptwrap” is the default optimizer, using it did not lead to convergence so the “bobyqa” optimizer was used and lead to successful convergence. After running the model, the residuals were analyzed to determine whether there were any outliers, and none were observed to be present so this assumption of GLMM was met. Finally, the normal probability plots for the random effects were observed and indicated that the random effects are a result of a normal distribution, which indicates that this assumption of GLMM was also met.
Sample
As noted, after the data that did not meet the inclusion criteria were excluded, the final database included 596 individuals who were in a total of 1,517 courses and took a total of 3,726 exams. On average, participants used extended time in approximately three courses and took approximately two exams in each course. As depicted in Table 2, the participants in the sample were primarily female and upperclassmen. In terms of disability categories, almost half the sample had at least one psychiatric diagnosis, and approximately 40% of the sample had ADHD. A substantial majority of the sample (n = 408; 68.5%) had disabilities in only one category. The remainder of the sample had disabilities in two (n = 150, 25.2%), three (n = 27; 4.5%), or four categories (n = 11, 1.8%). Almost 98% of the sample were full-time students at the university (n = 581; 97.5%). One participant qualified for 50% extended time (“time and a half”) and three qualified for 200% extended time (“triple time”). The remaining participants qualified for 100% extended time (“double time”; n = 592; 99.3%). It is important to note that this study was conducted with students with disabilities who chose to disclose their disability to their institution. Other students with disabilities who did not self-disclose to the disability services office were therefore not part of this analysis, nor where those who may have self-disclosed directly to a professor and arranged accommodations without going through the disability services office.
Sample Demographic Characteristics.
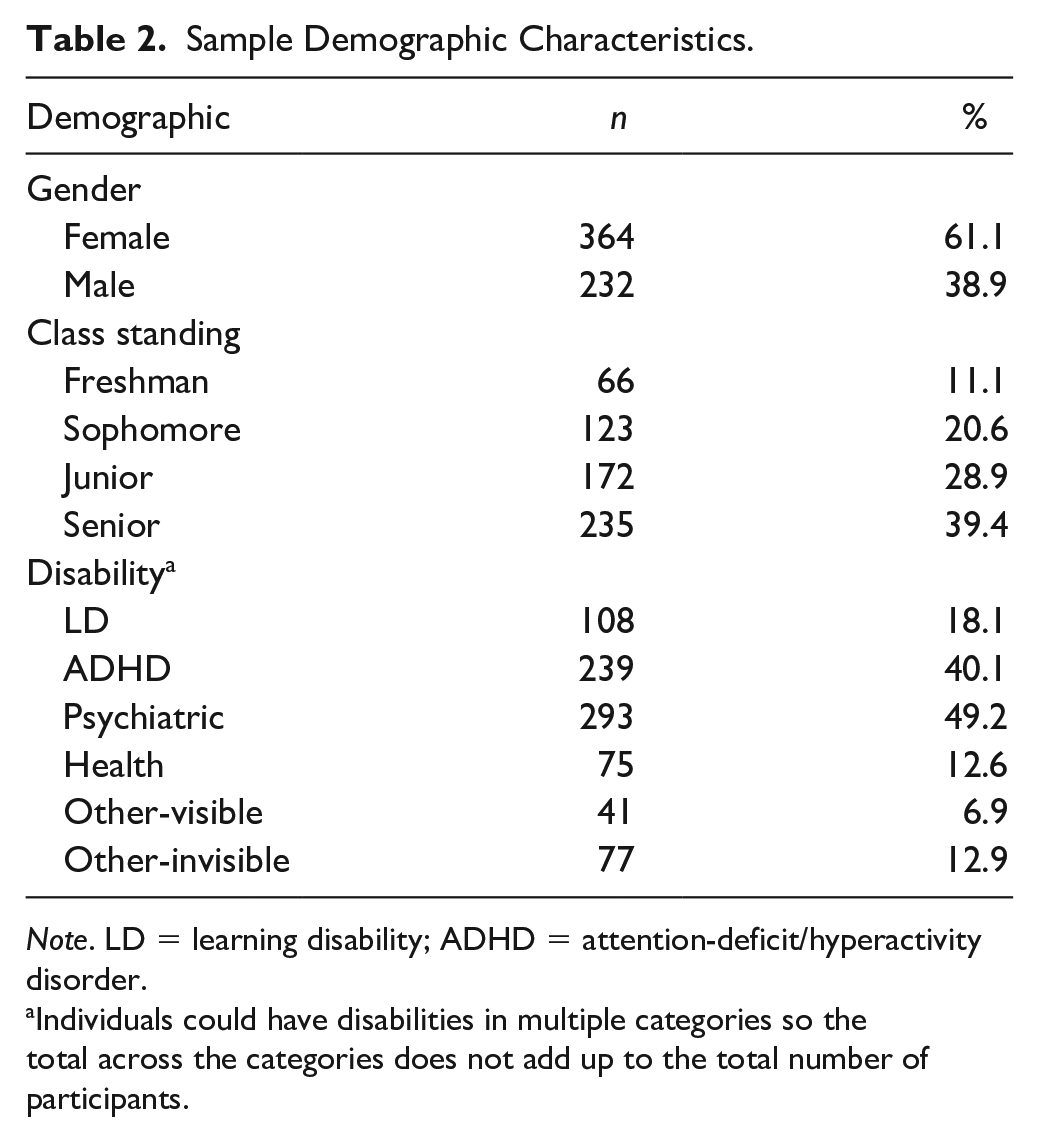
Note. LD = learning disability; ADHD = attention-deficit/hyperactivity disorder.
Individuals could have disabilities in multiple categories so the total across the categories does not add up to the total number of participants.
Results
The first research question concerned the prevalence of extended time use by college students with disabilities who self-disclose. To address this question, data were analyzed at two levels: (a) exam level and (b) course level. Extended time was used on 48.5% of the 3,726 exams (n = 1,807). As depicted in Figure 1, for individuals who used extended time, approximately half (n = 889; 49.2%) of the exams required less than 50% additional time and the other half of the exams required more than 50% additional time (n = 918; 50.8%). When these data are cross-referenced with the amount of time for which participants were approved, only 24.6% (n = 916) of exams required the amount of time for which participants were approved. As participants often had more than one exam per course (mid-term and final exams), these data were also analyzed at the course level using the binary variable indicating whether the participant used extended time for at least one of the exams in a course. Extended time was used at least once in more than half of the 1,517 courses (n = 880; 58.0%).
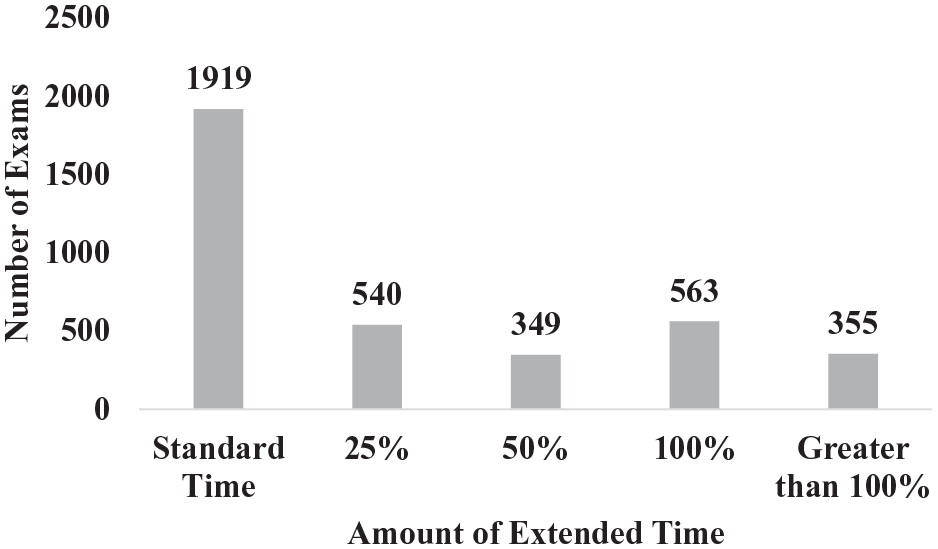
Number of exams by amount of extended time used.
The second research question involved describing the relationship of student factors with the use of extended time by college students with disabilities who self-disclose. Again, data were analyzed at the exam and course levels using descriptive statistics (i.e., percentages). At the exam level, juniors used extended time on less than half of their exams (43.6%), whereas freshmen (52.0%), sophomores (50.4%), and seniors (50.2%; see Table 3) used it on more than half. Students with one disability category used extended time on less than half of their exams (46.9%), whereas students with two or more disability categories (range: 50.0%–59.6%) used it on more than half of their exams. No student factors were observed to be related to whether participants actually used the extended time for which they were approved. At the course level, freshmen used extended time at least once in a course approximately half of the time (52.5%), whereas students from the other class standings (range: 55.7%–60.6%) used it at least 55% of the time. Students with multiple disabilities (range: 59.4%–68.9%) used extended time at least once in a course at least approximately 60% of the time, whereas students with one disability category used it 56% of the time.
Percentage of Participants Using Extended Time at the Exam and Course Levels by Demographic Category.
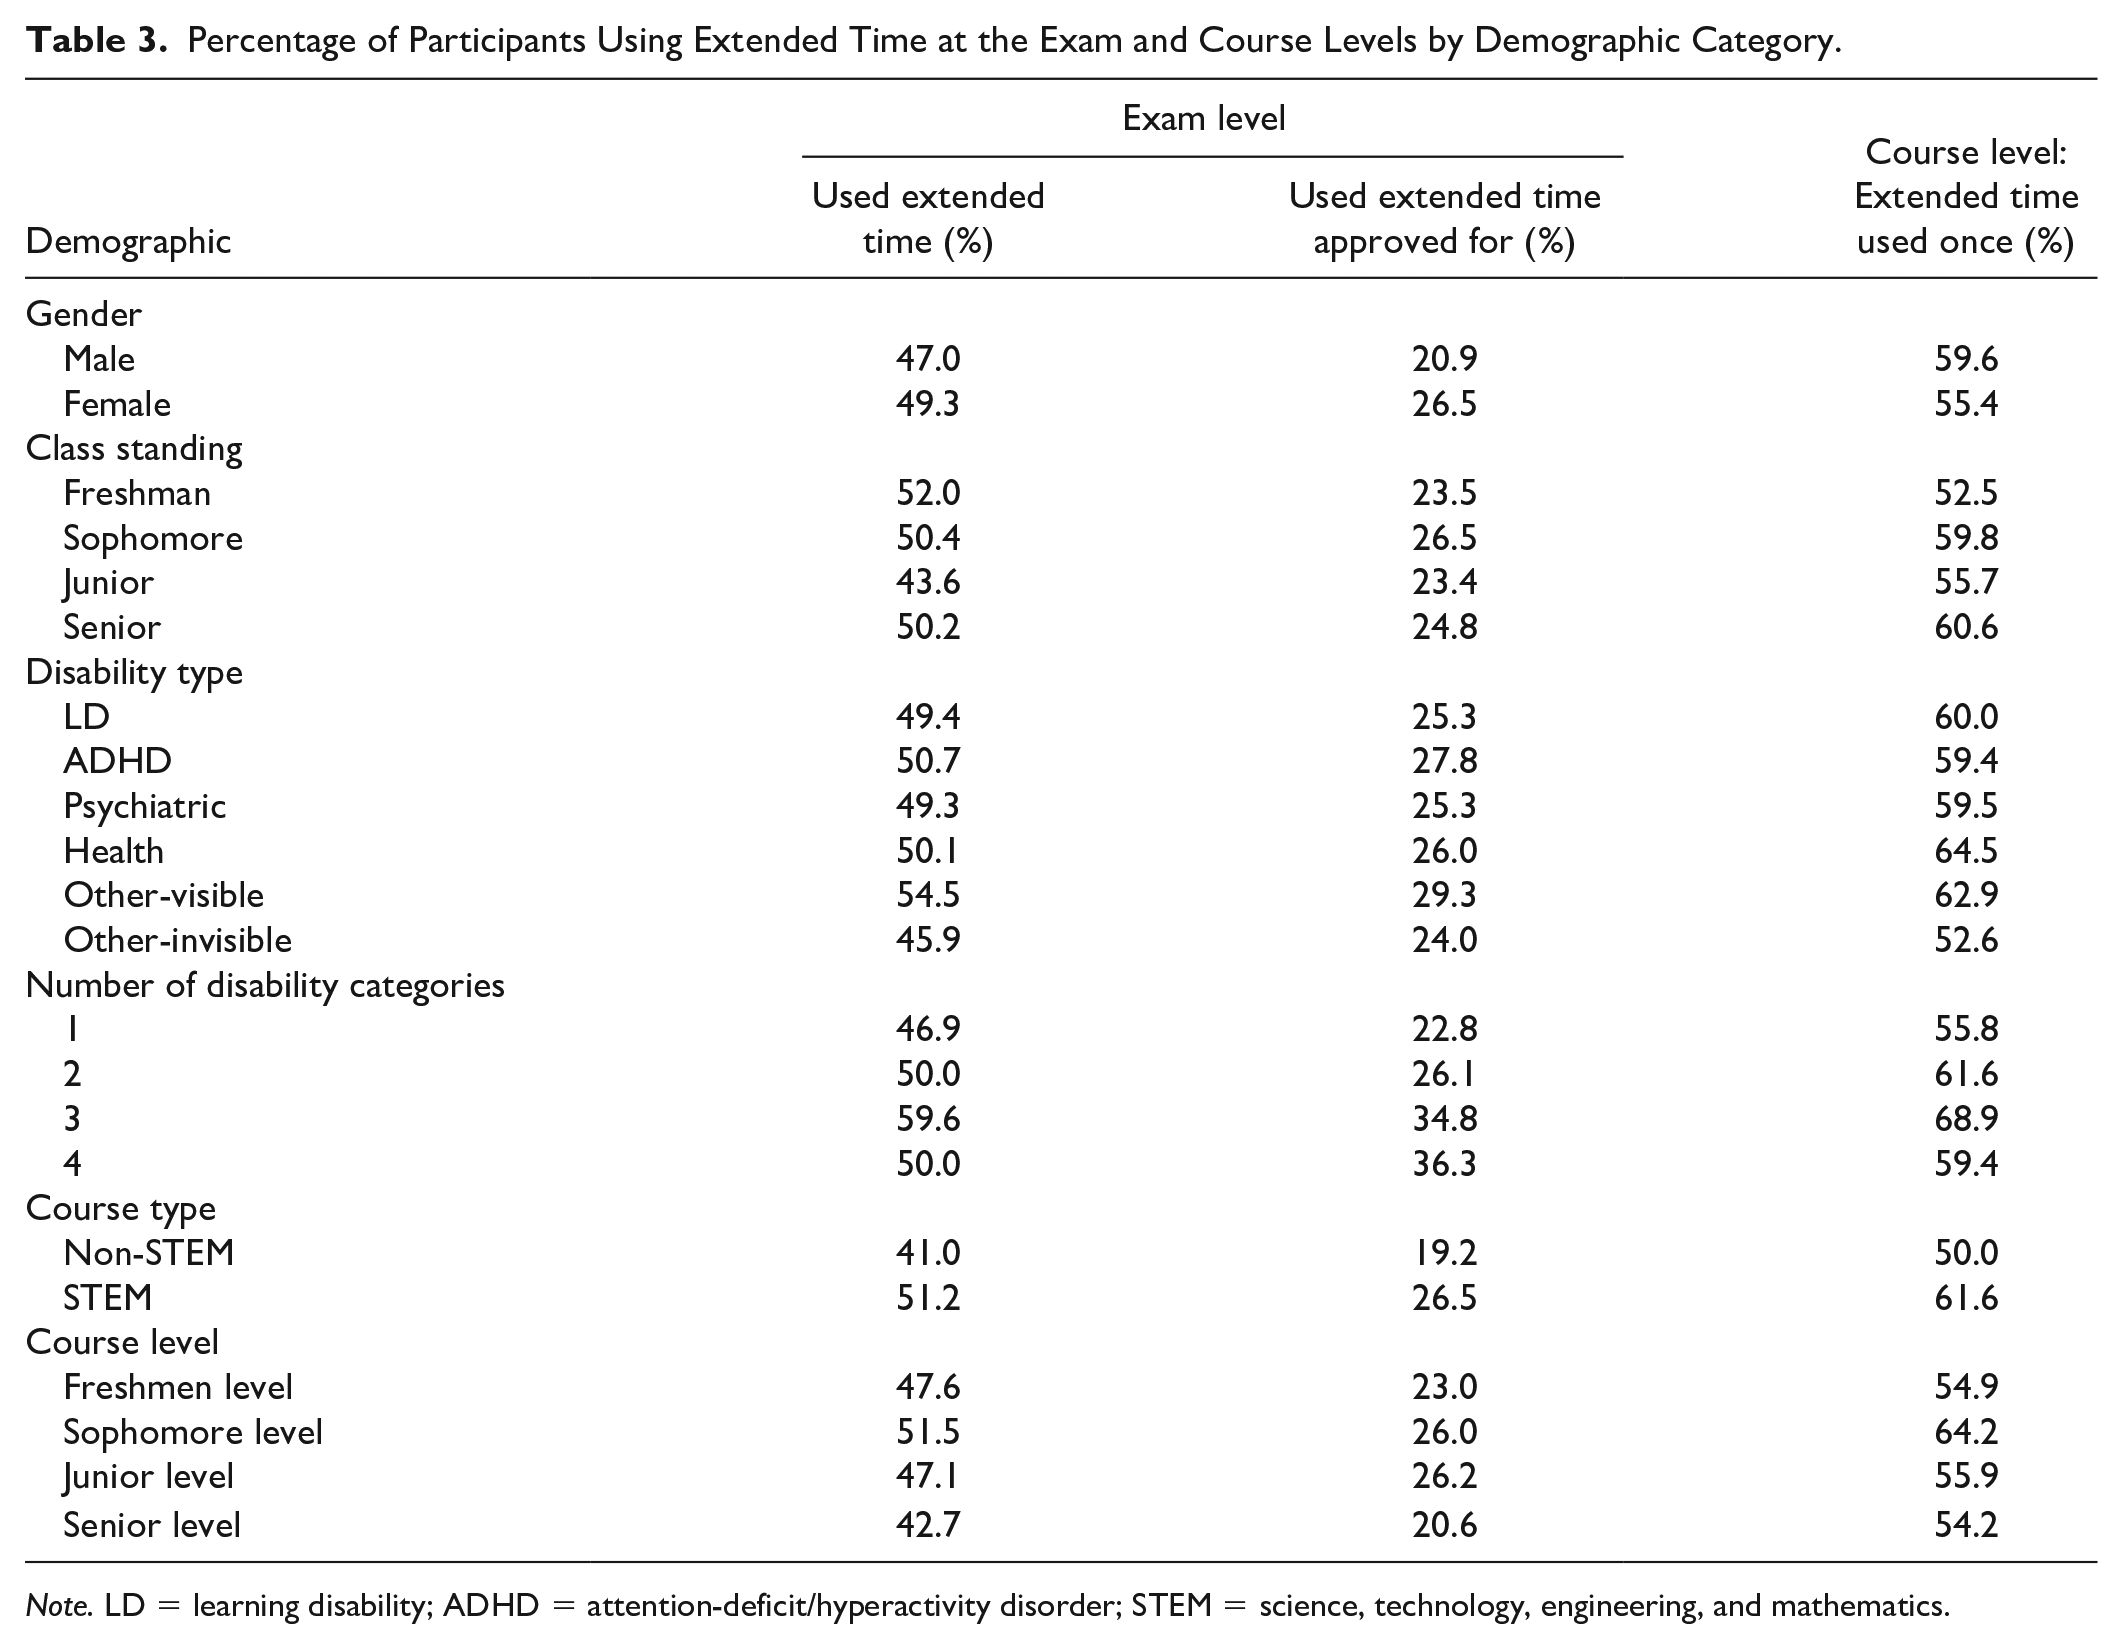
Note. LD = learning disability; ADHD = attention-deficit/hyperactivity disorder; STEM = science, technology, engineering, and mathematics.
The third research question focused on the course factors that may be associated with the use of extended time by college students with disabilities who self-disclose. Data at the exam and course levels were analyzed using descriptive statistics (i.e., percentages). At both the exam and course levels, extended time was used on more than half of exams taken in STEM courses, whereas extended time was used in 41% of the exams in non-STEM courses, as indicated in Table 3. Extended time was utilized at least once in approximately 62% of STEM courses, as compared with 50% of non-STEM courses. Course level was not observed to be associated with extended time use at either the exam or course level.
The fourth research question concerned the relative efficacy of predictors about whether students actually used extended time at least once in a given course. A GLMM using a logistic regression framework was used to analyze these data. Participants and course names were included in the model as random effects, as depicted in Table 4. The intraclass correlation coefficient (ICC) for random effects was .65. The fixed effects in the model included gender, disability type, course grade, STEM versus non-STEM, and course level. The marginal R2 was .047, whereas the conditional R2 was .665. Having a LD, having ADHD, and taking an STEM course were statistically significant predictors of whether a participant used extended time at least once in a course.
Results of GLMM Logistic Regression Predicting Use of Extended Time at Least Once in a Course.
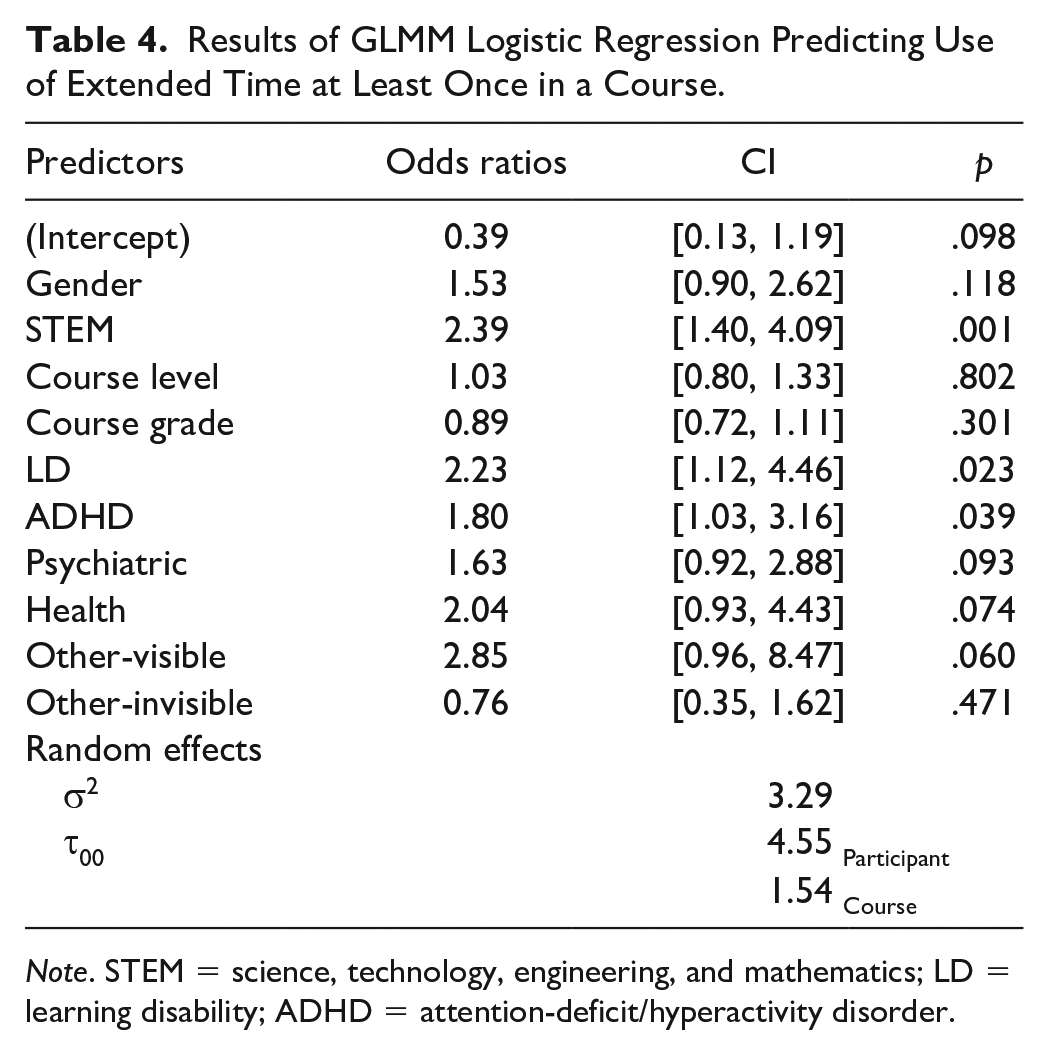
Note. STEM = science, technology, engineering, and mathematics; LD = learning disability; ADHD = attention-deficit/hyperactivity disorder.
Discussion
Most of the existing studies on extended time use by student with disabilities have occurred in clinical or research settings. The present study contributes to a small but growing research body that examines the use of extended test time in actual college testing situations. Only three previous studies were found on this topic (Holmes & Silvestri, 2019; Sokal & Vermette, 2017; Spenceley & Wheeler, 2016). Two of these were conducted using data collected at Canadian universities (Holmes & Silvestri, 2019; Sokal & Vermette, 2017), so the present investigation is one of a small number to use data collected in the United States and the first to move past descriptive statistics. As such, it is the first study to examine both student- and course-level factors that may relate to the use the extended time by college students with disabilities.
College students with disabilities who receive extended time on examinations must first disclose that they have a disability. Historically, in the United States, only a small proportion of students with disabilities disclose to their institution of higher education (Newman & Madaus, 2015). This may explain the class standing distribution of the present sample as the number of students increased at each level of class standing, with more seniors than juniors and juniors than sophomores, participating. The two previous studies that reported class standing (Sokal & Vermette, 2017; Spenceley & Wheeler, 2016) found similar patterns in which there were more third- and fourth-year students in their samples, as compared with first- and second-year students. A possible explanation posed by Sokal and Vermette (2017) is worth noting, as it is possible that the course materials and exams become more difficult as students progress through their plans of study, prompting them to request extended test time.
Similar to the results of the previous U.S. study (Spenceley & Wheeler, 2016), 52% of the exams in this study were completed during the standard administration time. Unlike previous research, this study also examined the use of extended time with all examinations within a given course and found that extended time was used in 58% of courses. The results of this study also differed from previous research as approximately half of the exams requiring extra-time were completed within 50% of the extra-time (“time and a half”), with the other half requiring more than 50% (“double or triple time”). Previous research indicated that most exams requiring extended time were completed closer to standard time (Spenceley & Wheeler, 2016). This finding highlights that the use of extended time needs to be individualized based on students’ needs and that blanket provisions of specific accommodations (e.g., “time and a half”) may not be helpful to students.
In regard to patterns in student-level factors that were associated with the use of extended time on examinations, the proportions of exams requiring extended time and courses in which at least one exam required extended time were similar across disability type. Minor variations were found across the disability groups, similar to research by Holmes and Silvestri (2019). This finding differs from Spenceley and Wheeler (2016) who found significant differences across disability categories. The present study also had richer data concerning disability groups included in the sample, representing the first study to analyze the relationship of the number of disability categories on extended time use. Results demonstrate that individuals with disabilities in multiple categories used extended time on any given exam as well as at least once within a course at a slightly higher rate versus students with one disability category. Juniors used extended time less than half of the time versus participants that were seniors, sophomores, or freshmen who used it more than half of the time unlike previous research, which has demonstrated that students used extended time more often as they moved through their program of study (Sokal & Vermette, 2017). Also, both genders used extended time at all levels at comparable rates.
This study was the first to investigate course-level factors related to the use of extended time and findings indicate that the use of extended time was required more often in examinations in STEM courses. Course level was not observed to be related to the use of extended time. This study also utilized predictive statistical procedures to model the relationship of student- and course-level factors on the use of extended time at least once in a course. Individuals with ADHD, individuals with LD, and STEM courses were significant predictors in the model. The fixed model only explained ~5% of the variance in whether a participant actually used extended time in a given course. The fixed and random effects explained approximately two thirds of the variance. This discrepancy indicates that there are individual- and course-level factors that were not included in the model that may influence the use of extended time in a given course and that this is an area for future research. One such factor would be whether the course is in a student’s major or not, which may be an important predictor as students would be more familiar with the content within their major.
Limitations and Future Directions for Research
One of the major limitations of generalizing the findings of this study is the discrepancy in the variance explained by the fixed factors and the full model. This indicates that some student- and course-level factors that were not included in this model that may also be related to college students with disabilities use of extended time. An example of such a factor would be the format(s) of the examinations. Another potential factor would be whether the student used other testing accommodations during the session (e.g., a scribe) that may have related to how long it took students to take the examination. Future research should explore the relationship of these factors on extended time use. In addition, although outside the goal of the present study, it is important to recognize that this study does not include data about how long students without disabilities took to complete examinations in any of these courses. An examination that was scheduled to take 2 hr may have been finished by the majority of students without disabilities in an hour. This lack of a comparison across students with and without disabilities may or may not be over-accenting the completion of the majority examinations in standard time. In other words, students with disabilities may be using more time to complete exams than their peers without disabilities even though they are completing many exams within standard time. Future research should focus on specific undergraduate courses and analyze the relationship of time completion on exam and course grades for students with and without disabilities. In addition, this study focused exclusively on college students with disabilities who self-disclosed to their institution; there are many individuals with disabilities who choose not to self-disclose (Newman & Madaus, 2015). Future research should explore the differences in the performance of students with disabilities who disclose and receive accommodations and students with disabilities who do not disclose.
Implications for Practice
Although some research that has used artificial exam conditions has questioned the utility of the extended time on examinations accommodation (e.g., Lewandowski et al., 2013), this study is part of a small but growing body of research that analyzed data from college students with disabilities taking real-world examinations. The results of this study coupled with other previous research indicate that students actually used extended time on a little less than half of their exams, but used it at least once in approximately 60% of their courses. Furthermore, individuals with LD and individuals with ADHD were more likely to use extended time at least once in a course. Participants taking examinations in STEM courses were also more likely to require extended at least once in a course. Taken together, these data confirm the validity of the extended time accommodation and support its continued use by college students with disabilities. It also indicates that the provision of the extended time accommodation needs to be highly individualized. Postsecondary disability service providers must work with students to determine whether they are benefiting from this accommodation over time and in what courses it is the most beneficial.
As extended time on tests is ubiquitous at both the K–12 and postsecondary levels, the results of this study are also important for special education professionals. Special educators should work with students to determine the amount of time they need and should work to align this with what is offered at the college level. It may be important for students use of extended time to be faded over time so it aligns with what is likely to be offered in the postsecondary environment. Secondary special educators are also encouraged to foster self-determination in students by working with them to decide for themselves in what courses they would most benefit from this accommodation as the data from this and other studies indicate that this accommodation is not always necessary. Having students reflect on their need for accommodations will increase their self-awareness and help them to make a smoother transition to the postsecondary environment.
Footnotes
Acknowledgements
We acknowledge the help of Austin Menger of UConn’s Statistical Consulting Services under the guidance of Dr. Timothy Moore.
Declaration of Conflicting Interests
The author(s) declared no potential conflicts of interest with respect to the research, authorship, and/or publication of this article.
Funding
The author(s) received no financial support for the research, authorship, and/or publication of this article.