



Abstract
We conducted a systematic literature review examining the participant characteristics of studies of students with emotional disturbance (ED) with the purpose of better understanding potential similarities and differences between students with ED in research and the population of students with ED. Results indicate (a) participants with reported demographics were predominantly White or Black/African American and male; (b) participants in research samples were significantly different from the national population on gender, age, and race across study designs; (c) the research samples included significantly more White and Black/African American participants and fewer from other minority racial groups compared with the national population; (d) male participants were overrepresented and female underrepresented in studies generally, but the pattern was reversed in researcher-recruit samples; and (e) young children ages 3 to 5 years old were severely underrepresented in the research sample. We discuss the implications of this review and future directions for research.
In accordance with the Individuals with Disabilities Education Improvement Act (IDEA; 2004), certain circumstances and characteristics must be met in order for students to receive the provision of special education services under the disability category of emotional disturbance (ED). The federal definition includes meeting one or more characteristics that must adversely affect a child’s educational performance including (a) an inability to learn that cannot be explained by intellectual, sensory, or health factors, (b) an inability to build or maintain interpersonal relationships with both peers and teachers, (c) inappropriate behaviors or feelings, (d) a general pervasive mood of unhappiness or depression, and (e) developing physical symptoms or fears related to personal or school problems.
Unfortunately, there is likely a discrepancy between the number of students who need services and the number of students who are formally identified and served in special education (Forness et al., 2012). One reason may because of the lack of consistent, comprehensive screening for a range of early behavioral indicators of later, intensive challenging behavior. Systematic, compressive screening can identify students who may have more intensive behavioral and emotional needs and who may benefit from earlier intervention (Kaiser et al., 2022; Lane et al., 2012; Romer et al., 2020). However, without comprehensive screening in place, there may be an over-reliance on more subjective measures of referring students for behavioral support (e.g., subjectivity of office discipline referrals; bias toward externalizing behavior problems).
In addition to the equivocal nature of the federal definition of ED, there also are concerns related to outcomes for students with ED. Historically, the academic, behavior, and social outcomes for students with ED have been poor and continue to be an alarming matter (Bal et al., 2019; Bradley et al., 2008). For example, many children and youth with behavior problems have meaningful language, learning, and behavioral challenges in adolescence including encounters with the carceral system (Beaudry et al., 2021; Chow & Hollo, 2022; Mitchell et al., 2019). As such, it is critical that students with ED receive effective evidence-based academic and behavioral interventions to improve their outcomes (Garwood, 2018; Severini et al., 2018).
One solution is the multi-tiered system of support and adaptive intervention frameworks that are proactive approaches to identifying students and providing students with various levels of instruction and interventions that are responsive to the individual student’s needs (Chow & Hampton, 2019; 2022). Therefore, it may be difficult to identify the number of children in a classroom who may benefit from extra support, such as more intensive interventions, and the gap in identification and services for a student with ED may raise potential academic, behavior, and social risk factors that persist into adolescence (Chow, 2018; Hampton & Chow, 2022; Walker et al., 2004).
As the field of special education continues to work to improve outcomes for students with ED as well as identify supports and effective professional development for their teachers, we need to be clear about for whom our interventions are effective. Specifically, we rely on descriptive, national data to frame our research and highlight prevalence statistics that are associated with the ED population. However, what is an important area of investigation is the extent that the samples in research studies reflect the national data relative to student characteristics. To understand whether research participants are representative of the general population, it is important to document and compare the demographic characteristics of research samples to the characteristics of the population. As such, the purpose of this systematic review is to collect, synthesize, and report on the demographic characteristics of research studies that include students with ED, make direct comparisons to the population, and discuss the implications of these comparisons for research and practice.
Carrero et al. (2017) conducted a review of studies investigating demographic sampling and found underrepresented demographic groups in their examination of studies. From this, they recommended that research design (e.g., mixed-methods approach) and replication be considered to better understand the population. These considerations will help enhance the understanding of instructional practices and give insight into any contextual factors that may affect those practices with specific populations (West et al., 2016).
Race and Ethnicity
Race and ethnicity as demographic characteristics are often studied, but the literature suggests that there is an underreporting of race and ethnicity data. For example, Carrero et al. (2017) reported out of 128 participants, race and ethnicity data were reported for only 16 (12.5%) participants. In a review of 48 articles, Severini et al. (2018) found that researchers reported on the race and ethnicity of their research samples only 36% of the time. In the small proportion of samples that were described, there was more overrepresentation than underrepresentation of minority groups. These discrepancies raise concern because it may result in biased findings when attributing results to groups of students. In addition, this may impact participant selection in school-based research, which may lead to minority students becoming more disproportionately placed in self-contained settings. It is crucial that race and ethnicity are reported for all participants and not just non-White participants (Severini et al., 2018). There is concern about the lack of reporting of race demographics by researchers because of the generalizability of results, and it is unknown whether the samples of research studies are reflective of smaller subpopulations or the broader U.S. population (Robertson et al., 2017).
Another problem with race reporting is a lack of a consensual categorization. In a study conducted by Robertson et al. (2017), authors synthesized 23 articles and recorded each participant’s race/ethnicity into corresponding racial categories (e.g., White, Black, Asian, Hispanic, American Indian, Multiracial, and Other). The authors noted that the racial categories used in the study are not commonly agreed upon, which gives evidence to the complexity and socially constructed nature of identifying race and ethnicity (Bhopal, 2004; Kaplan & Bennett, 2003). For example, Carrero et al. (2017) reported racial categories that include Black, Asian, White, and Hispanic/Latino; however, no participants were recorded for American Indian/Alaska Native, Native Hawaiian/Other Pacific Islander, or Two or More Races. In a similar study conducted by Severini et al. (2018), authors reviewed 46 studies and coded for race and ethnicity for 31 out of 87 participants, which only resulted in 35.6% of the participants being racially and ethnically represented. Racial categories included Caucasian, Black/African American, Hispanic, Asian, Indian, and Middle Eastern.
According to the National Center for Education Statistics (National Center for Education Statistics [NCES], n.d.) Statistical Standard 1 to 5 for Defining Race and Ethnicity data, race is based on five categories: American Indian or Alaska Native, Asian, Black/African American, Native Hawaiian or Other Pacific Islander, and White, whereas ethnicity is based on the categorization of being Hispanic or Latino. There is a two-question format to collect data on race and ethnicity where the ethnicity question comes before the race question. Participants may choose only one option when answering the question on ethnicity (e.g., Hispanic or Latino or Not Hispanice or Latino). However, participants may choose one or more races to indicate what a person identifies as (Race and Ethnicity Data Implementation Task Force, 2008).
Gender
Gender 1 has historically been an important factor within the realm of research with individuals with ED. As such, gender should be considered during the development of interventions because it may affect the intervention outcomes based on differences in participant identities. However, though gender is important, we recognize that the field has been limited to date in terms of how gender is conceptualized and, subsequently, coded and analyzed in school-based research. In this review, we rely on dichotomous gender categorizations because this is how gender has been traditionally studied and reported.
Gender, though underrepresented in terms of a focal point of study, is a potentially important factor in the development of problem behavior. This may result in students with or at risk of emotional and behavioral disorder (EBD) displaying characteristics that differ based on gender (Sheaffer et al., 2021). For example, females are more likely to initiate problem behavior during adolescence than childhood whereas males tend to discontinue problem behavior after adolescents (Silverthorn & Frick, 1999). In young children at risk for EBD, boys are associated with having fewer friendships and lower social status than girls (Chow & Hollo, 2022). Historically, studies have included mainly males with few female participants recorded due to the mis- or under-identification of females (Young et al., 2010). Severini et al. (2018) reported that out of the 46 reviewed articles, 63% of males and 69% of females were in a self-contained classroom where 23% of females and 10% of males received educational services in both a general education classroom and a self-contained classroom. In contrast, Carrero et al. (2017) found that demographic sampling represented a higher percentage of males (71%) than females (29%). This may be because females are more likely to engage in internalizing behaviors (e.g., depression or anxiety) and display antisocial behavior that is often motivated by interpersonal conflict and relational aggression (Kann & Hanna, 2000; Sheaffer et al., 2021; Young et al., 2010). Females, especially Black females, are noted to engage in more “adult”-like behaviors, making the females appear to be more independent and needing less nurturing than males (Epstein et al., 2017). For this reason, females may be less likely to be identified as having ED compared with their male peers (Demmer et al., 2017; Kann & Hanna, 2000), whereas males are more likely to display overt, physical aggression (Crick & Grotpeter, 1995). Therefore, teachers may be more lenient toward female students and deliver more reprimands to the male students in their classroom.
Design Type
In research with students with ED, there may be substantive demographic differences in the samples of students with ED as a function of research design. For example, group design studies typically rely on more participants and different recruiting strategies than single-case design studies (SCDs). Single-case design studies often have much fewer participants and are, by design, intervention studies, whereas group design studies can include but are not limited to correlational, descriptive, or intervention studies. As stated in the What Works Clearinghouse Standards (What Works Clearinghouse [WWC], 2020), SCDs must include (a) data availability, (b) independent variable, (c) interassessor agreement, (d) residual treatment effects, and (e) attempts to demonstrate effect over time and data points per phase. To meet WWC Group Design Standards, group design studies must follow three steps, (a) study design, (b) sample attrition, and (c) baseline equivalence in addition to examining at least one eligible outcome measure and be free of confounding factors (WWC, 2020).
Group designs do not draw on individual behavior, but group averages. For example, since behavior is dynamic, group designs do not represent a clear picture of the subject and do not allow for repeated observations (Morgan & Morgan, 2009, p. 26). Although SCDs do not allow for aggregation of data across multiple participants, it does decrease “averaging”: The subject and participants are their own control (Morgan & Morgan, 2009, p. 30).
These design features may influence factors such as the types of participants that are able and willing to participate and the internal and external validity of the study. For example, researchers conducting a SCD study may be more interested in the internal validity rather than the external validity (Burns, 2012) even though generalizability is an important aspect of evidence-based practices (American Psychological Association, Presidential Task Force on Evidence-Based Practice et al., 2006). It may be important to consider when planning for research studies as well as interpreting findings in the appropriate context. Not only should the type of research design be considered, but how the designs are reported within research. Horner et al. (2005) identified a quality indicator of SCDs as selecting participants with similar characteristics that include gender, age, disability, and diagnosis. Gersten et al. (2005) identified quality indicators as those that would give sufficient information to interventionists or teachers. The quality indicators help readers to understand the individual’s characteristics as well as identify the population (Robertson et al., 2017). In Severini et al. (2018), the design type was examined separately for each participant and only coded once for participants who were included in the same design. If participants were in a different design (e.g., multiple-baseline across participants vs. group design), then the design was coded separately.
Importance of describing participants in research studies
It is important to describe demographic variables (e.g., race/ethnicity, gender/sex, age) of participants to better understand how students with ED vary across demographic groups as well as how interventions and outcomes may vary as a function of demographic characteristics. It is possible that reported demographics related to the ED population may be underrepresented or overrepresented which would limit generalizability.
Often, policymakers and stakeholders rely on educational research to guide current and future legislation and may be unaware of the impact of demographic variables in the education system (Viennet & Pont, 2017). For example, if researchers and policymakers assume that there are no differences across various sociodemographic groups, there may be inaccurate information which guides educational practices (e.g., interventions) and policy (e.g., guidelines and reports). Therefore, policymakers need to understand how demographics may pose new challenges in the education system that potentially could impact policy implementation. The outdated “one-size-fits-all” approach does not include demographic variability, which worsens discrimination and impedes on equal opportunity and equal treatment (Eng, 2013). In addition, inaccurate child count data may be reported which may increase disproportional identification of students of color and increase potential bias on how students are identified and assessed (Mitchell et al., 2019).
It is important to consider any consequences of either the accurate or inaccurate match between results and implications, and whether the research samples are representative of the larger population of students with ED. Hammer (2011) reported researchers being at risk for assuming “absolutism”:
They may be aware of demographic data such as race, ethnicity, and socioeconomic status (SES) but choose to treat the data as the same, which results in the assumption that there are no demographic differences between the participants. Instead, researchers need to move toward “universalism” where results may differ depending on participant demographics.
Purpose
The purpose of this study was to systematically review the published empirical literature on students with ED, describe the characteristics of students in research samples, and compare the research samples with the larger population. We used the following research questions to address our study purpose:
Method
Search Procedures
We conducted a systematic literature search using the Education Resources Information Center, ProQuest, and PubMed electronic databases to identify peer-reviewed empirical studies that included participants with ED. We used the search term “emotional disturbance*” and an unrestricted search range that included all studies in the published literature up through June 2020. This search resulted in 2,306 articles to be screened at the abstract level. Once we screened abstracts using the inclusion criteria of including students with ED in their samples, the initial set of studies included 840 studies to be screened at the full-text level.
We screened the full text of the remaining articles to ensure at least one participant with ED was included which resulted in 245 studies. Then, we conducted another full-text screening to ensure that these studies that included at least one participant with ED reported any data on age, race/ethnicity, or gender. We applied this step of screening because our purpose was to describe the participants with ED in the research base, and we would not be able to provide any description of the sample if no participant-level variables were reported other than an ED diagnosis. We categorized studies by design type used in the article (SCD or group design). After the final full-text screening, 193 studies remained with a final sample composed of 159 group design articles and 34 SCD articles. We used the PRISMA2020 flow diagram online program to create a figure that visualizes the screening procedures (see Figure 1; Haddaway et al., 2022).

Search strategy flow diagram.
Inclusion Criteria
To be included in this systematic review, articles must have met the following inclusion criteria: (a) peer-reviewed journal article, (b) published in English, (c) reported on at least one participant with ED, (d) reported any data on age, race/ethnicity, or gender, and (e) conducted in the United States. We did not impose any data restrictions on the present sample of studies. Although general recommendations for systematic reviews and meta-analyses are to include searches of unpublished literature (i.e., gray literature; Chow & Ekholm, 2018), the purpose of this study was to critically examine the demographic characteristics of students with ED in the published research literature to make inferences about the representativeness of the research sample relative to the population of students with ED in the United States. We also acknowledge that some of the dissertations we would locate via a gray literature search would ultimately end up in the published literature, and as such, the samples would be represented in the present review’s data.
To ensure that the participants from larger national datasets were not overrepresented, we reviewed all articles to determine which articles sampled the same dataset. If multiple studies used the same dataset, we included the article with the largest sample size to ensure each national dataset was only represented once in our report.
Article Coding
We designed our coding manual to gather information on the demographic reporting practices and child participant demographics. Codes, definitions, and examples of the codes used within the studies are outlined in Table 1. First, we coded the design type used in the article (e.g., group design or SCD). For this study, we defined group design as an article that included participants and quantitative data and reported at least one of the demographic characteristics in the coding manual. We included both intervention and descriptive studies in this category. We defined SCD as author-reported use of a SCD. Second, we coded for race/ethnicity (i.e., White, Black, Hispanic, Asian, Pacific Islander, two or more races, or other), gender (i.e., male or female), participant disability (i.e., ED only or ED and another disability), and age. We coded the number of article participants who had reported demographic information for each category. Because we included group design (see Table 2 in the online supplementary materials) and SCD (see Table 3 in the online supplementary materials) studies in this systematic review, coding variables differed slightly between designs. For example, for race/ethnicity in group design studies, we converted the percentage of students to the number of students by dividing the percentage by the total sample size for each article. For gender, we calculated the number of females by subtracting the number of males from the total sample size of each article. For age, we averaged the mean and standard deviation of all included studies. For demographics in SCD studies, we coded and calculated descriptives and the individual participant level. We recognize that the definitions and parameters around gender have changed over time and use the term “gender” to represent “sex” in the way the overwhelming majority of labels used in research studies have done in this review.
Definitions for Variables in Literature Review of Research on Students with ED.

Note. ED = emotional disturbance; ADHD = attention-deficit/hyperactivity disorder.
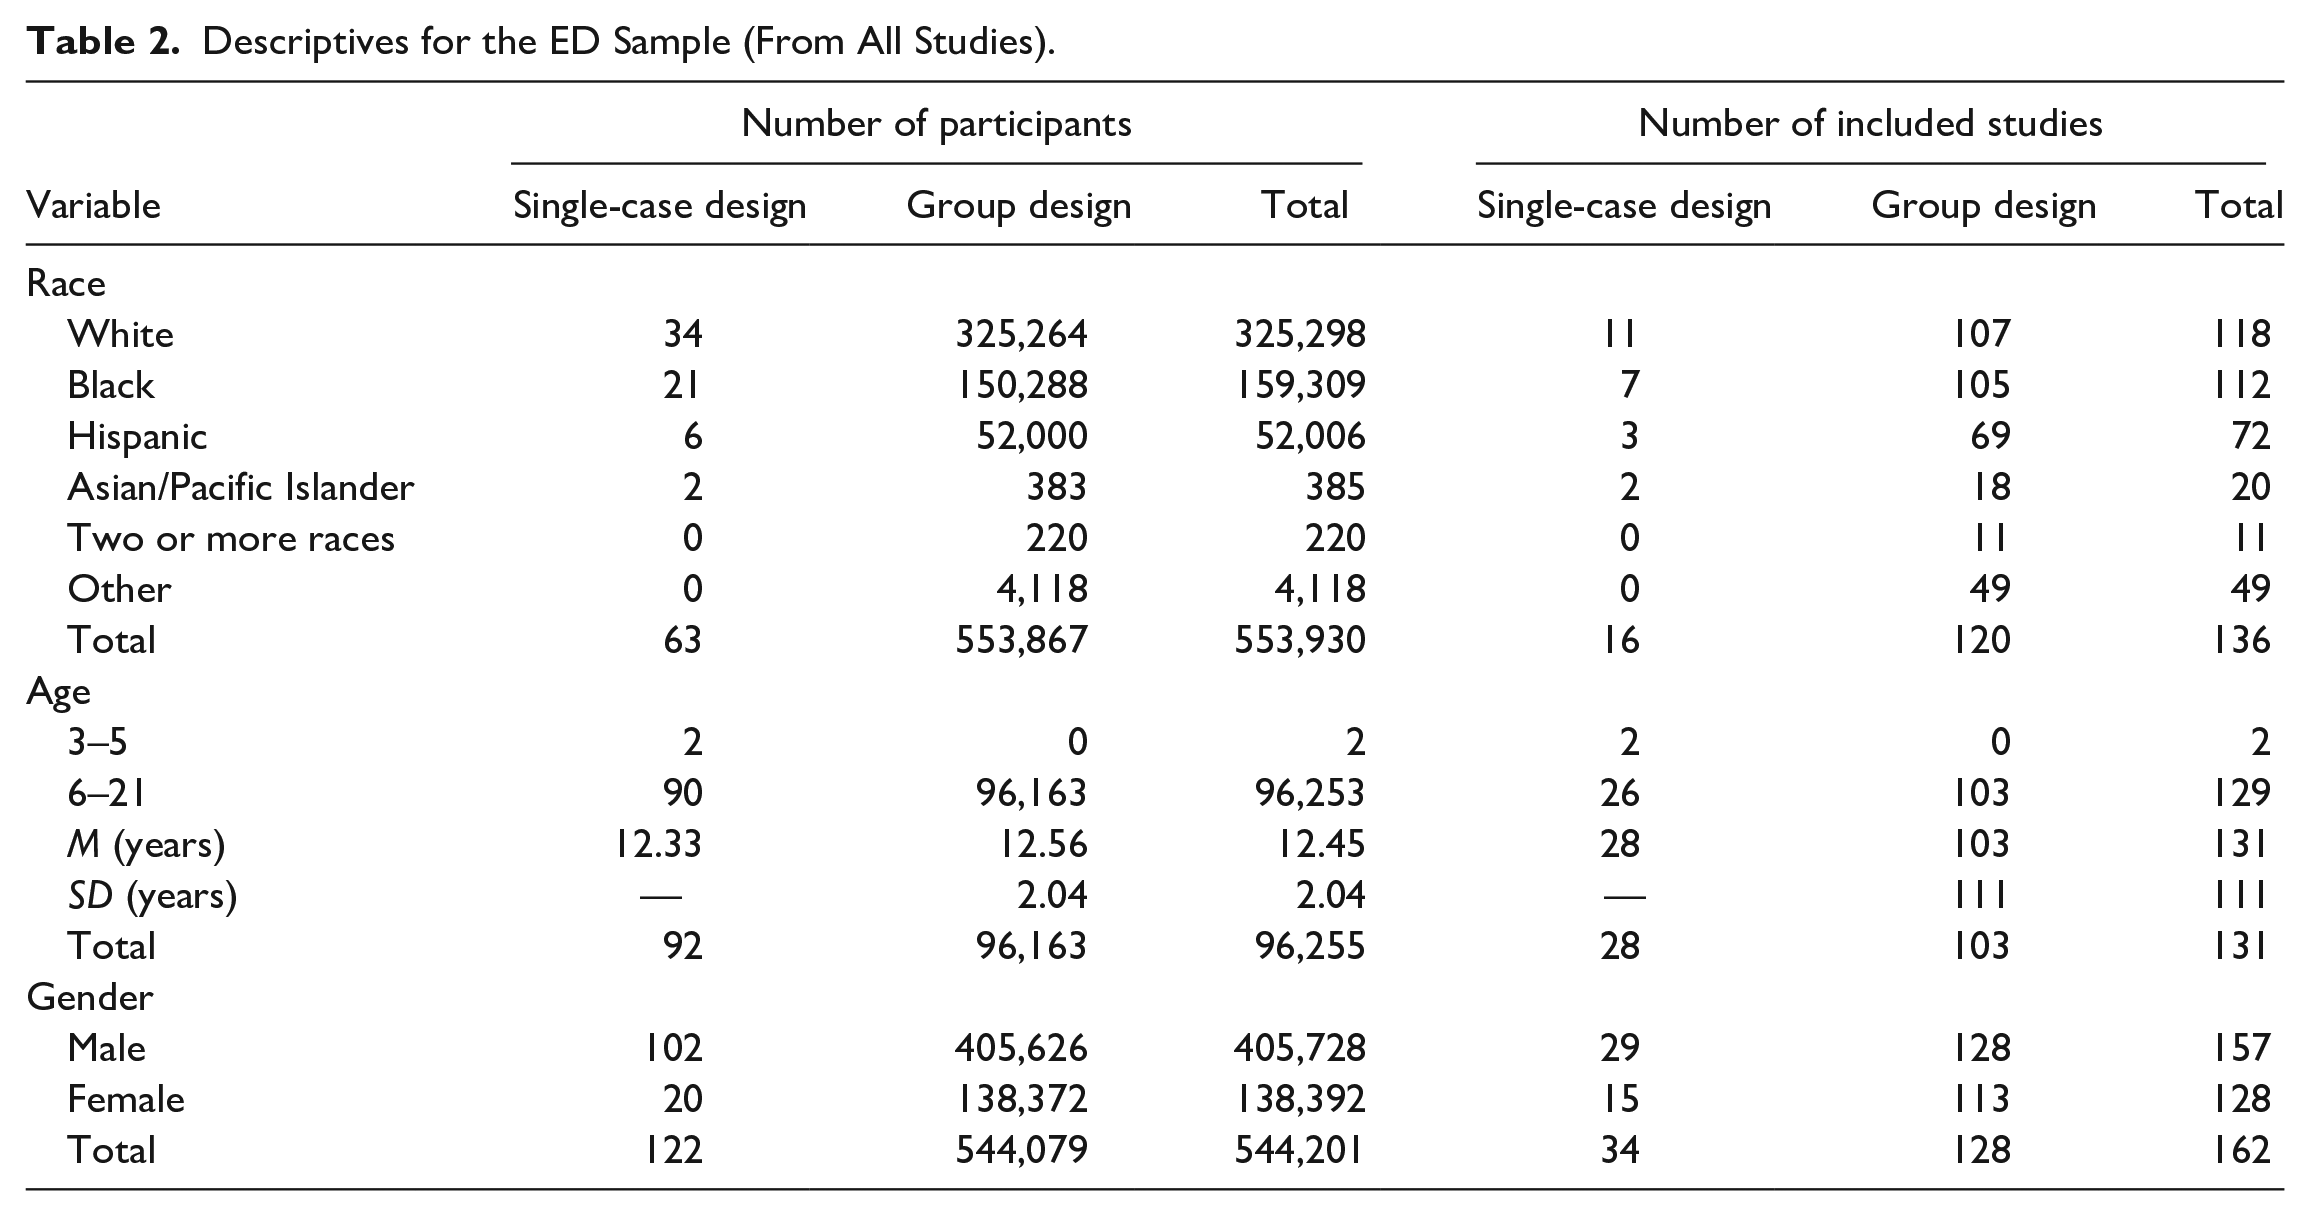
Descriptives for the ED Sample (From All Studies).
Comparisons Between the ED Sample (From All Studies) and ED Population (2019 to 2020).
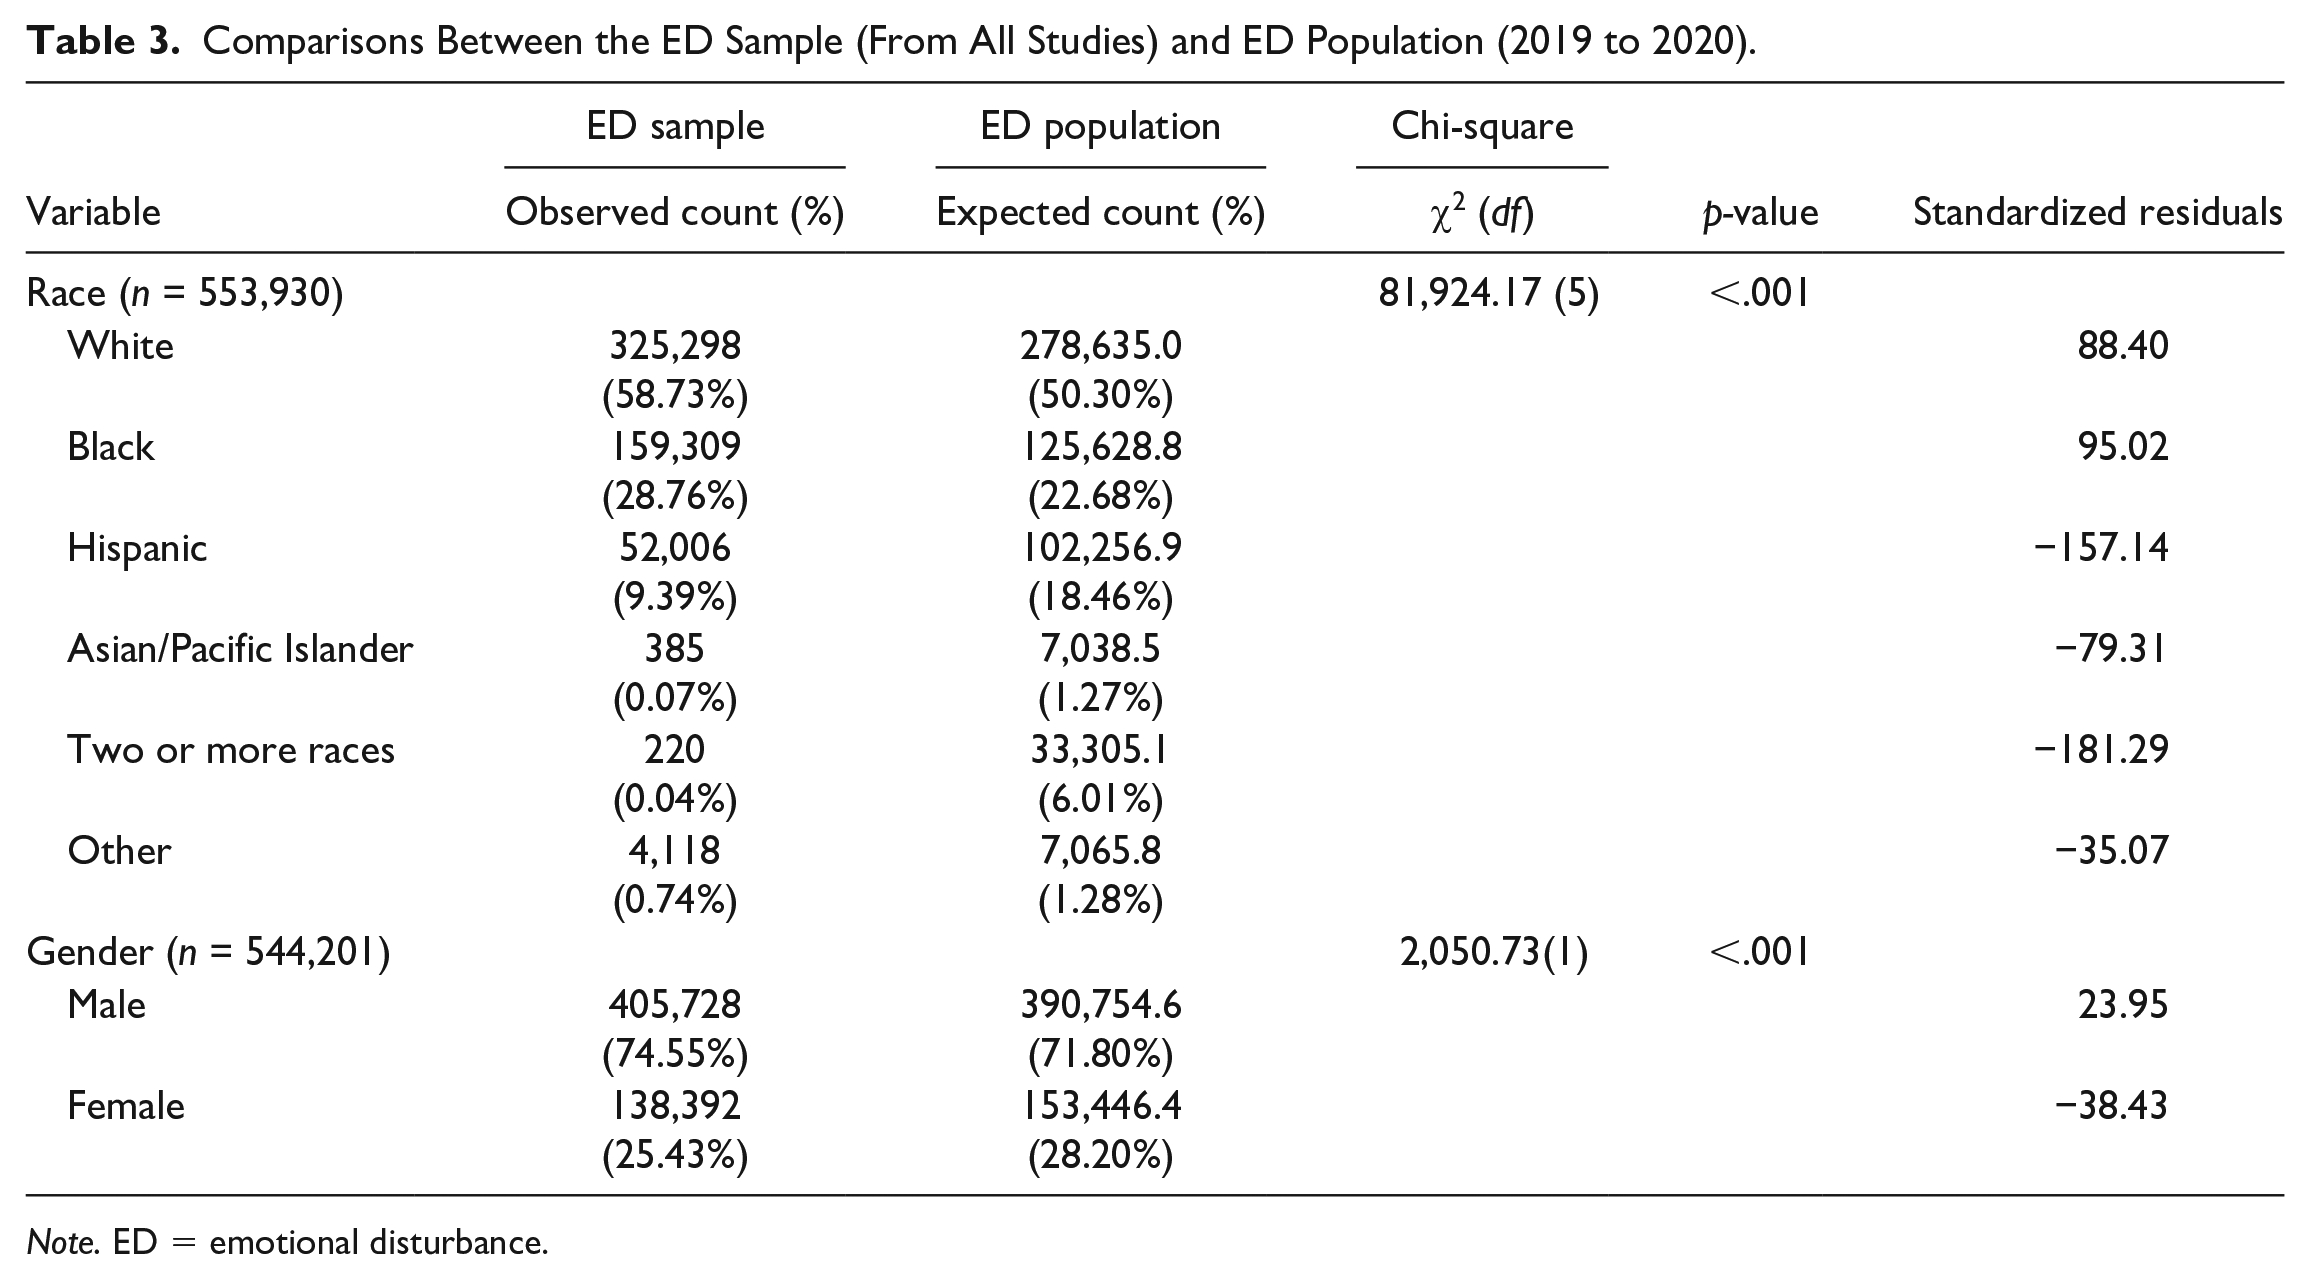
Note.ED = emotional disturbance.
To ensure reliability of coding, each research assistant (RA) independently coded a series of practice articles and completed consensus discussions and resolved disagreements and a virtual training meeting. We repeated this process three times until all coders agreed on all article codes. Then, each coder completed a set of five studies to establish agreement with the first author and had to reach a level of 90% agreement or higher to move on to independent coding for this review. All four coders exceeded 90% agreement. Finally, a second coder independently coded a random sample of ~20% of the articles, stratified by study design, for reliability purposes across the sample. Agreement across all codes was 94% for group design studies (n=31) and 98% for SCD studies (n=7).
Participant Demographics Compared With the U.S. Population
To determine whether the participant sample in the research literature represented the national population of children or adults with ED under 21 years old, we aimed to compare the demographics of the ED research samples, including race, gender, and age, with the demographics of the national population data. We used the national data of individuals with ED from the Individuals with Disabilities Education Improvement Act (IDEA; https://nces.ed.gov/programs/digest/) for elementary and secondary education with participation in public school services, which were provided by the NCES funded by the Institute of Education Sciences (IES). We aimed to compare the demographics of the research sample with the national population with ED for the year of 2019 to 2020 (https://nces.ed.gov/programs/digest/d20/tables/dt20_204.50.asp). The comparison of the research sample in the ED literature with the most recent population would reveal the extent to which the research participants resembled the demographics of the current national population.
To make comparisons to research participants, we extracted data from the 2019 to 2020 national dataset provided by NCES, which included the demographics of children ages 3 to 21 years served under IDEA and were disaggregated by type of disability. This dataset identified the prevalence of ED for males and females ages 6- to 21-years-old and for seven race or ethnicity categories (White, Black, Hispanic, Asian, Pacific Islander, American Indian/Alaska Native, and two or more races) for children 3- to 21-years-old. There were no data available for 3- to 5-year-olds on disability by gender, and both the gender and type of disability must have been reported for 6- to 21-year-olds’ data to be included. In addition, some 5-year-olds were included in the 6 to 21 category due to kindergarten reporting procedures. If data for 2019 to 2020 were unavailable for a state, we included the most recent data available from each state in the national dataset.
Data Analysis
We conducted a series of chi-square analyses to address our research questions. For gender, race, and age ranges, we constructed three cross-tables where the row indicated the source (i.e., research sample versus national population) and the column indicated the demographic categories for gender, race, and age, respectively. We used the national population percentages to compute the expected count for each category and compared the expected counts with our actual counts from the research sample. If the omnibus chi-square test reached significance, we would proceed to examine the standardized adjusted residual for each cell. Because it follows a normal distribution, any standardized adjusted residual that falls outside the range of −1.96 to 1.96 would be considered significant, suggesting that the actual count (i.e., research sample) for that cell would be significantly smaller or larger than the expected count (i.e., the national population).
Results
Demographic Characteristics of Students With ED in Research Studies
Our first aim was to analyze the demographic distribution for race, age, and gender of the research sample, which were recruited in all the 193 studies. We also aimed to examine the distribution by article design (i.e., SCD vs. group design). The details of the number of participants and studies for each demographic group can be found in Table 2. Race was reported in a total of 136 studies (k = 70.47%). White was the majority racial group, which accounted for 58.73% of all the 553,930 participants for whom race was reported. Black/African American was the second largest racial group in the research sample, which made up for 28.76%, followed by Hispanic (9.39%), Other (0.74%), Asian/Pacific Islander (0.07%), and Two or More Races (0.04%).
Age was reported in a total of 131 studies (k = 67.88%). The age distribution of the research sample was highly skewed. Using the same age dichotomy as for the national population, which categorized young children as 3 to 5 years old from children and adults between 6 and 21 years old, only two participants were found to be young children among a total of 96,255 participants in the research sample. The average age for all the participants was 12.45 years old (SD = 2.04). Gender distribution was reported in a total of 162 studies (k = 83.94%) for 544,201 participants with 74.55% of male participants and only 25.43% female participants.
Single-case design
We further examined the demographic data of the research sample involved in the SCD studies (k = 34) and the group design studies (k = 159) separately. For the SCD studies, race was reported in 16 studies for a total of 63 participants. Within the 16 studies that reported race, 53.97% of the participants were reported as White, followed by Black/African American (n = 21; 33.33%), Hispanic (n = 6; 9.52%), and Asian/Pacific Islander (n = 2; 3.17%). There was no participant who identified as Two or more or Other race in the SCD studies. Age was reported in 28 studies that used a SCD design for a total of 92 participants. Only two participants were between 3 and 5 years old (2.17%). For gender, which was reported in 34 studies for 122 participants, the majority was reported to be male (83.61%), and female participants only accounted for 16.39%.
Group design
For the studies that used a group design (k = 159), race was reported in 120 studies for a total 553,867 participants. Consistent with the pattern for the whole research sample, the majority race group was White, which accounted for 58.73% of the participants in the group-design studies. Black/African American was the largest minority racial group, which made up for 27.13%. Other minority racial groups, including Hispanic, Other, Asian/Pacific Islander, and Two or more races, only represented 9.39%, 0.74%, 0.07%, and 0.04% of the participants in the group-design studies. All 96,163 participants in a total of 103 group-design studies were found to be children and adults between 6 and 21 years old with an average age of 12.56 years old and standard deviation of 2.04 years. Gender was reported for 128 group-design studies for a total of 544,079 participants with 74.55% of the male participants and 25.43% female participants.
Comparing Research Samples to National Population
We initially intended to compare the demographic distribution of age, race, and gender between the research sample and national population. However, considering only two participants between 3 and 5 years old were included in the research studies among a total of 96,163 participants, the highly skewed distribution of age rendered the statistical comparison less meaningful. Therefore, we decided to conduct a series of chi-square analyses and statistically compare the research sample with the national population of the year 2019 to 2020 for race and gender only (see Table 3). Moreover, we further make a distinction between the researcher-recruited sample and the sample recruited for the national population data. Participants in the “researcher-recruited samples” were recruited by researchers who went into the schools in their independent investigations, whereas the “samples recruited for the national investigations” came from the national population data (e.g., NCES). By making such a distinction in the analysis, we were able to investigate the degree to which the research samples were representative of the national population specifically for those smaller-scale, independent research investigations. We then compared the researcher-recruited sample categorized by article design (i.e., SCD vs. group design) with the population (see Table 4 for descriptive data and Table 5 for comparisons).
Descriptives for the Researcher-Recruited Emotional Disturbance Sample.

Comparisons Between the Researcher-Recruited ED Sample and ED Population (2019 to 2020) by Study Design.

Note. n = number of participants; ED = emotional disturbance.
For the complete research sample, the omnibus chi-square test for race was significant, χ2(4, n=553,930) = 81,924.17, p<.001, indicating that the complete research sample and the national samples differed significantly in their racial group compositions. Standardized adjusted residuals revealed that the research sample had a significantly larger percentage of White participants and Black/African American participants, but a significantly smaller percentage of participants who identified as Hispanic, Asian/Pacific Islander, Two or more, and Other, compared with the 2019 to 2020 national population. For gender distribution, the omnibus chi-square test was also significant, χ2(1, n = 544,201) = 81,924.17, p<.001, suggesting a difference in the gender distribution of the research sample from that of the national population. The examination of the standardized adjusted residuals suggested that the complete research sample had a significantly larger percentage of male participants and a smaller percentage of female participants compared with the national population.
For the research-recruited sample that was involved in the SCD studies, the omnibus test of race was significant, χ2(1, n = 24,851) = 36.90, p<.001. Considering only two Asian participants were recruited (3.38%), we removed them from the chi-square test, resulting in three race categories for comparison (i.e., White, Black/African American, Hispanic). A close examination of the standardized adjusted residuals suggested that none of the three race categories differed significantly from the national population (i.e., absolute value of standardized adjusted residual<1.96). For gender distribution, the omnibus chi-square test was significant, χ2(1, n = 122) = 8.39, p<.01. Specifically, female participants represented a significantly smaller percentage compared with the national population, whereas there was no significant difference in male.
For the researcher-recruit sample involved in group-design studies, the omnibus chi-square test of race was significant, χ2(4, n = 22,804) = 3,935.86, p<.001. The standardized adjusted residuals suggested that compared with the national population, the research-recruited sample had a significantly larger percentage for White and Black/African American populations, but a smaller percentage for all other minority groups, including Hispanic, Asian/Pacific Islander, Two or more races, and Other. For gender distribution, the omnibus chi-square test was also significant, χ2(1, n = 24,851) = 36.90, p<.001. Contrary to the findings of previous comparisons, male participants in the research-recruited sample of group-design studies were under-represented, and female participants were overrepresented compared with the national population.
Discussion
In our review of the literature of research including students with ED, roughly 70% of studies reported race and ethnicity data. Our findings showed that participants were predominantly White or Black/African American. Even though Black/African American was the second largest category, participants represented were half the number of White participants. Other groups of students were underrepresented given what we would expect from the demographic proportion breakdown of students with ED in the national sample. This was particularly evident for both Hispanic and Asian students. These findings were not surprising due to the fact that other reviews have reported similar findings (Carrero et al., 2017; Steinbrenner et al., 2020). There is robust evidence showing there remains a lack of racial and ethnic reporting of students with ED in research. It is possible that there are factors involved in participant recruitment that influence inclusion in research studies, or cultural differences in the willingness to participate in research. The inconsistency in racial and ethnic category options (e.g., other, two or more, multi-racial) may impact how these demographics are recorded and further lead to underrepresentation (Carrero et al., 2017).
We also found that the majority of participants in research studies were male generally, which aligns with the population statistics, but when we coded for studies that recruited samples, females were overrepresented. That is, when researchers designed studies and recruited participants with ED, the proportion of their samples, on average, had a significantly greater proportion of female students than would be expected in the national sample. This finding differed to the results of other reviews. For example, Carrero et al. (2017) and Steinbrenner et al. (2020) reported a significantly larger number of participants as male than as female. There may be factors, such as the type of research design or being identified as having ED, that influenced female willingness to participate in studies.
When we compared sample demographics from both group and SCD studies to the national population, White and Black/African American students were overrepresented whereas in SCD studies there was no significant difference. It is noteworthy that in this analysis, we only compared researcher-recruited samples of the research studies to the national population. This is because, by definition, SCDs were all researcher-recruited studies and our goal was to make as fair of a comparison as possible. This finding suggests that there may be recruitment differences that result in an over-representation of white and Black/African American students in group design studies, but our data do not allow us to identify the mechanisms that may explain this finding. Given the current and long-standing debates about over- and under-representation in special education populations (e.g., Artilles & Trent, 1994; Cavendish et al., 2020; Farkas et al., 2020), understanding nuanced differences between study samples can provide important contextual information determining the role of sampling in the overall discussion of representation.
We also reported gender differences in the samples as a function of research design, where females were overrepresented in researcher-recruited group design studies and under-represented in SCD studies. It is possible that recruitment procedures influence the identification of potential participants, or that the consent process favors the likelihood of male participant (and parent/guardian) assent. Single-case design studies are also experimental, typically intervention studies that often require substantial interactions with researchers and teachers. This may be a factor in recruitment (into intervention studies) that is less present in group design studies/data, given that group design studies in this review did not need to be an experimental study of an intervention and could be a correlational design. It is also possible that study outcomes and the intentions of the research may have contributed to study representation. More broadly and an important discussion is the need to explore, study, and understand additional gender identities in school-based research. This includes but is not limited to determining the need for gender-responsive programs and practices and understanding the implications of dichotomous categorization for non-binary students with or without ED. Future research should begin to scratch the surface of understanding the intersection of gender identity, special education, and school-based research.
Our review also points to an underrepresentation of young children with ED. Of the 92 participants in SCD studies with ED, only two were between the ages of 3 and 5. This was consistent with Carrero et al. (2017) findings, where only one article included participants’ ages 3 to 5. It is possible that there are fewer researchers conducting work that focuses on young children (i.e., ages 3 to 5) with ED, or that the research population overlaps with clinical diagnosis and research that falls outside the scope of school-based, ED-focused research. Another reason for this is likely that ED labels may be less likely to be assigned when children are younger or that young children initially are considered “at risk” in the research literature. Indeed, the current study includes 2 out of 90 participants (~2%) that are ages 3 to 5, while the national data from 2018 to 2019 (the most recent available data) report that this age group accounts for 11.5% of the ED population of ages 3 to 21 years old (N = 7,134,248). Given the challenges surrounding the identification and labeling of ED in young children (Brauner & Stephens, 2006), more research is needed in this area, which may include refining and improving screening systems (Kaiser et al., 2022).
Limitations
The present systematic review has important limitations to consider when interpreting the findings. First, this review estimates the overall averages of the research samples and compares them to the federal data, which likely includes the same individual studies. That is, if students were labeled as ED in a research study, there should be an overlap in the federal dataset. Although this violates assumptions of independents from a statistical perspective, the purpose of this analysis was to describe potential differences between the individuals who we study (and include in our research samples) and the individuals about whom we make inferences.
We searched broadly for the term “emotional disturbance*,” which would include all studies that used the term ED or emotional disturbances to describe their samples. If studies did not use these specific terms, we may have missed them in our literature search. However, we limited the search to this specific verbiage given the nature of this study and the federal definition and disability category as identified by IDEA. Our study, however, does not include research participants under the broader umbrella of EBDs, and it is possible that some students with ED were not included if the search term specificity contributed to some studies not being included. Future research could study this population and make comparisons that include the broader EBD literature to the population. Extending beyond samples of students with ED would provide a broader picture of a more heterogeneous population of students that align with the scope of national organizations and peer-reviewed journals that aim to support students’ behavioral and emotional health outcomes.
Implications
From this work, we glean several implications for researchers to improve the state of participant descriptions and reporting in research studies and the understanding of the external validity of research that aims to support outcomes for students with ED. First, in the process of conducting this review, we emphasize the importance of sufficient participant demographic reporting in order for researchers and consumers to better understand for whom and under what conditions interventions are effective in special education research. Many studies did not report the demographic information of their participants. Consistent with other studies (e.g., Robertson et al., 2017), we recommend that researchers, at minimum, report demographic and SES data as completely as possible, with the understanding that participant race and SES can influence perceptions of and response to a variety of interventions and programs (see Coard et al., 2004; Long et al., 2019). This is important given the history of research on the general influence of race/ethnicity in special education identification and service delivery (Artilles & Trent, 1994; Ford, 2012; Oswald et al., 1999). Researchers can consult existing reporting recommendations (see Gersten et al., 2005; Horner et al., 2005) and build on them by relying on updated guidance around reporting of gender, race, and ethnicity (American Psychological Association, APA Task Force on Race and Ethnicity Guidelines in Psychology, 2019).
In the process of coding race and ethnicity data for this review, it is evident that more consensus is needed in how to report race and ethnicity data. Studies often include Hispanic/Latino categorizations within a race category, while the reporting for NCES separates them, which renders Hispanic/Latino identity mutually exclusive from a race categorization. We followed previous reviews for our coding, recognizing that if we set up our coding scheme where Hispanic/Latino demographics were exclusive to ethnicity, and not race, our data would likely not represent the samples as described in the research studies. More direction and consensus is needed in how to report these data, and future work should be done on reporting guidelines and quality of reporting in this area. Future work should also be more inclusive of gender identities beyond the dichotomy of male and female as well as sexual orientation and other forms of identity.
Relative to external validity, it is important to consider the demographic characteristics of sample participants when inferring the generalizability of an intervention or program. It is also important to recognize the potential differences between the samples in research studies and the national population. For example, citations in the introductions of studies that argue the need for an intervention or to improve certain outcomes for students ED may rely on a variety of sources, including data from the national sample of students with ED. These data, while accurate on their own, may represent a different sample of students in studies, and as such, the implications of the work should be situated in an understanding of the demographic makeup of the individuals in the research studies themselves. This will allow researchers to make appropriate conclusions in context and be proactive about specifying the populations to which they expect their interventions to generalize.
Supplemental Material
sj-docx-1-rse-10.1177_07419325221125890 – Supplemental material for A Systematic Review of Characteristics of Students With Emotional Disturbance in Special Education Research
Supplemental material, sj-docx-1-rse-10.1177_07419325221125890 for A Systematic Review of Characteristics of Students With Emotional Disturbance in Special Education Research by Jason C. Chow, Ashley Morse, Hongyang Zhao, Corinne Kingsbery, Rebecca Murray and Isha Soni in Remedial and Special Education
Footnotes
Declaration of Conflicting Interests
The author(s) declared no potential conflicts of interest with respect to the research, authorship, and/or publication of this article.
Funding
The author(s) received no financial support for the research, authorship, and/or publication of this article.

Supplemental Material
Supplemental material is available on the Remedial and Special Education website with the online version of this article.
Notes
References
Supplementary Material
Please find the following supplemental material available below.
For Open Access articles published under a Creative Commons License, all supplemental material carries the same license as the article it is associated with.
For non-Open Access articles published, all supplemental material carries a non-exclusive license, and permission requests for re-use of supplemental material or any part of supplemental material shall be sent directly to the copyright owner as specified in the copyright notice associated with the article.
