



Abstract
The association of more crime with youthful age is widely accepted in social science. However, a literature search revealed no studies of the age-crime relationship that controlled for young ages’ economic disadvantage. This research gap is addressed using the California Criminal Justice Statistics Center’s arrest detail and Census poverty statistics for 2010. When poverty rates were controlled, younger and older ages’ violence disparities largely disappeared. Where teenagers and emerging adults display typical middle-aged demographics (two thirds non-Latino, White, or Asian, poverty levels under 10%), they display “middle-aged” violent crime rates; where ages 40 to 69 have typical teenage demographics (54% Black or Latino, 17% in poverty), they display “teenaged” violent crime levels. These findings challenge conventional theories associating violence with young age.
Introduction
The view that involvement in crime diminishes with age is one of the oldest and most widely accepted in criminology. Beginning with the pioneering research by Adolphe Quetelet in the early nineteenth century, criminological research consistently has confirmed that (the proportion of) the population involved in crime tends to peak in adolescence or early adulthood and then decline with age. This age-crime relationship is remarkably similar across historical periods, geographic locations, and crime types (Steffensmeier & Ulmer, 2008).
Criminologists have long associated young age with more crime and violence, a belief that, particularly in recent decades, has been used to increase penalties for youth crime and redirect the juvenile justice system toward a more punitive orientation (Brown, 2009). Teenagers are “temporary sociopaths, impulsive and immature” (Fox, in Zoglin, 1996, p. 52), making demographics a “highly predictable . . . important contributor” to crime (Fox & Piquero, 2003, pp. 348-354). “Adolescents, on average, engage in more reckless behavior than do individuals of other ages” and are “biologically driven” to risk-taking, including criminal offending (Steinberg, 2007, p. 56, see also Gardiner & Steinberg, 2005). Youth curfews, bans on adolescents buying or possessing firearms, the abolition of the juvenile death penalty, and a wide range of age-targeted laws, policies, and programs rest in the assumption that teenagers are uniquely “crime prone,” to the extent that many argue they can’t be allowed basic freedoms or be held responsible for offenses in the same manner as mature adults. For a summary of these arguments, see the decisions in Miller v. Alabama and Jackson v. Hobbs (Supreme Court of the United States, 2012).
However, many researchers have called attention to realities unexplained by the link between crime and age, such as the disproportionate concentration of violence among African Americans (Haynie, Weiss, & Piquero, 2008; Sampson & Lauritsen, 1997). For example, in California, one of the few states to report crime statistics by race and age, an African American youth or emerging adult age 15 to 24 is around 15 times more likely to be arrested for homicide, 10 times more likely to be arrested for a violent crime, five times more likely to be arrested for a felony (Criminal Justice Statistics Center, 2011), and nearly 30 times more likely to die from gun violence than is a non-Hispanic White the same age (Centers for Disease Control and Prevention, 2013). These large disparities in crime and victimization among racial cohorts the same age have been acknowledged in the literature. What has not been discussed is that these same sources show an African American middle-ager in his 40s and 50s is substantially more likely to be arrested for homicide and violence, and several times more likely to die from gun violence, than a non-Hispanic White emerging adult.
However, even though racial disparities in offending and victimization rival or even exceed disparities by age, age continues to be treated as an immutable predictor of crime propensity while race (at least in the modern era) is not. Instead, when discussing racial disparities in crime rates, researchers reference social conditions like poverty, racial discrimination, community mobility, cultural adaptations like the “code of the streets,” family dysfunction, and similar structural factors to explain how violent crime becomes concentrated in disadvantaged communities and produces the linkage between race and violence (Bellair & McNulty, 2005; Kaufman, 2005; Kaufman, Rebellon, Thaxton, & Agnew, 2008; Sampson & Lauritsen, 1997; Stewart & Simons, 2006).
Borrowing from analyses of crime disparities by race suggests an alternative “age-crime” theory: a higher proportion of young people live in poverty than do adults, and this disadvantaged group status, not developmental, cognitive, or other biological factors related to young age, explains high-arrest rates among youth. That impoverished populations actually commit more serious crime, or are more likely to be arrested due to discriminatory policing targeting African and Latino Americans in particular, or a combination of these factors (see Donziger, 1996; Shelden, Tracy, & Brown, 2001) also might explain high arrest rates among younger ages, which are substantially more likely than older ages both to be poor and to be Black or Latino. It is difficult to understand why poverty and other socioeconomic factors have not been included as routinely in analyses of interage disparities in crime as they have been in interracial and interclass disparities. By considering the linkages between poverty and age together, this paper tests whether the immutable characteristics of age or changeable community contexts, such as poverty and disadvantage, better explain the prevalence of youth crime.
Literature Review
Biological and Developmental Theories of Youthful Crime Propensity
Demographic explanations for growing crime rates achieved prominence in the 1960s when several prominent academics reported that a growing subpopulation of young people would inevitably bring more crime (Fox, 1996; Wilson, 1975, pp. 17-18). Several papers demonstrated that population structure influenced crime rates during the 1960s and 1970s, at the same time that the “Baby Boomer” population entered their teen and young adult years (Blumstein & Nagin, 1975; Cohen, Felson, & Land, 1980; Cohen & Land, 1987; Fox, 1978; Steffensmeier & Harer, 1987; Wilson, 1975; Wilson & Herrnstein, 1994).
The corollary that involvement in crime diminishes with age is one of the oldest and most widely accepted in criminology. Beginning with the pioneering research by Adolphe Quetelet in the early 19th century, criminological research consistently has confirmed that the proportion of the population involved in crime tends to peak in adolescence or early adulthood and then decline with age. This age-crime relationship is remarkably similar across historical periods, geographic locations, and offense types (Steffensmeier & Ulmer, 2008). Age further predicts criminality in important ways, with both the age of first arrest and the onset of puberty playing a role in the determination of future criminal activity (Delisi, 2006; McCluskey, McCluskey, & Bynum, 2006; Najman et al., 2009). Age is thus an important example of how biological, and immutable characteristics are seen to shape crime and violence rates (National Research Council, 2006).
However, several studies question the linkage between age and crime. Studies that employed multiple variables found at most only small effects of changing age structure on crime, and others find age effects overridden by socioeconomic variables (Marvell & Moody, 1991; Cohen & Land, 1987). One of the few studies to even partially examine multigenerational effects (Chilton, 1991) found little effect from changes in the race, age, and gender structure of the population as factors in increases in urban crime from 1960 to the 1980s.
The sharp decline in urban crime after 1992 amid a growing adolescent population, one whose minority-race components grew fastest of all, further suggests that extending the study period would render many authors’ conclusions considerably different. Steffensmeier and Harer (1987), for instance, found a decline in property, but not violent crime, from 1980 through 1984 related to the aging of the population. However, the sharp increase in theft between 1984 and 1992, even as the population continued to age, indicates very different results. Steffensmeier and Harer (1999) again found an age effect on crime through 1998, but only for the decade of the 1980s and not the 1990s. Age-based effects thus might be the result of short-term correlations or cohorts involving Baby Boom populations rather than a true demographic linkage between age and crime (O’Brien & Stockard, 2009). Other studies examined limited time periods or selected crimes and find only weak age-structure effects on crime that are overshadowed by other factors (Cohen & Land, 1987). A review of 90 studies (Marvell & Moody, 1991) found that only a small fraction show significant effects of age structure on crime.
Documenting a broader demographic effect on crime requires large-scale, long-term, multigenerational, and multifactorial analyses, and it is here the literature is weak. One exception (Levitt, 1999) examined peak-to-trough changes in age distribution by cohort size on crime rates from 1960 to 1995, with projections through 2010. Levitt’s cohort analysis was flawed in its common assumption that the excessive level of arrest (used as the only surrogate measure for offending available) among young age groups relative to older ages was stable over time. Failure to incorporate the significant aging of offenders since 1980 fostered by large increases in crime rates among older age groups suggests that any relationship found between age structure and crime may result from temporary cohort and period effects.
The problematic nature of demographic theories is further demonstrated by the large divergence between actual crime trends (see Federal Bureau of Investigation [FBI], 1960-2011; Bureau of Justice Statistics, 1973-2011) and demographically based crime forecasts (Abrahamse, 1997; Bennett, DiIulio & Walters, 1996; DiIulio, 1995; Fox, 1978, 1996-1997; Fox & Piquero, 2003; Steffensmeier & Harer, 1987; Wilson & Herrnstein, 1994). For a typical example, Fox and Piquero (2003) attempted to predict youth (defined as ages 14-24 years) homicide offending through 2020, but their projection was more than 2,000 too high within 4 years. Rather than involving effects of an aging population, the crime decline over the last 15 years reflects a large drop in offending among young age groups and a smaller drop among older ones (Bureau of Justice Statistics, 1973-2011; FBI, 1960-2011). A number of authors do acknowledge the continuing difficulties in using population projections to predict crime rates (Abrahamse, 1997). Nevertheless, assertions that higher proportions of young people in the population augur more crime and an aging population produces less crime continue to be invoked in professional forums, law enforcement statements, and news media reports (i.e., Blumstein & Rosenfield, 1999; The Economist, 2012).
Socioeconomic Status (SES) and Individual-Level Theories of Crime Propensity
Another widely held belief among scholars is that poverty and related social disadvantages are key factors promoting criminality, though authors disagree as to the extent. From early Chicago school theorists like Shaw and McKay (1942) to researchers today (Jarjoura & Triplett, 1997; Sampson & Wilson, 1995; Tapia, 2010; Wright, Caspi, Moffitt, & Silva, 1999), socioeconomic status (SES) has been posited as a key cause of crime. One of the most ardent defenders of the crime-poverty nexus, Loic Wacquant (2007, 2009) writes that today’s systems of mass incarceration are the result not of individual or group-level deficiencies, but the work of the continued influence of poverty, racial ghettoization, and economic forces.
Community contexts, like poverty, also have been shown to be a key facilitator of individual development. Bellair and McNulty (2005) show that the development of verbal ability is not only related to community context, but that the relationship between verbal ability and rates of offending is also explained more consistently by community rather than individual-level indicators. Ratchford and Beaver (2009) demonstrated that low self-control, which is commonly thought to result in delinquent behavior, is actually the result of a complex process of many weak, indirect effects stemming from individual and community traits. Bersani, Nieuwbeerta, and Laub (2009) further noted that the predictive ability of individual risk factors, particularly those identified in adolescence, provide little evidence of long-term patterns in offending. Tapia (2010) also demonstrated that racial status and low SES result in increased rates of arrest and incarceration, but that minority status coupled with high SES also results in an “out of place effect” that greatly increases the risk of arrest even beyond that experienced by low SES youth. Sampson (2012) notes that the persistent and long-lasting effects of neighborhood poverty play a role in creating and reproducing disadvantage across generations. The generational persistence of poverty is a key reason why MacDonald and Saunders (2012) note that immigrants have comparative advantages compared to nonimmigrants who must grapple with the disadvantages produced by long-term poverty and neighborhood blight.
Despite this consistency, poverty is often seen as an insufficient explanation for crime at the individual unit of analysis (Jarjoura, Triplett, & Brinkler, 2002; Stiles, Liu, & Kaplan, 2000). Most people who live in poverty are never arrested or officially recorded as perpetrating acts of crime and violence. Additionally, much of the empirical evidence that poverty affects delinquency stems from ethnographic studies of delinquent groups or from researchers’ speculations (Jarjoura et al., 2002). As Laub and Sampson (2003, p. 277) conclude, the difficulty of linking poverty to crime is that “when thinking about a phenomenon like crime, there is a multiplicity of causal chains and pathways, all of which have a weak individual influence” (see also Lewontin, 2000).
The inability of community-level factors to predict individual criminality has led some researchers to deemphasize or reject poverty as a cause of crime and delinquency. Individual-aggregate studies of poverty and crime in particular result in the questioning of the poverty-crime relationship, since many studies show no effect of poverty on crime (Jarjoura et al., 2002). Vazsony & Klanjsek (2009), for instance, show that SES had little effect on how individual self-control mediated delinquent behavior. While Stolzenberg and D’Alessio (2008) accept the age-crime connection, they argue that the propensity of youth to engage in crime is not the result of group dynamics at work, as researchers often suggest, but is actually the result of a greater number of individual youth choosing criminal activity. In these types of studies, demographic and individual factors account for crime over and above community factors such as SES and group dynamics. Recently, there has been a resurgence in biological explanations of criminality, with some authors even going so far to suggest that the “nature-versus-nurture” question has been answered definitively on the nature side (Baschetti, 2008).
Despite these studies, Jarjoura et al. (2002, pp. 164-165) wrote simply that “[t]here are many reasons why ethnographic and aggregate-level research would find more consistent evidence of a relationship between poverty and delinquency than empirical analyses at the individual level” and that “individual-level analyses have not in the past captured the persistent poor very well.” Using a measure that accounted for persistent child poverty, and thus those most likely to experience the effects of the poverty-crime connection, Jarjoura et al. showed that the exposure and timing of poverty led to increased rates of delinquency.
Finally, a long tradition of ethnographic literature has sought to personalize and synthesize individual-level findings. This body of research generally demonstrates that disadvantaged individuals often choose delinquent pathways as the result of socioeconomic exclusions from mainstream institutions, like public education, the legal employment market, and other mainstream institutions (Anderson, 1999; Bourgois, 1995; Padilla, 1992; Jencks, 1992; Sanchez-Jankowski, 2008). This history led Sampson and Wilson (1995, p. 54) to conclude that understanding crime requires exploration of community-level factors such as the “ecological concentration of ghetto poverty, racial segregation, residential mobility and population turnover, family disruption, and the dimensions of local social organization . . . especially as they are affected by macrolevel public policies regarding housing, municipal services, and employment.”
Macro-Level Theories of Crime
Study of the effects of personal, socioeconomic, and other environmental factors on individual (micro-level) propensities to crime is supplemented by a literature that examines macro-level (population-wide) influences on crime. “A ‘macro-level’ or ‘ecological’ analysis examines how characteristics of delimited geographical areas—such as neighborhoods, census tracts, cities, counties, states, or nations—are related to rates of crime” and “account for the distribution of crime” (Pratt & Cullen, 2005). Macro-level analyses have delineated factors demonstrating a strong predictive value on population-level crime rates even though these factors have proven poor predictors of individual-level criminality.
Traditional macro-level theories include institutional anomie and social disorganization, which concern the roles of adverse community characteristics and social institutions, both economic and noneconomic, in fostering or curtailing crime (Cancino, Varano, Schafer, & Enriquez, 2007). More recent analyses have rigorously documented that community factors from the neighborhood to the state powerfully affect criminal behaviors and a wide variety of related social phenomena (Sampson, 2012). More precisely, one of the most “stable and strongest predictors” of crime is the constellation of factors now labeled as “concentrated disadvantage” (Pratt & Cullen, 2005, p. 373). Poverty rate is one key measure of concentrated disadvantage, along with unemployment rate, income level, educational attainment, demographic composition, and other statistical measures of population characteristics. Ecological analysis is important because anticrime measures include both individual remediations (arrest, sentencing, rehabilitation, other personal interventions) and general policies (antipoverty measures, employment programs, community services, and other population-targeted strategies). Individual-level and population-level theories are not mutually exclusive, as many of the citations here indicate. Efforts are underway to integrate micro- and macro-level theories of crime to better study interactions between ecological and individual characteristics (Muftić, 2009).
Biological and Developmental Theories Versus SES
Recent investigations are finding that the familiar “age crime curve” showing arrests for violence and many other offenses concentrated in late teen and early-20s are complicated by the question of whether it reflects the “crime prone” nature of young people, the high levels of socioeconomic disadvantage among young populations, or a mix of the two (McCall, et al., 2012). New evidence suggests that socioeconomic disadvantage intensifies and prolongs “crime-prone years” from adolescence well into adult ages (Phillips, 2006). One striking finding is that cities with higher than average proportions of economically and socially engaged young people have lower homicide rates as the proportion of people aged 18 to 29 in their populations increases (Fabio, et al., 2011).
Unfortunately, biological, developmental, and demographic theories of adolescents’ propensity to crime (see, for typical examples, see extensive discussions in Bender & Leone, 1997; Reyna & Rivers, 2008) have been formulated without incorporating a critical factor: the contribution of socioeconomic conditions such as poverty. The absence of literature on this subject is striking (Brown & Males, 2010). Low SES, which typically overlaps with the racial composition of a population, long has been recognized as a correlate with higher rates of most types of offenses (see Donziger, 1996; Fox & Piquero, 2003; Shelden et al., 2001). Thus, when assessing the large differences in risks among various racial, ethnic, and regional groups—such as the high rates of homicide among African Americans or firearms assaults among Southern Americans—even researchers who normally endorse age-based theories of criminality typically pursue social and economic explanations for racial discrepancies (i.e., Fox & Piquero, 2003). However, conclusions about adolescent crime propensity and its causes have been reached without first controlling for the fact that, on average, adolescents and young adults live in very different socioeconomic conditions than older adults (Reyna & Rivers, 2008; for critique, see Males, 2009a).
That socioeconomic disadvantage might be an important variable in what is called “teenage crime propensity” is indicated by the fact that within every race and locale, youths and young adults ages 14 to 19 years and 20 to 24 years are two to three times more likely to live in households with incomes below federal poverty thresholds than are adults ages 40 to 69 years (US Census Bureau, 2010). Age-based income stratification is especially pronounced in California, the site of the present study. Poverty rates averaging below 10% are found for teenagers in only five of California’s 58 counties, versus 30 counties for ages 40 to 69 years. Meanwhile poverty rates averaging 20% or higher afflict teenagers in 25 counties, versus none for Californians ages 40 to 69 years. Even within poverty brackets, younger people’s average poverty rate is higher than for older ages. Commensurate with higher poverty levels, youths and young adult populations have substantially higher proportions than do older ages of African and Latino Americans, whose arrest rates are higher than for Whites and Asians. In California, 55% of ages 14 to 19 years are Black or Latino, compared to 34% for age 40 to 69 years.
The present study employs population-level analysis of two crime predictors: age and poverty rate. The premise derived empirically from macro-level statistics is that young populations differ substantially from older populations in more ways—and perhaps more important ways—than just age. The contribution of the full range of sociodemographic (socioeconomic, racial, age, and gender characteristics) to teenagers’ and young adults’ higher arrest risks compared to older adults’ deserves comprehensive attention. However, there appears little investigation of how poverty interacts with age across the lifespan to produce theories of deviance and risk-taking (Brown & Males, 2010; McCall et al., 2012; Phillips, 2006). One barrier to analysis is that socioeconomic variables such as poverty level are not captured in the official arrest statistics typically used to construct crude age-crime curves. An alternative measure, self-reporting surveys of individual criminal behaviors, enables tabulations of individual socioeconomic variables that are not captured in official crime statistics, but self-reports may be incomplete and unreliable (Lauritsen, 1998). A third alternative is to use crime and census statistics to conduct population-level investigations into whether disproportionately low SES and high concentration of high-arrest demographics among young people rather than young age per se explains the “age-crime curve” in the same way preliminary inquiries suggest poverty status, not age, best explains high teenage traffic crash rates (Males, 2009b).
Method
Data and Measures
The ideal, a national investigation of arrest rates and poverty levels, is severely hampered by the inconsistent reporting of arrests and arrest details by state and within states, with the result that FBI (1970-2011) Uniform Crime Reports for 2011 includes arrest figures for just 77% of the nation’s population. Therefore, a large state with comprehensive reporting becomes the best alternative. California’s Criminal Justice Statistics Center (2012) provides near-complete, statewide arrest tabulations by specified age groups (under 10 years, 10-17 years, 18-19 years, 20-29 years, 30-39 years, 40-69 years, and 70 years and older), race/ethnicity (Latino, White not Latino, Black not Latino, Asian/other not Latino) and offense statewide and, by special data request, for each county. California’s arrests for violent felonies (homicide and nonnegligent manslaughter, rape, robbery, aggravated assault, and kidnapping) by age, race, and county during 2010 were tabulated along with corresponding 2010 populations and poverty levels reported by the Census of Population and American Community Survey, Bureau of the Census (2010, see also Demographic Research Unit, 2012). Unfortunately, California’s age groupings for arrests do not match the Census’s age groupings for poverty. Therefore, applying national poverty estimates by race and single year of age to interpolate and regroup California county, race, and grouped-age data, the Census’s age groupings for poverty brackets were standardized to California’s age groupings for arrests (Shyrock & Siegel, 1976). The few cells with fewer than 50 people per age-year were excluded, since estimates of poverty levels are unreliable for small populations. The resulting sample consisted of 906 county/race/age cells containing 27.2 million people and 116,791 violent felony arrests in 2010, 99.6% of the state’s total.
To minimize the crime-inhibiting physical limitations of very young and very old age, the populations used as the denominators to calculate rates of arrest for all ages under 18 were 14 to 17 and, for ages 40 and older, 40 to 69. Since approximately 11% of violence arrests for ages under 18 accrue to ages under 14 while only 1% of arrests for ages 40 to 69 involve ages 70 and older, the effect of this denominator choice is to boost arrest rates for age 14 to 17 more than for age 40 to 69. If, for example, the population age 40 to 59 were used instead of 40 to 69 as the denominator, the violent crime rates shown in the tables for ages 40 to 69 would be 24% higher than the rates shown. Violent crime rates are calculated by dividing the number of violent crime arrests per 100,000 population for each age group, race, county, and poverty bracket, summarized in Tables 1 and 2.
Violent Crime Arrest Rates, Arrest Totals, and Populations by Age Group and Poverty Bracket, California, 2010.

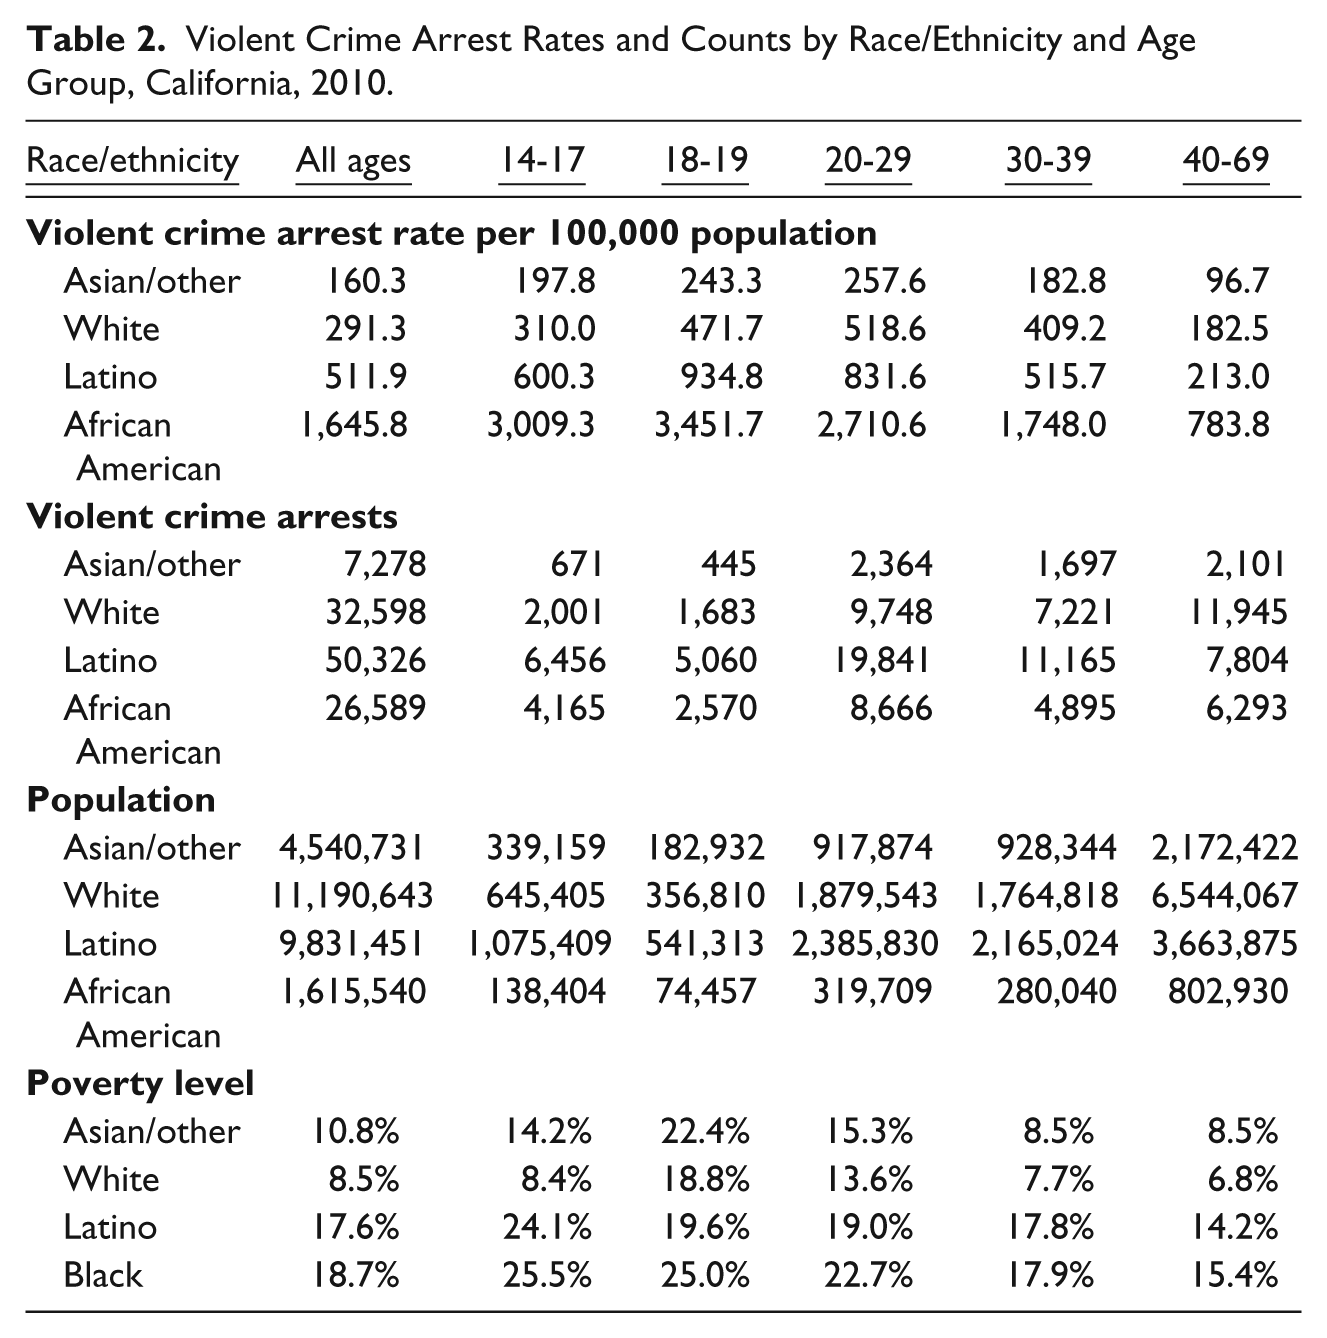
Violent Crime Arrest Rates and Counts by Race/Ethnicity and Age Group, California, 2010.
Results
Age, Race, and Poverty
Table 1 shows California’s raw numbers and crude rates, reflecting a well-known pattern: violence arrestees are disproportionately younger. Ages 14 to 19 years comprised 12% of the total study population aged 14 to 69 years and 20% of violence arrests, while age 40 to 69 years comprised 49% the population but only 24% of violence arrests. Likewise, Table 2 shows, arrests are concentrated in African and Latino American populations (42% of the total population, 66% of violence arrests), while White and Asian Americans are underrepresented (58% of the total population, and 34% of violence arrests).
Tables 1, 2, and 3 shows that poverty is also disproportionately concentrated in younger ages and African and Latino ethnicities. Of the state’s 14 to 17 year-olds, more than half occupy population groups with poverty levels averaging 20% or higher (21.7% are in the 20-24% poverty bracket; 29.9% in the 25+% poverty bracket), compared to just over 1% of ages 40 to 69 years (Tables 1, 3). Conversely, 65% of ages 40 to 69 years inhabit population groups with poverty levels averaging less than 10%, compared to 19% of 14 to 17 year-olds. Poverty not only is much more pronounced among African and Latino than among White and Asian Americans, poverty is more concentrated at younger ages within each race (Table 2). However, races show very different SES patterns by age. While poverty levels among African, Latino, and Asian American 14 to 17 years and 18 to 19 year-olds are 65% to 70% higher than among the corresponding 40 to 69 year-olds of their races and ethnicities, White teenaged poverty rates are just 24% higher than for White middle-agers. White and Asian young adults ages 18 to 19 are considerably poorer than all other age groups of their races, perhaps indicating more temporary “college poverty.”
Percentages of Violent Crimes and Population Contributed by Poverty Bracket to Each Age Group’s Total Violent Crimes and population, California, 2010.

Age, Race, Poverty, and Violence Arrest Rates
Table 2 shows that two thirds of California’s violence arrests involve African and Latino Americans. The disparities in violent crime arrest rates by race are so pronounced that levels among African Americans age 40 to 69 years are substantially higher than for White and Asian teenagers and emerging adults. For each race, both violence arrest rates and poverty levels are higher for younger ages than for ages 40 to 69 years, though disparities for both violence and poverty levels are less for Whites than for other races. However, poverty alone doesn’t explain arrest differentials. At only slightly higher poverty levels, African Americans suffer violent crime arrest rates triple those of Hispanics, and at lower poverty levels, Whites have arrest rates nearly double those of Asians. These patterns persist regardless of age.
When age groups are examined, the highest (20%+) poverty populations generate nearly three fourths of 14 to17 year-olds’ violent crime arrests (25.6% of arrests occur in the 20-24% poverty bracket; 47.2% in the 25+% poverty bracket) as well as disproportionate arrest volumes at every age (Table 3). At the more affluent end, teenagers who have low, “middle-aged” poverty rates display low, “middle-aged” rates of violence arrest that are less than one third those of their poorest young age mates. Similarly, violent crime arrest rates for age 40-69 are four times higher in the highest-poverty (20%+) brackets than in the lowest-poverty (under 10%) brackets. The small numbers of ages 40-69 subjected to high, “teenage” poverty levels of 15% or higher display high, “teenage” levels of violent crime arrest (Tables 1 and 3).
The crime-to-population ratios at the bottom of Table 3 show that while teenagers in the lowest poverty bracket, 0% to 4%, generate only 0.38 as many (or 62% fewer) violent crime arrests than would be predicted from their proportion of the total teenage population, those in the highest poverty bracket, 20%+, generate 1.58 (or 58%) more violent crime arrests than would be predicted from their proportion of the teenage population. For ages 40 to 69 years, the increase in violent crime arrest rates and ratio of percentage of total violent crimes to percentage of population also is very pronounced at higher poverty levels. Similar patterns are evident for ages 30 to 39 years and 20 to 29 years, though the relationship between poverty and arrest level is not absolute.
Discussion
The most reasonable interpretations of the findings of this preliminary analysis made possible by the California Criminal Justice Statistics Center’s unusually detailed archives are that, (a) population groups with high-poverty rates generate disproportionately more violent crime arrestees, (b) young people, like African Americans and Latinos, are overrepresented in high-poverty populations, and (c) poverty status, not age, is the key predictor of a population’s arrest proneness. For all races, every age group, and age groups within races, arrest rates escalate as poverty levels rise. Populations in which older ages suffer high rates of poverty show high rates of older-age violence arrests resembling those of young ages. When young ages enjoy low rates of poverty, they display low rates of violence arrest resembling those of older ages.
California’s patterns indicate that a population age 40 to 69 years whose characteristics were 6% Black, 48% Latino, and 17% in poverty (the typical characteristics of 14-19 year-olds) would display violence arrest rates similar to those of 14 to 19 year-olds. Conversely, if teenagers had sociodemographics similar to those of ages 40 to 69 years (that is, if two thirds were White or Asian and enjoyed poverty levels of under 10%), then teenage arrest and murder levels would fall substantially to approach those of middle-agers. Indeed, it is difficult to imagine how teenage and older adult crime rates could have been directly compared in past analyses and commentaries without taking into account the large demographic and economic discrepancies between younger and older ages.
These findings challenge the notion that teenagers and young adults (at least in California for the offenses investigated here) are a distinctly “crime prone” population. Rather, it is striking how similar teenagers, young adults, and middle-aged adults are with respect to arrest propensity and murder risk under similar economic conditions. If further research confirms that poverty level is the critical variable in “crime proneness” affecting not just racial, ethnic, and regional but also age disparities in arrest rates, then young ages should no longer be depicted or treated as singularly violent and criminally inclined.
However, poverty rate is not an absolute correlate of the arrest rate, and age is not entirely irrelevant. Arrest and murder rates for Californians ages 60 years or so and older drop to well below those of ages under 60 years even at equivalent poverty levels. This may reflect in part the diminished physical capacity of the aged to commit violent and serious crimes and the prior removal of tens of thousands of high-risk individuals from aging cohorts due to death or long-term imprisonment at younger ages. Even more salient, African American violent crime arrest rates are much higher than for Latinos, and White violent crime rates are substantially higher than for Asians, than can be explained by poverty alone due to factors not captured by this variable set. The generally low power of standard variables, singly or multiply, to predict crime rates across a broad spectrum of ages, races, locales, and time periods suggests that there are a host of both micro- and macro-level variables even the best research is failing to capture.
Finally, certain offenses (not detailed separately here) retain age-based arrest patterns even after poverty is controlled. For example, more robbery, street-level property crimes such as theft and burglary, and misdemeanor offenses occur among teenagers, and more assault, drug, and white-collar property offenses such as forgery and embezzlement occur among middle-agers, than their respective populations and poverty levels alone would predict.
Comprehensive sociodemographic analysis assessing race, age, and economic variables offers significant implications for crime policy. For more than a century, influential crime authorities have suggested that the mere presence of “crime-prone populations” characterized by immutable demographics is one (if not the) major driver of crime levels and trends (i.e., Fox & Piquero, 2003; Wilson & Herrnstein, 1994). If, however, crime levels relate substantially more to mutable socioeconomic characteristics than to immutable demographics as this preliminary analysis finds, a broader array of crime prevention and control initiatives that include reducing poverty and mitigating its effects would become important tools in reducing crime. If the main reason Californian 40- to 49- year-olds display violent crime and felony arrest rates lower than 14- to 19-year-olds is due wholly or mainly to the absence of middle-agers from high-poverty, high-arrest categories, then theories of “aging out of crime” and the “age-crime curve” should be reevaluated.
Further, the argument that policies must restrict and protect adolescents as a class because of presumed biological and developmental limitations on their cognitive capacity—specifically, that they commit crime “by reason of adolescence”—should be justified by more controlled empirical verification. Such policy implications would cut across the paradoxical notions that teenagers are both inherently innocent and inherently criminal, affecting both liberal and conservative policy agendas. For example, including sociodemographic variables in crime analysis might undermine the age-based justifications for teenage curfews and gun possession bans as well as for exempting juveniles from the death penalty and adult criminal court trial, though such policies might be rationalized on other grounds. Predictions of crime trends and notions of crime prevention would supplement the current strategy of identifying “at-risk youth” for remedial policing and programming (a process that targets poorer youth in any case) with more integrated measures to address high-poverty rates and other externalities that contribute to high-arrest rates among youth and adults alike.
Limitations
This study is preliminary and has several limitations. Population-level analyses address demographic patterns; they do not predict individual behavior. The contribution of socioeconomic disparity to crime by age clearly requires broader analysis than a one-state investigation. California displays unique demographics and large populations in each age and race/ethnicity category, and the applicability of these findings to other locales requires replication based on local statistics where available and by multivariate analyses. In that regard, there are other measures of SES than poverty and better measures of crime than arrest rates, though one major alternative, self-reporting surveys, has its own biases and limitations. The ideal data set would be one that is both continuous and complete, which may become available from large jurisdictions such as California in the future. Finally, to avoid the “ecological fallacy,” it is important to note that what is being assessed here is not individual crime tendencies based on levels of individual poverty (official tabulations do not specify the SES of each arrestee or murder victim), but environments of poverty.
Footnotes
Declaration of Conflicting Interests
The authors declared no potential conflicts of interest with respect to the research, authorship, and/or publication of this article.
Funding
The authors received no financial support for the research, authorship, and/or publication of this article.