
Abstract
Decoupling economic growth from environmental degradation is a primary challenge for the Asia-Pacific. This study examines long-run dynamic associations between renewable energy (RE), non-renewable energy (NRE), economic growth, and
Keywords
Introduction
In 1992, under Agenda 21 of the United Nations, (https://sustainabledevelopment.un.org/outcomedocuments/agenda21) Policymakers were encouraged to utilize energy sources that emit the least emissions, enhancing economic and industrial efficiency, as a primary objective to attain sustainable development. The critical challenge, underscored by the IPCC (2013), is that CO2 emissions from burning fossil fuels remain the key driver of climate change, impeding sustainable progress. Therefore, this economic growth versus efficient control of carbon emission has become the nucleus of long-term sustainability.
There have been a lot of studies on the link between energy use and economic growth.1,2 These studies have led to hypotheses like Growth, 3 Conservation,4–6 Feedback,3,7,8 and Neutrality. 6 But a lot of this significant research has been concentrated on the relationship between energy and the economy, often disregarding the crucial environmental aspect of carbon emissions, which is probably just as important to the equation for sustainability.
Compounding this, the relationship between economic progress and environmental health is often explored through the lens of the Environmental Kuznets Curve (EKC) hypothesis. 9 This theory suggests an inverted-U pattern: emissions initially rise with GDP but eventually fall after a certain economic peak. However, empirical evidence for this curve is far from consistent, with studies reporting diverse shapes (U, inverted-U, and N patterns) across different regions and periods (e.g., Refs. 10–15). This ongoing debate highlights the need for continued investigation, particularly in regions facing rapid development and pressing environmental concerns.
Historically, the pursuit of high GDP growth, (https://www.imf.org/external/datamapper/NGDP_RPCH@WEO/OEMDC/ADVEC/WEOWORLD) has always relied on non-renewable energy. Coal, oil, and natural gas feed economic production but are the biggest source of greenhouse emissions that cause climate change. Several studies show that NRE boosts GDP growth with greater carbon emissions.16–18 On the contrary, renewable energy (RE) sources like solar, wind, and biomass offer a cleaner path forward, capable of supporting economic activity while actively reducing pollution.3,17,19 Understanding these diverse, and sometimes contradictory, consequences of RE and NRE on economic growth and environmental quality is crucial for creating successful sustainable development strategies.
To provide a comprehensive analysis of the growth-environment nexus, this study incorporates a specific set of macroeconomic variables Renewable (RE) and Non-Renewable Energy (NRE), Foreign Direct Investment (FDI), Gross Fixed Capital Formation (GFCF), Labor Force (LF), and Trade Openness (TO) grounded in distinct theoretical mechanisms. Energy consumption is a central explanatory dimension of the model; while NRE is associated with scale-driven emissions dynamics, RE is examined as a factor linked to “technique-stage associations” relevant to sustainable growth. 18 FDI is included to test competing hypotheses: the “Pollution Haven” theory, which suggests dirty industries migrate to developing Asia, versus the “Pollution Halo” theory, where foreign capital transfers green technology. 20 GFCF represents domestic industrial capacity; however, recent literature questions whether rapid capital accumulation in developing regions promotes efficiency or results in “crowding out” and environmental degradation. 21 Labor Force (LF) is included to capture the region’s massive demographic dividend as a primary factor of production. Finally, Trade Openness (TO) allows us to control for the environmental impact of the region’s deep integration into global supply chains (Awodumi & Adewuyi, 2020). By integrating these specific variables, this study moves beyond simple energy-growth models to capture the structural complexity of the Asia-Pacific economy.
The Asia-Pacific region stands as a critical focal point for sustainability, accounting for 47% of global energy consumption and over half of the world’s CO2 emissions (17.27 billion metric tons) in 2023. This massive environmental footprint underscores the urgency of balancing rapid economic expansion with effective emission controls. However, existing literature remains fragmented, predominantly focusing on single nations or specific developed economies. Comprehensive panel studies that rigorously analyze the interconnected dynamics of renewable and non-renewable energy, economic growth, and emissions across the region’s full diverse spectrum remain scarce, presenting a significant gap in understanding the broader regional nexus.
To bridge this gap, this study investigates the dynamic interrelationships among RE, NRE, economic growth, and CO2 emissions across 32 Asia-Pacific economies from 1990 to 2023. Unlike prior studies that ignore cross-sectional dependence, this research employs the robust Pooled Mean Group Autoregressive Distributed Lag (PMG-ARDL) estimator and the Dumitrescu-Hurlin causality test. We contribute to the literature by: (i) distinguishing the specific growth and environmental impacts of RE versus NRE; (ii) integrating foreign direct investment (FDI) and capital formation to test the “Pollution Halo” and “Crowding Out” hypotheses; and (iii) providing empirical evidence on the estimated EKC turning point for a structurally diverse region.
The remainder of the paper is organized as follows: Section 2 reviews the relevant literature, Section 3 describes the data and methodology, Section 4 presents the empirical results, and Section 5 offers conclusions, policy implications, and limitations.
Literature review
The dynamic nexus of energy consumption and economic growth
The causal link between energy consumption and economic growth remains a cornerstone of energy economics, historically categorized into four competing frameworks. The Growth Hypothesis posits energy as a vital primary input, suggesting that conservation policies may impede expansion a trend frequently observed in fossil-fuel-dependent developing Asian economies. 17 Conversely, the Conservation Hypothesis argues that mature economies can decouple growth from energy use through efficiency. 4 Transition economies often exhibit the Feedback Hypothesis, characterized by bidirectional interdependence, 7 while the Neutrality Hypothesis suggests no causal link.
Recent scholarship has moved beyond linear interpretations, utilizing advanced econometric techniques to reveal that these relationships are frequency-dependent and time-varying. For instance, AlNemer et al. 22 demonstrated that while non-renewable energy (NRE) drives growth in the long run, it leads to environmental degradation, whereas renewable energy (RE) contributes to emission reductions in the short term. Similarly, machine learning and NARDL approaches23,24 have identified strong substitution effects between “dirty” and renewable energy driven by price asymmetries and market uncertainty. 25
Environmental pollution, FDI, and the EKC hypothesis
The trade-off between development and environmental quality is theoretically framed by the Environmental Kuznets Curve (EKC). Originating from Kuznets’ 9 work on inequality and solidified in the 1990s by Grossman and Krueger, 26 the EKC suggests an inverted-U relationship between income and emissions. This pattern is commonly interpreted through three structural channels: the Scale-driven dynamics (increased production), the Composition Effect (shift to services), and the Technique Stage associations (technological innovation). In the Asia-Pacific, empirical evidence is mixed, with studies identifying both traditional inverted-U and N-shaped patterns, the latter suggesting that Scale-driven dynamics can eventually overwhelm technical gains.10,27
Crucially, external drivers such as Foreign Direct Investment (FDI) and Trade Openness play a pivotal role in this nexus. Literature presents two competing theories: the Pollution Haven Hypothesis, where dirty industries migrate to evade strict regulations, 20 and the Pollution Halo Hypothesis, where foreign capital transfers cleaner technology. Recent findings in the region are bifurcated, supporting the Halo effect in high-tech East Asian hubs while suggesting Haven effects in parts of ASEAN. 28 Emerging determinants, including green innovation, ICT transitions, and foreign remittances, further underscore the complexity of environmental quality in the BRICS and Belt and Road regions.29,30
The role of capital formation and labor
Traditional growth models often treat capital as a homogenous input, yet from an environmental perspective, the quality of capital is decisive. Investments in carbon-intensive infrastructure can “lock in” high-emission pathways, whereas investments in green technology facilitate the transition to a low-carbon economy. 21 Similarly, in labor-abundant Asian markets, the interaction between labor efficiency and energy intensity is associated with the sustainability of long-term growth. 31 By integrating Gross Fixed Capital Formation (GFCF) and Labor Force (LF), this study avoids the omitted variable bias common in simplified energy-growth models.
Research gap and novelty
While the energy-growth-emissions nexus is well-studied, this research bridges three critical gaps identified in the existing literature:
Regional heterogeneity gap
Most studies treat the Asia-Pacific as a monolithic block or focus on small clusters (e.g., ASEAN). By bifurcating 32 economies into High-Income and Middle-and-Low-Income groups, we distinguish between “Technique-stage” and “Scale-stage” nations to compare estimated turning points and associated heterogeneity across income groups.
Methodological gap
Prior research frequently relies on first-generation panel techniques that ignore cross-sectional dependence (CD). In an integrated trade region, failing to account for CD yields biased elasticities. 32 We employ second-generation PMG-ARDL and CS-ARDL estimators with Driscoll-Kraay corrections to ensure robust inference.
Variable-specific gap
We move beyond aggregate energy models by simultaneously controlling for FDI and domestic capital (GFCF). This allows us to isolate the distinct environmental impacts of foreign versus domestic investment channels, providing a more granular assessment of the “Pollution Halo” versus “Haven” paradox.
Summary of significant literature and identified research gaps.
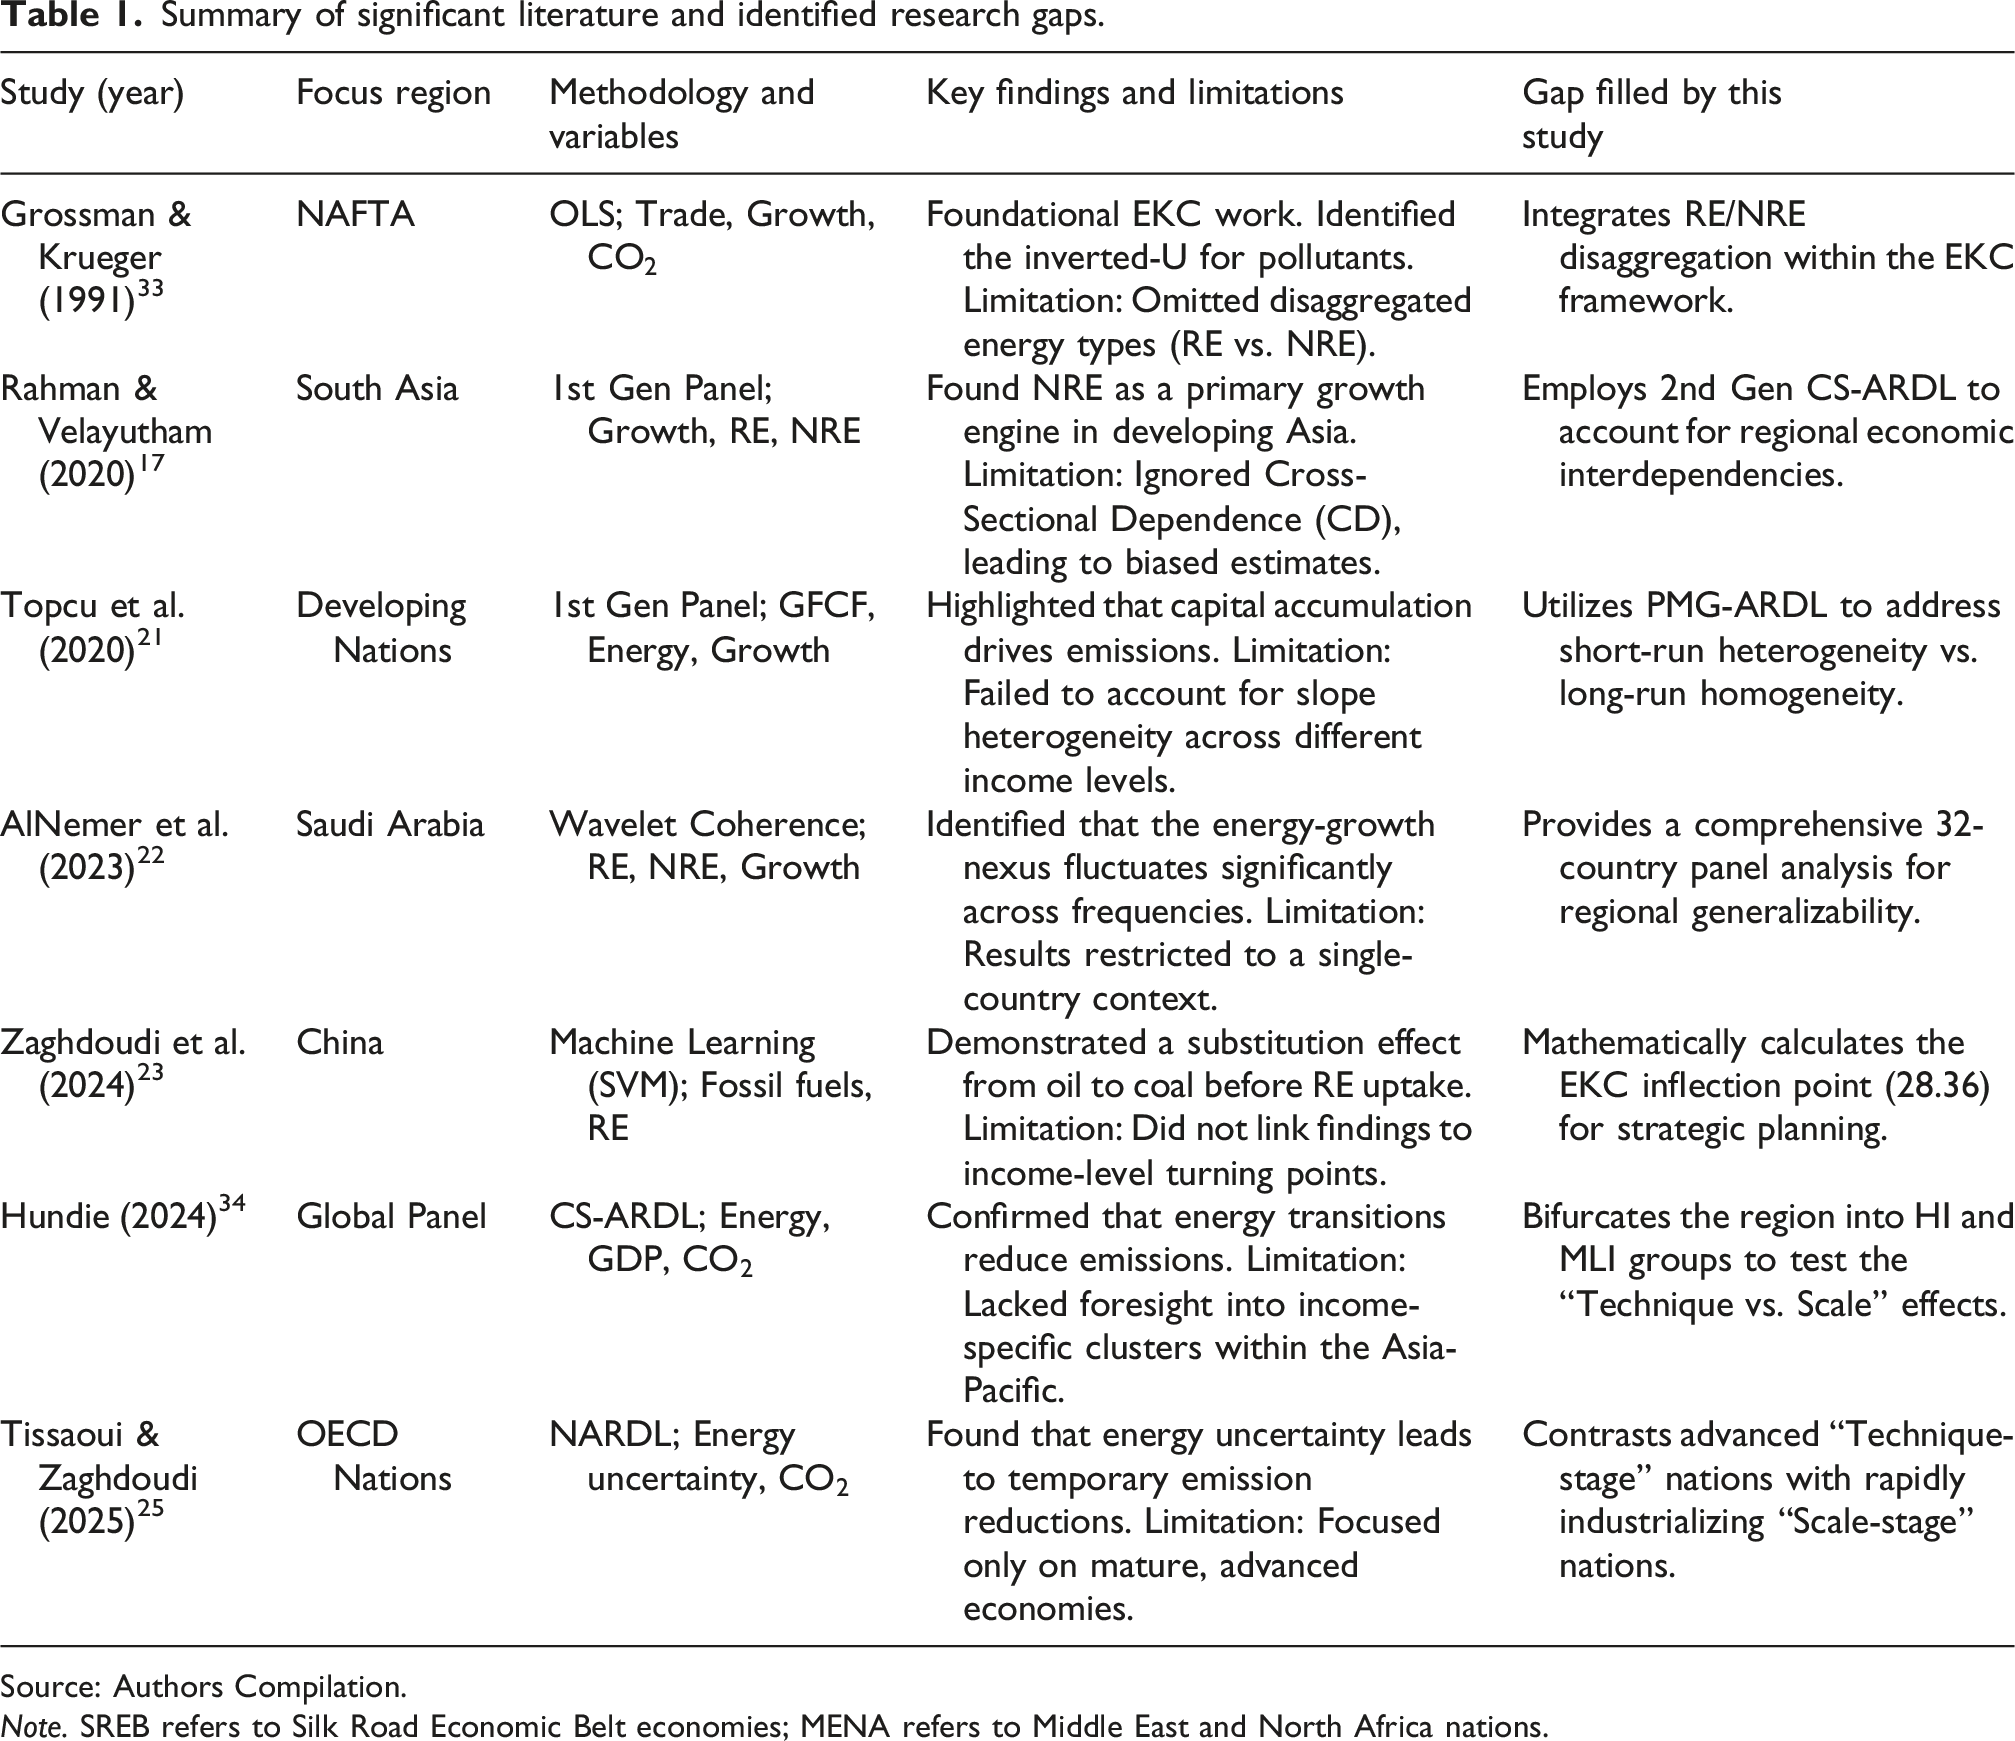
Source: Authors Compilation.
Note. SREB refers to Silk Road Economic Belt economies; MENA refers to Middle East and North Africa nations.
Data and methodology
Data and variable rationale
Using a balanced panel of 32 Asia-Pacific economies (1990–2023), this study examines Economic Growth (GDP, constant 2015 US$) and
Regional classification and economic grouping of the 32 Asia-Pacific economies.
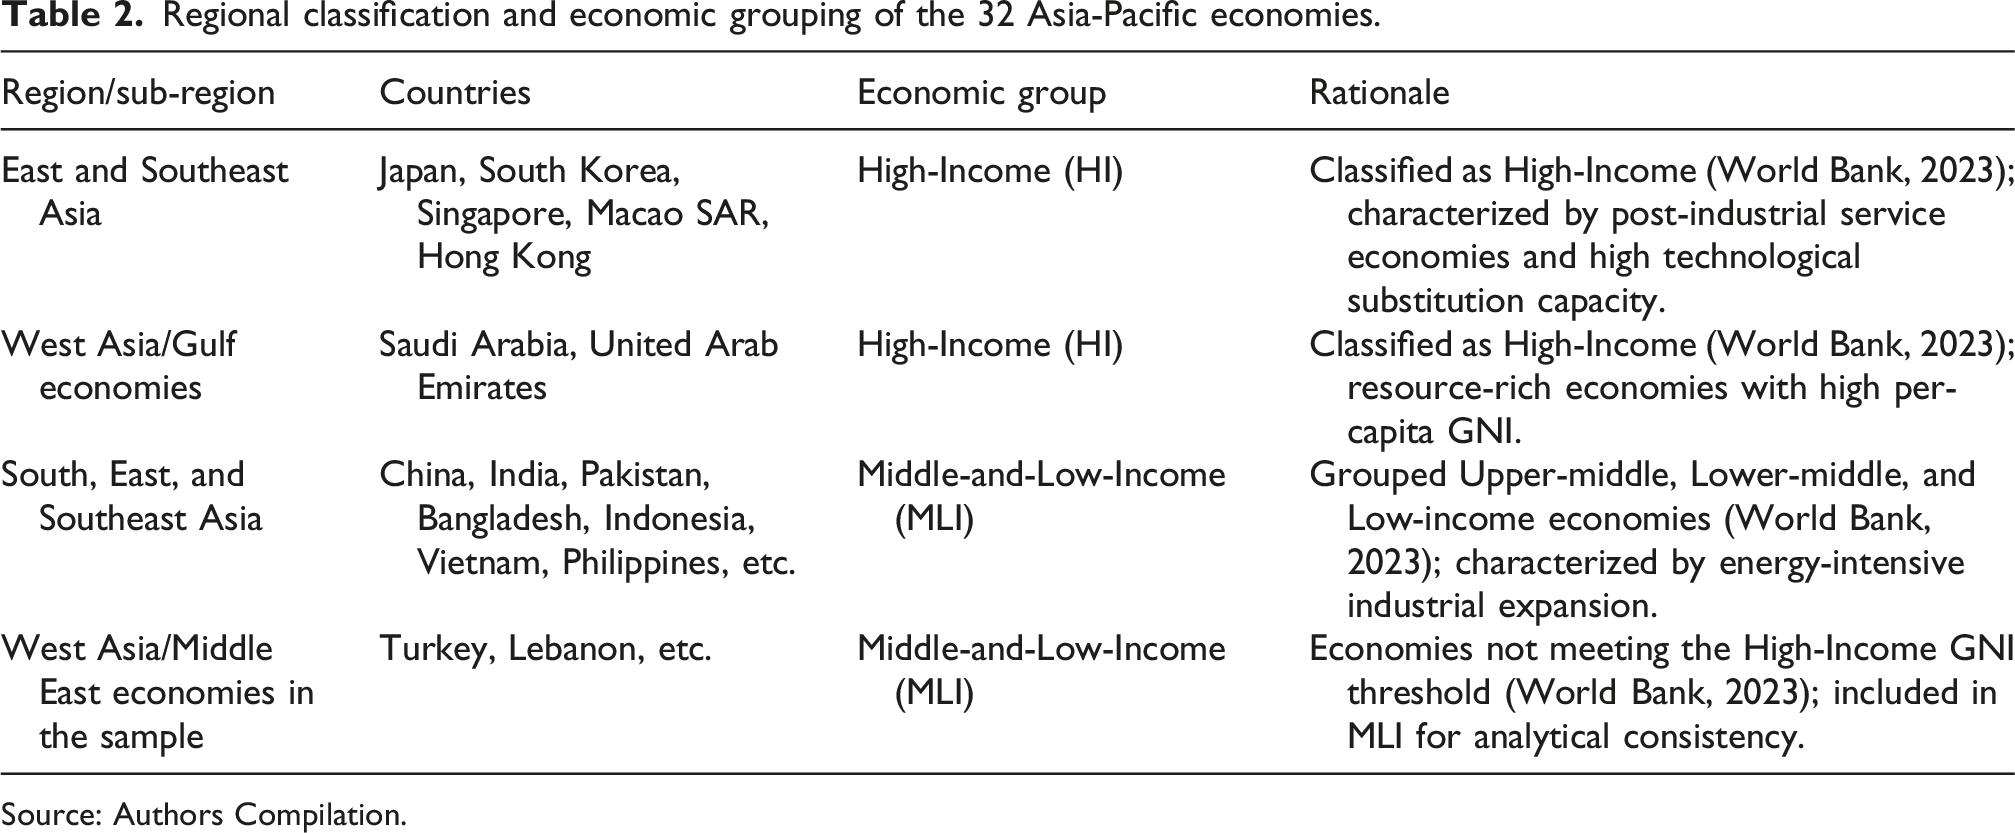
Source: Authors Compilation.
Data sources and harmonization
The primary data source is the World Development Indicators (WDI) by the World Bank. However, owing to data discontinuity in WDI energy series after 2015, we supplemented the dataset with values from the International Energy Agency (IEA) for the period 2016–2023. To ensure data consistency and avoid structural breaks at the splicing point, we performed a rigorous harmonization process. Since WDI sources its energy data directly from IEA statistics, the definitions and measurement units are identical. We further checked this by cross-referencing overlapping years (2010–2015) from both sources; the correlation coefficient was near unity (>0.99), suggesting a high degree of consistency between the two series.
Variable selection and omitted variable justification
To avoid multicollinearity and biased estimates, this study adopts a parsimonious specification by omitting urbanization and industrialization, which are highly collinear with GDP per capita in developing Asian economies.4,13 Instead, following the framework of Behera and Mishra 31 and Topcu et al., 21 Gross Fixed Capital Formation (GFCF) and Labor Force (LF) serve as robust proxies for industrial intensity and demographic shifts. Furthermore, to overcome aggregate data constraints, a thematic sectoral decomposition for the industrial and transport sectors (IEA, 2022) provides a “qualitative-quantitative bridge.” This allows us to disentangle the “Technique Stage associations” and identify the specific energy transitions most critical for regional decarbonization.
Theoretical framework and model specification
The role of energy and emissions in the production function
Rather than a standard neoclassical growth model, this study employs an augmented biophysical production framework specifically calibrated for the Asia-Pacific context. This approach acknowledges that energy is not a neutral input but an essential factor for capital and labor to perform physical work.38,39 By adopting this biophysical perspective, we disaggregate energy into Non-Renewable (NRE), which fuels the “Scale-driven dynamics,”
40
and Renewable (RE), which facilitates technological substitution via the “Technique Stage associations.”18,41 Furthermore, following Ang,
42
Conceptual Framework of the Study. Note. Solid arrows indicate the impact on Economic Growth; dashed arrows indicate the direct impact on CO2 emissions. The curved arrow represents the Inverted U-shaped Environmental Kuznets Curve (EKC) relationship.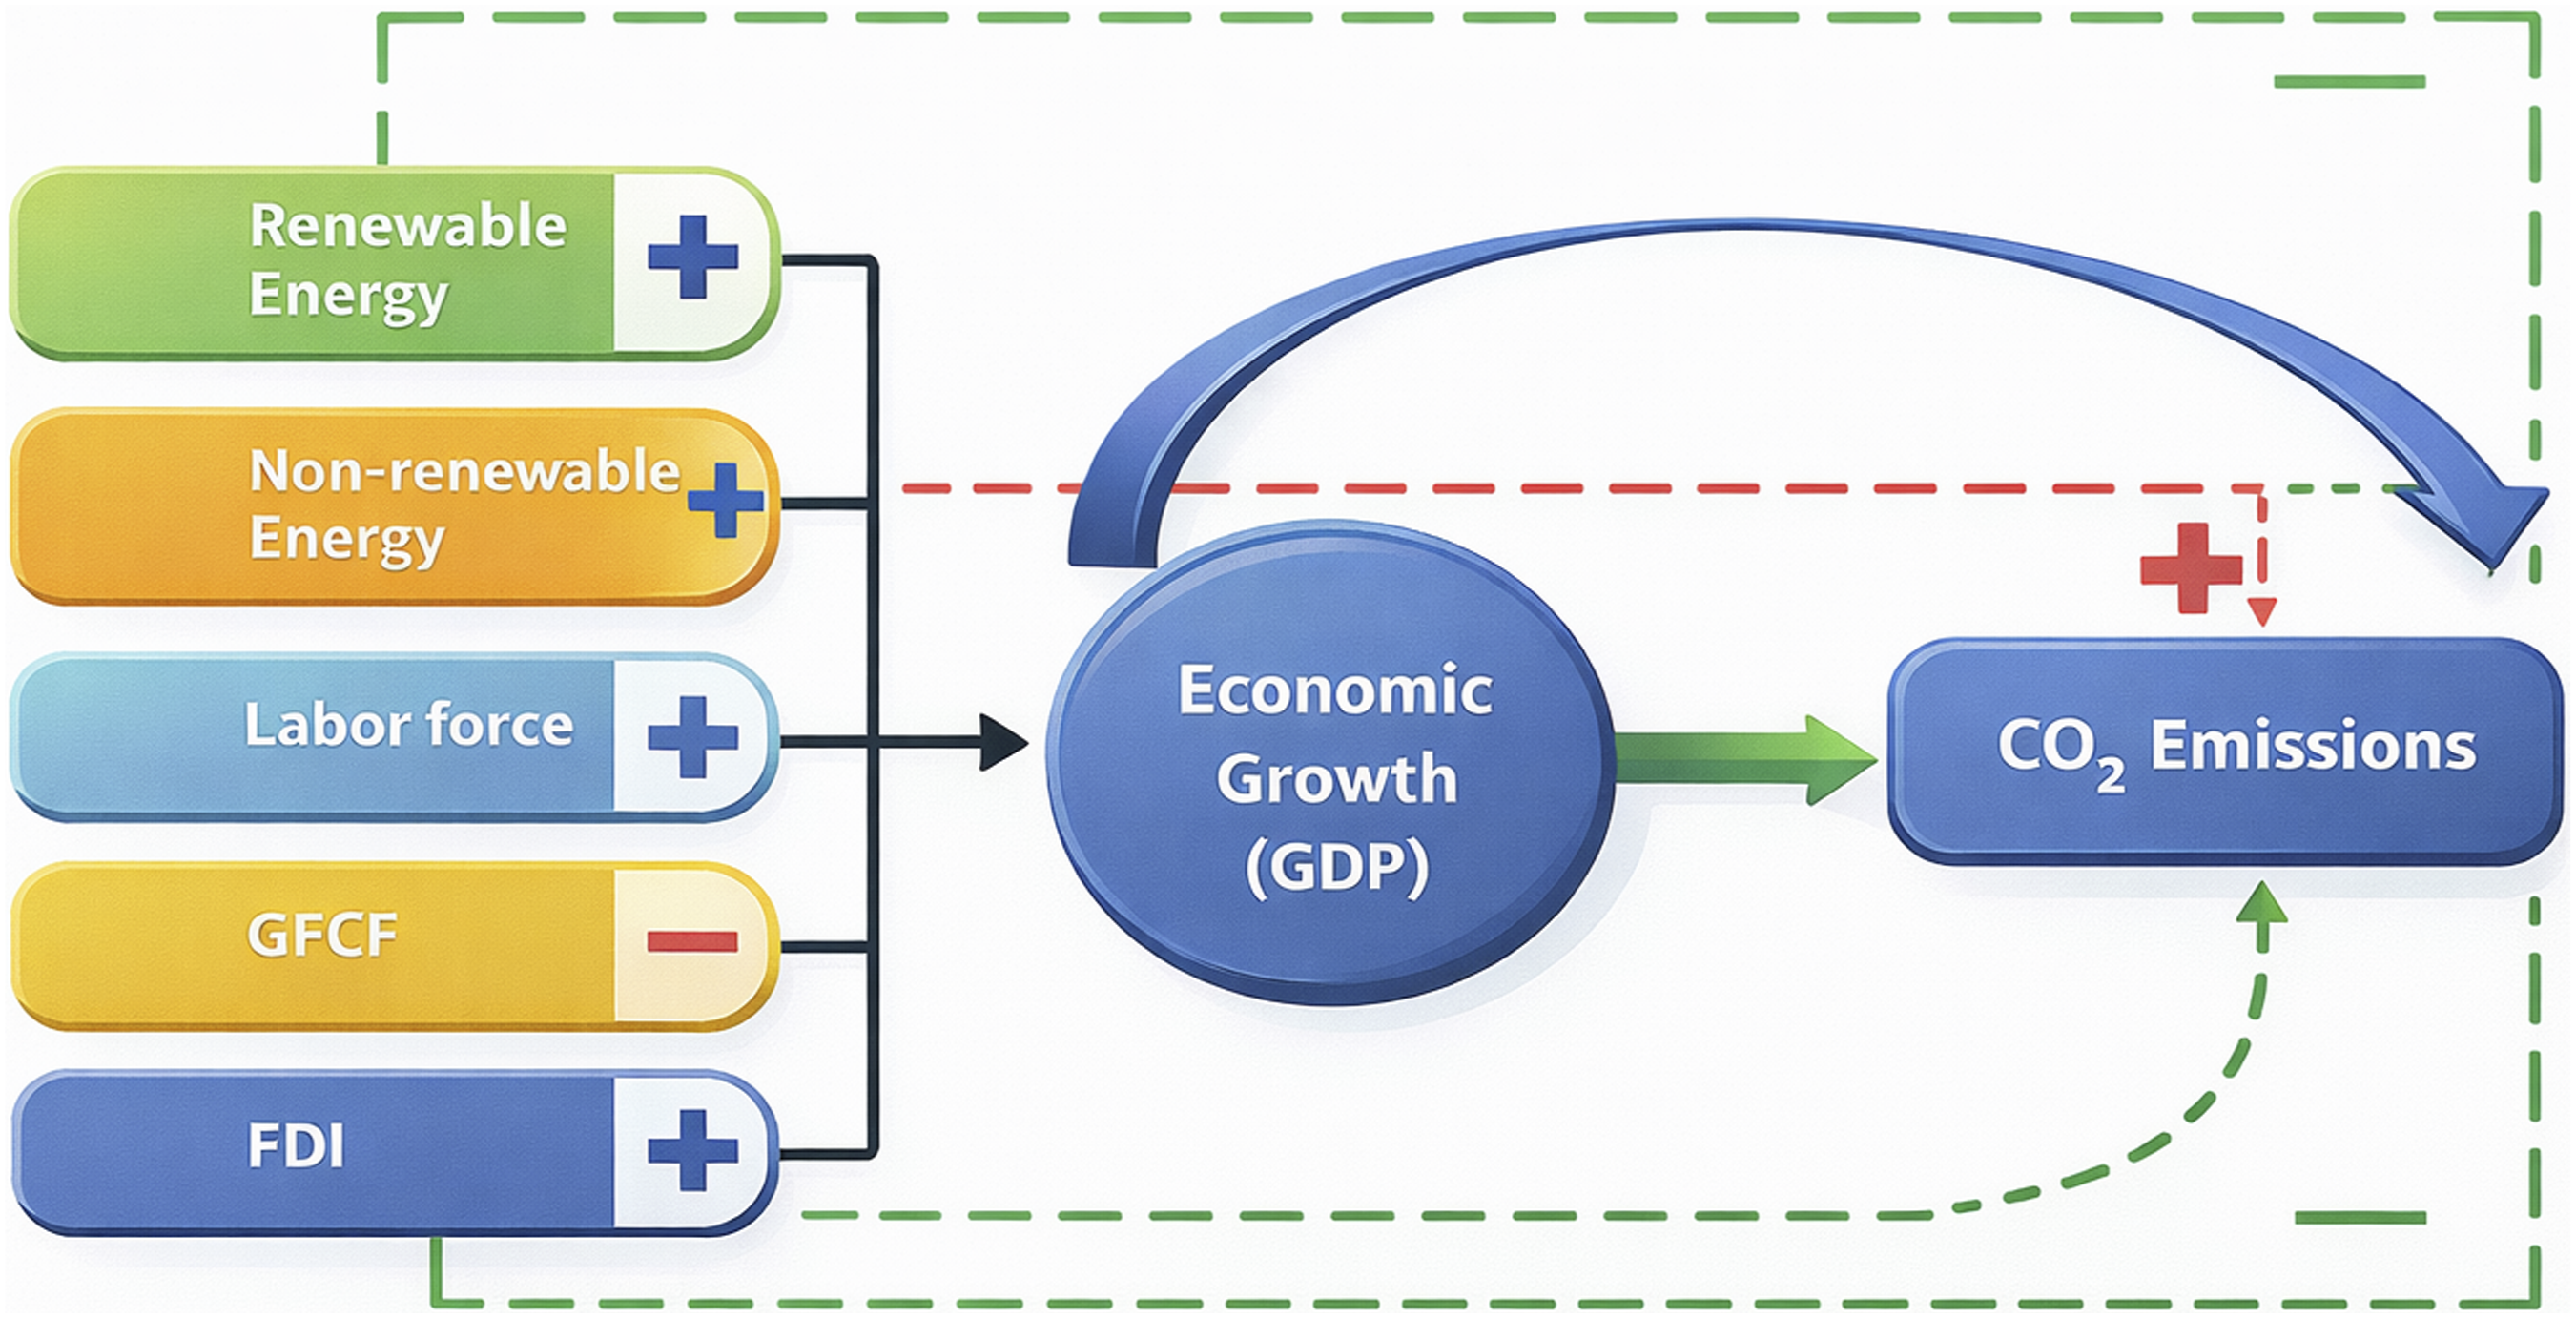
The EKC hypothesis and regional heterogeneity
The Environmental Kuznets Curve (EKC) hypothesis26,35 frames the growth-environment nexus through three mechanisms: the Scale-driven dynamics, driving NRE use and emissions27,44; the composition effect, triggering structural shifts toward services45,46; and the Technique Stage associations, where rising incomes foster renewable technology adoption.18,47 Testing this framework in the Asia-Pacific is vital due to the region’s structural heterogeneity ranging from advanced “technique-stage” nations (e.g., Japan, Australia) to emerging “scale-stage” markets (e.g., China, India, Vietnam) to assess whether the estimated long-run associations are consistent with movement toward an EKC-type inflection point. Based on this underpinning, the augmented Cobb-Douglas production function is specified as:
Secondly, this study also explores the influence of RE, NRE, GDP, FDI, GFCF, and TO on CO2 emissions and tests the Environmental Kuznets Curve (EKC) hypothesis. Following the method used by Hanif et al.
13
and Yang et al.,
14
we have formulated a conceptual model based on the EKC hypothesis as:
Following Bakhsh et al.
48
and Mensah et al.,
3
all variables are transformed into natural logarithms (

Following the quadratic specification in Equation (4), the existence of an inverted U-shaped EKC requires 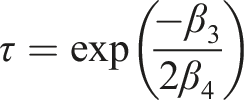
Panel cointegration test

Summary of empirical results and strategic directions.
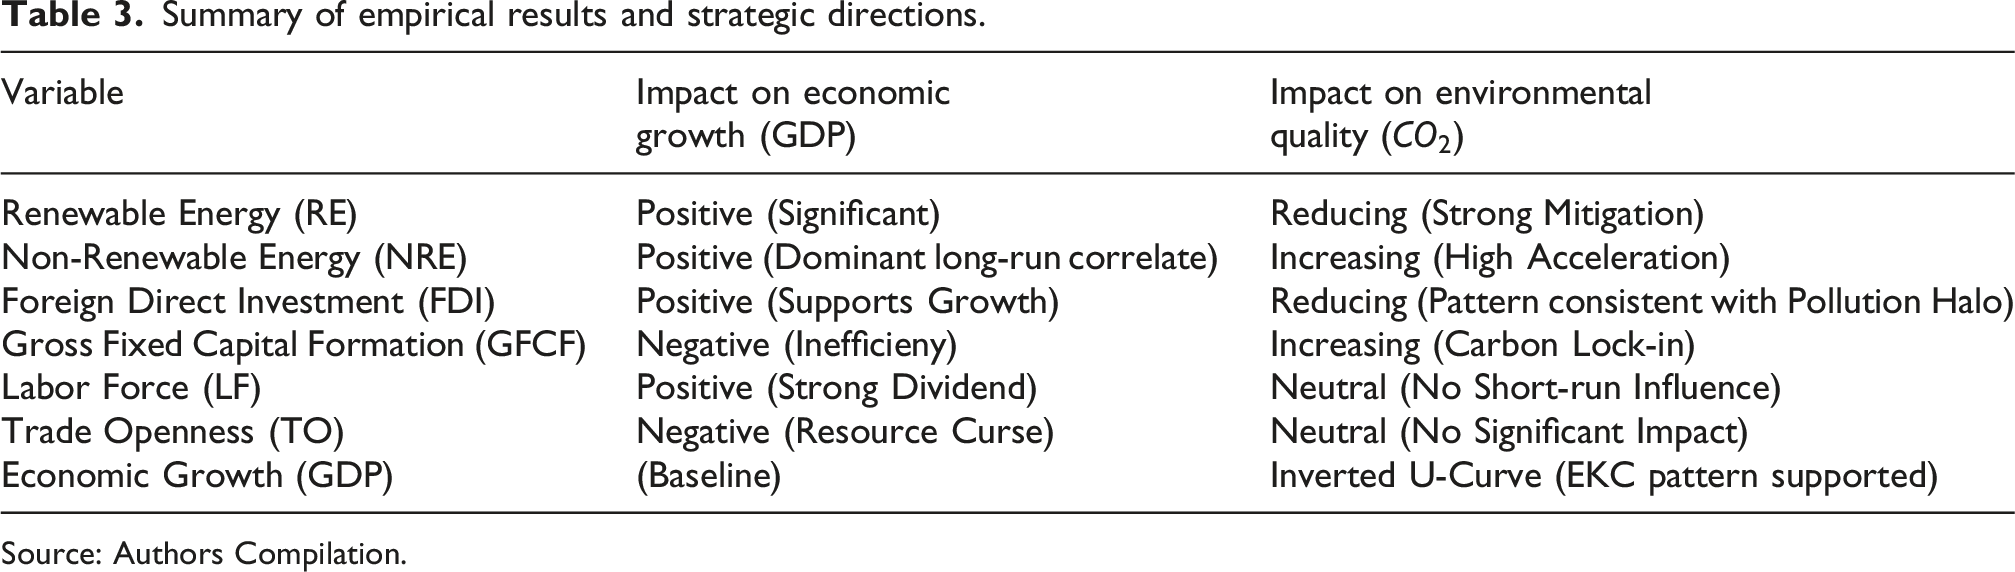
Source: Authors Compilation.
Econometric strategy and model selection
Given the macro-panel context (
For additional robustness against unobserved common factors and global technological spillovers, this study utilizes the CS-ARDL estimator,54,55 with results detailed in Section 4.9 (Table 7). Finally, to address structural diversity, the panel is bifurcated into High-Income (HI) and Middle-and-Low-Income (MLI) groups (Table 2) to granularly test the “Technique” versus “Scale” effects. 13 The specific short-run and long-run error correction models are detailed in Appendix A.
Panel causality test
To examine predictive temporal linkages within the panel framework, we utilize the Dumitrescu and Hurlin
56
non-causality test, which accounts for heterogeneous mechanisms across cross-sectional units. This approach relies on fewer assumptions than the Holtz-Eakin et al.
57
model and explicitly distinguishes between causal connection and regression model heterogeneity. Crucially, it identifies panel-wide causal patterns regardless of direction, even when causality is absent at the individual level, specified as follows:

Addressing endogeneity, this study acknowledges significant identification challenges in the energy-growth-emissions nexus, particularly simultaneity bias from mutual feedback loops. Although PMG-ARDL mitigates endogeneity via dynamic lags,60,61 contemporaneous simultaneity remains a hurdle. Consequently, this study interprets long-run coefficients as robust dynamic associations rather than purely exogenous shocks, ensuring Section 5’s policy implications reflect the region’s complex structural interdependencies and empirical reality.
Empirical results and discussion
Descriptive statistics and regional profile
The 32-country panel exhibits profound structural heterogeneity, with
While Table 3 provides the high-level directions of this study’s conclusions, the following sub-sections (4.2 through 4.9) provide the statistical checks used to assess whether the estimated long-run associations remain stable in the presence of regional interdependencies and short-run disturbances. This technical verification begins with a diagnostic assessment of the data’s properties.
Multicollinearity test
The Tolerance and Variance Inflation Factor (VIF) is estimated to test the multicollinearity among the independent variables. The results shown in Table E2 in Appendix E indicate that there is no multicollinearity issue among the aforementioned independent variables.
Homogeneity and cross-sectional independence tests
The results of Hausman’s (1978) homogeneity test presented in Table E3 in Appendix E show that the null hypothesis of homogeneity is accepted for both the dependent variables (GDP and CO2). Hence, the dataset is homogenous for the considered country groups. Table E3 in Appendix E also reports the cross-sectional dependence test of the variables. In Breusch-Pagan LM, Pesaran scaled LM, and Pesaran CD tests, the null hypothesis of no cross-sectional dependence is rejected at a 1% significance level for both the dependent variables. Therefore, a significant cross-sectional dependence presents among the variables across the selected countries. Hence, heterogeneous panel estimations should be adopted to tackle the aforementioned issues. 3
Panel unit root tests
To assess variable integration levels, we employed second-generation panel unit root tests, specifically Pesaran’s CADF and CIPS, which are robust for heterogeneous and cross-sectionally dependent data like ours. Results (Table E4 in Appendix E) indicate mixed stationarity orders at level: some variables are non-stationary (I(1)), while others are stationary (I(0)). Crucially, all variables become stationary after first differencing, being integrated of order (I(1)). Given this mixed integration profile where all variables are I(1) in the first difference, we proceed to conduct a panel cointegration test to examine the long-term relationship among them.
Panel cointegration test
Based on the integration level of the variables, the panel cointegration test proposed by Westerlund and Edgerton 50 is employed. The results are reported in Table E5 in Appendix E. Since the robust p-values of Gt, Ga, Pt, and Pa are significant at either 1% or 5% level, the null hypothesis of no cointegration is rejected. The overall findings based on bootstrapped p-values, the robust p-values indicate that there is a cointegration (long-term relationship) among all the variables used in this study.
PMG panel ARDL estimates
Results of PMG panel ARDL model.
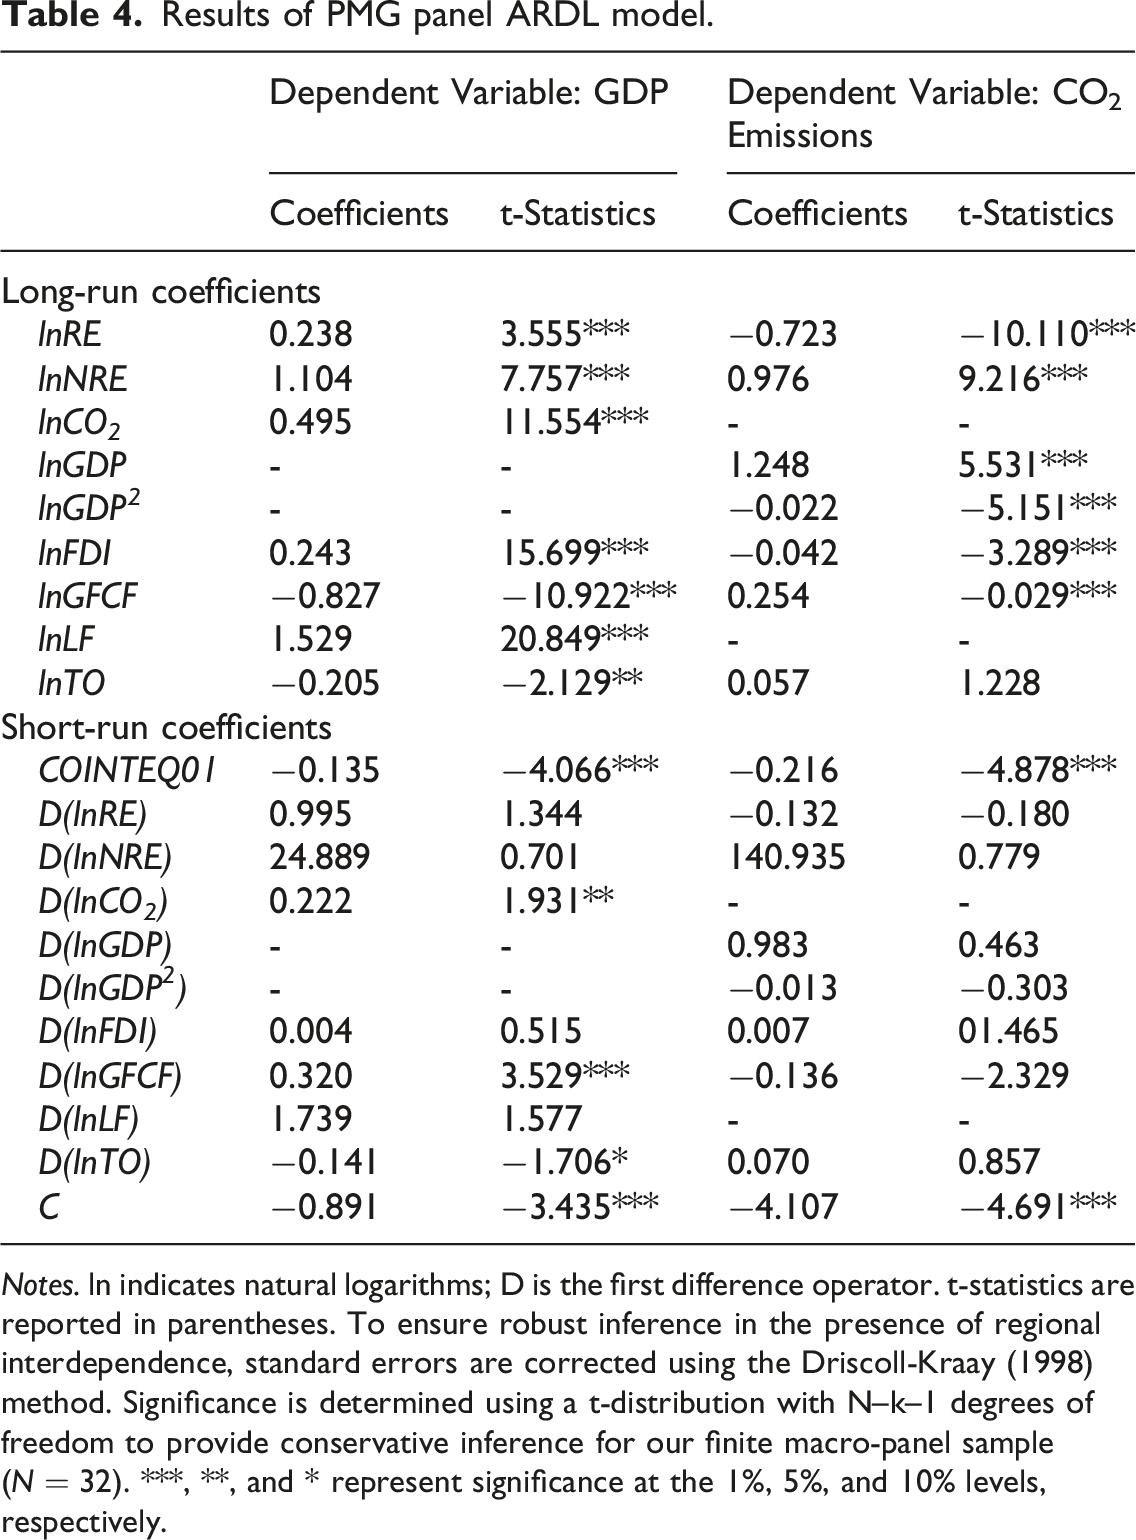
Notes. ln indicates natural logarithms;
The energy-growth-emissions nexus
Long-run estimates (Table 4) confirm energy as a primary economic driver, with RE usage significantly boosting GDP (0.238), consistent with Tugcu et al.
62
and Rahman and Velayutham.
17
NRE consumption exerts a larger positive impact (1.10), validating the Growth Hypothesis for the fossil-fuel-dependent Asia-Pacific. However, NRE entails substantial environmental costs, accelerating emissions by 0.98% for every 1% consumption increase.
16
Conversely, RE usage significantly decelerates long-run
The study period (1990–2023) coincides with major regional and global economic disruptions, including the 1997 Asian Financial Crisis, the 2008 Global Financial Crisis, and the COVID-19 pandemic. While these episodes introduced significant short-term volatility into the data, this study does not formally test for structural breaks or the specific impact of crisis events. Accordingly, the PMG-ARDL results should be interpreted as evidence of long-run dynamic associations over the full sample period, while short-run disturbances are absorbed within the error-correction framework rather than treated as separately identified crisis effects.
61
Our findings suggest that while these shocks caused temporary deviations in growth and emission levels, the long-run cointegrating relationship between energy use and
The EKC hypothesis and turning point analysis
Long-run results are highly consistent with the Environmental Kuznets Curve (EKC) hypothesis, evidenced by the positive Modeled Environmental Kuznets Curve for the Asia-Pacific Panel. Note. The curve is derived from the quadratic long-run coefficients in Table VI (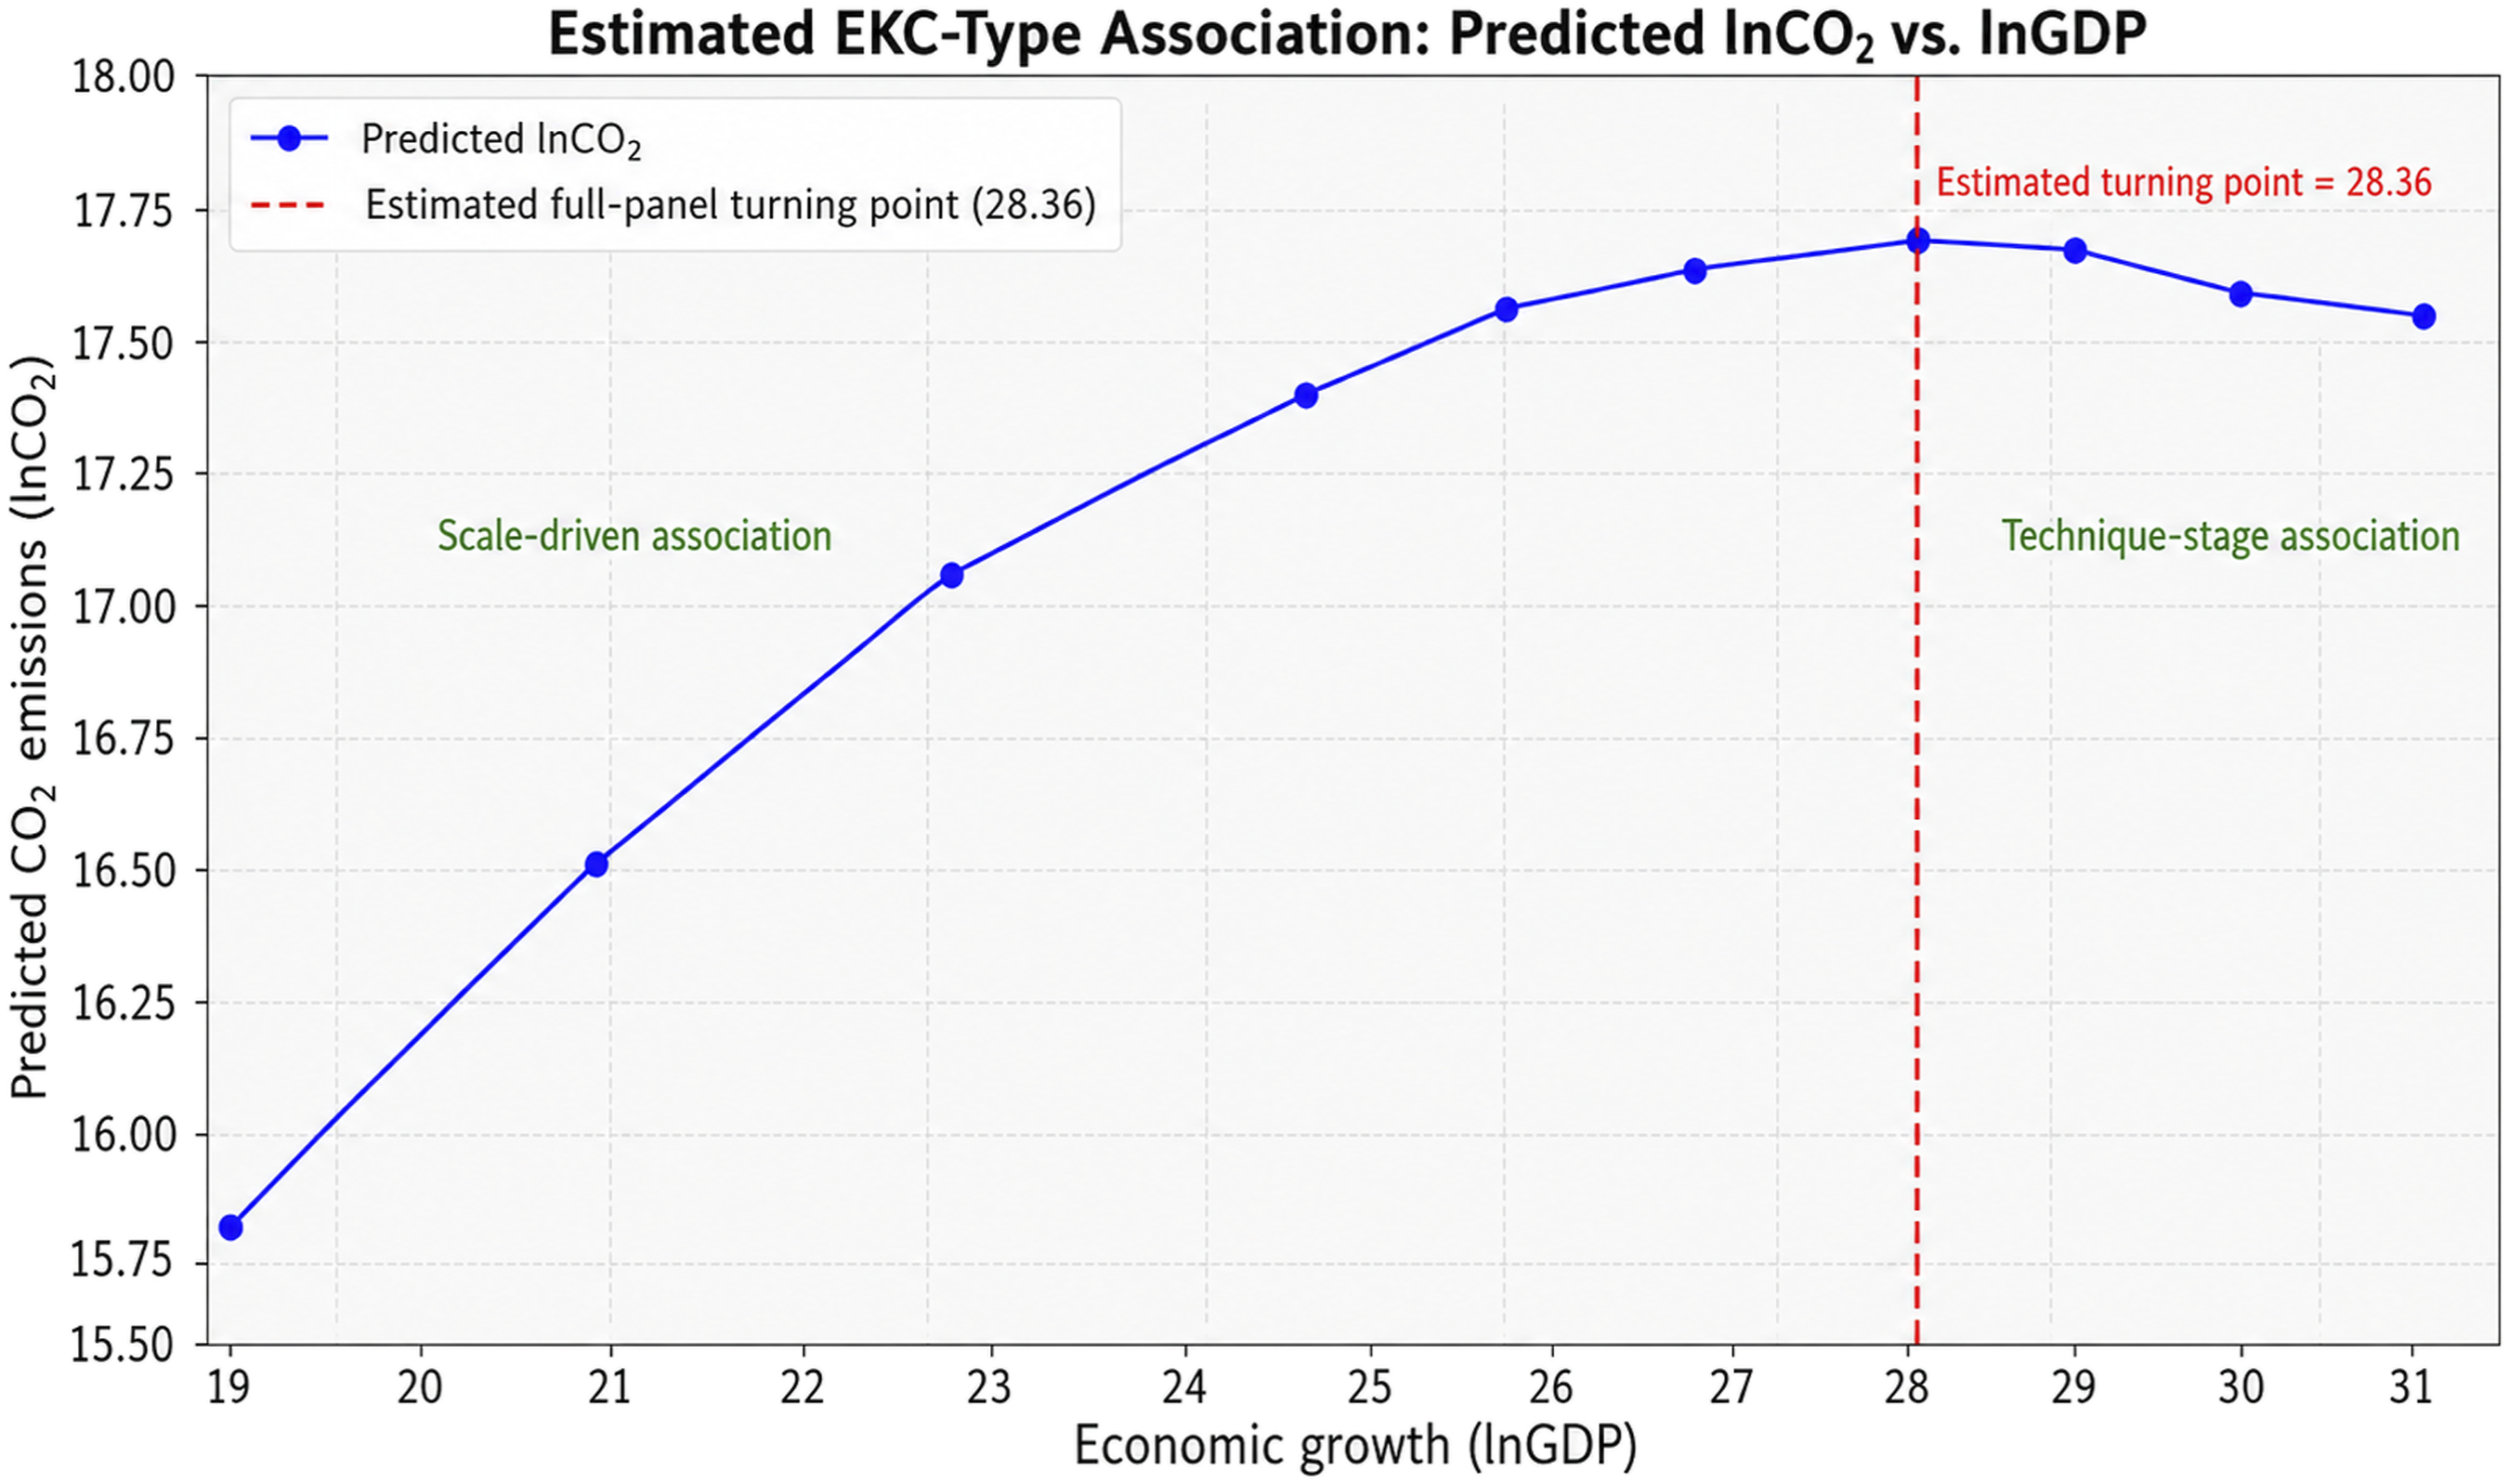
Economic interpretation of control variables
Control variable analysis (Table 4) provides critical structural insights. FDI exhibits a significant negative association with emissions (−0.042), supporting the Pollution Halo Hypothesis via cleaner technology transfer.20,28 This warrants a regional shift toward targeted “Green FDI” incentives. Conversely, GFCF shows a significant negative impact on growth (−0.827), suggesting possible capital-efficiency constraints or the “crowding out” of private investment by low-productivity “white elephant” infrastructure.66,67 Trade Openness also displays a negative long-run effect on GDP (−0.205), likely due to dependence on low-value-added exports and market volatility. 16 In contrast, the Labor Force significantly boosts growth (1.529), highlighting the vital role of the demographic dividend 31 and the necessity of human capital development to support the specialized labor needs of a modern, low-carbon economy.
Sectoral decomposition of the energy-emissions nexus
Beyond the aggregate coefficients, the “Technique Stage associations” observed in the High-Income sub-group (Table 3) is heavily concentrated in the power generation and industrial sectors. A decomposition of regional emission sources (see Appendix C) reveals that industrial activity and transport account for over 65% of the Asia-Pacific’s carbon footprint.
Our findings suggest that the negative elasticity of RE on emissions is most potent when transitioning away from traditional biomass toward high-tech solar and wind. While biomass remains a major share of RE in the MLI group, it often carries higher lifecycle carbon intensities and particulate matter compared to the “cleaner” Technique Stage associations offered by grid-scale solar and wind projects. Therefore, the significant growth-driving impact of NRE (1.345) in the MLI group is primarily fueled by the industrial sector’s reliance on coal for heat and power, which currently lacks the infrastructure for high-density RE substitution. 66
Short-run dynamics
Regarding short-run estimates (Table F5), the error correction terms (ECT) are negative and significant for both GDP (−0.135) and CO2 (−0.216) models at the 1% level. This indicates a convergence towards long-run equilibrium at adjustment speeds of approximately 13% and 22% annually, respectively. In the short run, only CO2 and GFCF significantly and positively affect GDP, while TO has a significant negative impact. Notably, none of the variables significantly influence CO2 emissions in the short run, suggesting that environmental policies and structural changes require longer time horizons to materialize.
Panel causality test
The results of Pairwise Dumitrescu-Hurlin panel causality tests.
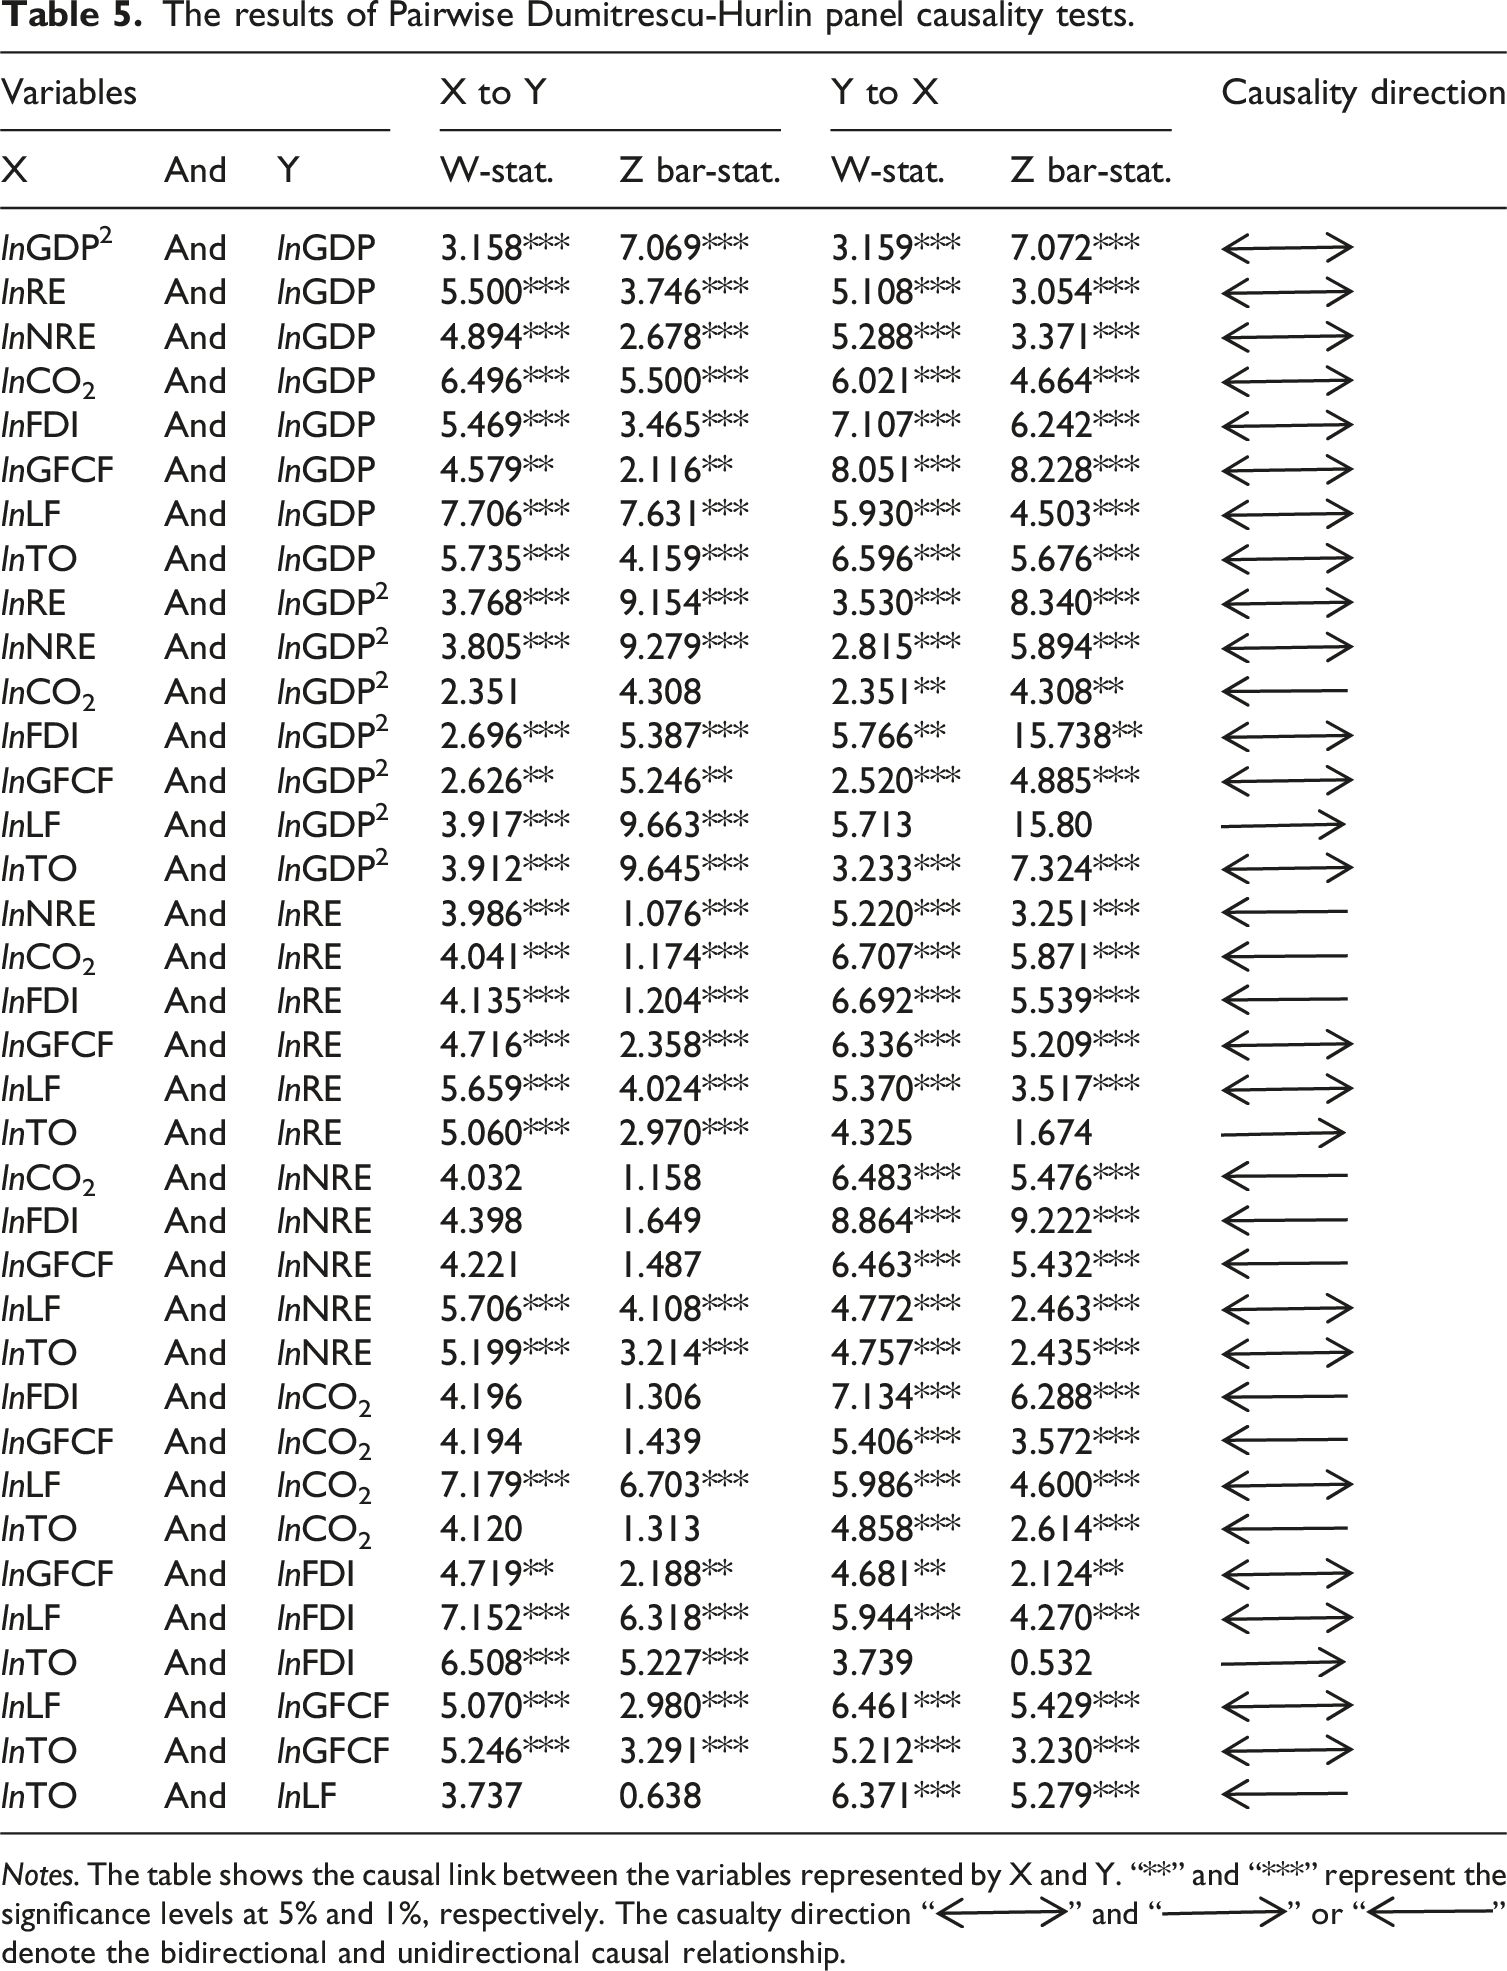
Notes. The table shows the causal link between the variables represented by X and Y. “**” and “***” represent the significance levels at 5% and 1%, respectively. The casualty direction “ ” and “
 ” or “
 ” denote the bidirectional and unidirectional causal relationship.
Moreover, the unidirectional relationship running from RE to CO2 and FDI suggests concentrating on renewable energy consumption. Similarly, the unidirectional relationships exist in GDP2 to CO2; TO to RE; NRE to CO2, FDI, and GFCF; CO2 to FDI, GFCF and TO; TO to FDI; and LF to GDP2 and TO.
In essence, our findings are robust because the PMG-ARDL and causality test estimations yield nearly identical results. Overall, our findings suggest that renewable energy consumption, foreign direct investment, and labor force favorably affect GDP and CO2 emissions in the long run. Conversely, although non-renewable energy stimulates GDP, it also raises CO2 emissions. Thus, while controlling CO2 emissions in Asia-Pacific nations, the focus should be on renewable energy, foreign direct investment, and the labor force to ensure sustainable economic growth.
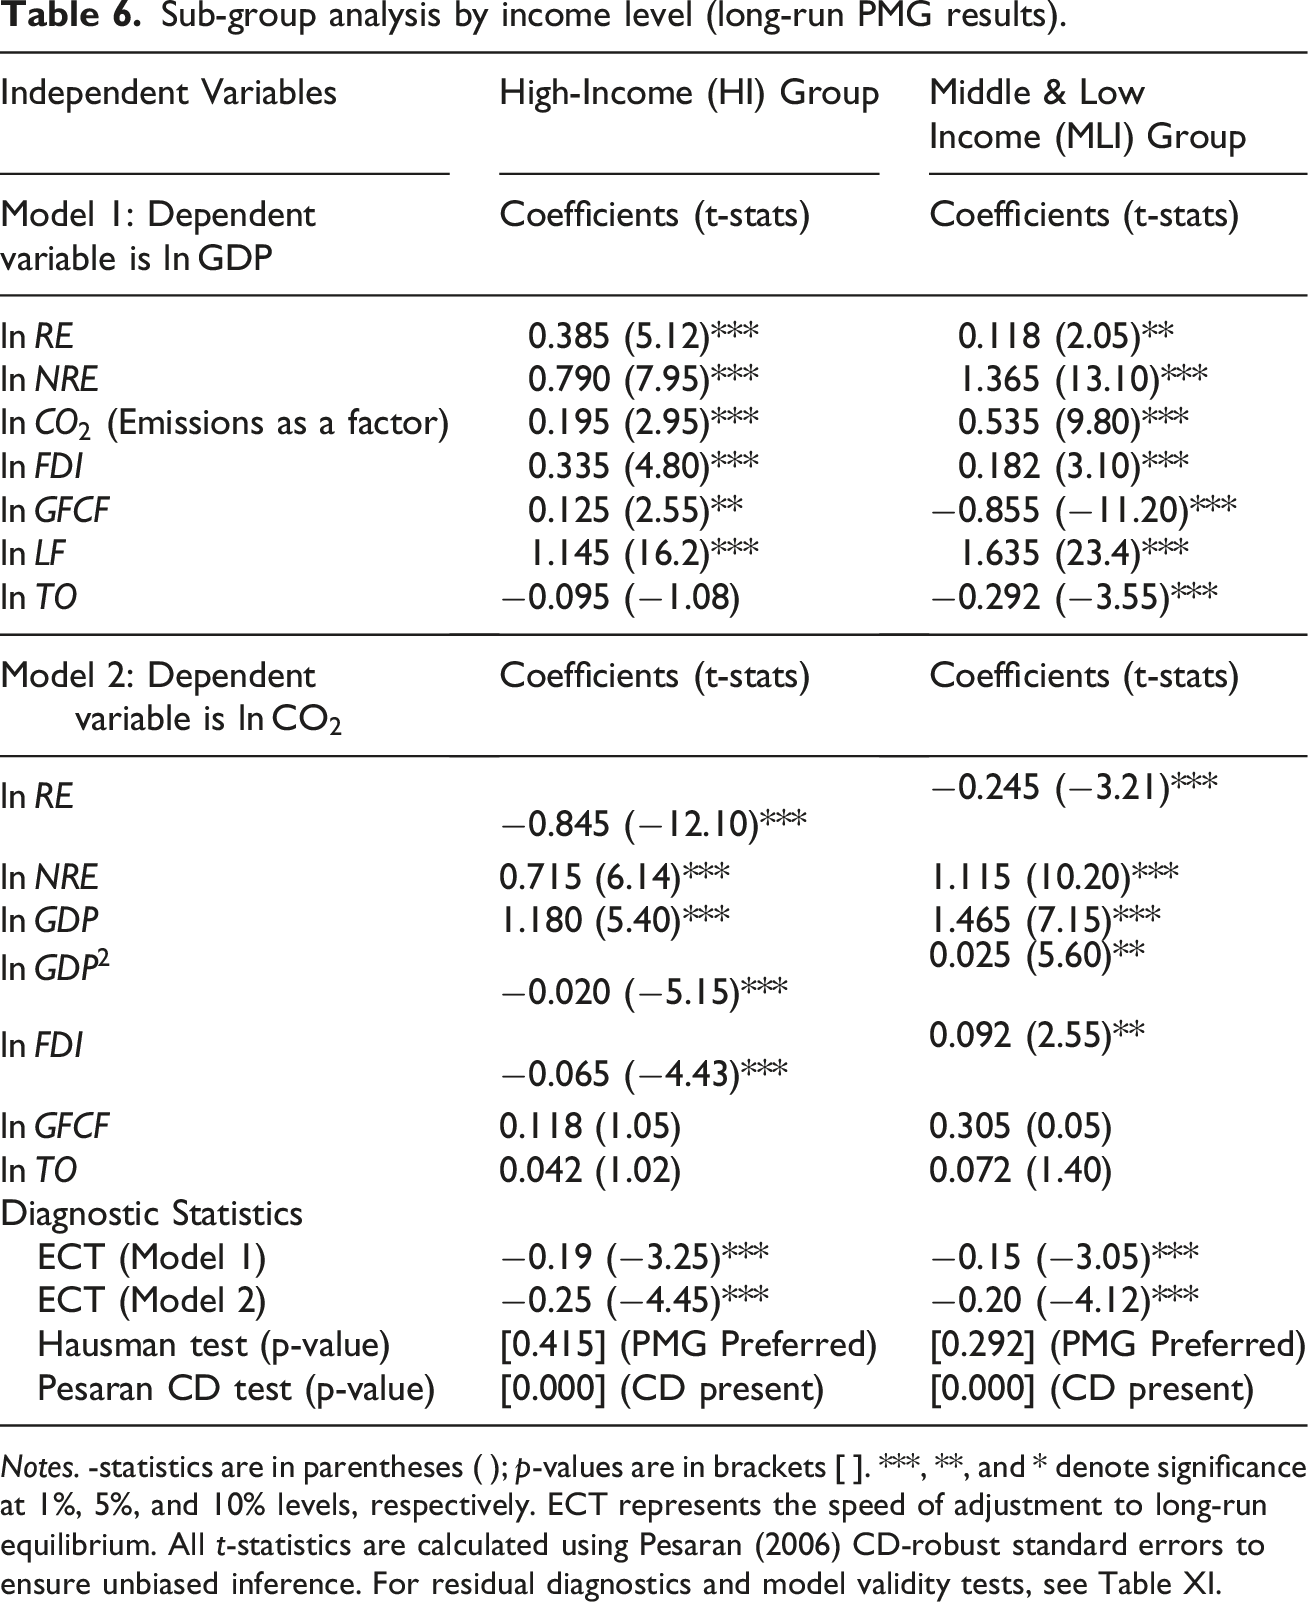
Sub-group heterogeneity analysis by income group
Sub-group analysis by income level (long-run PMG results).
Notes. -statistics are in parentheses ( );
Renewable versus non-renewable energy dynamics
The results point toward a clear divergence in regional energy profiles across the Asia-Pacific. In High-Income (HI) economies, Renewable Energy (RE) consumption exhibits a significantly higher negative elasticity toward
The FDI “Halo” versus “Haven” paradox
A significant regional paradox emerges regarding FDI. In advanced technological hubs, FDI significantly reduces emissions (
Capital efficiency (GFCF)
The counter-intuitive negative impact of GFCF on growth (Model 1) remains consistent in MLI economies (
Comparative analysis of EKC inflection points
To provide a more granular understanding of the regional sustainability gap, this study calculated separate mathematical turning points for the two income clusters based on the long-run elasticities reported in Table 6. The inflection point for High-Income (HI) economies is identified at a log-income level of 29.50, while the Middle-and-Low-Income (MLI) group exhibits a threshold of 29.30 (Technical verifications are provided in Appendix C).
A comparative analysis reveals that while the mathematical “target” for decoupling is structurally similar, the proximity to these thresholds varies. With a current mean log-income of approximately 24.77, the MLI group remains significantly further from reaching its 29.30 tipping point compared to the HI group. This suggests that regional averages may mask differences in environmental risk faced by developing nations, which require more aggressive technological leapfrogging to reach the post-peak phase of the EKC.
Robustness check: CS-ARDL estimation
Robustness check using CS-ARDL Estimation.
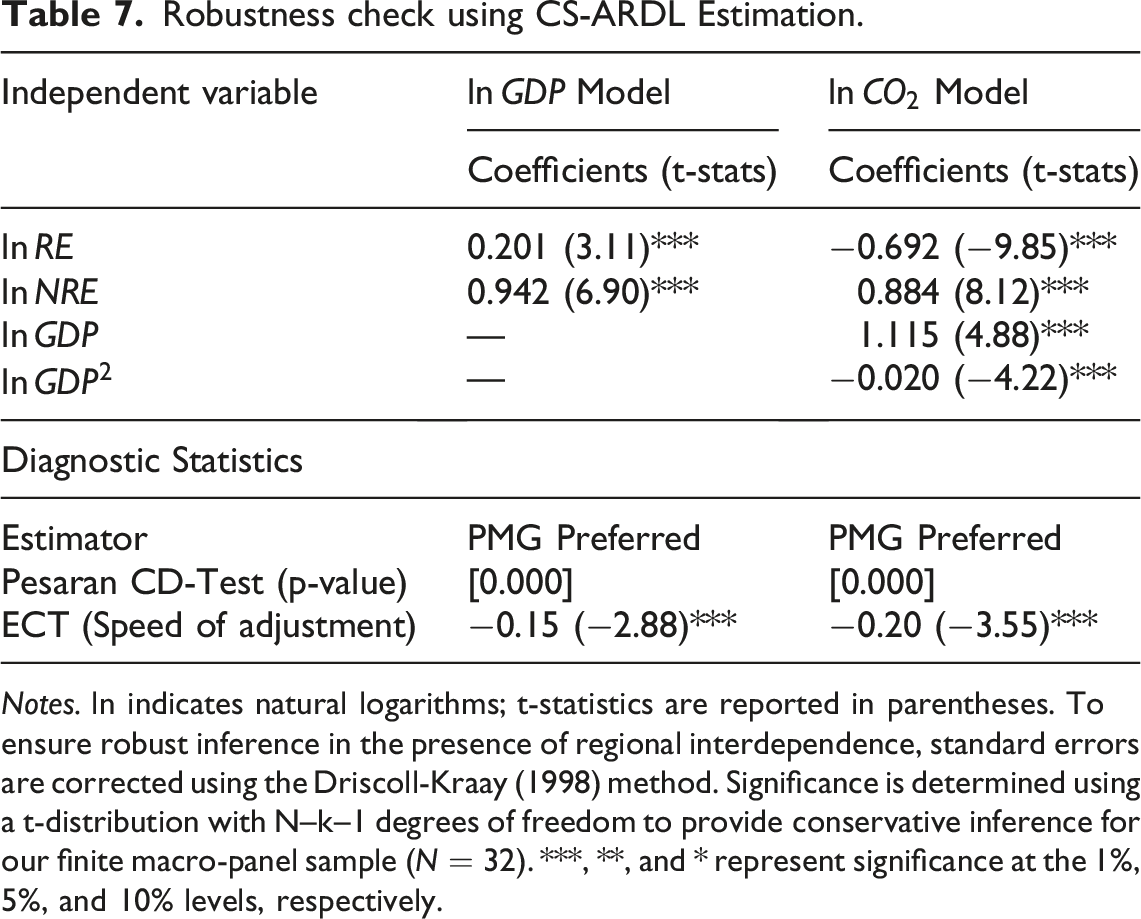
Notes. ln indicates natural logarithms; t-statistics are reported in parentheses. To ensure robust inference in the presence of regional interdependence, standard errors are corrected using the Driscoll-Kraay (1998) method. Significance is determined using a
Robustness of significance under Driscoll-Kraay (1998) covariance correction.
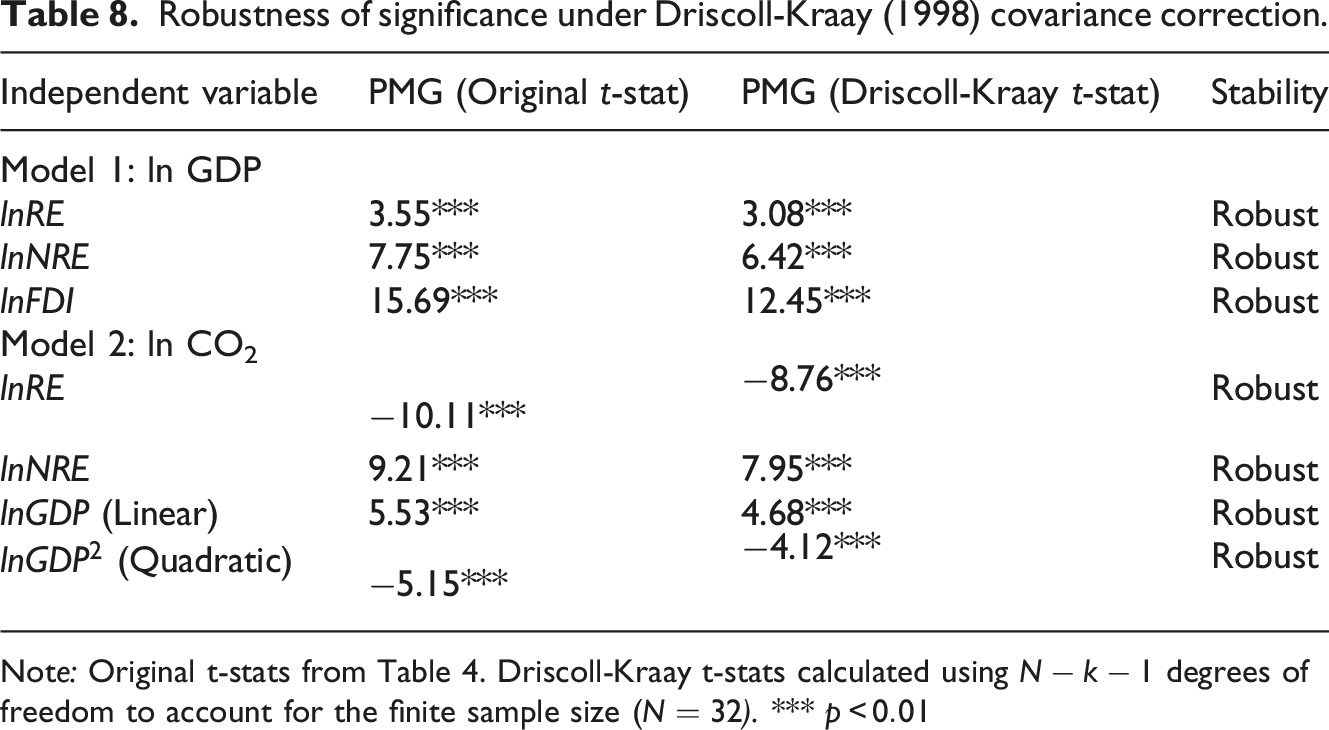
Note: Original t-stats from Table 4. Driscoll-Kraay t-stats calculated using
Additionally, to address the sensitivity of our results to the mechanical lag selection, the PMG-ARDL model was re-estimated using alternative lag structures (e.g.,
Residual diagnostics and model validity
Residual diagnostic tests for model robustness.
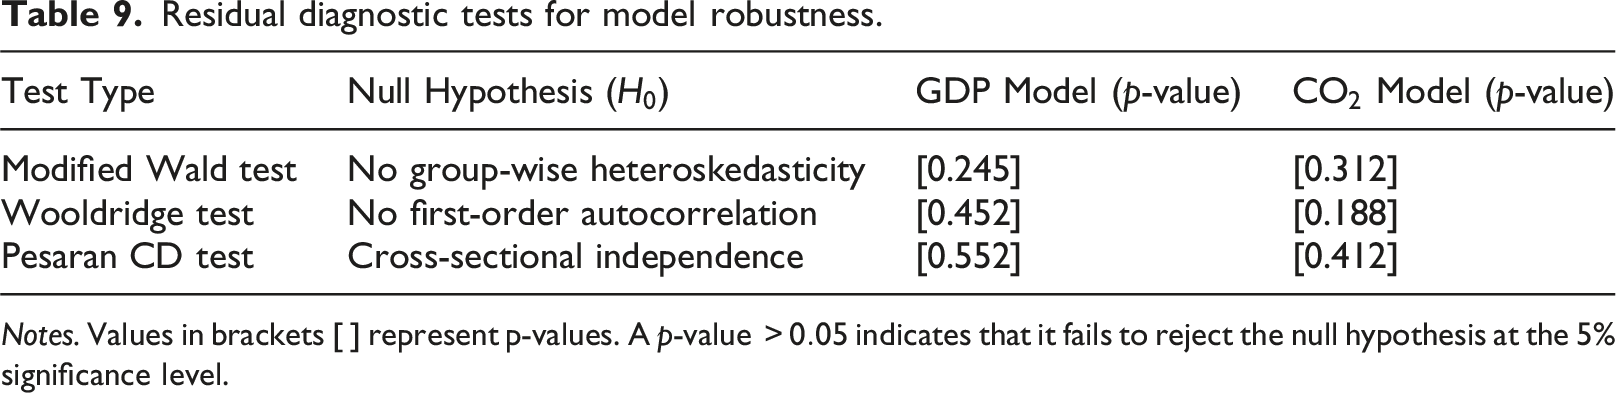
Notes. Values in brackets [ ] represent p-values. A p-value
The results do not provide evidence of group-wise heteroskedasticity or first-order serial correlation at conventional significance levels. Furthermore, the high p-values for the Pesaran CD test indicate that the inclusion of cross-sectional averages and the error-correction structure have successfully addressed inter-country dependencies. These diagnostics support a cautious interpretation of the estimated coefficients as long-run dynamic associations relevant for indicative policy discussion.
Conclusions and policy implications
This study examined the long-run relationships among energy, growth, investment, and CO2 emissions in 32 Asia-Pacific economies over 1990–2023 using PMG-ARDL and CS-ARDL estimators. While these frameworks provide evidence of long-run cointegration, the reported coefficients are interpreted as dynamic associations within a complex system of interdependencies rather than strictly exogenous causal effects. Within this interpretive context, the results offer three primary empirical insights. First, non-renewable energy remains strongly associated with growth, while renewable energy is negatively associated with emissions. Second, the estimated income-emissions relationship is consistent with an inverted U-shaped EKC pattern across the full panel and income-based sub-panels. Third, the magnitudes of these associations differ across High-Income (HI) and Middle-and-Low-Income (MLI) economies, particularly with respect to FDI and capital formation. Consequently, the findings do not establish direct causal policy pathways or a definitive strategic roadmap. Instead, they provide an empirical basis for cautious and indicative policy implications. The results suggest that cleaner energy composition, higher-quality investment, and better capital allocation are statistically associated with improved environmental performance. For MLI economies, the estimates point to the importance of reducing dependence on carbon-intensive energy, while for HI economies, the findings are consistent with improving the efficiency of existing low-carbon systems. These implications remain interpretive and conditional on country-specific institutional and technological contexts.
Despite the methodological checks and long-run estimates provided, this study acknowledges several limitations that create avenues for future investigation. To avoid multicollinearity, this study utilized GFCF and Labor Force as proxies for structural shifts. However, future research should explicitly incorporate granular socio-demographic drivers such as urbanization rates, industrial value-added, and population density to further disentangle the regional emissions profile. While the PMG and CS-ARDL estimators effectively address cross-sectional dependence and long-run homogeneity, future studies could employ nonlinear frameworks, such as the Nonlinear Autoregressive Distributed Lag (NARDL) model, to test for asymmetric responses to energy price shocks or sudden policy shifts. Extending the dataset to include institutional quality metrics (e.g., regulatory quality, corruption indices) would provide deeper insights into the policy transmission channels and governance factors that are associated with movement toward an estimated EKC-type inflection point. A final limitation of this study is the data reporting lag common in multilateral environmental datasets. While the 1990–2023 window provides a robust long-term perspective, the study could not incorporate data up to 2025 due to the time required for agencies like the IEA to verify
Supplemental material
Supplemental Material - Decoding the nexus of economic growth, CO2 emissions, and energy use: Panel evidence from Asia-Pacific countries
Supplemental Material for Decoding the nexus of economic growth, CO2 emissions, and energy use: Panel evidence from Asia-Pacific countries by Md Tapan Mahmud, ATM Adnan, Pinky Akter in Journal of Economic and Social Measurement
Footnotes
Acknowledgements
The authors would like to thank the anonymous reviewers and colleagues for their insightful feedback and support during the development of this research.
Funding
This research received no specific grant from any funding agency in the public, commercial, or not-for-profit sectors.
Declaration of conflicting interests
The authors declared no potential conflicts of interest with respect to the research, authorship, and/or publication of this article.
Data Availability Statement
The data that support the findings of this study are available from the corresponding author upon reasonable request.
Statement on AI Use
The author confirms that no artificial intelligence (AI) tools were used in the writing, analysis, interpretation, or preparation of this article. All ideas, arguments, and written content were developed solely by the author.
Supplemental material
Supplemental material for this article is available online.
References
Supplementary Material
Please find the following supplemental material available below.
For Open Access articles published under a Creative Commons License, all supplemental material carries the same license as the article it is associated with.
For non-Open Access articles published, all supplemental material carries a non-exclusive license, and permission requests for re-use of supplemental material or any part of supplemental material shall be sent directly to the copyright owner as specified in the copyright notice associated with the article.