
Abstract
The purpose of this study was to investigate psychometric properties of the Children’s Depression Inventory within a nonclinical and longitudinal sample (8th and 12th grades). Using the Rasch rating scale, most items represented one dimension. There was adequate separation among items and no overlap between ranges of item difficulties with latent trait parameters.
The Children’s Depression Inventory (CDI; Kovacs, 1985, 1992) is one of the most widely used self-report instruments of depressive symptoms for children and adolescents. The instrument has undergone criticisms related to its use and assumptions; however, it remains among the most popular depression screeners in research and clinical applications (Carey, Faulstich, Gresham, Ruggiero, & Enyart, 1987; Curry & Craighead, 1993; Fristad, Emery, & Beck, 1997; Kamphaus & Frick, 1996). In research, the CDI is used to assess depressive symptoms in both clinical and community samples in clinical applications, and several studies cite its use as an effective screening tool for practice (Friedberg & McClure, 2002; Shafii & Shafii, 1992).
The widespread use of the CDI in clinical and research settings may imply that it is psychometrically sound. Several researchers, in fact, demonstrated acceptable test–retest reliability, internal consistency estimates, and adequate convergent and discriminant validity using classical test theory (CTT; Carey et al., 1987; Cole, Martin, Peeke, Henderson, & Harwell, 1998; Craighead, Curry, & Ilardi, 1995; Hodges, 1990; Kovacs, 1985, 1992; Saylor, Finch, Spirito, & Bennett, 1984; Smucker, Craighead, Craighead, & Green, 1986). Yet despite acceptable findings of reliability and validity, the overall psychometric properties of the CDI were not sufficiently addressed. Specifically, conflicting evidence exists regarding the dimensionality of the CDI.
Several researchers sought to clarify the factor structure of the CDI in both clinical and community samples of children and adolescents (Carey et al., 1987; Helsel & Matson, 1984; Hodges, Siegel, Mullins, & Griffin, 1983; Kovacs, 1992; Saylor et al., 1984; Weisz & Weiss, 1989), many of which have suffered significant methodological limitations, including small sample sizes. In the original development of the CDI instrument, Kovacs (1985, 1992) reported a five-factor structure. With regards to replicating the five factors using different samples, the literature remains uncertain. Most studies replicated three of the five factors—negative mood/dysphoria, low self-esteem, interpersonal problems, or externalizing/oppositional behavior (Cole, Hoffman, Tram, & Maxwell, 2000; Craighead, Smucker, Craighead, & Ilardi, 1998; Drucker & Greco-Vigorito, 2002). However, the remaining two from Kovacs (1985) original factors—ineffectiveness and anhedonia—were not replicated. Rather, several other factors also emerged as a result of using different data sets; that is, both the number and composition of the CDI factors reported varied substantially between studies, and certain items failed to load on any factor at all, indicating that perhaps a portion of items on the CDI are nonfunctional and could be excluded all together (Craighead et al., 1998). Some authors hypothesized that certain factors may correspond to specific patterns of symptoms and may be differentially related to diagnoses and correlates of depression while others proposed that differences in item content and factor loadings may be sample dependent (Steele et al., 2006). Garcia, Aluja, and Barrio (2008) also examined the factor structure using confirmatory factor analysis (CFA). According to Garcia et al. (2008), a model with five and six factors not only showed acceptable goodness-of-fit indices but also found evidence of a higher order factor.
In addition to multiple dimensions identified in the literature, the higher order factors were found to be highly correlated and do not necessarily explain substantial portions of variance. In particular, Weiss et al. (1991) identified five first-order factors that were highly correlated; their analysis involved varying rotation techniques in exploratory factor analysis (e.g., promax or oblique rotation in contrast to varimax rotation used in previous studies that assume a greater degree of correlation between factors). Using a similar technique, Craighead et al. (1998) also found multiple factors that were highly correlated. Given the high correlation between the first-order factors, both Weiss et al. (1991) and Craighead et al. (1998) evaluated second-order factors. In comparison with one second-order factor found by Weiss et al. (1991), two second-order factors emerged in Craighead et al. (1998), representing Internalizing and Externalizing constructs. These second-order factors were not only highly correlated (.55 and .65 for child and adolescent, respectively) but also potentially compromise the validity of the CDI. Externalizing disorders are comorbid with some depressed individuals but not necessarily a pure component of depression (Craighead et al., 1998).
Given the results from these previous studies, a single higher order factor may best represent the structure of the CDI. Evidence supporting such possibility can be attributed to studies based on discriminant analyses that have indicated that accurate classification of adolescents diagnosed with major depression were derived by either using the total CDI score (i.e., ignoring factor structure) or by using the “dysphoric/negative mood” factor and no other subscale or factor scores (Craighead et al., 1995). As such, further investigation that can identify a stable factor structure that is not sample dependent may therefore change previous clinical and research implications and refine understanding of the dimensionality governing the CDI instrument.
Despite inconsistency in the factor structure across studies and the use of potentially unstable factors to inform normative data on various groups, CDI remains widely used for research and practical purposes, and this warrants a comprehensive investigation into CDI’s factor structure to overcome limitation due to sample dependency that are present in many of previous studies. In light of these developments in the literature, modern test theory—item response theory (IRT)—may offer more precise inferences based on sample independent techniques that contrasts with sample dependent approaches that have relied on CTT. In many ways, IRT continues to replace CTT as the dominant theoretical framework used in psychological measurement. The use of IRT allows not only an investigation into the dimensionality of the CDI but also provides the ability to identify poorly functioning items and to improve the efficiency and utility of the scale for any population that is independent of the sample characteristics.
Advantages of Item Response Theory
CTT is based on the assumption that participants have both an observed and true score, where the observed score is an estimate based on the true score and measurement error (Lord & Novick, 1968). Although CTT is easily interpretable and does not require stringent assumptions, the true score in CTT depends on both the content of the instrument and sample studied, and is therefore not an absolute characteristic of the participants and items in the instruments. In other words, the scores of participants possessing varying degrees of the trait in question (depression, in this case) would reflect the interaction of their level of the trait and the characteristics, such as difficulty and discrimination of the items on the measure, which undoubtedly would be influenced by sample characteristics and possibly by other contextual variables (Crocker & Algina, 1986; Hambleton & Swaminathan, 1985). Under these circumstances, it is difficult to compare results between groups and is impossible to compare results between different instruments, even if the instruments were operationalized similarly to assess depression. Techniques to correct for measurement error are therefore fundamental to the reliable interpretation of instruments derived from CTT.
The power of IRT, if the model the fits the data, is that it overcomes two major shortcomings of CTT—that is, lack of examinee and item invariance. Specifically, in IRT, the ability or degree to which a participant has the trait in question is independent of the characteristics of items in the instrument (i.e., examinee invariance is exhibited), and the items’ descriptors do not depend on the sample of participants administered the scale (i.e., item invariance is exhibited), which is a condition for generalizability. If, in fact, the instrument is affected or varies based on samples and/or context, then the validity of scores from the instrument is clearly untenable.
The relationship between the trait level of the participant and the probability of endorsing an item can be modeled in different ways under IRT, depending on the nature of the instrument. Among the IRT models, the Rasch model (Rasch, 1960) has the fewest parameters: a person trait or ability parameter and an item difficulty parameter, which estimates the degree to which the trait is measured by an item. Item-fit indices are also derived to determine which items measure the unidimensional construct they are intended to measure. Trait scores and standard error estimates, under the Rasch model (Rasch, 1960), are not reliant on population distributions, therefore the item properties can be estimated even if the sample is not representative, in contrast to CTT approaches. Person trait and item difficulty estimates are derived from raw scores and are placed on the logit scale, and the applicability of the measure for the sample at hand is determined by degree of overlap between the trait and item-difficulty distributions on the logit scale. The desired degree of sensitivity and difficulty will vary depending on the scale’s purpose. For example, if the measure is meant to be very sensitive, a high degree of overlap between trait level and item difficulty distributions would be expected. Conversely, if there is little overlap, the measure would be good for detecting a rare condition (e.g., disease symptoms, very high intelligence, or other attributes).
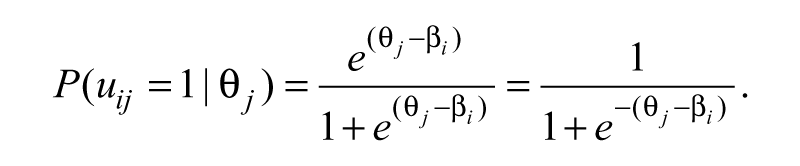
For dichotomously scored items, the Rasch model (Rasch, 1960), also referred to as the one-parameter logistic model, is used to specify the conditional probability that a person j endorses item i depending on the person’s latent trait or ability score, θ j , and the item’s difficulty level, β i :
The rating scale model (RSM; Andrich, 1978), which is an extension of the Rasch model (Rasch, 1960) generalized to polytomous responses, uses a common set of category intersection parameters, δ i , for all items, thus assuming that the number of response categories are equal across items (i.e., all items have the same response format). The item category response function in the RSM is given by following:
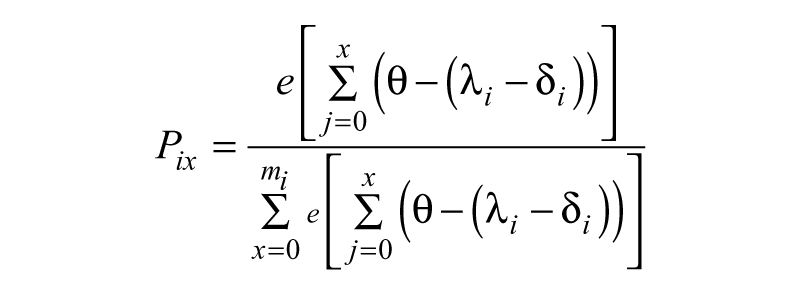
for items with m
i
+ 1 response categories (i.e., item is scored x = 0, 1, 2, . . ., m
i
) and with a constraint,
Study Goals
The CDI continues to be prominent in research and practice despite the lack of consensus among researchers with regard to its structure and dimensionality. As such, this study investigates psychometric properties of the CDI using more rigorous techniques than have historically been used. This study employed an IRT approach, specifically the Rasch model to address concerns regarding the dimensionality as well as item characteristics in the CDI. Dimensionality was assessed to examine whether the items actually represent multiple dimensions or the unidimensional construct of general depression/dysphoria, by investigating any misfitting items that hinder from supporting unidimensionality. Characteristics of the items were analyzed by evaluating the use of three-response categories in CDI and by investigating the appropriateness of the CDI item difficulties for the samples considered. Within-subject comparisons were made between 8th grade (early adolescence) and 12th grade (late adolescence), yielding greater inferential power than a between-subjects design, given the reduction in extraneous sources of random error when examining the difference between the two age groups.
Method
Overview of Project and Sample Selection
The present study used data collected from a larger study on vulnerability and competence among suburban youth. Participants were recruited from suburban middle and high schools in the Northeastern United States, accommodating students from three demographically similar towns. A school (first unit sampled) was selected based on its location and other demographic characteristics as one that represented the population of interest to the larger study, examining risk and vulnerability among affluent youth from childhood through late adolescence (6th to 12th grades).
Within the school, participants were volunteers via active parental and student consent. Letters explaining the study were sent home to all 6th-grade students from which approximately 94% agreed to participate. At each time point following the initial collection, new students were eligible to participate. The total n across both time points was 202. Approximately, 88% of the participants were White while 12% were of minority racial/ethnic status (Asian, Hispanic, Black, Biracial). Males made up 51% of the sample. Approximately, 82% of the mothers and 78% of the fathers in this sample had either college or postgraduate educations, according to the participants’ self-report.
Sample and Measure
The subsample used for this study was drawn to represent childhood and adolescence (8th and 12th grades) to investigate the developmental appropriateness of the CDI items, among other psychometric properties. The average age for both girls and boys among the 8th graders were 13.6 years (SD = 0.52) with a range of 13 to 15 years. The sample size was 314 in the 8th grade and 246 in the 12th grade. The subsample demographic characteristics were exactly the same as those described above, regarding the overall sample.
The CDI consists of 27 items, each having a three-category response scale of 0, 1, and 2. Overall, total scores of depressive symptomology range from 0 to 54, with a total score of 54 indicating the most severe measure of depression. Administration of the CDI was repeated for subjects from the 6th to the 12th grades. Participants were asked to endorse the statement that best describes their behavior or characterizes their emotions with regard to a specific symptom of depression. For example, a participant would endorse whether, in the past 2 weeks, they felt sad once in a while, many times, or all the time.
Analysis
The RSM was used to analyze the CDI in the present study, as personality and attitudinal scales that use common anchors are often analyzed using the RSM. For such scales, relative difficulties of steps within items are not expected to change (Embretson & Reise, 2000), and psychological distances between categories are the same for all items (Fox & Jones, 1998). Since the CDI was constructed without the intention of disordered thresholds, equal-ordered thresholds for all items across individuals can be assumed. Furthermore, given the sample size and the use of 3-point response categories in the CDI, the RSM was the most estimable IRT model to use (Wang & Chen, 2005). Other IRT models with additional parameters require larger sample sizes to ensure unbiased parameter estimates. As such, the nature of the data resulting from the CDI, the number of response categories, and the limited sample size provided a rationale for conducting the analysis using the RSM.
The CDI was analyzed for adherence to the (a) unidimensionality assumption, (b) adequacy of the response scale, (c) the appropriateness of the scale for the study samples, and (d) reliability. Together, these analyses would provide evidence to refine the understanding of psychometric properties of the CDI. Psychometric analyses were run separately for each grades’ samples. The computer program, WINSTEPS (Linacre, 2005b), was used to conduct the Rasch analysis with its default setting. Items 2, 5, 7, 8, 10, 11, 13, 15, 16, 18, 21, 24, and 25 were reverse coded before analysis. Unlike traditional procedures that remove incomplete cases from the analysis, either by deleting cases or by imputation, missing data are handled differently for Rasch-type models; parameter estimates on item and respondent characteristics can be estimable using the joint maximum likelihood estimation procedure. One of the key results of Rasch-type models is the ability to derive sufficient statistics based on marginal raw scores. This allows the computation of an expected value for every observation regardless of missing data when item and respondent estimates are known (see Linacre, 2009, p. 449). Thus, no deletion or imputation for the treatment of missing data was necessary.
Test of unidimensionality
The assumption of unidimensionality, which indicates only one dimension is being measured by instrument’s items, was investigated for each sample’s CDI scale using (a) item-fit mean square (MNSQ), (b) point measure (PTMEA) correlation and item discrimination, and (c) Rasch residual–based principal components analysis (PCA). Item-fit MNSQ values were calculated to determine how well each item represented the single underlying dimension of the CDI. MNSQ was calculated by dividing the chi-squared statistic by its degrees of freedom, where item MNSQ values of 1.0 are ideal in the Rasch model. Items with values greater than 1.0 are considered to underfit, indicating random error or other sources of variance in the data. Items with values less than 1.0 are viewed as overfit, indicating that the model predicts the data too well, thereby causing inflated summary statistics (Linacre, 2005a).
PTMEA correlation and the item discrimination were also examined to determine if items on the CDI function as intended. The PTMEA correlation ranges from −1 to 1, with negative values indicating items that are improperly scored or do not function as intended. Item discrimination estimates lower than 1.0 indicate items that are underdiscriminating, implying weak differentiation from one level to the next (Linacre, 2005a).
To further assess validity of the CDI, we conducted Rasch residual–based PCA to investigate the dimensionality of the CDI for both the 8th- and 12th- grade samples. To determine if there are other possible dimensions in the scale, the PCA decomposes the item correlation matrix based on standardized residuals or differences between what is observed and what is predicted by the Rasch model (Linacre, 2005a). The Rasch dimension is the first factor of the PCA, and a variance of 60% or greater accounted for by this dimension is considered good (Linacre, 2005a). The second dimension of the residual-based PCA can also be considered the first contrast in the residuals. The variance of this dimension may suggest whether there are any patterns in the differences within the residuals large enough to suggest the existence of a second dimension. Little variance accounted for by the Rasch dimension, but significant amounts of variance within the contrast dimensions, indicates that the scale may be multidimensional.
Test of response category use
An analysis of rating-scale category use was conducted for the 8th- and 12th- grade samples of the CDI to determine whether respondents were adequately using each response category as intended. This was done in the Rasch model by examining the category-use statistics (i.e., category frequencies and average measures) and thresholds of each category. The average measure across categories is the empirical mean of the measures. In the Rasch model, this is represented as latent trait scores, which are modeled to produce the responses in each category (Linacre, 2005a). Average measures increase monotonically across categories since observations in higher categories are produced by higher means. Category thresholds are boundaries between categories, representing the measures where adjacent categories are equally probable, and should also increase monotonically.
Item difficulty
Person and items maps were created to visually illustrate how items of various difficulty levels overlap with various person–trait levels. The Rasch model estimates item difficulty parameters and person–trait levels in the same scale (logit form), which allows comparison of the two metrics. The person and item maps present an illustration of whether the subscales’ item difficulties were appropriate for the sample of persons; an overlap on the map between the item difficulty parameters and the person–latent trait levels would imply that the use of the CDI is appropriate for the two samples considered.
Reliability and separation index
Person separation reliability (Wright & Masters, 1982) is a measure of reliability used for the Rasch model. It measures the degree to which the scale differentiates persons on the measured variables and is equivalent to the Cronbach’s alpha or KR-20. Person reliability is estimated in WINSTEPS by taking the ratio of the “true person variance” to the “observed person variance” (Linacre, 2005a, p. 465); values range from 0 to 1, and a value greater than or equal to .80 is considered acceptable (Fox & Jones, 1998). A second measure of reliability, item separation reliability, was calculated for the two samples taking the CDI. Item separation reliability measures the degree to which the relative difficulties of items are differentiated along the measured variable. This is calculated in WINSTEPS by dividing true item variance by the observed item variance (Fox & Jones, 1998). The range of values for the item separation reliability also ranges from 0 to 1, similar to person reliability estimates.
In addition to the reliability indices, person and item separation index estimates were generated for both samples. Separation indices estimate the spread of items, or persons, on the measured variables. Separation indices are estimated in WINSTEPS by the ratio of the person-, or item-, adjusted standard deviation to the RMSE, the error standard deviation (Linacre, 2005a). Separation indices provide a measure of separation in standard error units, with adequate separation in persons, items, or both, measured with an estimate of at least 2.
Results
Dimensionality
In general, results from the RSM analyses provided support for a unidimensional structure in both the 8th and 12th grades. Evidence to highlight this was derived from the item-fit MNSQ, PTMEA correlation and item discrimination, and Rasch residual–based PCA.
Item-fit mean square (MNSQ)
Infit (weighted) and outfit (unweighted) MNSQ statistics were used to measure item fit on the 8th- and 12th-grade samples’ scales. Outfit statistics are outlier-sensitive fit statistics, which are sensitive to unexpected observations made by persons on items that are not targeted for their latent ability level (ones that are either relatively very easy or very hard for them) (Linacre, 2005a). Infit statistics are inlier- pattern-sensitive fit statistics that are sensitive to unexpected patterns of observations made by persons on items targeted for their ability level (Ibid). Items were considered misfit if MNSQ estimates were either less than 0.6 or greater than 1.4 (Linacre, 2005a; Wright, Linacre, Gustafen, & Martin-Lof, 1994). However, we consider items with infit and outfit MNSQ statistics within a range of 0.5 to 1.5 still acceptable for measure (Linacre, 2005a), if removing these items is detrimental to the properties of the measure. Low values of item MNSQ may indicate redundancy with other items whereas high values may represent a lack of homogeneity with other items in the subscale (Linacre, 2005a).
Table 1 contains the item-fit statistics for both samples. Items of the CDI had acceptable infit statistics either above 0.60 or below 1.4 for both the 8th- and 12th- grade samples, except for Item 18 (1.43) in the 8th-grade sample. These results suggest that there existed no redundant items or heterogeneity among items for either sample in the scale. In addition, Item 19 for both samples had outfit statistics greater than 1.40, suggesting a lack of homogeneity with other items on their subscales (1.63 and 1.54, respectively). Also, items for both samples had outfit statistics below .6, indicating redundancy among items in the scale. On the 8th grade, Items 3, 7, and 27 had outfit statistics of 0.56, 0.48, and 0.55, respectively while for the 12th grade, Items 7, 8, and 25 had outfit statistics of 0.44, 0.59, and 0.50, respectively, which is less than the 0.60 threshold. These items were considered for possible deletion from their respective CDI scale along with the investigation of other criteria, such as PTMEA correlation and discrimination, since their infit and outfit statistics indicate that they may be measuring different constructs from the other items or redundancy with other items in the scale. Therefore, items on the CDI may need to be considered for reevaluation of the CDI’s psychometric properties, after removing Items 18 and 19 that do not fit.
Item-Fit Statistics for 8th and 12th Grades
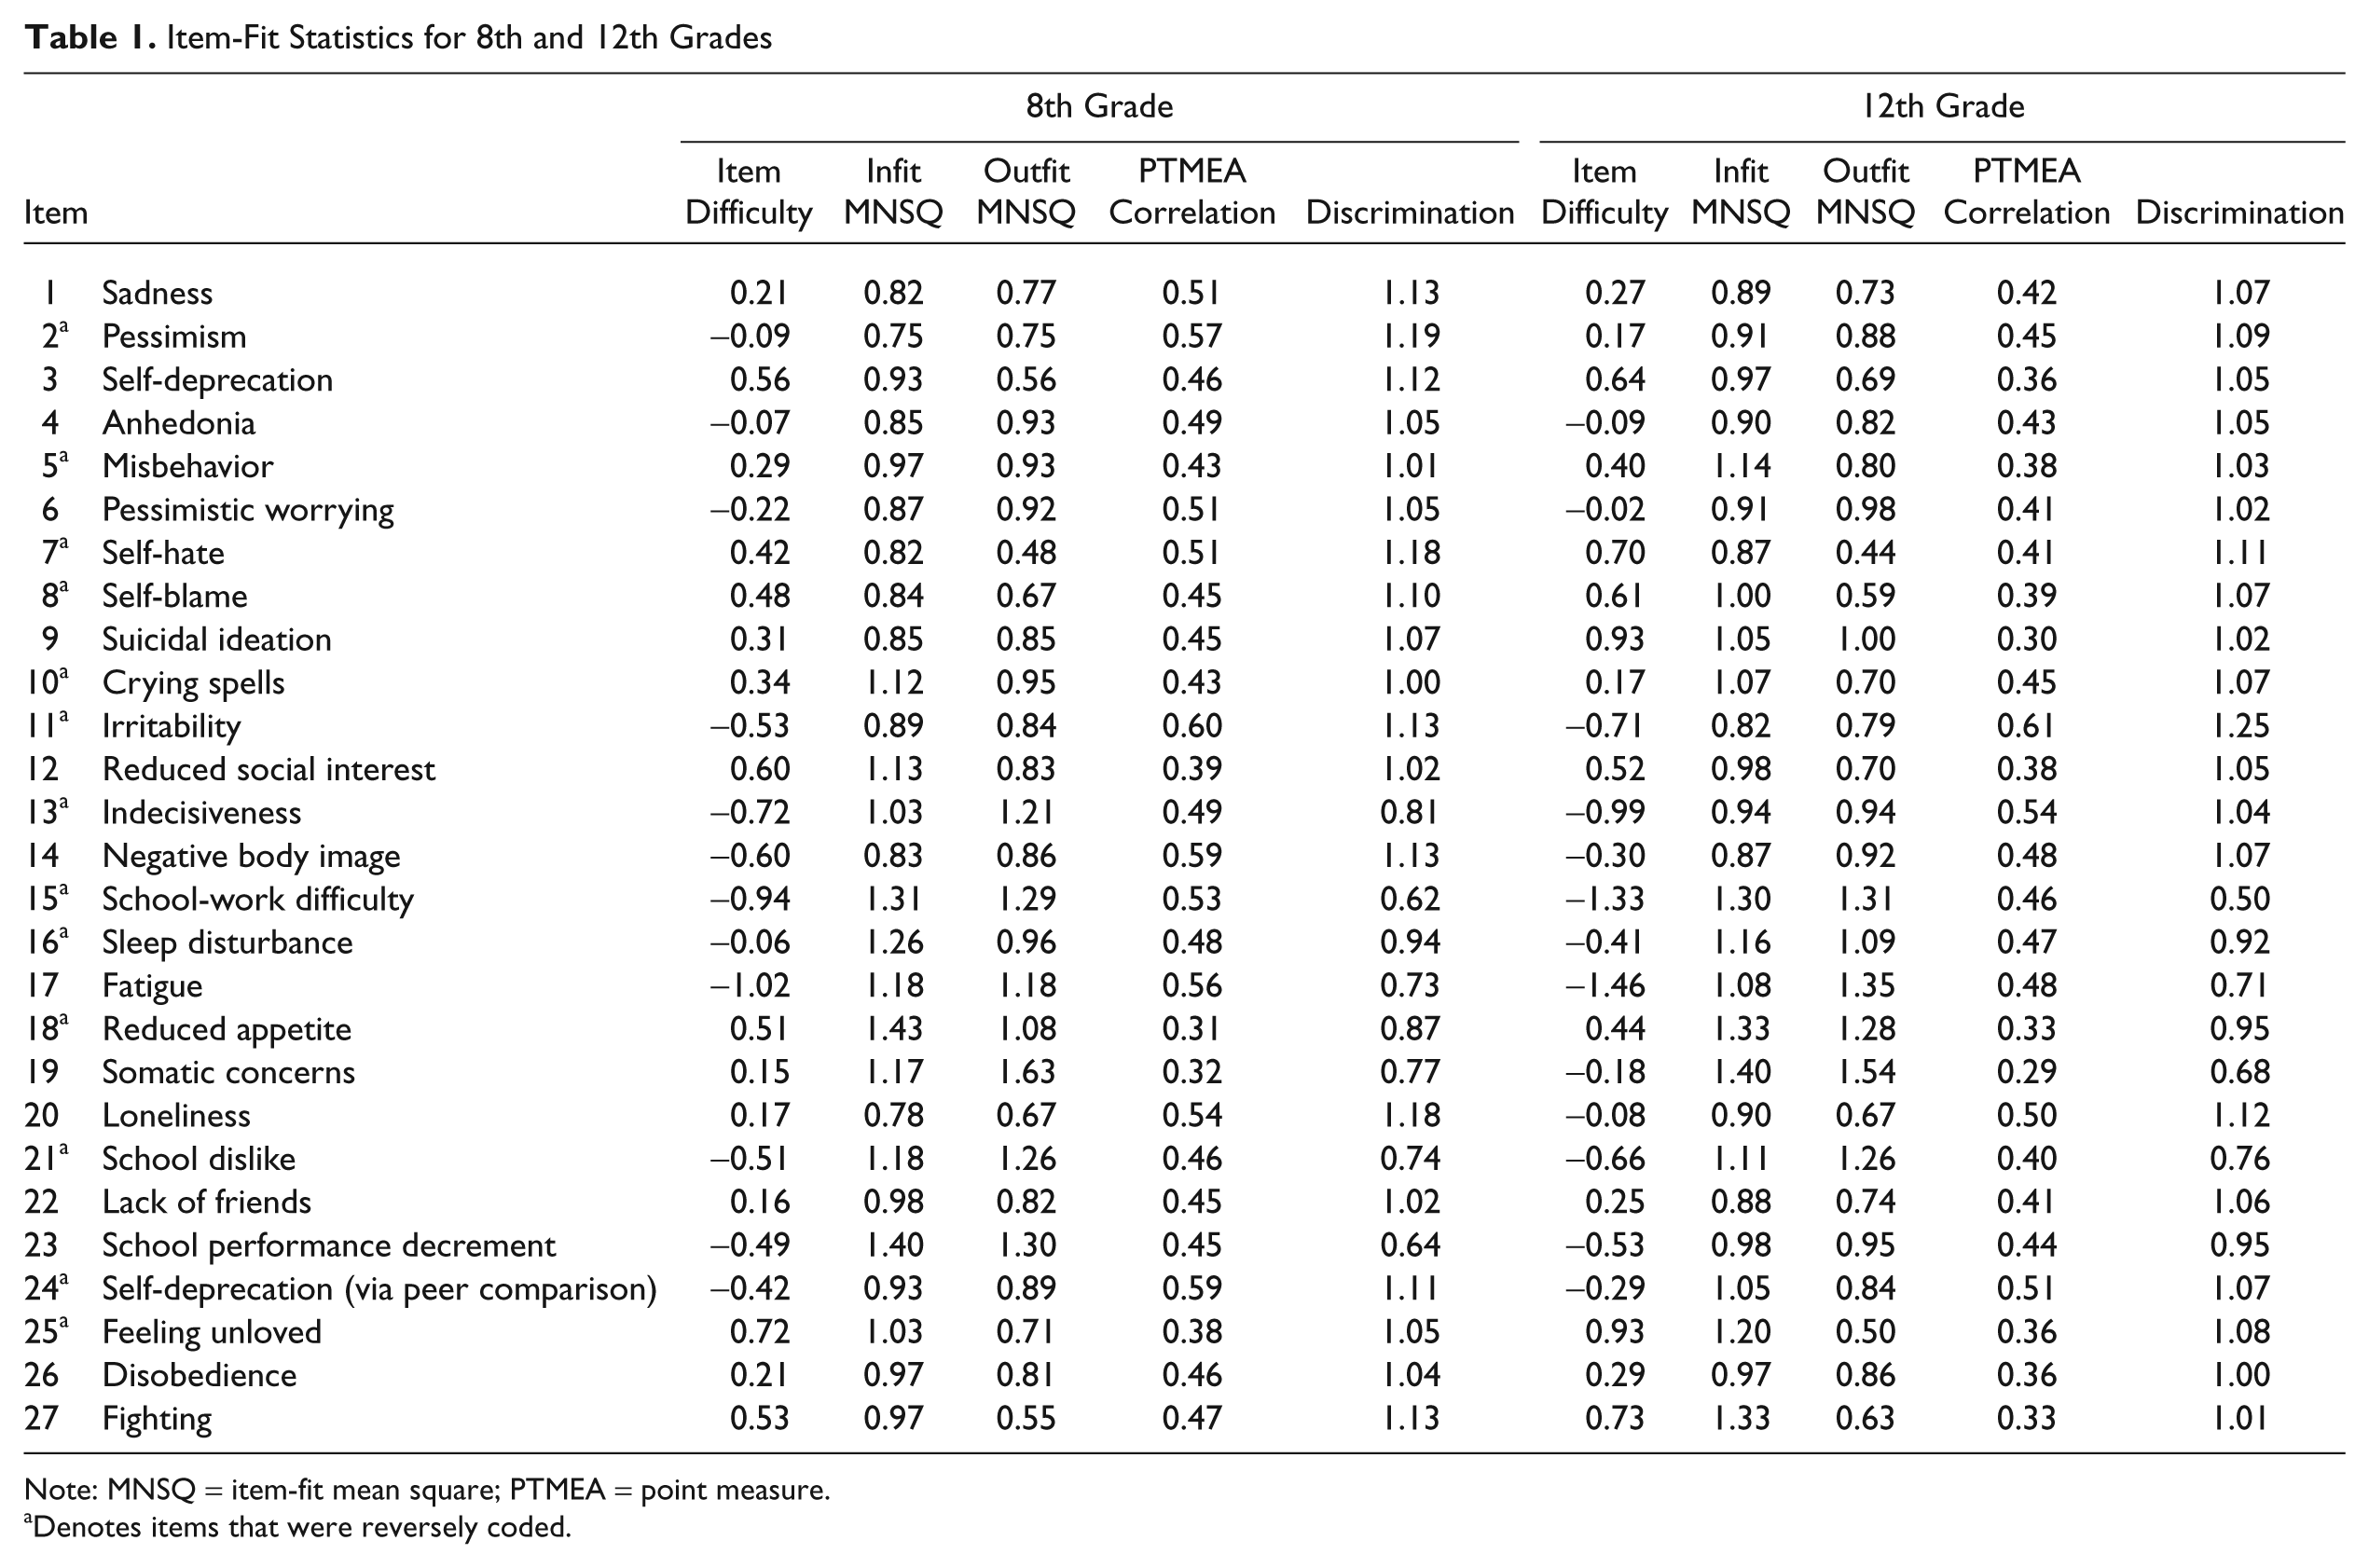
Note: MNSQ = item-fit mean square; PTMEA = point measure.
Denotes items that were reversely coded.
Point measure (PTMEA) correlation and the item discrimination
Most items on the CDI for both samples had positive and moderate to strong PTMEAs with good discrimination. Among items with poor infit and outfit statistics, Items 3, 7, and 27 in 8th grade and Items 7, 8, and 25 in 12th grade, the sample had positive and moderate PTMEAs and acceptable discrimination.
Rasch residual–based PCA
Results for the CDI PCA for the 8th-grade sample are found in Figure 1. In total, 54.7% of the variance was accounted for by the unidimensional model, which fell slightly below the desired 60%. The first contrast had an eigenvalue of 2.4 and accounted for 4.0% of the unmodeled data. These results suggest that the CDI scale for the 8th grade can be considered unidimensional, since the eigenvalue of the first construct had a value less than 3 and accounted for less than 5% of the unmodeled variance. Ten items (Items 3, 5, 8, 12, 15, 21, 23, 24, 26, and 27) comprise the first contrast. Of these 10 items, 4 (Items 12, 15, 21, and 23) had mean-square values greater than 1.0, which suggest that they may contradict the Rasch variable. The residual scree plot for the 8th-grade sample of the CDI was also examined to see if a second dimension was present. The scree plot did not have any clusters of items, which would suggest the presence of a secondary dimension (Bond & Fox, 2001). The lack of item clustering in the scree plot validates that the CDI is representing only one dimension.
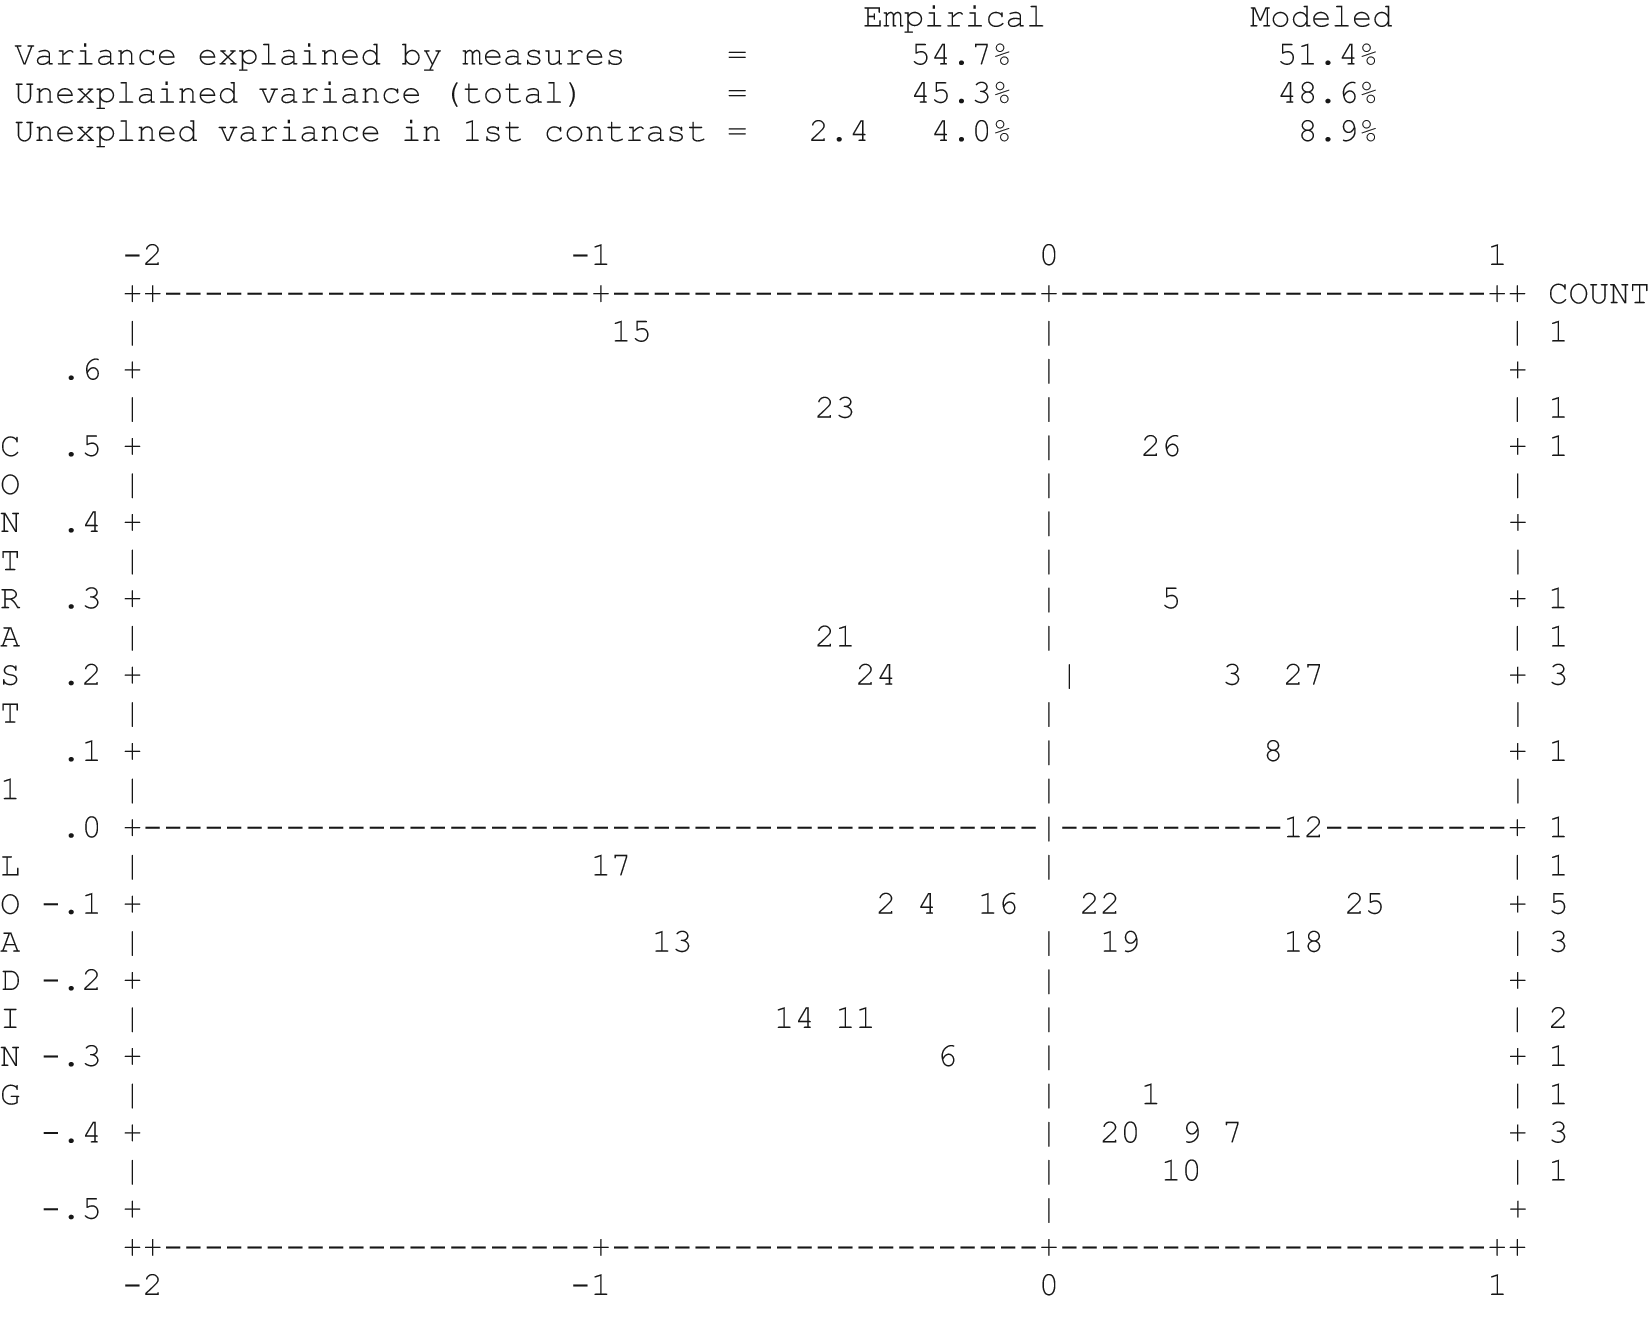
Plot of standardized residual principal components analysis for the 8th-grade sample
Results of the PCA for the 12th-grade sample of the CDI are found in Figure 2. The variance accounted for by the model was 59.6%, which reached at the desired 60%. The eigenvalue of the first contrast was 2.4, accounting for 3.5% of the unmodeled variance. The eigenvalue of the first contrast was lower than 3.0, which is the minimum eigenvalue to be considered a second construct. Additionally, the first contrast accounted for only a small amount of the unmodeled variance, which would further indicate that the CDI is unidimensional for the 12th-grade sample. The first contrast for the 12th-grade sample of the CDI scale consisted of 9 items: Items 3, 15, 16, 17, 19, 21, 23, 24, and 26. Of these nine, six items (Items 15, 16, 17, 19, 21, and 24) had mean-square values greater than 1.0, which suggest that they may contradict the Rasch dimension. The residual-based PCA scree plot was also investigated for the 12th-grade sample. There were no evident cluster of items on the scree plot; therefore, the CDI items for the 12th-grade sample appear to be unidimensional.
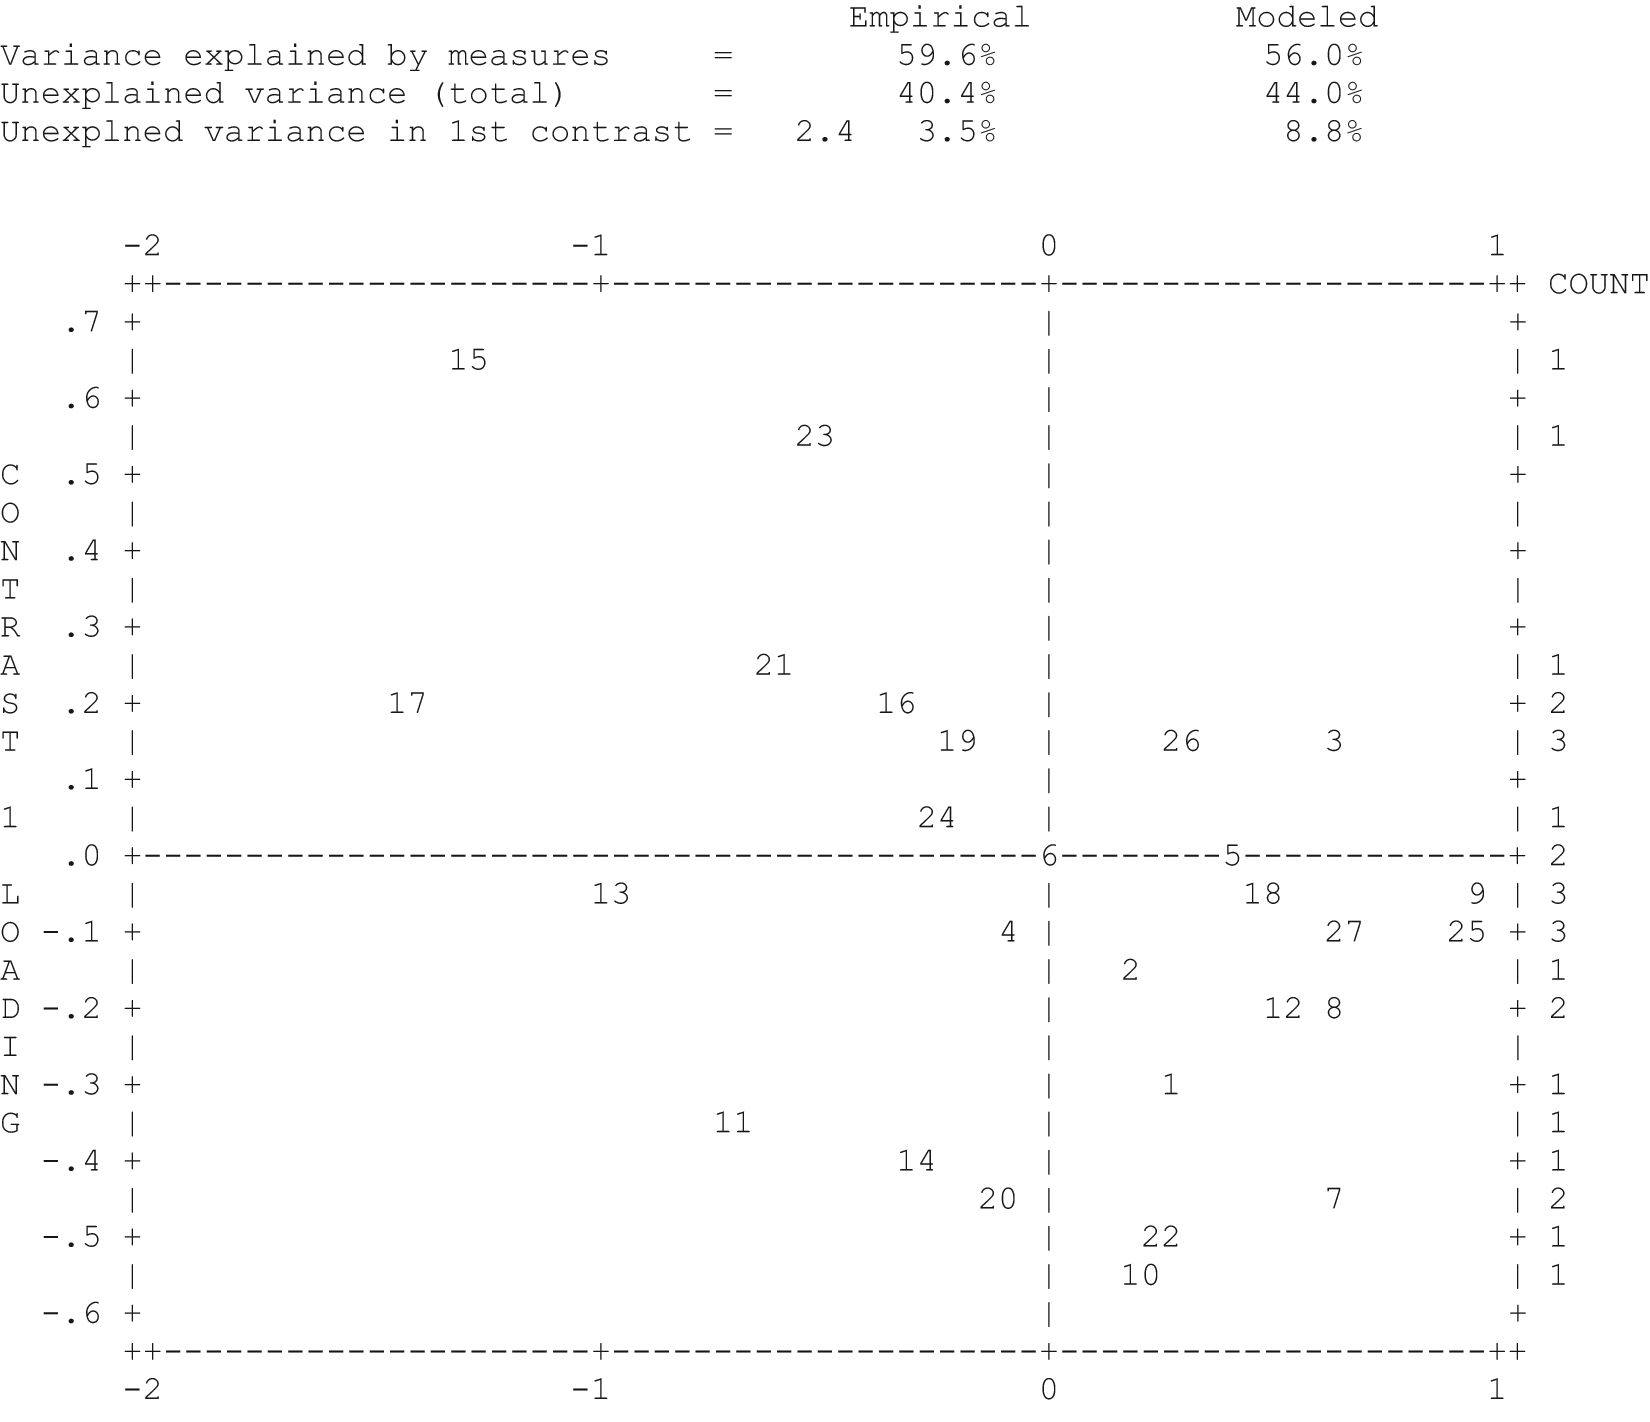
Plot of standardized residual principal components analysis for the 12th-grade sample
Test of Response Category Use
Results of the response category analysis for both samples are presented in Table 2. The three categories exceeded the recommended minimal number of responses of 10 (Linacre, 1999) for both the 8th- and 12th-grade samples. Both samples’ average measure (−1.69, −0.78, and −0.03, and −1.86, −0.82, and −0.02, for Grades 8th and 12th, respectively) and threshold estimates increased with the category label, suggesting a satisfactory categorization of the rating scale in both cases. Each category’s outfit–mean squares statistics were less than 2.0 (Linacre, 1999), suggesting that the categories provided information rather than noise in the measurement process. Thresholds (−0.56 and 0.56, −0.57 and 0.57, for Grades 8 and 12, respectively), where three category probability curves intersect, indicate that each category is equally probable of being observed, illustrating that the three-category rating scale is appropriate for the CDI.
Response Scale Structure for Children’s Depression Inventory

Note: MNSQ = item-fit mean square.
Appropriateness of the Item Difficulty Level for Sample
Figure 3 shows the maps of persons and items for both the 8th- and 12th-grade samples. Person latent trait and item difficulty were arranged from highest to lowest; thus, individuals who appeared to have greater levels of depression, as well as items measuring more severe levels of depression, will be at the top of the map. Figure 3 illustrates that for both the 8th- and 12th-grade samples, there is not a good deal of overlap between the ranges of item difficulties with the persons’ range of latent trait parameters, indicating approximately half of the CDI items measuring the most severe levels of depression were too severe for the samples targeted. Persons who had higher levels of depression had overlap with CDI items measuring less severe levels of depression while persons with mid to low levels of depression had no overlap with any of the CDI items. This means that items measuring moderate and lower levels of depression were too severe for approximately half of the 8th and 12th graders.
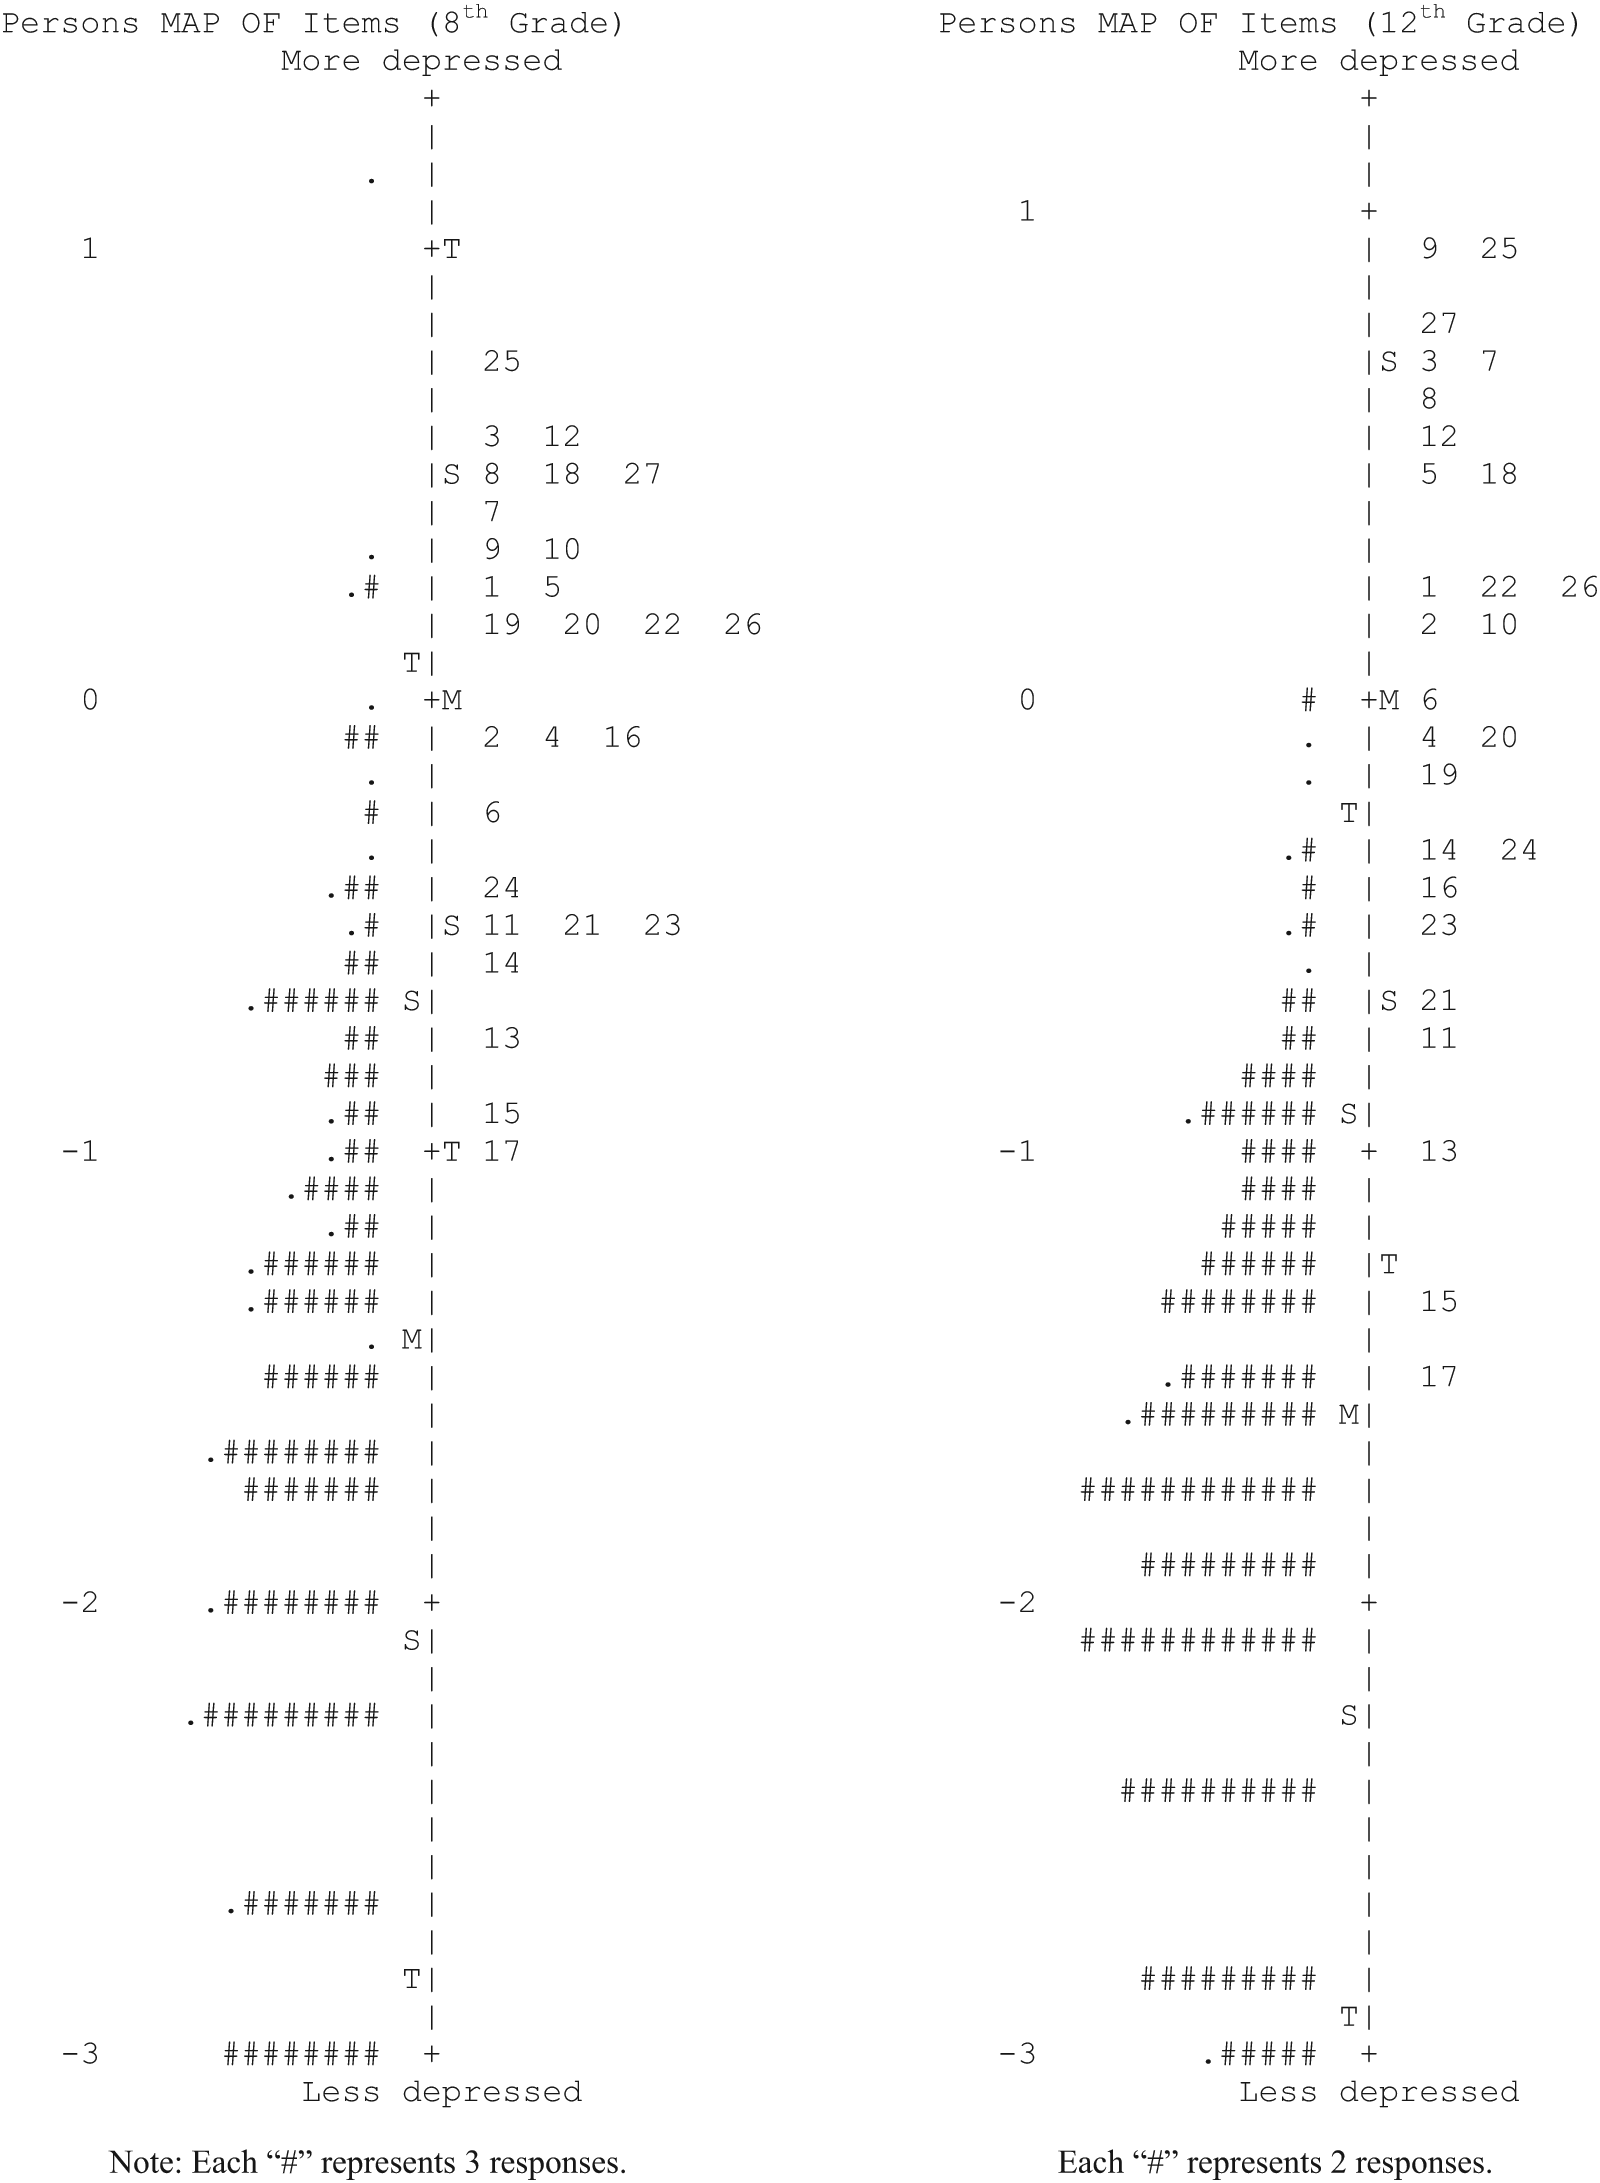
Distribution of persons and Children’s Depression Inventory items
Reliability and Separation Index
Person separation reliability estimates
Person separation reliability estimates for the 8th- and 12-grade samples are found in Table 3. The 8th-grade sample had an estimate of 0.79 and the 12th-grade sample had an estimate of 0.74. Both samples had person separation reliability estimates that fell slightly below the 0.80 threshold, indicating that the CDI may not adequately differentiate individuals. Item separation indices are also presented in Table 3. Neither sample had adequate person separation index estimates, with the 8th-grade sample having an estimate of 1.93 and the 12th-grade sample having an estimate of 1.69. Since estimates for both samples fell below the 2.00 threshold, the indices indicate inadequate separation between persons on the CDI.
Person Summary Statistics for 8th and 12th Grades

Note: RMSE = root mean square error; ZSTD = z-standardized fit statistic.
Item separation reliability
Similar to person separation reliability estimates, results pertaining to the items are presented in Table 4. For both the 8th- and 12-grade samples, reliability estimates were 0.97, above the 0.80 threshold. Moreover, both samples had item separation estimates greater than 2.00, with estimates of 5.54 and 5.60, respectively. In general, these measures indicate good separation between items used in the CDI.
Item Summary Statistics for 8th and 12th Grades

Note: RMSE = root mean square error; ZSTD = z-standardized fit statistic.
Discussion
We sought to investigate psychometric properties of the CDI using an IRT approach. Given the lack of consensus regarding the CDI’s dimensionality, this study assessed whether or not the items actually represented one or multiple dimensions. In addition to dimensionality, we evaluated the appropriateness of having three response categories for CDI items, which the literature has not, heretofore, explicitly addressed. Further still, we evaluated the appropriateness of the CDI item difficulties for the sample considered. Thus, while the CDI was initially created for a wide age range (7 to 18 years), age appropriateness previously had not been evaluated at the item level; such within-subject developmental difference was evaluated in this study.
In general, tests of dimensionality suggest that most items represent one dimension, in 8th as well as 12th grade. While a few items were flagged as either poor infit or outfit in either grade, those items still had strong to moderate PTMEAs and acceptable discrimination. Excluding items 18 and 19, in both 8th and 12th grades, all evidence, though not overwhelming, points toward one defining dimension in both grades. Given the original intent to derive items representing various facets of depression, all items may not be the most ideal indicators of general depression, but, according to these results, do not necessarily represent another, distinct construct. Other studies have typically noted at least one common dimension across them (e.g., Weiss et al., 1991), with discrepancies among others. In a recent study that involved CFA to evaluate the factor structure of the CDI, a single higher order dimension was confirmed (Garcia et al., 2008) and rejected the likelihood of two higher order factors of internalizing and externalizing as suggested by Craighead et al. (1998). Using a more robust measurement model, this study reiterates the argument for a single higher order factor in which all items commonly relate. This was noted by the evidence supporting unidimensionality among the instrument that ultimately there is one, strong, resounding dimension of depression, but other items may form various combinations that slightly represent a construct other than depression or a strong correlate. In any case, a more careful selection of items to represent the overarching construct of depression may be wise, in order to enhance the precision of measurement of the dimension.
Confirmed unidimensionality of the CDI assures counseling professionals that the CDI total score is a valid indicator of their clients’ depression severity that is not confounded by other potentially comorbid conditions, such as anxiety or somatoform disorders (Weersing, Rozenman, Maher-Bridge, & Campo, 2011). The CDI unidimensionality also indicates that all the CDI items and first-order factors are useful in depression assessment, thereby assuring the clinical utility of CDI in evaluating heterogeneous manifestation of depressive symptoms of individual clients. The ability to assess diverse depression symptomatology is particularly important for children/adolescents clients because of their large symptom variations associated with their developmental stages (Harrington, Rutter, & Fombonne, 1996), and therefore is critical in providing tailored interventions for each unique client.
The implication of a unidimensional structure for both 8th and 12th grades as well as similar item difficulty estimates relate to the growing consensus among developmental researchers that have found similarities among adolescents and adults (see Halverson, Kohnstamm, & Martin, 1994; McCrae et al., 2002; Shiner & Caspi, 2003). Given the similarity in structure and item characteristics, the responses that are measured using CDI may be invariant of age, although additional, formal tests of invariance would be necessary to establish this conclusion.
Although the items do appear to measure one general dimension of depression, the sensitivity of the measure to capture degrees of depression among a presumably nonclinically depressed sample is questionable, at best. In a recent study by Masip, Amador-Campos, Gomez-Benito, and Gandara (2010), differences among clinical samples were observed. During both 8th and 12th grades, there is not a good deal of overlap between the distribution of item difficulties and the distribution of the latent trait among persons. Specifically, persons with higher levels of depression had some overlap with CDI items measuring less severe levels of depression and any overlap between item difficulty and latent traits was lacking for CDI items measuring moderate to high levels of depression. The lack of overlap between items and persons suggests that half of the items are not good to detect anything less than severe, perhaps clinically significant, depression. The scale has been and continues to be used among community as well as clinical samples and may be yielding biased estimates of depression in nonclinical or community samples. If the goal is to detect severe depression, in other words, to ensure specificity of high levels of depression, then a portion of the CDI items are somewhat appropriate. This particular finding regarding item difficulty could be the empirical analog to the CDI’s historical clinical use as a diagnostic screener. Because the overlap between item difficulties and person–trait distributions is minimal in both 8th and 12th grades, an assessment of the difference between overlap in the 8th and 12th grades is not possible.
This result indicates that counseling practitioners need to be cautious in using CDI total score for the screening purpose, because the CDI may fail to detect subclinical or mild depressive symptoms that may potentially evolve into more severe, clinical level of a depressive disorder. Early detection of and intervention with milder depression is crucial from the primary and secondary prevention standpoint, particularly for children and adolescents. Future research will need to investigate the utility of the CDI in assessing milder forms of depression by comparing the CDI scores and other measures, for example, the Semistructured Clinical Interview for Children and Adolescents (McConaughy, 2005).
Reliability was assessed from both the person and item perspectives. There was a good separation of CDI items; however, the CDI did not demonstrate adequate differentiation between individuals. In the context of all the results, this reliability information may further indicate that while the items are distinguishable and vary in level of sensitivity, among individuals with various low to mid-levels of depressive symptomology, the CDI will not reliably reflect their “true” level of depression.
Although this study assessed the structure and implications of the items using a comprehensive analysis, further research should emphasize investigating the validity of the scale. As noted in Aluja and Blanch (2002), replications of factor structures have led to further ambiguity on the relationship between dominant factors. As suggested by Garcia et al. (2008), investigating the validity of the factor structure may continue to be investigated. The use of additional statistical techniques or external criteria can be more important in understanding the CDI instrument rather than replicating statistical analyses based on factor analyses. These additional tests may reaffirm the unidimensionality that is suggested in this study.
Conclusion
The CDI is among the most prominent measures of child and adolescent depression used in research. Generally, the use of a normative mean and clinical cutoffs may still be somewhat accurate in demarcating children and adolescents approaching and/or suffering from depression; however, for research purposes, explaining the variability within and between the so-called low, normative, and subclinical slices of the depression distribution is of interest. The presence of some substantial noise around the one prominent dimension, and the lack of good overlap between item difficulty distributions and person-trait levels may each contribute individually and in combination to restricted range and biased estimates of depression based on the CDI. Furthermore, although the results of this study suggest that the items are not necessarily any less appropriate in the 8th grade than in the 12th grade, items that more accurately measure varying levels of depression may yield obvious differences in their measurement properties across development.
This study raises concern about the utility of the CDI among nonseverely depressed samples, presumably the subjects of many research investigations. Age and gender considerations were investigated here, but given the lack of appropriateness of the items for the sample in this study, the findings regarding age and gender may change in a sample where the items are appropriately matched with their level of depression. These methods to evaluate the psychometric properties of the CDI should be replicated in clinical samples, large community-based samples, and ethnically diverse samples to comprehensively understand the best utility of the CDI and to inform the modification or construction of developmentally specific items, appropriate for both the overarching, general dimension of depression as well as varying levels of symptomology or severity.
Footnotes
The author(s) declared no potential conflicts of interest with respect to the research, authorship, and/or publication of this article.
The author(s) received no financial support for the research, authorship, and/or publication of this article.