
Abstract
The content validity ratio (Lawshe) is one of the earliest and most widely used methods for quantifying content validity. To correct and expand the table, critical values in unit steps and at multiple alpha levels were computed. Implications for content validation are discussed.
Content validation rests on demonstration that the test’s items are a representative sample of all items within the content domain of interest (Anastasi & Urbina, 1997; Kerlinger, 1986). Whether the researcher is evaluating the items on a test, questions in an interview, or elements of a set of accreditation standards, the items, questions, themes, or elements should all reflect the intended content of the evaluation tool (Basham & Sedlacek, 2009). Fitzpatrick (1983) described six distinct views of content validity, including four that focus on the test items—clarity of the content domain, relevance of test content to the content domain, sampling adequacy of the test content, and the technical quality of the test items. Two others focused on the test responder—sampling adequacy of test responses and relevance of test responses to a behavioral universe. Spanning the breadth of views identified by Fitzpatrick, a centrist definition for content validity might be phrased,
Content validity of a measurement instrument for a theoretical construct reflects the degree to which the measurement instrument spans the domain of the construct’s theoretical definition; it is the extent to which a measurement instrument captures the different facets of a construct. (Rungtusanatham, 1998, p. 11)
However, many assessment tools are developed for more practical reasons. An assessment tool’s content validity is crucial when its scores are used as evidence in making decisions affecting an examinee’s access to an educational or occupational opportunity, retention, or promotion. Lawshe (1975), an industrial–organizational psychologist with expertise in job performance assessment, speaking about the late 1960s and early 1970s, noted that “civil rights legislation, the attendant actions of compliance agencies, and a few landmark court cases have provided the impetus for the extension of the application of content validity from academic achievement testing to personnel testing in business and industry” (p. 563). Decrying the lack of literature on content validity for employment assessment, he argued, “until professionals reach [consensus] regarding what constitutes acceptable evidence of content validity, there is a serious risk that the courts and enforcement agencies will play the major determining role” (p. 563). In an effort to advance the scholarship of assessment in employment settings he proposed, “Content validity is the extent to which communality or overlap exists between (a) performance on the test under investigation and (b) ability to function in the defined job performance domain” (p. 566).
Content validity is established by design and evaluated by rational analysis of test content by qualified experts in the domain of content to be assessed (Allen & Yen, 2002). To establish content validity, assessment designers follow a multistep process that includes defining the content domain and its facets, defining the level of difficulty or abstraction for the items, developing a pool of prospective items for each defined facet of the content domain, and determining domain relevant sampling ratios (Anastasi & Urbina, 1997). Some test authors might argue that if correct process was strictly followed, a content valid instrument must surely follow. Best practices in test development, however, use postdevelopment assessment of the instrument, based on a rational analysis by experts, of the representativeness (the extent to which each item within each facet of the domain of content reflects the facet’s content definition) and sampling adequacy (the extent to which all aspects of a facet are adequately covered by items; Reynolds, Livingston, & Willson, 2009). This process was aided greatly by the development of methods for quantification of the expert’s judgments, the first of which was the content validity ratio (CVR; Lawshe, 1975).
Lawshe introduced his method for quantifying content validity at the small, invitational Content Validity Conference held at Bowling Green University in October 1974 (Guion, 1974). Subsequently, according to Guion, Lawshe’s colleague, Lowell Schipper, calculated critical values for a selection of subject matter expert (SME) sample sizes to permit significance testing. As will be shown, Lawshe’s statistic has filled a need, becoming an internationally recognized method for establishing the content validity of instrumentation across many disciplines. Developed at a time when statistical analysis in the social sciences relied on submitting data recorded on Hollerith punch cards into mainframe computers, Lawshe’s item-level CVR, and its multi-item summary statistic, the Content Validity Index, when coupled with Schipper’s table of critical values, provided an easy-to-compute method for quantification and significance testing in studies of content validity.
Unfortunately, whether due to a calculation error, a typographical error, or a typesetter’s error, Schipper’s table of critical values appears to contain an anomaly. Although distributions of critical values are typically monotonic, Schipper’s table contains a discontinuity (noted by Stelly, 2006). Moreover, there is apparently no record of how Schipper computed the set of critical values Lawshe published. The purpose of this study, therefore, was to identify how Schipper’s values were computed and then to recompute the table of critical values to correct the discontinuity.
Lawshe’s Content Validity Methodology
Following established methodology, Lawshe’s approach called for the assembly of a set of SMEs who rated each of an instrument’s items on a 3-point scale: (a) “essential,” (b) “useful, but not essential,” and (c) “not necessary.” His statistic, the content validity ratio or CVR, was a linear transformation of the ratio of the number of SMEs judging an item to be “essential” to the total number of SMEs in the panel. Specifically,

where ne is the number of SMEs indicating that the item is “essential,” and N is the total number of SMEs in the panel.
When all SMEs rate the item as being “essential,” the value of CVR will compute to be 1; when the number rating the item as “essential” is more than half but less than all, the value of CVR will be between 0 and 1; and when less than half of the SMEs rate the item as “essential,” the value of CVR will be negative. Although this statistic is no more than a linear transformation of the proportion of SMEs judging the item as “essential,” Lawshe’s true contribution was in providing a table of critical values, which he attributed to his colleague Lowell Schipper, for determining whether the SMEs’ judgments exceeded chance expectation at a one-tailed alpha level of .05.
Compared with alternative methods for quantifying content validity judgments, the Lawshe method is straightforward and user-friendly, requiring only simple computations and providing a table for determining a critical cutoff value. Alternative methods such as Cohen’s kappa (κ; Cohen, 1960), the Tinsley–Weiss T index (Tinsley & Weiss, 1975), James, Demaree, and Wolf’s (1993) rWG and r WG(J) indexes, and Lindell, Brandt, and Whitney’s (1999) r* WG(J) indexes are more computationally complex than Lawshe’s CVR and focus on interrater agreement in general rather than on the specific issue of agreement that an item is “essential” (Lindell & Brandt, 1999).
Critical Acceptance of Lawshe’s Methods
Since its introduction in 1975, critical acceptance of Lawshe’s CVR methodology has grown. The popularity of the Lawshe approach in scale development for health and education sciences is demonstrated by the number of articles published making reference to the CVR and by the wide ranging studies in which it has been used. An electronic search of the Summon electronic database revealed 94 articles containing the phrase, “content validity ratio” of which 51 were published in the past 5 years.
Prevention and health promotion specialists have used Lawshe’s CVR to develop scales for assessing child-rearing knowledge and practices for women with epilepsy (Saramma & Thomas, 2010), a belief-based physical activity questionnaire for diabetic patients (Ghazanfari, Niknami, Ghofranipour, Hajizadeh, & Montazeri, 2010), a checklist for performing content analysis on patient education course syllabi (Gail-Hinckley Heitzer, McKenzie, Amschler, & Bock, 2009), and for assessing whether generic quality of life scales were free of content related to physical function (Hall, Krahn, Horner-Johnson, & Lamb, 2011). In the field of mental health and rehabilitation, researchers developed scales for assessing feelings of competence among children with attention-deficit/hyperactivity disorder (ADHD; Hanc & Brzezinska, 2009), satisfaction with treatment for sexual dysfunction (Corty, Althof, & Wieder, 2011), and psychotherapist counter-transference (Hayes, 2004) using CVR methodology to assess content validity. In a novel study, cross-cultural researchers used the CVR to determine the cultural relevance of items drawn from the Indiana Job Satisfaction Scale (IJSS) thereby producing a Chinese version of the IJSS for use in vocational rehabilitation programs for individuals with mental retardation in China (Tsang & Wong, 2005).
Medical and nursing assessment specialists have relied on the Lawshe approach for developing an adult intubation procedural checklist (Stausmire, 2011), a quality-of-life index for AIDS patients in Uganda (Namisango, Katabira, Karamagi, & Baguma, 2007), a system for auditing nursing care plans (Bjorvell, Thorell-Ekstrand, & Wredling, 2000), a low-literacy assessment of patient knowledge regarding chronic obstructive pulmonary disease (Maples, Franks, Ray, Stevens, & Wallace, 2010), a survey to assess Medicaid recipients’ understanding of the postpartum tubal sterilization process (Zite & Wallace, 2007), and a Swedish language version of the Problem Areas in Diabetes Scale (Amsberg, Wredling, Lins, Adamson, & Johansson, 2008).
In the field of education, the content validity of a scale for evaluating team-designed material development manuals (Erdem, 2009) and an affective response to literature scale (Fischer & Fischer, 2007) was established by SMEs working according to Lawshe’s methods. Training specialists have used the CVR to assess job relatedness of the content of a job training program (Ford & Wroten, 2006) and the job relatedness of an assessment of posttraining job knowledge (Distefano, Pryer, & Craig, 2006).
Organizational developers and management specialists have used Lawshe’s content validity approach to assess the impact of the Deming model for quality management (Collard, 1992) and to define and measure servant leadership behavior (Sendjaya, Sarros, & Santora, 2008). A series of studies based on applications of the enterprise resource planning model in Asian business markets, has used the CVR to develop performance indicators or critical success factors (J. Huang, Zhao, & Li, 2007; S.-M. Huang, Hung, Chen, & Ku, 2004; Wei, 2008; Yu, Ng, Chang, Chang, & Yen, 2011). Drossos and Fouskas (2010) used the CVR to assess the content validity of a tool developed to measure industry perceptions of the competitiveness of market environments and their own competitive responses.
Market research has also embraced the Lawshe method for assessing content validity. Tools for assessing consumer adaption to or adoption of broadband (Choudrie, Dwivedi, & Brinkman, 2006), Internet stock trading (Hung, Huang, & Yen, 2004), and airport self-service check-in kiosks (Chang & Yang, 2008a) were developed using CVR methodology. The CVR was also used in developing criteria to segment a customer base (Tai, 2011; Tai & Ho, 2010), assess brand personality appeal (Henard, Freling, & Crosno, 2011), and assess passenger repurchase motivation (Chang & Yang, 2008b). Concern over issues of internet security prompted the development of tools for assessing perceived functional and relational value of information sharing services (Tai, 2011) and for assessing privacy concerns and levels of information exchange for e-services on the Internet (Dinev & Hart, 2006), both of which were CVR-supported research tools.
In the field of personnel psychology, Lawshe’s methodology has been used in the development of a situational interview to predict service representative applicants’ future job performance (Flint & Haley, 2008), a structured behavioral interview to hire private security personnel (Moscoso & Selgado, 2001), a job performance rating criterion (Distefano, Pryer, & Erffmeyer, 2006), and job termination criteria for assessing mentally ill workers (Mak, Tsang, & Cheung, 2006). Mathews, Smith, Hussey, and Plack (2010) used the CVR to develop an assessment tool to measure participants’ perceptions of the roles, practices, education, and preferred relationship of physical therapists and physical therapist assistants. Finally, Lawshe’s CVR was also used to develop tools for assessing critical factors related to Taiwanese expatriates’ foreign post selection and overseas performance (Cheng & Lin, 2009).
Despite its competitors (e.g., Cohen’s κ, 1960; the Tinsley–Weiss T-Index, Tinsley & Weiss, 1975; James et al.’s r WG and r WG(J) indexes, 1993; and Lindell et al.’s r* WG(J) index, 1999), the Lawshe method has been endorsed in texts on personnel management (Lindell & Brandt, 1999) and endorsed for use in nursing research (Polit & Beck, 2006; Polit, Beck, & Owen, 2007). Its tabled critical values have been reproduced in texts such as the Cohen and Swerdlik (2005) text on psychological testing and assessment.
Problems With Schipper’s Table of Critical Values
Though Lawshe’s method has received commendation and has been featured in research studies in multiple disciplines, and is even being used in defense of the content validity of high-stakes tests, it is not without criticism. The main thrust of the criticism has been directed toward three aspects of the table of critical values Lawshe provided for the CVR, a table which Lawshe acknowledges was developed by his colleague, Lowell Schipper.
Schipper’s table of critical values is terse. It only provides critical values for pools of 5, 6, 7, . . ., 14, 15, 20, 25, 30, 35, and 40 SMEs and this only for one alpha level. Although interpolation of missing data points with a linear function can be accomplished easily, a scatter plot of Schipper’s table reveals that the critical values are curvilinear making accurate interpolation problematic.
A careful examination of the critical values also reveals an anomaly. The critical value for the CVR increases monotonically from the case of 40 SMEs (CVRcritical = .29) to the case of 9 SMEs (CVRcritical = .78) only to unexpectedly drop at the case of 8 SMEs (CVRcritical = .75) before hitting its ceiling value at the case of 7 SMEs (CVRcritical = .99). When Cohen and Swerdlick (2005) reproduced Schipper’s table in their assessment text, they did not comment on this apparent anomaly. When Wallace, Gregory, Parham, and Baldridge (2003) used the CVR method with nine SMEs to develop and validate family residency recruitment questionnaires, they used a CVRcritical of .75. Whether using a CVRcritical of .75 at N = 9 was an error on their part in reading Schipper’s table or an attempt to adjust for the apparent anomaly at N = 8 is unknown. On reviewing Wallace et al.’s (2003) work, Stelly (2006) observed, “it is possible that the authors reversed the minimum CVRs for 8 and 9 panelists to correct what they perceived to be an error in the original table” (p. 6). The anomaly may also be a function of something as simple as a typographical error which escaped proofreading, or perhaps a typesetter’s error given the fact that in the 1970s, many journals used hand-set type for tables, if not for the whole of the journal.
But the most unsettling problem is that the statistical distribution underlying Lawshe’s table is not specified. In his defining article, Lawshe (1975) stated that the table of critical values for the CVR was calculated by his friend, Lowell Schipper. Unfortunately, he did not describe the basis on which these values were calculated. Lawshe had introduced the CVR at the 1974 Content Validity Conference, a small invitational conference sponsored by the Society for Industrial and Organizational Psychology (SIOP). Another SIOP member, Robert M. Guion (1974) wrote,
C. H. Lawshe presented a scheme for classifying content validity problems and a “Content Validity Ratio” by which the relevance of a test item or a total test score might be scaled. (Lowell Schipper has subsequently related the CVR to chi square, permitting significance testing). (p. 18)
Apparently not having had access to Guion’s review of this conference, Lindell and Brandt (1999) and Stelly (2006) speculated that the critical values were associated with the binomial distribution.
Purpose of This Investigation
Since the Lawshe method is being used to produce knowledge for diverse disciplines and its possibly flawed tabled values are being disseminated in print and electronic media, correction of the apparent errors in Lawshe’s (1975) presentation of Schipper’s table and extension of the range of tabled values are warranted. The purpose for this study is therefore to explore the CVR’s underlying distribution and to correct and expand the range of its tabled critical values.
Do Schipper’s Critical Values Map to the Binomial Distribution?
Both Lindell and Brandt (1999) and Stelly (2006) speculated that Schipper’s critical values were associated with the binomial distribution, a more precise hypothesis than Guion’s (1974) report of Schipper relating the CVR to chi square. To evaluate the proposition that Schipper’s table of critical values for the CVR was based on the binomial distribution, two approaches were taken: (a) an examination of the cumulative probabilities for sets of independent Bernoulli trials and (b) an examination of the normal approximation for the binomial distribution.
Discrete Binomial Probabilities
To determine whether Schipper based his table of critical values on discrete binomial probabilities, the cumulative probabilities for sets of independent Bernoulli trials were calculated. Although we expected that this approach would not yield a monotonic progression of values, it seemed important to test this approach given Stelly’s (2006) advocacy for using exact probabilities.
A key parameter in these calculations is the value for p, the probability for any given trial of achieving success. The conventional way of construing the problem would be to view Lawshe’s rating scale as a trichotomy, with the three outcomes being (a) “essential,” (b) “useful, but not essential,” and (c) “not necessary.” From this point of view, the parameter, p would be ⅓. However, Lawshe construed the scale as a dichotomy, with the two outcomes being (a) “essential” and (b) “not essential” (with “useful, but not essential” and “not necessary” being combined as the second category) yielding a value for p of ½. For this exploration, both approaches were tried.
For each approach (i.e., dichotomous, trichotomous), a table of critical values based on the discrete binomial was computed using the Microsoft Excel function:

where n critical is the smallest value for n (the number of SMEs judging the item as “essential”) for which the cumulative binomial distribution is greater than or equal to a criterion value 1 − α, N is the number of Bernoulli trials (the number of SMEs in the pool), and p is the probability of success on each trial. Since CRITBINOM returns the smallest value for n e (the number of SMEs judging the item as “essential”), CRITBINOM’s output was converted to a value of CVRcritical according to Lawshe’s CVR formula:

To obtain a complete table of values, we computed CVRcritical for each N from 5 through 40 in unit steps. We also expanded the table by considering the traditional range of values for alpha. For each alpha level, the significance of difference between Schipper’s critical values and those computed using CRITBINOM for each alpha level was tested using the nonparametric Wilcoxon signed-rank for dependent samples to determine for which, if any, of the alpha levels did the computed CVRcritical values differ from those attributed to Schipper. Because Schipper’s values achieve a ceiling value of CVRcritical = .99 at a pool size of N = 7, only the calculated values in the range of N = 7, . . ., 40 were tested for departure from Schipper’s values.
Discrete binomial construing SME ratings as a trichotomy
Examination of the proposition that Lawshe’s rating scale should be treated as a trichotomy rather than Lawshe’s favored dichotomy produced a poor fit to Schipper’s critical values for the CVR. With the probability of success set at p = ⅓, for each criterion value for alpha, the distribution of binomial probabilities yielded a pronounced, jagged or “saw-toothed” pattern. The best fit as evidenced by the mean absolute deviation from Schipper’s values, was found to be at α = .05, two-tailed (or α = .025, one-tailed). The mean absolute departure of the calculated values for CVRcritical from Schipper’s critical values ranged from a minimum difference of .09 at α = .001, one-tailed (or α = .002, two-tailed) to a maximum difference of .56 at α = .10, one-tailed (or α = .20, two-tailed). The Wilcoxon signed-rank test revealed that at all but one of the tested alpha levels, the difference between the calculated values for CVRcritical departed significantly from those provided by Schipper’s values (p < .01 for all tests). The only distribution of CVRcritical computed using CRITBINOM with p = ⅓ that was sufficiently close in value to those supplied by Schipper to be considered interchangeable with his table of minimum values was at an extreme alpha level, α = .0005, one-tailed (α = .001, two-tailed). These results are presented in Table 1.
Comparison of Schipper’s CVRcritical With Three Recalculations Based on the Binomial Distribution at Eight Levels of Significance
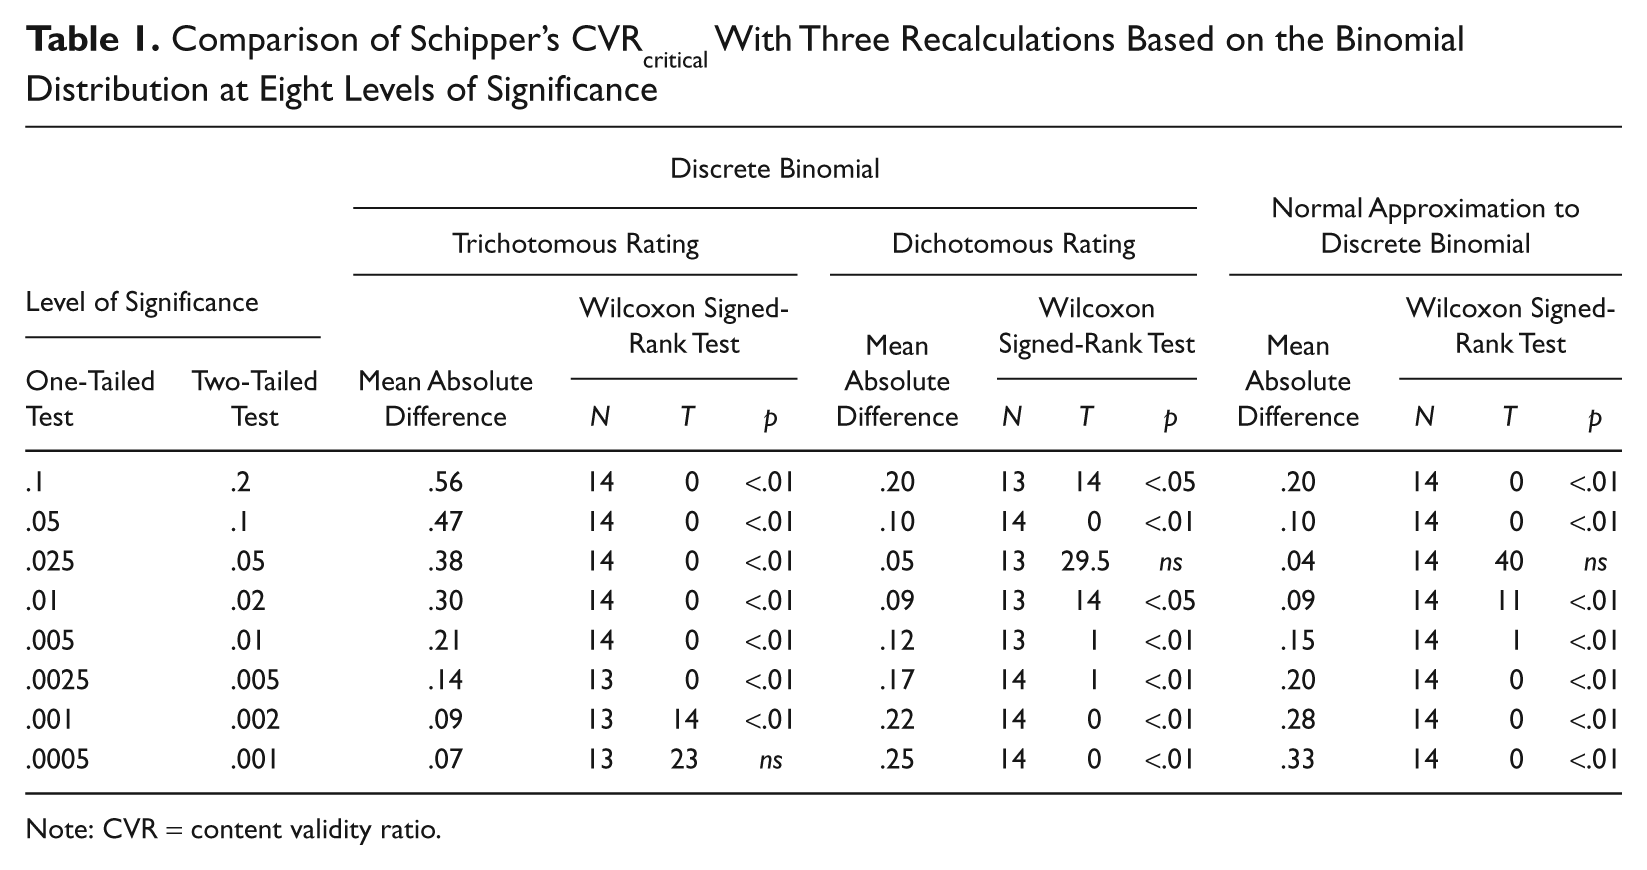
Note: CVR = content validity ratio.
Discrete binomial construing SME ratings as a dichotomy
With the probability of success set at p = ½, for each criterion value for alpha, the distribution of binomial probabilities yielded a less pronounced “saw-toothed” pattern. The mean absolute departure of the calculated values for CVRcritical from Schipper’s critical values was least at α = .05, two-tailed (or α = .025, one-tailed) and when tested using the Wilcoxon signed-rank test, the calculated values at this alpha level were found to not differ significantly from Schipper’s values. At all other alpha levels, the mean difference was higher (range: .09–.22) and the departure of the calculated values from those proposed by Schipper was significant with the level of significance ranging from p = .05 to p = .01. The results of these tests are presented in Table 1.
Normal Approximation to the Binomial Distribution
Although the calculation of discrete probabilities yielded values that at α = .05, two-tailed (or α = .025, one-tailed) bracketed in “saw-tooth” fashion those provided by Lawshe, they failed to be monotonic. Calculation of the normal approximation to the discrete binomial calculations would yield a monotonic curve. Assuming that n e ~ B(N, p) and assuming that p = ½, the normal approximation of the binomial distribution may be expressed as
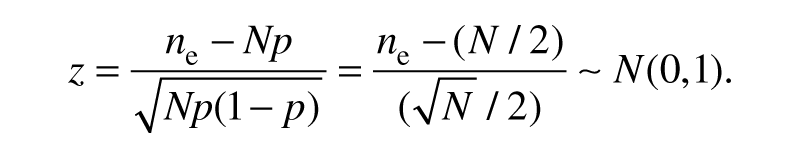
According to Box, Hunter, and Hunter (1978, p. 130), for N > 5 the normal approximation is adequate if

In this case, p = ½, so the assumption above is satisfied.
The task of the CVR is to identify items in an instrument deemed by a critical number of content experts to be “essential.” This task calls for a one-tailed hypothesis test, expressed as

for which the corresponding critical value is

where α is a prespecified significance level; or

Therefore, the critical value for CVR is

As above, to obtain a complete table of values, we computed CVRcritical for each N from 5 through 40 in unit steps and expanded the table by considering the traditional range of values for alpha. The departure of the computed CVRcritical values from those of Schipper’s was again tested using the nonparametric Wilcoxon signed-rank for dependent samples. The recalculated table of critical values is presented in Table 1.
For each level of alpha, the distribution of binomial probabilities yielded a smooth, monotonic curve. As was noted earlier, because Schipper’s values achieve a ceiling value of CVRcritical = .99 at a pool size of N = 7, only the calculated values in the range of N = 7, . . ., 40 were analyzed. The mean absolute departure of the calculated values for CVRcritical from Schipper’s critical values ranged from a maximum difference of .28 at α = .001, one-tailed (or α = .002, two-tailed) to a minimum difference of .04 at α = .025, one-tailed (or at α = .05, two-tailed). When tested using the Wilcoxon signed-rank test, the calculated values α = .025, one-tailed (or at α = .05, two-tailed) were found to not differ significantly from Schipper’s values. At all other alpha levels, the mean difference was higher (range: .09–.28) and the departure of the calculated values from those proposed by Schipper was significant with the level of significance of p < .01. For small pools of judges (N = 5, . . ., 10), values computed for CVRcritical at α = .05, two-tailed (or α = .025, one-tailed) were more liberal while at increasingly larger pools of judges (N = 20, . . ., 40), the values computed for CVRcritical at α = .05, two-tailed (or α = .025, one-tailed) were slightly more conservative. The results of these tests are presented in Table 1 and the complete table of recalculated values based on the normal approximation to the binomial is presented as Table 2. A graph illustrating Schipper’s values for CVRcritical and curves showing the values for CVRcritical calculated by the normal approximation to the binomial with the scaling construed as a dichotomy and as discrete binomial probabilities with the scaling construed both as a trichotomy and as a dichotomy at α = .05, two-tailed (or α = .025, one-tailed) is presented in Figure 1.
Critical Values for Lawshe’s (1975) Content Validity Ratio (CVRcritical)
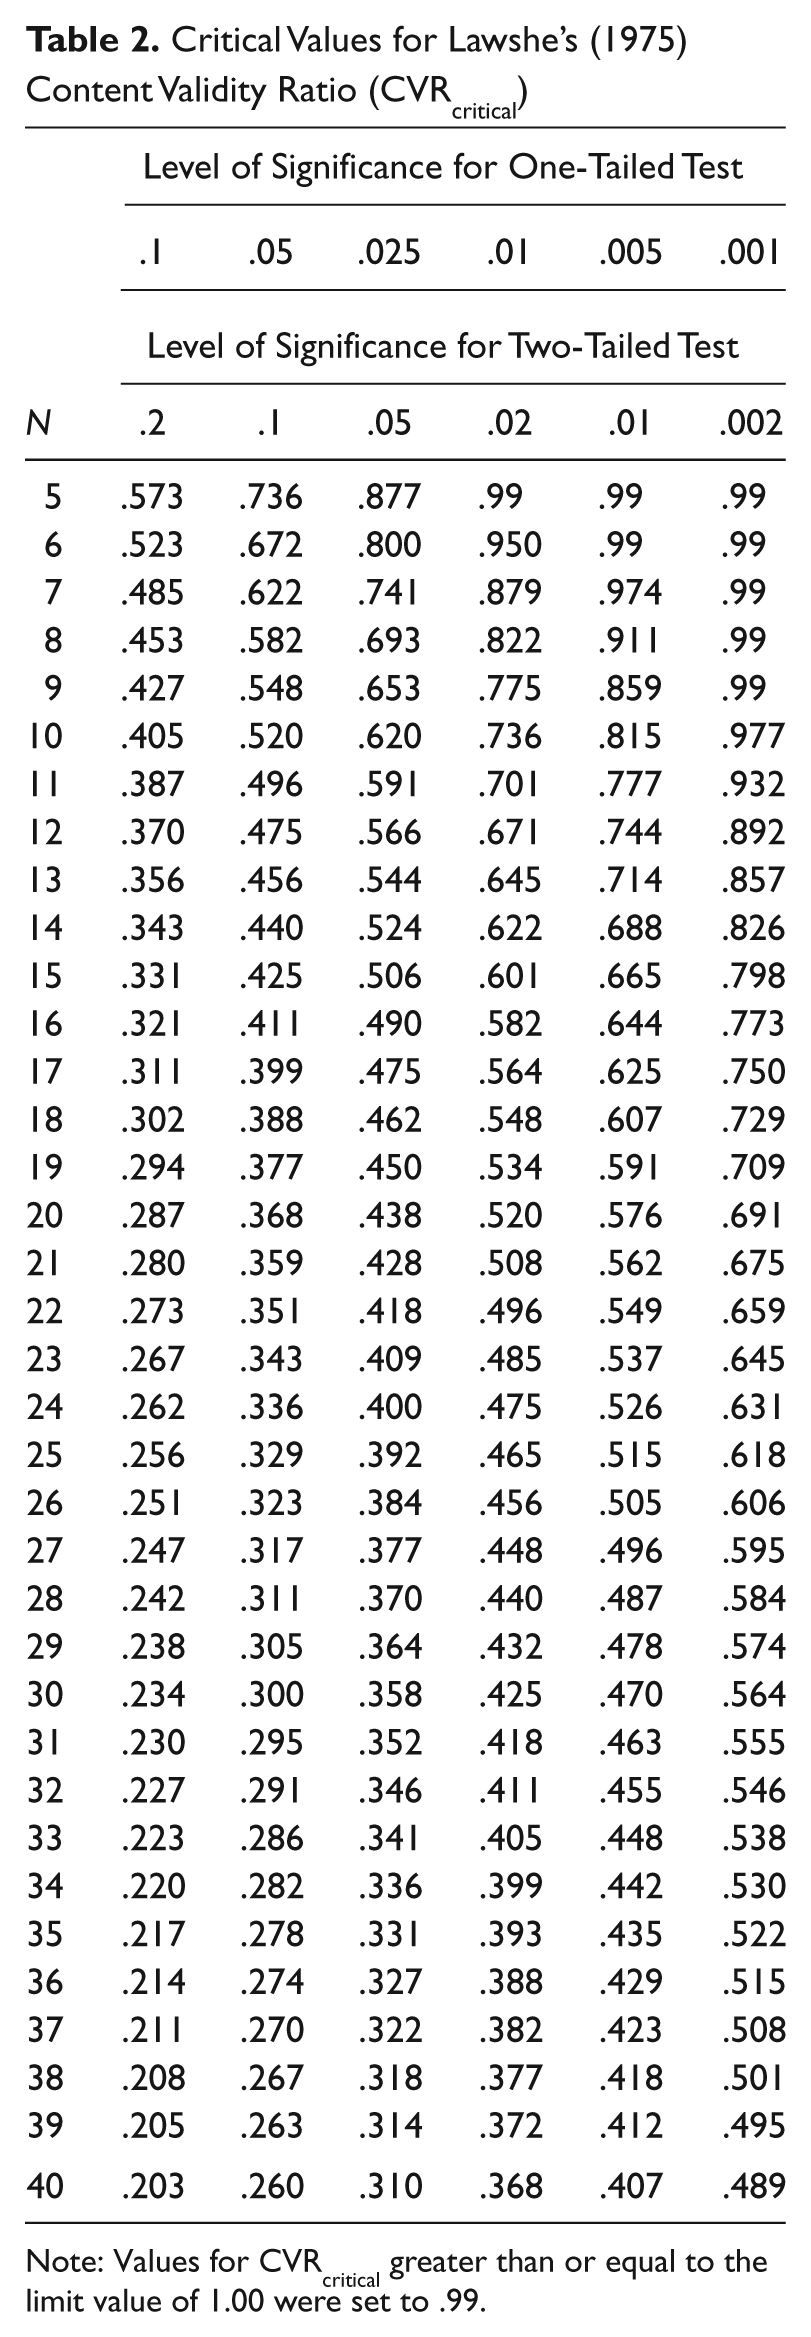
Note: Values for CVRcritical greater than or equal to the limit value of 1.00 were set to .99.
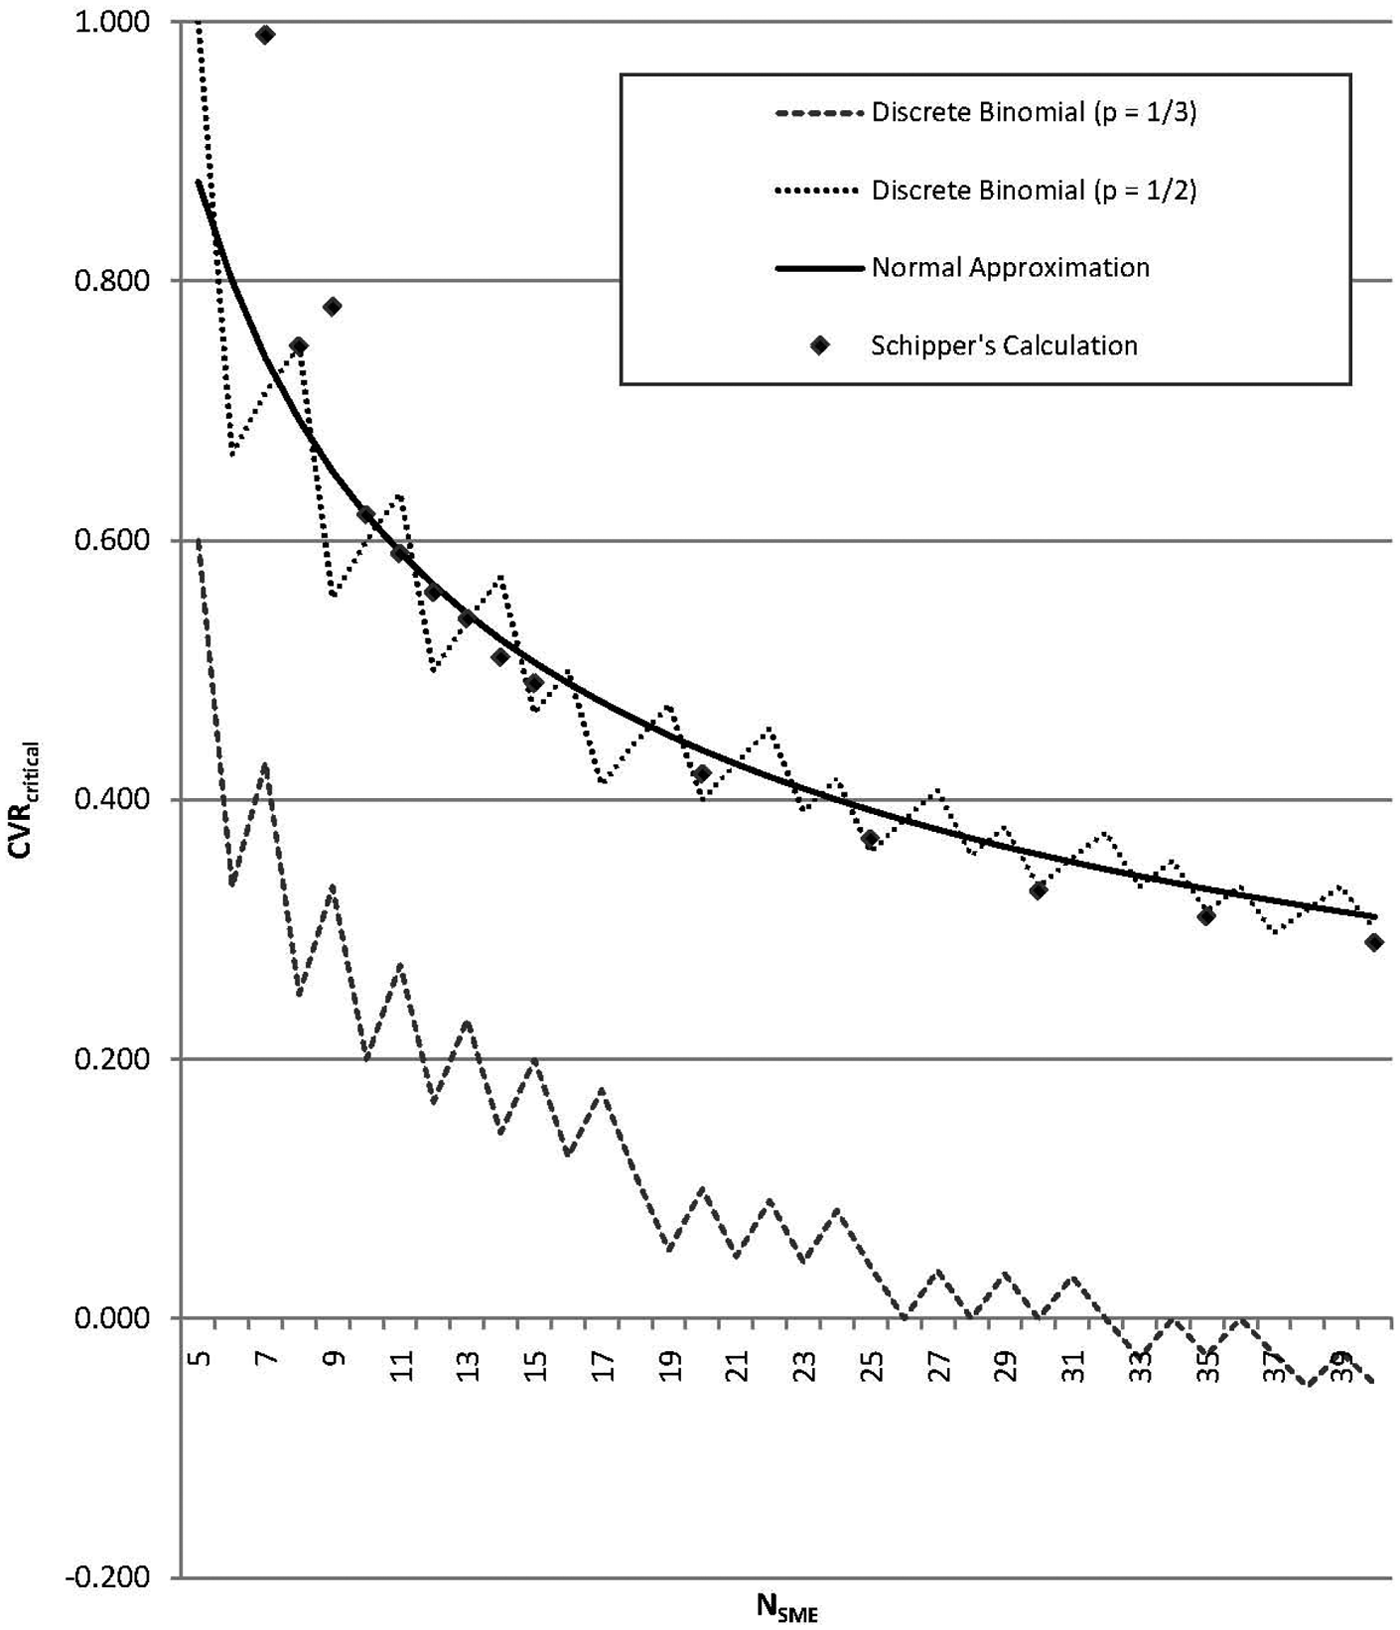
Comparison of Schipper’s values of CVRcritical with critical value results from three recalculations: the discrete binomial (p = 1/3), the discrete binomial (p = ½), and the normal approximation to the binomial
Discussion
The questions raised about Schipper’s table of critical values for Lawshe’s CVR focus on four issues: (a) How did Schipper compute the table? (b) Was Lawshe correct in labeling Schipper’s table of critical values as representing a test at α = .05, one-tailed? (c) Why does Schipper’s table contain an anomaly? (d) If errors were made, what are the likely consequences of the errors?
How Did Schipper Compute His Table of Critical Values for CVR?
It appears that Schipper did not compute discrete binomial probabilities. It appears more likely that he used the normal approximation for computing binomial probabilities to create his table. Although the curve produced by calculating the normal approximation to the binomial does not provide an exact fit to Schipper’s values, the curve produced at α = .05, two-tailed (or α = .025, one-tailed) is a very close approximation. Values calculated at all other alpha levels result in larger mean absolute discrepancy. The Wilcoxon test found significant discrepancy between the calculated values and Schipper’s values for all alpha levels tested except at α = .05, two-tailed (or α = .025, one-tailed).
Does Schipper’s Table Provide a Test at α = .05, One-Tailed?
It also appears that Lawshe was in error in labeling Schipper’s table as providing a test for CVRcritical at α = .05, one-tailed. As noted above, although the curve produced by calculating the normal approximation to the binomial does not fit the full range of Schipper’s data exactly, the values produced at α = .05, two-tailed (or α = .025, one-tailed) provide a very close fit. A quantitative methods specialist with 50 or more years in the profession, observed that in those early years, many quantitative analysts ran two-tailed tests even when the hypothesis under test was directional (D. A. Schumsky, personal communication, June 10, 2011). Perhaps Schipper, the statistician, produced a table of values at α = .05, two-tailed out of habit and Lawshe, the theoretician and applied personnel psychologist did not realize that such was the case.
Why Does Schipper’s Table Contain an Anomaly?
Although this was the question which initiated this project, it may go unanswered. We had hoped that we would be able to reproduce Schipper’s values exactly (except, of course, the anomalous value). We would have then been able to replace the anomalous value with a correct one. Several speculations have arisen. The anomaly could have arisen from a typographical error, a failure in proofreading. Another possibility, since tables in older journals were often set by hand, is that the anomaly was a result of interchanging the two lines of type containing the critical values for N = 8 and N = 9. Finally, since the values computed using the normal approximation to the binomial fit well with Schipper’s values until SME pool sizes fall below 10, there may be more than a single anomaly in Schipper’s table. If one presumes there is a single anomaly at N = 9, the anomaly could have been the result of a single calculation error. With such a small number of values to compute, Schipper may have computed the values longhand or with the aid of a calculator and may have simply made a mistake in calculating the value for CVRcritical at N = 9. However, Schipper’s value for CVRcritical at N = 7 is also very different from that which is produced using the normal approximation to the binomial. In Schipper’s table, the CVRcritical at N = 7, 6, and 5 was set at a ceiling value of .99. One possibility is that these ceiling values were not calculated but were inserted, a priori, as a statement that at such small sample sizes, only perfect agreement among the SMEs that the item under scrutiny was “essential” could be accepted safely. In his 1975 article, Lawshe provided no discussion about the construction of the table. It is unfortunate that no question was raised about the anomalous value or values in Schipper’s table before his death in 1984 and that there was apparently no contact between Lindell and Brandt, who published their review of methods for quantifying content validity judgments in the same year that Lawshe died (1999), to enquire about Schipper’s table.
What Are the Consequences of Lawshe’s and Perhaps Schipper’s Apparent Errors?
The apparent mislabeling of the alpha level for Schipper’s table and the presence of one or more anomalies in the table suggest that the table may lead to erroneous decisions by the researcher. Given that Lawshe’s method has been used widely, even in high-stakes testing situations, the consequences could be potentially harmful. Fortunately, both apparent errors are errors on the side of stringency:
Consequence of the apparent mislabeling of the table’s alpha level. Lawshe’s labeling of Schipper’s table as representing a test at α = .05, one-tailed is an error in the conservative direction. Since Schipper’s table of critical values appears to represent a test at α = .05, two-tailed (or α = .025, one-tailed), an item’s content validity, rated at a level beyond chance expectation at a true α = .05, one-tailed would be rejected according to Schipper’s values for CVRcritical. This is an error in the conservative direction.
Consequence of the apparent anomaly or anomalies in Schipper’s table. Compared with the values calculated for the normal approximation to the binomial, Schipper’s value for the CVRcritical of .78 at N = 9 is a much more stringent criterion than the value of .653 computed at that pool size for the normal approximation to the binomial at α = .05, two-tailed (or α = .025, one-tailed). While Schipper’s apparently anomalous value of .75 is closer to the normal approximation value of .693 at N = 8, his value of .99 at N = 7 is also much more stringent than the value of .741 computed for the normal approximation to the binomial.
With small pools of SMEs, a test author who used Schipper’s table for setting the criterion for item inclusion would have little reason to worry about whether an item with low content validity had been included in the test. Both errors (i.e., the anomalous value or values and the apparent mislabeling of the table) lead to increasing the stringency of the criterion for item inclusion. Since Lawshe’s CVR has been used to produce high-stakes employment tests, erring in the conservative direction offers greater safety from allegations that the test contained items not judged to be “essential” for job performance. Given the consequences of using an invalid test in high-stakes testing, if an error was to be made, an error in the conservative direction is the better of the two possible errors.
Conclusions
Lowell Schipper’s table of critical values for Charles Lawshe’s CVR, which Lawshe described as representing a test at α = .05, one-tailed, was examined. Evidence showed that it had one or more anomalous values for CVRcritical. A review of literature failed to shed light on the method used by Schipper in calculating the table. Trial tables of critical values were computed using both discrete calculation and normal approximations to the binomial distribution. Schipper’s values mapped convincingly to the normal approximation of the binomial at α = .05, two-tailed (or α = .025, one-tailed) suggesting that Lawshe may have mislabeled the alpha level for Schipper’s table—rather than being a table of values for α = .05, one-tailed, it is likely that it is a table of values for α = .05, two-tailed. This finding suggests that, at small SME pool sizes, Schipper’s values for CVRcritical represent a more conservative criterion for item inclusion than may be warranted.
Footnotes
The author(s) declared no potential conflicts of interest with respect to the research, authorship, and/or publication of this article.
The author(s) received no financial support for the research, authorship, and/or publication of this article.