
Abstract
A guide for researchers to calculate effect sizes for single-case research using three nonoverlap methods is provided. These methods are evaluated for their strengths and limitations, applied to a data set, and contrasted with one another. Criteria are presented to determine goodness of fit between nonoverlap procedures and data sets.
In a culture of accountability, demonstrating credible practices through measurable outcomes is a commonplace requirement for helping professionals. Consequently, counselors and counselor educators were charged with implementing rigorous, yet flexible approaches to assess the influence of interventions on a variety of dependent variables. Concurrently, professional groups such as the Association for Assessment in Counseling and Education began to require reporting treatment effect sizes in addition to statistical significance during the 1980s. Sanderson (2003) noted that the propagation of treatments that are supported by empirical evidence has positive implications related to both the health and economic status of individual consumers. Furthermore, managed care companies are increasingly interested in doing business with helping professionals that are trained in outcome-based interventions as a strategy to contain costs while continuing to provide adequate patient care (Sanderson, 2003). Therefore, counselors should become versed in varied methods, including single-case research, to evaluate their practices with clientele.
Recognizing the need to meet this challenge, a task force headed by Chambless and colleagues (Chambless et al., 1996; Chambless et al., 1998) provided scientist-practitioners a valuable guidepost by identifying and defining guidelines for evaluating the efficacy of treatment interventions and corroborating their evidentiary support. As a result, Division 12 of the American Psychological Association has endorsed between-group and single-case research designs (SCRDs) as essential for evaluating the fidelity of interventions. Although between-groups studies have been a cornerstone of empirical evaluation, the certification of SCRDs as a robust method for supporting practices with evidence provided an avenue for counselors to demonstrate their effectiveness within individual participants. After all, counselors working in community settings are unlikely to have access to control groups and large amount of individuals with identical symptom constellations to evaluate over time. The endorsement of the SCRD by Chambliss and colleagues was a foundational step toward building a knowledge base that contributes to the credibility of counseling interventions within the scientific community at large. Since the endorsement of SCRDs by Chambliss and colleagues, several scholars implored counseling professionals to implement SCRDs to promote the innovation and diversity of practices that will benefit clients and students (Foster, 2010; Lundervold & Belwood, 2000; Ray, Minton, Schottelkorb, & Brown, 2010; Sharpley, 2007); to date, their call to action has been only modestly answered.
One possible explanation may be that some counselor education programs tend to emphasize the use of large between-groups methods and correlational methods for quantitatively evaluating treatments with a lesser consideration for single-case research methodology and data analysis. Additionally, counselors often assist clientele with resolving issues associated with abstract concepts (e.g., self-esteem, depression, and anxiety) rather than concrete observable behaviors (e.g., number of times a child interrupts their teacher). Another reason for the dearth of single-case research within our profession may be the lack of quality examples for computing treatment effect available for reference within our professional journals. Regardless of the cause, many counselors have been limited in demonstrating clinical relevance and efficacy when compared with other professionals such as those practicing applied behavioral analysis and behavior modification. This article is intended to provide counselors and counselor educators with a concise and practical reference for computing and interpreting treatment effect size or the amount of practical improvement associated with treatment interventions when implementing SCRDs. First, I will introduce and explain the basic logic for three methods to quantitatively synthesize SCRD; next, each method will be illustrated and interpreted using a fabricated data set; last, guidance regarding the method selection and use will be provided. The methods included herein represent useful contemporary approaches to SCRD data analysis that compliment visual inspection and inference that scientist-practitioners can implement rather than methodological innovations. Readers requiring a review of SCRD rationale and methodology are referred to the several journal and text resources available that are relevant to counseling professionals (Foster, 2011; Morgan & Morgan, 2009; O’Neill, McDonnell, Billingsley, & Jenson, 2011; Sharpley, 2007).
Nonoverlap Methods for Calculating Treatment Effect Size
Within the past decade there has been a marked expansion in strategies for systematically evaluating quantitative data in single-case research. Prior to these developments, researchers relied heavily on visual inspection of the data trends illustrated on graphical representations to determine whether meaningful change had been noted between the baseline and treatment phases. Given the mixed methods nature of SCRDs, the utilization of effect size metrics should be an adjunctive support to the visual inspection of graphical illustration of data that include analysis of changes in slope and variability of data. In many cases, peaks and valleys illustrated in graphical representations of data provide researchers an opportunity to breathe life into the results of their studies and provide a platform to analyze the strengths and weaknesses of an intervention over time. Furthermore, visual analysis provides researchers with an opportunity to consider whether the effect size yielded agrees with the overall trends of data observed during an intervention.
In recognition of the need for more formal approaches for synthesizing data, several researchers (Ma, 2006; Parker, Hagan-Burke, & Vannest, 2007; Scruggs & Mastropieri, 2001; Scruggs, Mastropieri, & Casto, 1987) developed more scientific means for examining and reporting research findings that promote reliability through replication. Parker and Hagan-Burke (2007) suggested that measures of effect size provide a number of advantages over visual analysis alone, including (a) an objective measure of treatment effect, (b) increased precision of measurement, (c) allowance for cross-case comparisons and meta-analyses, (d) improved interrater reliability for calculating SCRD results, and (e) enhanced efficiency for documentation purposes. Perhaps most relevant, the ability for researchers to calculate quantitative values that depict treatment efficacy also lends itself to reporting outcomes in counseling and educational settings that may assist in reporting to funding agencies and other program stakeholders. Unlike traditional tests of statistical significance, the effect size metrics implemented in SCRDs provide an estimation of practical changes between baseline and treatment phases that is content and situation specific.
Among the most convenient and readily computed of the SCRD effect size measures are those that take into consideration the amount of nonoverlap between data points recorded in the baseline phase and those within the treatment phase of an intervention. In addition to the aforementioned advantages of effect size measures, I submit that almost all nonoverlap methods for computing treatment effectiveness require minimal to moderate levels of investigator training, can be hand calculated, and procedures are easily completed without the use of statistical software packages. In fact, the instructional templates and examples included herein are intended to provide the support for many intermediate-level researchers to begin implementing their own SCRDs. Each of the nonoverlap methods presented here bear strengths and limitations, and it is the responsibility of researchers to select the most prudent measure for inclusion in their data analysis. Finally, each of the methods presented are distribution-free, nonparametric strategies designed to synthesize graphical representations of data obtained during within-subject SCRDs.
Percentage of Nonoverlapping Data
Scruggs et al. (1987) presented the Percentage of Nonoverlapping Data (PND) procedure as one of the first major alternatives to visual trend analysis alone. This metric is conceptualized as the percentage of treatment phase data that exceeds a single noteworthy point within the baseline phase. One of the prominent strengths of PND is that it can be readily calculated with a ruler and pencil or straight line if using Excel graphs. Additionally, this procedure can be implemented with smaller data sets (i.e., n < 20) and has routinely correlated very well with visual analysis judgments during meta-analysis (Parker, Vannest, & Davis, 2011). One limitation of the PND is that the yielded effect size measure is based on only one data point in the baseline phase and is therefore vulnerable to an outlier that may promote Type 2 error. Specifically, if one of the data points in the baseline phase approaches the ceiling or floor of the score range, it may be possible for no treatment effect to be yielded despite obvious improvements depicted in treatment phase data. Additionally, because PND is designed to be used for hand calculations with graphical representations of data, analysis can become difficult with very large data sets or crowded graphs. Several applications of the PND statistic are available for review in the counseling and counselor education literature (Lenz, Oliver, & Nelson, 2011; Lenz, Perepiczka, & Balkin, 2012; Schottelkorb & Ray, 2009).
Percentage of Data Exceeding the Median
Ma (2006) introduced the Percentage of Data Exceeding the Median (PEM) procedure to accommodate data sets in which outliers in the baseline condition may negatively affect the evaluation of an intervention. This procedure is conceptualized as the analysis of treatment phase data that is contingent on the overlap with the median data point within the baseline phase. Ma (2006, 2009) suggested that PEM is based on the assumption that if the intervention is effective, data will be predominately on the therapeutic side of the median; if an intervention is ineffective, data points in the treatment phase will vacillate above and below the baseline median. Like PND, PEM can be calculated by hand or using Excel files with relative ease and can be reliability implemented with smaller data sets with success. Like PND, PEM has also been demonstrated as a useful tool for completing meta-analyses of SCRDs (Ma, 2009; Preston & Carter, 2009). Some criticisms were noted that if PEM is not prudently selected for use, inflated effect sizes may promote Type 1 error. For this reason, PEM is recommended for use in instances when there is some variability over time or a significant outlier is present within the baseline data. Because this metric is relatively new, the availability of published articles for reference is not as great as that with PND; however, some examples relevant to counselors and counselor educators are available (Lenz & Aguilar, 2012; Lenz, Speciale, & Aguilar, 2012).
Percentage of All Nonoverlapping Data
Parker et al. (2007) presented the Percentage of All Nonoverlapping Data (PAND) procedure to provide an alternative to techniques such as PND and PEM that have received criticism for overemphasizing the importance of a single data point within the baseline phase. Similar to PND and PEM, PAND uses a ratio based on the nonoverlap of data between phases; however, the unique feature introduced by Parker et al. (2007) is the use of all the data from both phases to reach a determination of treatment efficacy. This practice is purported to yield a more robust measure of effect size in data sets including a minimum of 20 observations when compared with PND (Parker et al., 2007). Additionally, by dividing the graphical data into a 2 × 2 table using the nonoverlap line, the PAND method is able to create equal marginal proportions not achieved using PND and PEM. Parker et al. (2007) noted that limitations associated with PAND are the sensitivity to outliers similar to that noted with PND and inability to control for positive trends in the baseline phase as PEM does. To date, I have not seen the PAND procedure implemented in the counseling literature; however, readers are referred to Parker et al. (2007, 2011) for examples of this data analysis application.
Interpreting Treatment Effect Size
Scruggs and Mastropieri (1998) provided a rubric for interpreting effect sizes yielded from nonoverlap data analysis procedures such as PND, PEM, and PAND. Each of the nonoverlap methods described here yields a proportion of data overlap between a baseline and treatment condition expressed in a decimal format that ranges between zero and one. When applying the rubric, higher scores represent greater treatment effects and lower scores represent less effective treatments. Scruggs and Mastropieri (1998) suggested that effect sizes of .90 and greater are indicative of very effective treatments, those ranging from .70 to .89 represent moderate effectiveness, those between .50 to .69 are debatably effective, and scores less than .50 are regarded as not effective.
Method
To facilitate the objective of this article, a brief AB data set and graph were fabricated to provide a reference for calculating each of the three overlap methods. The raw data for the baseline phase (A) are as follows: 22, 25, 23, 26, 20, 22, and 25; scores for the treatment phase (B) are as follows: 26, 25, 22, 22, 18, 21, 18, 20, 21, 18, 16, 16, 14, 14, and 12. These scores were presented on a standard AB-style graph in preparation for data analysis (see Figure 1). For the sake of conceptualization, it will be assumed that the graphical illustrations of data in Figure 1 represent a client’s scores on an anxiety inventory in which higher scores indicate greater levels of subjective anxiety.
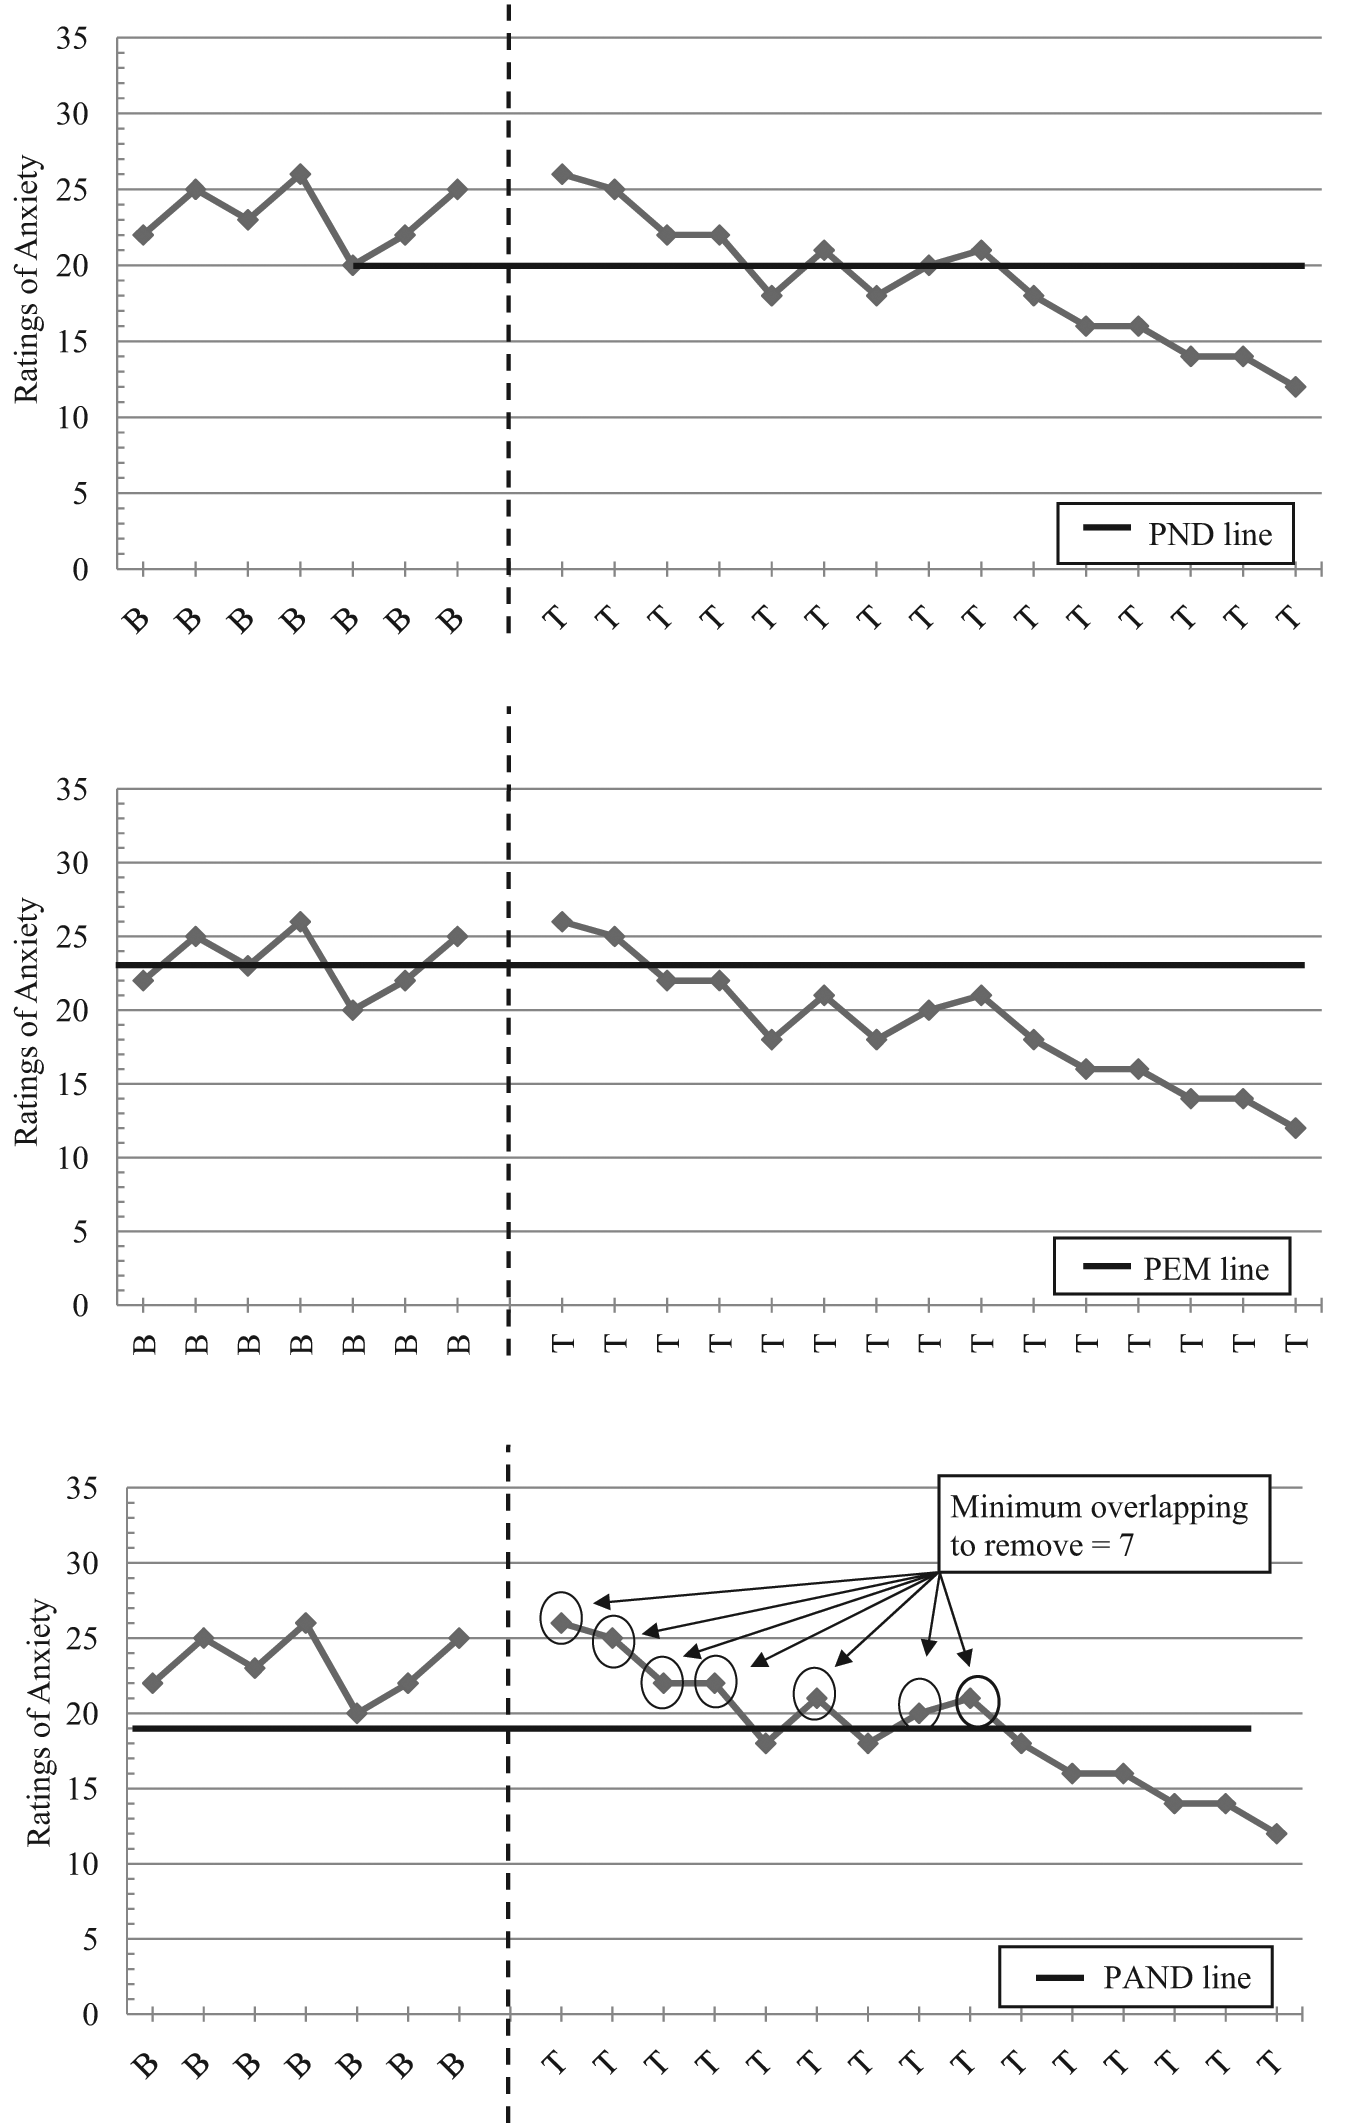
Illustration of three overlap methods for calculating effect size for single-case research designs
Calculations of Overlap Methods
The fabricated data set was entered into an Excel file and a simple AB graph was generated displaying the client’s ratings of anxiety prior to and during a 15-week counseling intervention. Ratings of anxiety are depicted along the ordinate axis with baseline (B1-B7) and treatment (T1-T15) measurement intervals displayed along the abscissa. The baseline and treatment phases were distinguished using a vertical dashed line draw using the Excel shapes function. Three copies of this graph were made and placed in separate tabs labeled as PND, PEM, and PAND. Each of the three nonoverlap methods were calculated independently and by a graduate assistant who has received training and supervision with each of these methods to assure reliability of the effect sizes. Table 1 illustrates the procedure and outcome yielded by the application of PND, PEM, and PAND using the sample data set. Figure 1 provides a visual representation of our preparation prior to computing effect sizes. Finally, each application of the nonoverlap methods was subjected to interpretation based on the aforementioned guidelines presented by Scruggs and Mastropieri (1998).
Calculation Procedures for Three Overlap Methods for Calculating Effect Size for Single-Case Research Designs
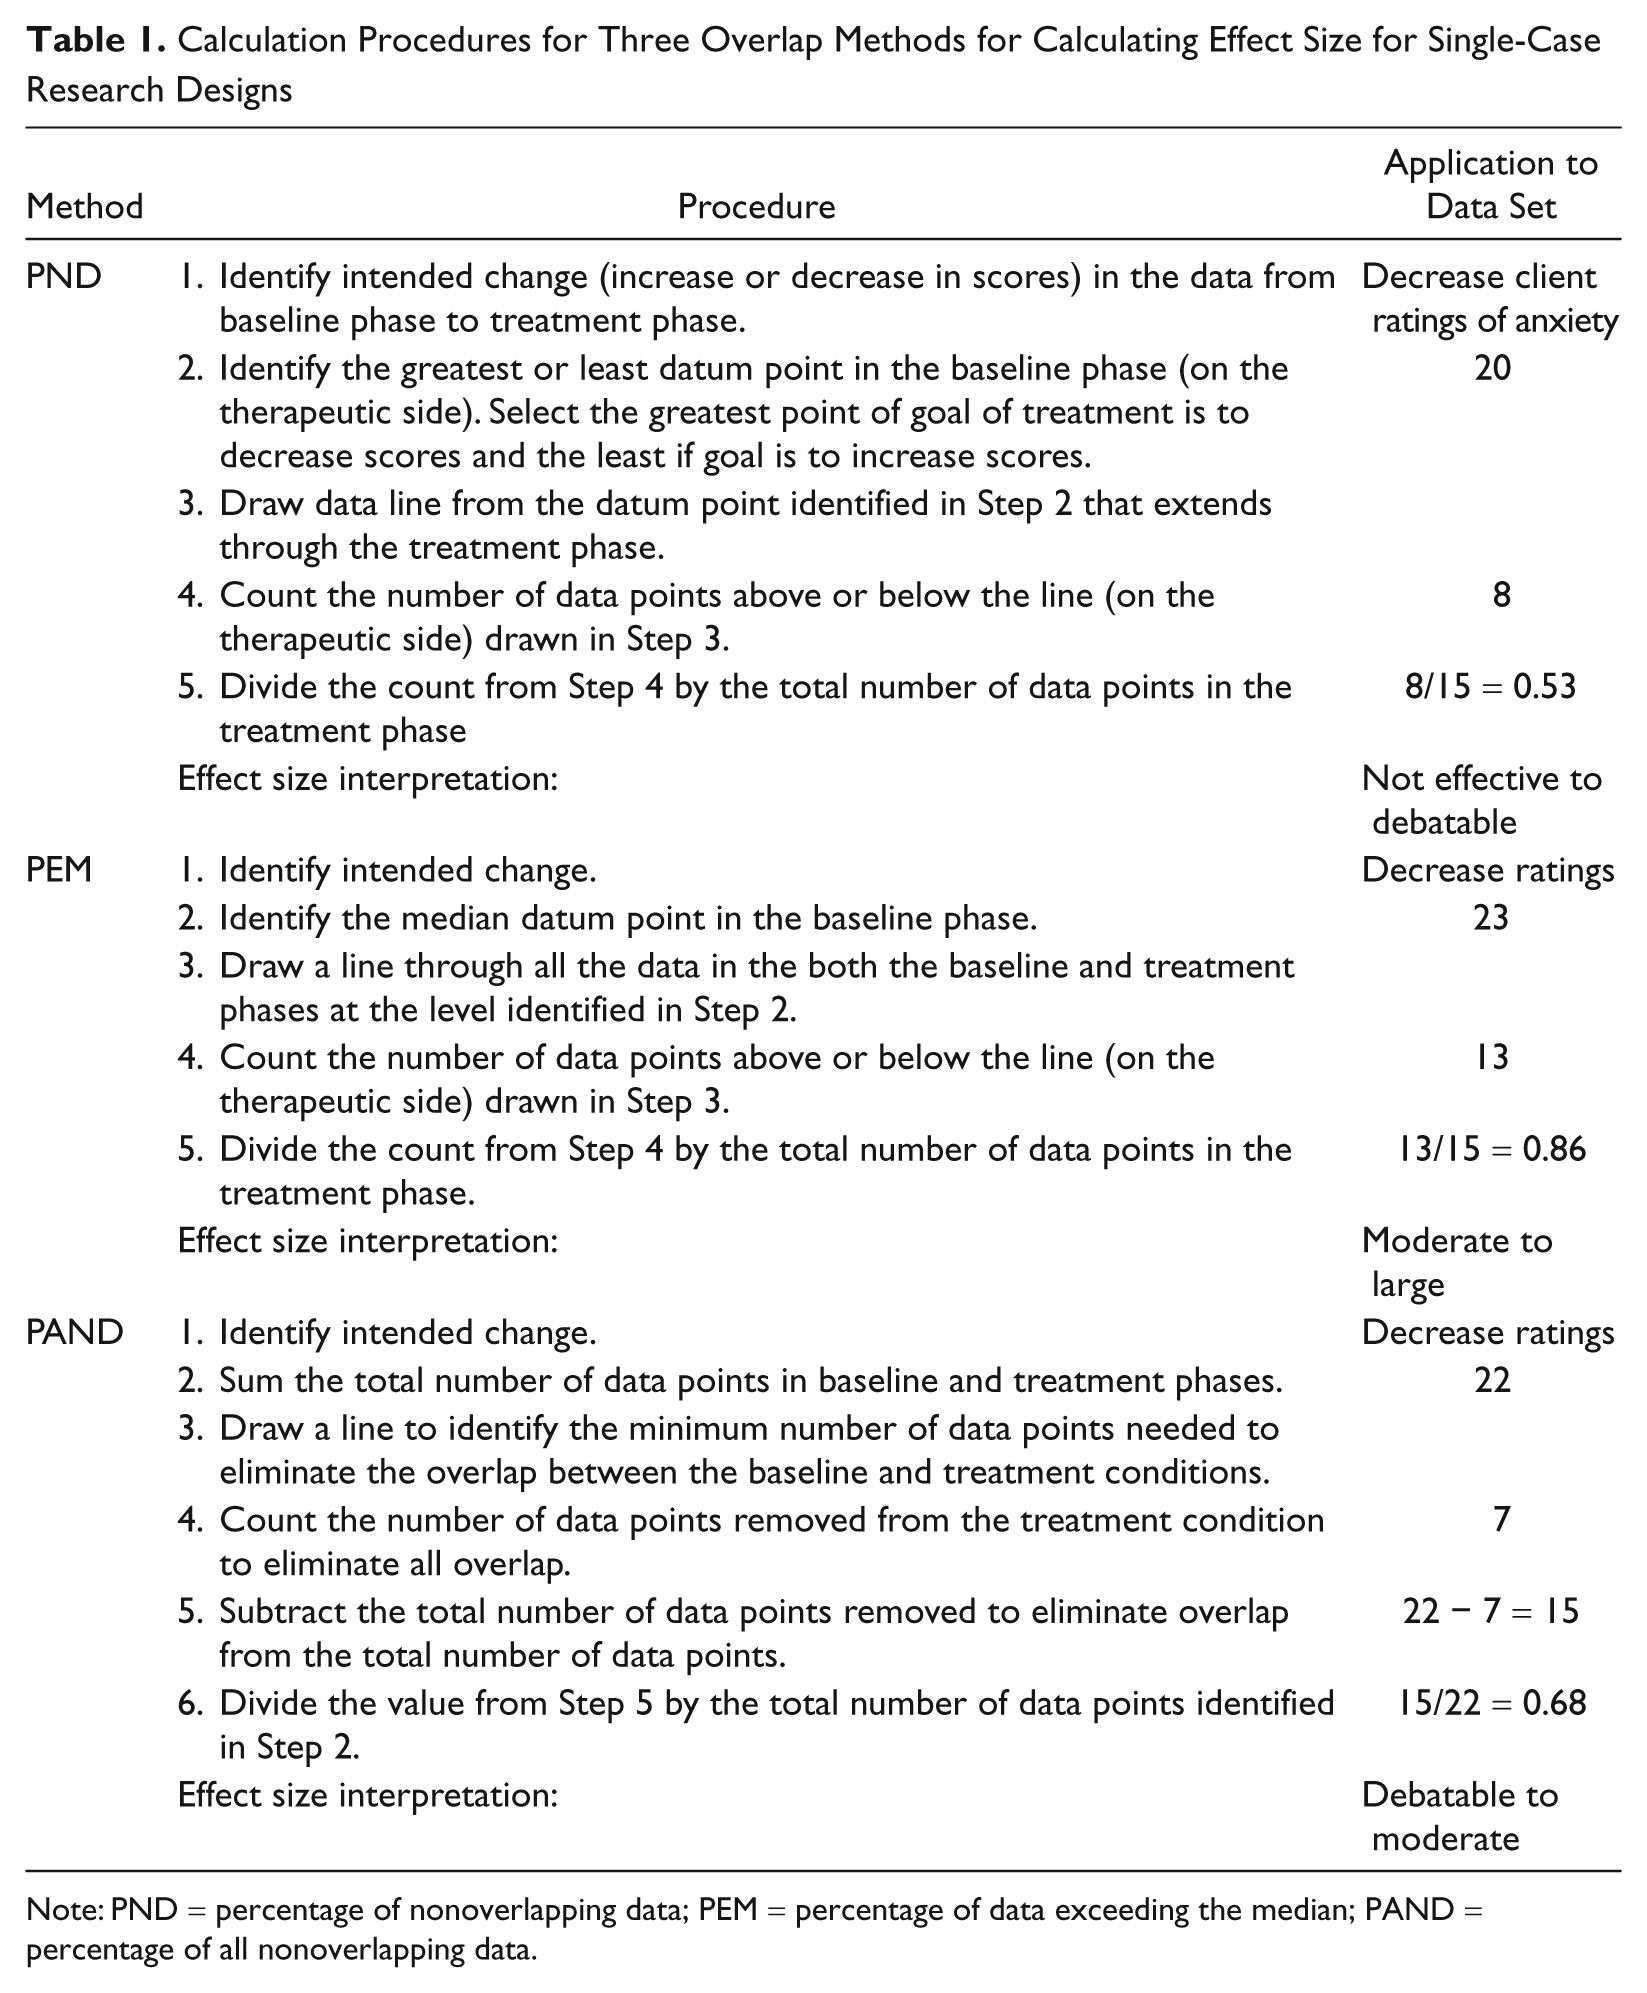
Note: PND = percentage of nonoverlapping data; PEM = percentage of data exceeding the median; PAND = percentage of all nonoverlapping data.
Results
The results of the PND, PEM, and PAND analyses yielded varied determinations of treatment effectiveness when applied to the data set (see Figure 1 and Table 1). The PND statistic for the Ratings of Anxiety (.53) resulted from eight points in the treatment phase recorded below the PND line in the baseline phase (20) indicating the effectiveness of the hypothetical intervention within the low end of the debatably effective range. This is curious given the overtly downward trend of the data throughout the treatment phase with a range of 14 points from the first session to the last.
The PEM statistic for the Ratings of Anxiety (.86) resulted from 13 points in the treatment phase exceeding the baseline median (23) indicating the effectiveness of the hypothetical intervention within the high end of the moderately effective range. The trend analysis for this graphical depiction appears to corroborate this finding given the progressive decrease in scale scores below the baseline median.
The PAND statistic for the Ratings of Anxiety (.68) resulted from the proportion associated with 7 points in the treatment phase being removed to eliminate all overlap between phases indicating the effectiveness of the hypothetical intervention within the high end of the debatably effective range. This metric appears to be a conservative estimate when compared with the visual trend analysis for this graphical depiction of hypothetical client’s scores.
Discussion
The purpose of this article is to provide a practical resource for counselors and counselor educators to reference when analyzing the findings of SCRDs. In the case of this data set, the results of the effect size calculations yielded disparate measures of treatment efficacy and demonstrate the importance of making several considerations for selecting the best procedure to use. Specifically, researchers are encouraged to deliberate about the characteristics of the distributions within the baseline phase, size of data, and the purpose of their research prior to selecting PND, PEM, or PAND to support visual analysis of graphical data.
In the case of the hypothetical data set, the baseline phase data included a significant outlier (20) that influenced the sensitivity making a determination of treatment efficacy. As a consequence, each of the nonoverlap methods provided different effect sizes regarding the effectiveness of the intervention. In this instance, the outlier data point decreased the sensitivity of PND and PAND to accurately yield effect sizes that were logically associated with the visual analysis of graphical data. Although there are no specific cutoff points for deciding against using PEM instead in the presence of an outlier, researchers are encouraged to evaluate the characteristics of the baseline data if the outlier were removed. Figure 1 illustrates that the gross majority (71%) of data points were clustered between 22 and 25; therefore, it may be prudent to implement PEM, which controls for this variable and reflects more accurately the baseline data median trend.
In addition to the characteristics of baseline data, researchers are also encouraged to evaluate the size of their data set when selecting a measure of effect size. Foremost, because nonoverlap methods are based on calculating proportions of data across phases, smaller data sets can inflate and deflate results by decreasing the size of the denominator. Additionally, researchers are encouraged to assure that the amount of observations in the baseline phase of their study adequately establishes a representative picture of the degree to which the phenomenon being studied is present. One guidepost may be to include a minimum of three to five observations in the baseline condition; however, collecting data until a relatively stable trend line is observed may be more prudent. When evaluating larger data sets (n > 20) with an absence of significant outliers, PAND is regarded as a robust measure for evaluating the practical effectiveness of an intervention that is based on data in both the baseline and treatment phases.
Finally, when selecting a measure of effect size to evaluate the outcome of their SCRD, researchers should consider the purpose of their evaluation. Several studies (Parker et al., 2011; Parker & Vannest, 2009; Wolery, Busick, Reichow, & Barton, 2010) demonstrated that some methods of calculating effect size for SCRDs are more conservative when compared with others. When the purpose of research is to make high-stakes determinations in mental health and educational settings, researchers will want to implement a measure that will assist in making responsible inferences. For instance, Wolery et al. (2010) found that PND was more conservative than PEM for making determinations of treatment efficacy. However, in the meta-analytic comparison provided by Wolery et al., the authors did not screen data for appropriateness of fit between procedures. This highlights the fact that there is no simple rule choosing an effect size measure based on simple rules of rigor or conservativeness and highlights the importance for researchers to consider their data on an individual basis to avoid making Type 1 and Type 2 errors when interpreting their findings.
Conclusion
Since the momentum for implementing and reporting the findings of SCRDs has accelerated, only a modest amount of studies reported in the counseling and counselor education literature implement rigorous data analysis practices. Although SCRDs may not be preferred for every research question, nonoverlap methods for computing treatment effect sizes provide a valuable tool for supporting accountability between practitioners, clients, funding sources, and community stakeholders. Furthermore, the use of nonoverlap methods to calculate treatment effect size as an adjunct to visual analysis may help further repudiate the use of SCRDs in community and educational settings in instances when between-groups designs may not be sensible. As with any other statistical procedure, PND, PEM, and PAND should be implemented prudently after considering baseline data characteristics, the size of data sets, and the purpose for evaluating a phenomenon. In addition to the aforementioned publications that include PND, PEM, and PAND analyses (Lenz & Aguilar, 2012; Lenz et al., 2011; Lenz, Perepiczka, et al., 2012; Lenz, Speciale, et al., 2012; Schottelkorb & Ray, 2009), researchers interested in practicing the application of these methods are encouraged to conduct analyses using examples of counseling research in which the methods can be readily applied (see Heppner & Hendricks, 1995; Martin-Causey & Hinkle, 1995; Powell & Newgent, 2010). Although this article is practical in nature, researchers are encouraged to increase their familiarity with SCRDs and explore the many applications of this methodology that can support and advance the counseling profession.
Footnotes
Declaration of Conflicting Interests
The author(s) declared no potential conflicts of interest with respect to the research, authorship, and/or publication of this article.
Funding
The author(s) received no financial support for the research, authorship, and/or publication of this article.