



Abstract
This study investigated the Consequences of Perfectionism Scale (COPS) and its relationships with perfectionism, performance perfectionism, affect, and depressive symptoms in 202 university students using confirmatory factor analysis, correlations, and regression analyses. Results suggest that the COPS is a reliable and valid measure of positive and negative consequences of perfectionism.
Perfectionism is a personality characteristic defined by striving for flawlessness and setting exceedingly high standards for performance accompanied by tendencies for overly critical self-evaluations and concerns about negative evaluations by others (Flett & Hewitt, 2002; Frost, Marten, Lahart, & Rosenblate, 1990). Perfectionism is a common characteristic that can affect all domains of life. In a study investigating domains of life affected by perfectionism, more than 92% of respondents indicated that there was at least one domain in which they were perfectionistic (Stoeber & Stoeber, 2009).
Perfectionism is best conceptualized as a multidimensional and multifaceted personality characteristic (Frost et al., 1990; Hewitt & Flett, 1991; Slaney, Rice, Mobley, Trippi, & Ashby, 2001; see Enns & Cox, 2002, for a review). In particular, two main dimensions of perfectionism need to be differentiated (Frost, Heimberg, Holt, Mattia, & Neubauer, 1993; Stoeber & Otto, 2006). The first dimension—perfectionistic strivings—captures those aspects of perfectionism associated with striving for perfection and setting exceedingly high standards of performance. The second dimension—perfectionistic concerns—captures those aspects associated with concerns over making mistakes, feelings of discrepancy between one’s expectations and achievements, and fear of negative evaluation by others. Research has shown that the two dimensions show different, often opposite relationships. The perfectionistic strivings dimension comprises aspects of perfectionism that are associated with positive characteristics, processes, and outcomes such as conscientiousness, active coping, and positive affect. In contrast, the perfectionistic concerns dimension comprises aspects that are associated with negative characteristics, processes, and outcomes such as neuroticism, avoidant coping, negative affect, and depressive symptoms (Frost et al., 1993; see Stoeber & Otto, 2006, for a review).
Qualitative research on perfectionism suggests that most perfectionists are well aware that perfectionism has positive and negative consequences. Slaney and Ashby (1996) conducted interviews with perfectionists and asked them to evaluate their perfectionism. When responses were analyzed, 23% described only positive consequences whereas 22% described mostly positive, 32% both positive and negative, 12% mostly negative, and 8% only negative consequences. 1 However, despite Slaney and Ashby’s findings, quantitative research on perfectionism so far has only paid scant attention to people’s perceptions that perfectionism has positive and negative consequences and to the question how to assess these consequences.
In 1995, Rhéaume and colleagues presented a multidimensional perfectionism scale that contained a subscale capturing negative consequences of perfectionism (Rhéaume, Freeston, & Ladoucer, 1995). However, details of the psychometric properties of the original (French) scale or its English translation (Rhéaume, Freeston, & Ladouceur, 1994) were never published. Moreover, it is unclear if all items of the scale capture consequences of perfectionism because some items (e.g., “It often seems to me that I should have done a little more,” “If I lowered my personal criteria, I would feel a lesser person”) are very similar to items that other perfectionism scales use to measure perfectionistic concerns (cf. Frost et al., 1990; Hill et al., 2004; Slaney et al., 2001). Finally, the scale only captured negative consequences, ignoring positive consequences.
The Consequences of Perfectionism Scale
Against this background, Kim (2010) developed a new self-report scale capturing perceived positive and negative consequences of perfectionism. In a first step, she generated a list of 30 items describing perceptions of positive and negative consequences of perfectionism (e.g., “Being perfectionistic encourages me to be successful,” “Being perfectionistic discourages me from being successful”). To investigate the factorial structure of the initial version, an exploratory factor analysis was conducted on the item responses from an undergraduate student sample. A clear two-factor structure emerged with one factor on which the positive consequences showed high loadings and one factor on which the negative consequences items showed high loadings. Because Kim aimed to develop a brief scale, only the 10 items with the highest factor loadings were retained for the final version of the scale: six items describing positive consequences of perfectionism and four describing negative consequences. When examining the reliability (internal consistency) of the two resulting subscales using Cronbach’s alpha, both scales showed high reliability. Hence, the 10-item version was accepted as the final version, and the scale was named Consequences of Perfectionism Scale (COPS; see Table 1).
Consequences of Perfectionism Scale (COPS; Kim, 2010): Scales, Items, Descriptive Statistics, Factor Loadings, Standard Errors, and Factor Correlations.
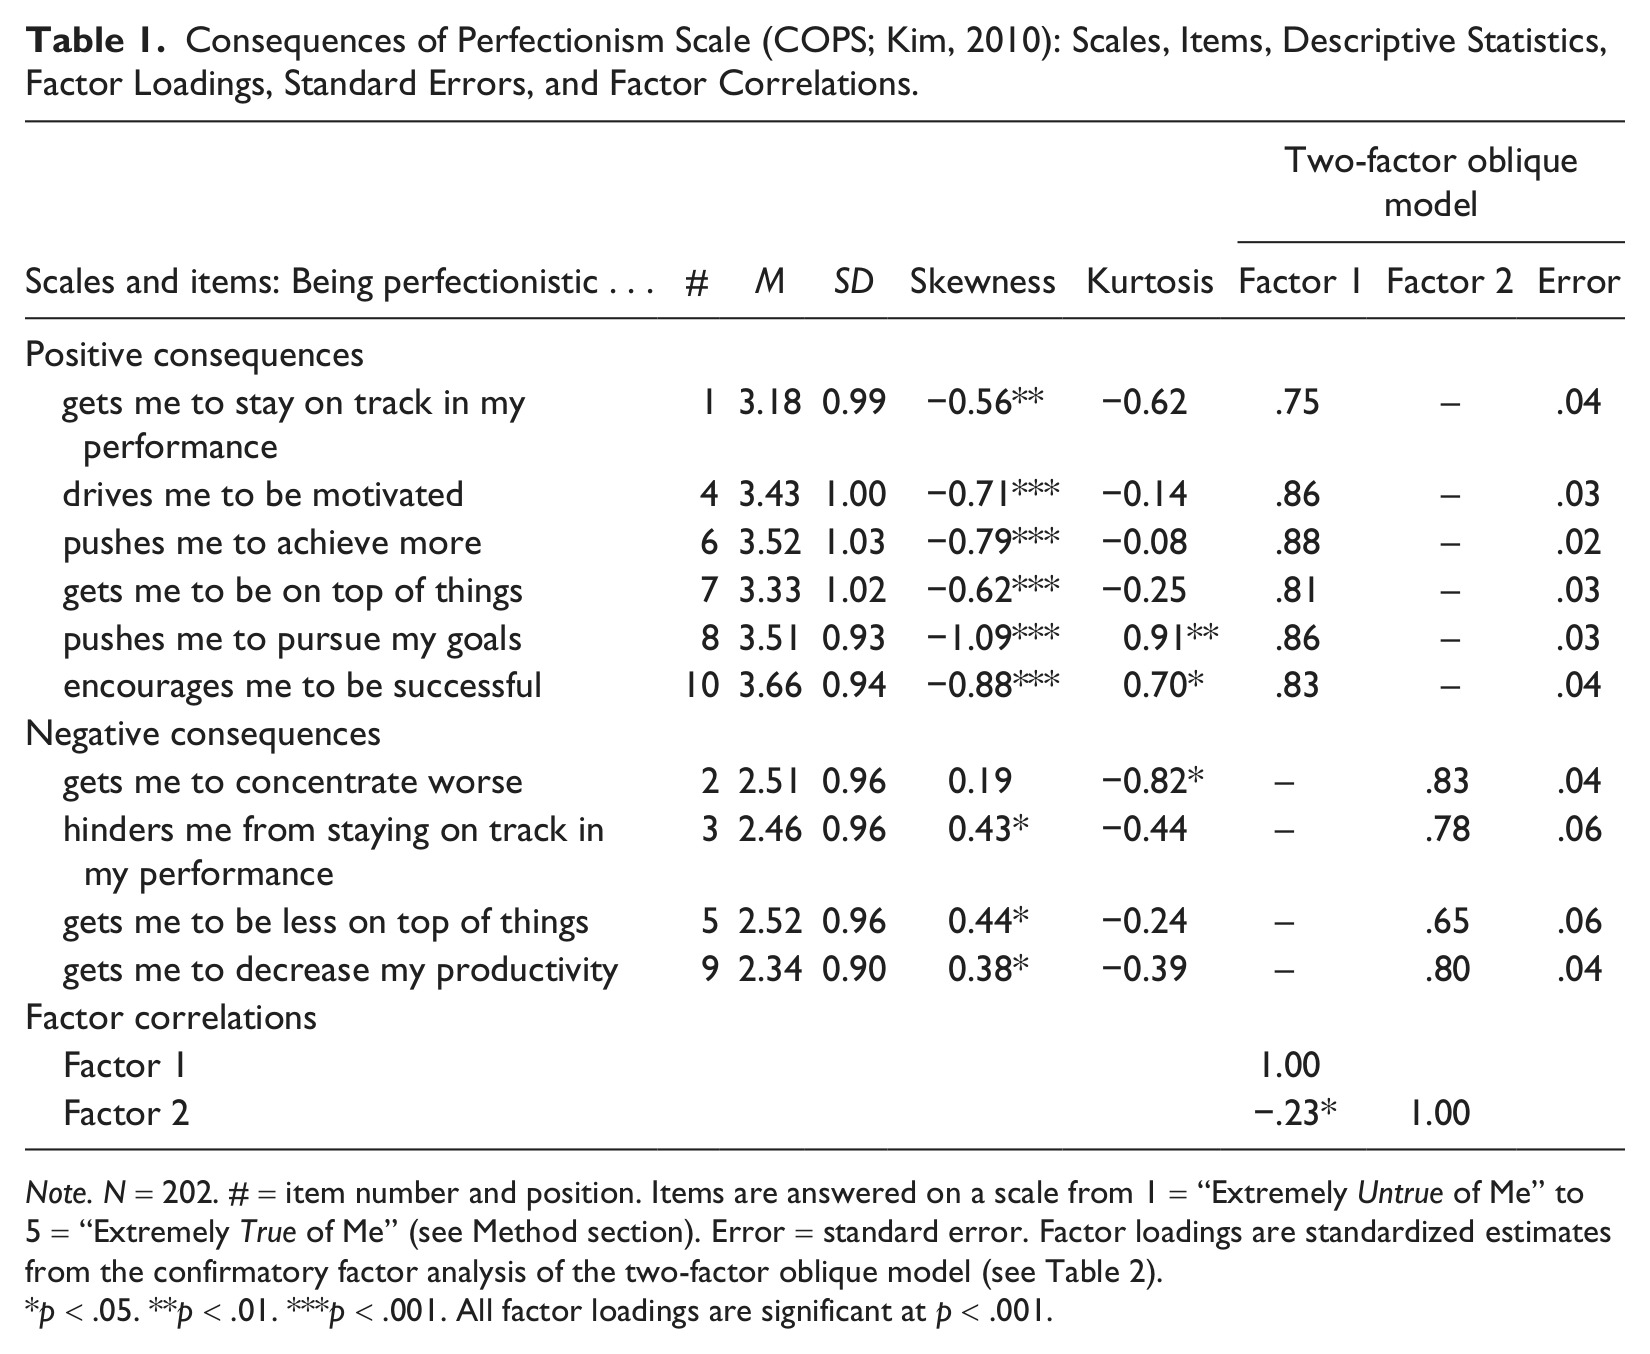
Note. N = 202. # = item number and position. Items are answered on a scale from 1 = “Extremely Untrue of Me” to 5 = “Extremely True of Me” (see Method section). Error = standard error. Factor loadings are standardized estimates from the confirmatory factor analysis of the two-factor oblique model (see Table 2).
p < .05. **p < .01. ***p < .001. All factor loadings are significant at p < .001.
In a next step, Kim investigated the construct validity of the COPS and its subscales. Another sample of undergraduate students completed the COPS along measures of perfectionism, subjective well-being, and psychological maladjustment. To measure perfectionism, the Multidimensional Perfectionism Scale (Hewitt & Flett, 1991, 2004) was used, which captures two forms of perfectionism: self-oriented perfectionism and socially prescribed perfectionism. Self-oriented perfectionism comprises beliefs that striving for perfection and being perfect are important and is characterized by setting exceedingly high standards for oneself. In contrast, socially prescribed perfectionism comprises beliefs that others have high standards for oneself and that acceptance by others is conditional on fulfilling these standards. Moreover, whereas self-oriented perfectionism forms part of the perfectionistic strivings dimension, socially prescribed perfectionism forms part of the perfectionistic concerns dimension (Frost et al., 1993; Stoeber & Otto, 2006). To measure subjective well-being, the Positive and Negative Affect Schedule (Watson, Clark, & Tellegen, 1988), the Satisfaction with Life Scale (Diener, Emmons, Larsen, & Griffin, 1985), and the Subjective Happiness Scale (Lyubomirsky & Lepper, 1999) were used capturing general positive and negative affect, satisfaction with life, and subjective happiness. To measure psychological maladjustment, the Beck Anxiety Inventory (Beck, Epstein, Brown, & Steer, 1988) and the Beck Depression Inventory (Beck, Ward, Mendelson, Mock, & Erbaugh, 1961) were used capturing anxiety and depressive symptoms in the past week.
When the bivariate correlations of the COPS subscales were analyzed, positive and negative consequences showed a substantial negative correlation. Else, they displayed the expected correlation pattern characteristic of positive and negative aspects of perfectionism. Regarding perfectionism, positive consequences showed a positive correlation with self-oriented perfectionism. Negative consequences showed a positive correlation with socially prescribed perfectionism and a negative correlation with self-oriented perfectionism. Regarding subjective well-being, positive consequences showed a positive correlation with positive affect and satisfaction with life. Negative consequences showed a positive correlation with negative affect and negative correlations with positive affect, satisfaction with life, and subjective happiness. In addition, negative consequences showed positive correlations with both indicators of psychological maladjustment (anxiety and depressive symptoms in the past week).
Open Questions
Despite these promising results, there remained a number of questions. First, the factor structure of the final version of the COPS needed to be confirmed. Kim (2010) only examined the factor structure of the initial 30-item version but not that of the final 10-item version. Second, Kim only investigated the relationships with one measure of general perfectionism, the Multidimensional Perfectionism Scale (Hewitt & Flett, 1991). While self-oriented perfectionism has been shown to load on the positive factor of perfectionistic strivings (Frost et al., 1993; Stoeber & Otto, 2006), other studies have found self-oriented perfectionism to be an ambivalent form of perfectionism that has positive and negative aspects and is often associated with higher stress and anxiety (see Hewitt & Flett, 2004, for a review). Consequently, it would be important to investigate how the COPS subscales relate to a measure of general perfectionism that better captures the positive aspects of perfectionism. Third, many items of the COPS refer to perceived effects that perfectionism has on performance (e.g., “Being perfectionistic gets me to stay on track in my performance,” “Being perfectionistic pushes me to achieve more”). Therefore, it would be informative to examine how the COPS subscales correlate with performance perfectionism (E. C. Chang, 2006) and whether performance perfectionism predicts variance in the COPS subscales above what is predicted by general perfectionism. Finally, there was the question whether perceived consequences of perfectionism measured with the COPS would show incremental validity, for example, by explaining variance in subjective well-being and psychological maladjustment above what is explained by measures of perfectionism.
The Present Study
The present study had three aims. First, it examined the factorial structure of the COPS using confirmatory factor analysis (e.g., Brown, 2006). Second, it examined the COPS’s construct validity by investigating the subscales’ relationships with general perfectionism, performance perfectionism, subjective well-being (positive and negative affect in the past week), and psychological maladjustment (depressive symptoms in the past week). Third, it aimed to examine the incremental validity of the COPS by investigating if the COPS subscales would predict variance in subjective well-being and psychological maladjustment above the variance explained by general perfectionism and performance perfectionism. As a measure of general perfectionism, we chose the revised Almost Perfect Scale (Slaney et al., 2001) because it clearly differentiates positive (high standards) and negative aspects (discrepancy) of general perfectionism (Rice & Ashby, 2007). As a measure of performance perfectionism, we chose the Performance Perfectionism Scale (E.C. Chang, 2006) because it differentiates between positive and negative performance outcomes of self-oriented and socially prescribed perfectionism.
We expected the COPS items to conform to a factor structure with two correlated factors (two-factorial oblique model). Moreover, we expected COPS positive consequences to show positive correlations with high standards in general perfectionism and positive performance perfectionism and COPS negative consequences to show positive correlations with discrepancy in general perfectionism and negative performance perfectionism. Furthermore, we expected performance perfectionism to predict variance in COPS positive and negative consequences above general perfectionism. In addition, we expected COPS positive consequences to show positive correlations with positive affect and COPS negative consequences to show positive correlation with negative affect and depressive symptoms. Finally, to explore the incremental validity of the measure, we examined if COPS positive and negative consequences explained variance in positive affect, negative affect, and depressive symptoms above what was explained by general perfectionism and performance perfectionism.
Method
Participants
A sample of 210 student participants studying at the University of Kent (46 male, 164 female) were recruited. The mean age of participants was 20.5 years (SD = 4.9 years). Using the categories from the university’s equal opportunity monitoring form, participants indicated their ethnicity as White (80%), Asian (10%), Black (7%), and mixed race (3%).
Procedure
Participants were recruited via postings on the website of the School of Psychology’s Research Participation Scheme where the study was announced as a questionnaire study on personal standards, social expectations, and well-being. In exchange for participation, participants received extra course credit or entered a raffle for a chance to win £50 (approximately US$80).
Measures
Consequences of Perfectionism
The 10-item COPS (Kim, 2010) was used to measure consequences of perfectionism, with six items capturing positive consequences and four items negative consequences (see Table 1). Instructions asked participants to indicate their level of agreement or disagreement with each statement, and participants responded on a scale from 1 (extremely untrue of me) to 5 (extremely true of me).
General Perfectionism
To measure general perfectionism, we used two scales from the revised Almost Perfect Scale (Slaney et al., 2001): High Standards capturing perfectionistic standards (7 items; e.g., “I set very high standards for myself”) and Discrepancy capturing feelings of discrepancy between expectations and outcomes (12 items; “My performance rarely measures up to my standards”). Participants responded on a scale from 1 (strongly disagree) to 7 (strongly agree).
Performance Perfectionism
To measure performance perfectionism, we used the Performance Perfectionism Scale (E. C. Chang, 2006). The scale comprises 12 items capturing positive self-oriented performance perfectionism (3 items; e.g., “My performance is always made better by the high standards I set for myself”), negative self-oriented performance perfectionism (3 items; “My high standards prevent me from doing my best”), positive socially prescribed performance perfectionism (3 items; “My performance is always made better when others expect more from me”), and negative socially prescribed perfectionism (3 items; “My work suffers when others push me to meet their high standards”). Participants were asked to what extent the items were generally true of them and responded on a scale from 1 (extremely untrue) to 7 (extremely true).
Affect and Depressive Symptoms, Past Week
To measure positive and negative affect in the past week, we used the Positive and Negative Affect Schedule (Watson et al., 1988). To keep the questionnaire brief, we used the short form published by Stoeber, Harvey, Ward, and Childs (2011) who consulted Table 5 of Watson and colleagues’ (1988) article and used only the five items with the highest loadings on the positive affect factor to measure positive affect (e.g., “excited”) and the five items with the highest loadings on the negative affect factor to measure negative affect (e.g., “distressed”). Participants were asked how they felt during the past week and responded to the items on a scale from 1 (very slightly or not at all) to 5 (extremely). To measure depressive symptoms in the past week, we used the short form of the Center for Epidemiological Studies–Depression scale (Radloff, 1977) developed and validated by Cole, Rabin, Smith, and Kaufman (2004). The scale comprises 10 items capturing depressive symptoms (e.g., “I felt my life had been a failure”). Participant were asked how they felt during the past week and responded to the items on a scale from 1 (rarely or none of the time [less than 1 day]) to 4 (all of the time [5–7 days]).
Preliminary Analyses
Missing Data and Outliers
Two participants did not complete all parts of the questionnaire and were excluded from the analyses. Furthermore, six participants were excluded who were multivariate outliers (Mahalanobis distance with p < .001; see Tabachnick & Fidell, 2007). With this, the final sample size for our analyses was N = 202. To examine the data for possible gender differences, we computed a MANOVA across all measures with gender as the between-participants factor. The effect of gender was nonsignificant with F(11, 190) = 1.02, p > .42. Consequently, we collapsed the data across gender. For all scales, mean scores were computed by averaging responses across items. Table 3 shows the descriptive statistics and reliabilities (Cronbach’s alphas).
Normality
Before conducting the confirmatory factor analysis to test the factorial structure of the COPS, we calculated the mean, standard deviation, skewness, and kurtosis of each item to check for deviations from normality (Tabachnick & Fidell, 2007). Results showed that all items displayed significant deviations: seven items displayed significant skewness, one significant kurtosis, and two significant skewness and kurtosis (see Table 1).
Analytic Strategy
To examine the factorial structure of the COPS, we computed a confirmatory factor analysis using Mplus Version 5.2 (Muthén & Muthén, 2007). Because most items showed significant deviations from normality (skewness, kurtosis), we used robust maximum likelihood estimation, which provides robust parameter and model fit estimates for data that deviate from normality (Brown, 2006; Byrne, 2012). Next, we investigated the bivariate correlations of the two COPS subscales. Finally, we conducted two sets of hierarchical regression analyses. In the first set, we regressed the COPS subscales on perfectionism to investigate what dimensions of perfectionism (general perfectionism, performance perfectionism) predicted positive and negative consequences of perfectionism. In the second set, we regressed subjective well-being in the past week (positive affect, negative affect, depressive symptoms) on the COPS subscales controlling for perfectionism (general perfectionism, performance perfectionism) to investigate whether positive and negative consequences of perfectionism predicted variance in affect and depressive symptoms above variance predicted by perfectionism.
Results
Confirmatory Factor Analysis
Following the factor structure proposed by Kim (2010), we conducted a confirmatory factor analysis testing a two-factor, first-order confirmatory model (consecutively termed two-factor oblique model), that is, a model with two correlated factors in which the items of the two COPS subscales were specified to load only on their target factor and both factors were allowed to correlate (see Table 1). This model was then compared with the baseline model (no factors, all items uncorrelated) and the one-factor model (all items forced to load on one factor).
To evaluate model fit, it is generally recommended that multiple measures be considered to capture different aspects of fit (Hoyle & Panter, 1995). Given the well-known problems with the chi-square statistic as a measure of model fit, most notably its extreme sample size sensitivity (Hu & Bentler, 1995; Kaplan, 1990), use of this statistic was restricted to testing the differences between the two nested models (i.e., the one-factor and the two-factor oblique model). Instead, the following measures were used to evaluate model fit: the comparative fit index (CFI), the Tucker–Lewis fit index (TLI; also known as nonnormed fit index [NNFI]), the root mean square error of approximation (RMSEA), and the standardized root mean square residual (SRMR). Regarding the CFI and TLI, larger values indicate better model fit, with values above .90 indicating acceptable model fit and values above .95 good model fit (Hu & Bentler, 1999). Regarding RMSEA and SRMR, smaller values indicate better model fit: RMSEA values below .08 indicate acceptable model fit and values close to .05 good model fit; and SRMR values below .05 indicate good model fit (Hu & Bentler, 1995, 1999; for a discussion of these estimates, see Bentler & Bonett, 1980; Browne & Cudeck, 1993).
As Table 2 shows, all fit indices for the hypothesized two-factor oblique model indicated a good model fit (CFI and TLI above .95, SRMR below .05) except the RMSEA, which indicated an acceptable model fit (RMSEA below .08). Moreover, the two-factor oblique model showed a markedly better fit than the one-factor model, which did not show an acceptable fit (see Table 2). To compare the two-factor oblique model with the one-factor model, a chi-square difference test was conducted. Because the data were nonnormal and robust estimates were used (robust maximum likelihood), a scaling correction was necessary so that the chi-square difference followed a chi-square distribution (see Satorra & Bentler, 2001; Ullman, 2006). The resulting Satorra–Bentler scaled chi-square (S-B χ2) difference test was significant with χ2(1) = 157.19, p < .001, indicating that the two-factor oblique model showed a significantly better fit than the one-factor model. Consequently, the two-factor oblique model was accepted. Table 1 shows the item loadings on the two oblique factors and the factor correlation. All items displayed substantial loadings on their target factor. Moreover, in line with Kim’s (2010) findings, the two factors showed a significant negative correlation.
Goodness-of-Fit Indices.

Note. N = 202. df = degrees of freedom; S-B χ2 = Satorra–Bentler scaled chi-square. All fit indices are based on the robust maximum likelihood procedure. CFI = comparative fit index; TLI = Tucker–Lewis fit index (also known as nonnormed fit index [NNFI]); RMSEA = residual mean square error of approximation; SRMR = standardized root mean square residual.
Correlation Analyses
Next, we examined the bivariate correlations of the COPS subscales. Results were as expected (see Table 3). Regarding general perfectionism, positive consequences showed a positive correlation with high standards (r = .65), whereas negative consequences showed a positive correlation with discrepancy (r = .23). Regarding performance perfectionism, positive consequences showed positive correlations with positive self-oriented perfectionism (r = .69) and positive socially prescribed perfectionism (r = .27), and a negative correlation with negative self-oriented perfectionism (r = −.22). In contrast, negative consequences showed positive correlations with negative self-oriented perfectionism (r = .46) and negative socially prescribed perfectionism (r = .31), and a negative correlation with positive self-oriented perfectionism (r = −.16). Regarding subjective well-being in the past week, positive consequences showed a positive correlation with positive affect (r = .32) and a negative correlation with depressive symptoms (r = −.20). Negative consequences showed positive correlations with negative affect (r = .28) and depressive symptoms (r = .17; see Table 3 for associated significance levels).
Correlations and Descriptive Statistics.
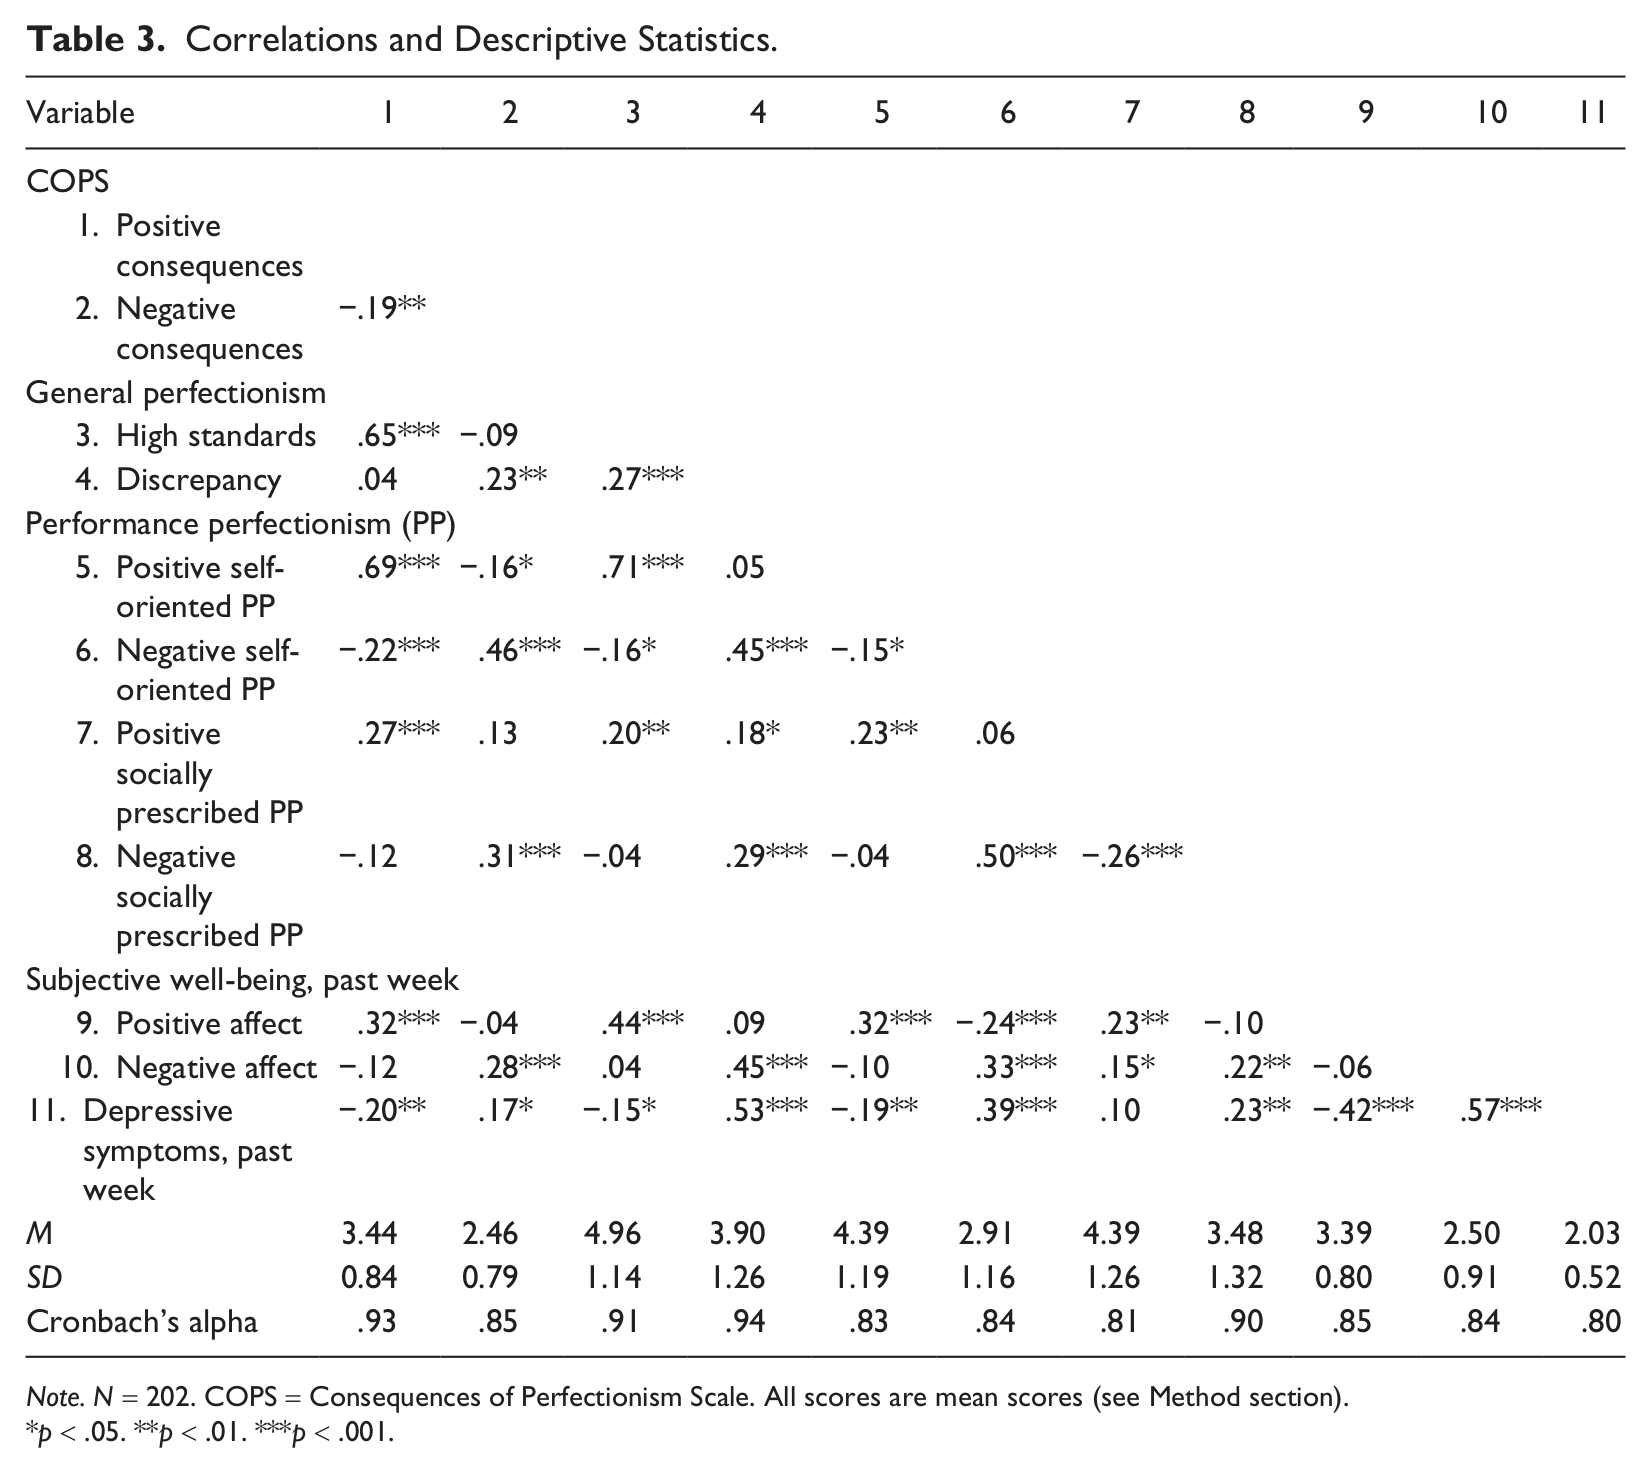
Note. N = 202. COPS = Consequences of Perfectionism Scale. All scores are mean scores (see Method section).
p < .05. **p < .01. ***p < .001.
Hierarchical Regression Analyses
Next, we conducted hierarchical regression analyses. First, we examined how general perfectionism and performance perfectionism predicted consequences of perfectionism. The regression analyses comprised three steps. In Step 1 we controlled for the overlap between positive and negative consequences (r = −.19; see Table 3), in Step 2 we entered general perfectionism (high standards, discrepancy), and in Step 3 we entered performance perfectionism (positive and negative self-oriented and socially prescribed perfectionism). Table 4 shows the results. All findings were as expected providing further evidence for the construct validity of the COPS subscales. In the prediction of positive consequences, general perfectionism in Step 2 was a significant predictor with high standards having a positive effect and discrepancy having a negative effect. In addition, performance perfectionism in Step 3 was a significant predictor explaining further variance over and above general perfectionism with positive self-oriented perfectionism and positive socially prescribed perfectionism having positive effects. In the prediction of negative consequences, general perfectionism in Step 2 was again a significant predictor, but this time discrepancy had a positive effect. Likewise performance perfectionism in Step 3 was again a significant predictor with negative self-oriented perfectionism and negative socially prescribed perfectionism having positive effects. Unexpectedly, positive socially prescribed perfectionism too had a positive effect suggesting that positive socially prescribed perfectionism is an ambivalent characteristic associated with positive and negative consequences (see also Table 3 in which positive socially prescribed perfectionism showed positive correlations with both positive affect and negative affect in the past week).
Summary of Regression Analyses.
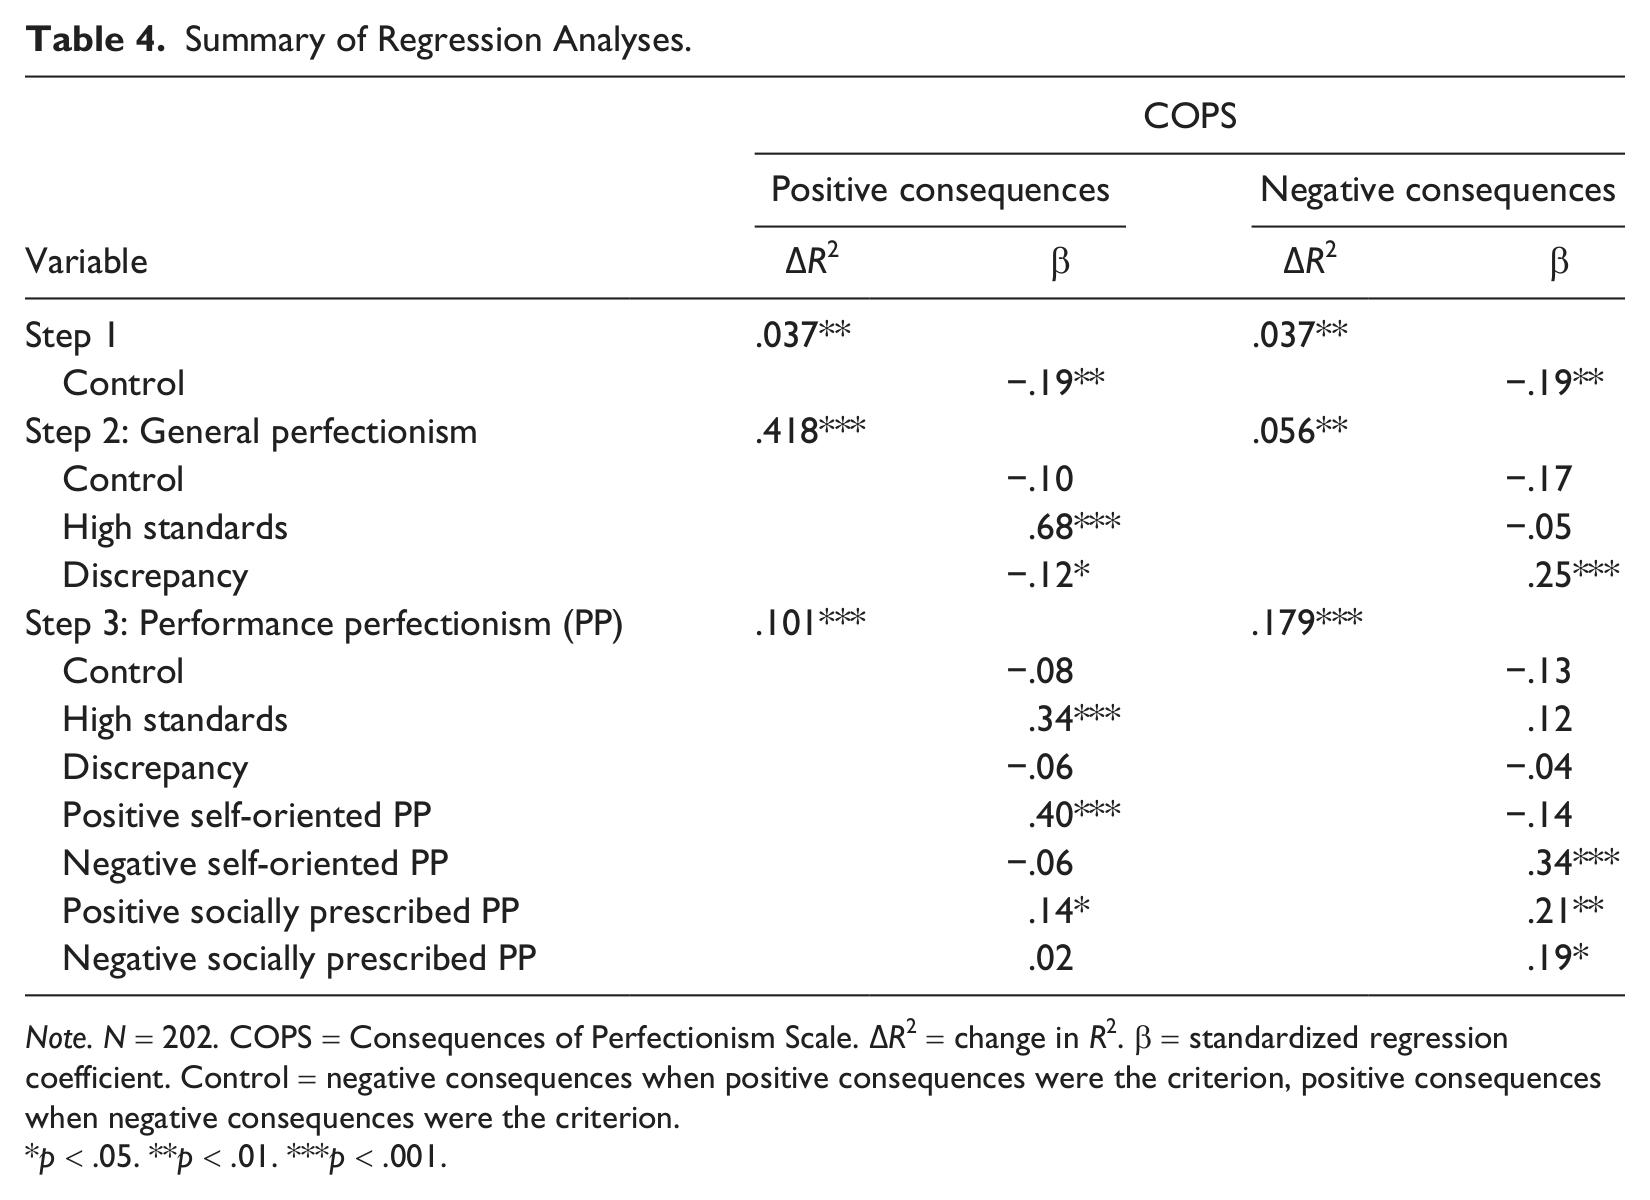
Note. N = 202. COPS = Consequences of Perfectionism Scale. ΔR2 = change in R2. β = standardized regression coefficient. Control = negative consequences when positive consequences were the criterion, positive consequences when negative consequences were the criterion.
p < .05. **p < .01. ***p < .001.
Finally, we examined whether the COPS subscale scores predicted positive affect, negative affect, and depressive symptoms in the past week above general perfectionism and performance perfectionism. Again the regression analyses comprised three steps. In Step 1 we entered general perfectionism (high standards, discrepancy), in Step 2 performance perfectionism (positive and negative self-oriented and socially prescribed perfectionism), and in Step 3 consequences of perfectionism (positive and negative consequences). However, in none of the three variables, consequences of perfectionism in Step 3 explained variance above the variance explained by general perfectionism and performance perfectionism in Steps 1 and 2 (ΔR2s ≤ .016, ps ≥ .127). 2 Positive and negative consequences of perfectionism did not show any incremental predictive validity above general perfectionism and performance perfectionism regarding affect and depressive symptoms in the past week.
Discussion
The findings of this study provide further support for the reliability and validity of Kim’s (2010) COPS and its two subscales: positive consequences and negative consequences. Both subscales showed high reliability (internal consistency). Moreover, expanding on Kim’s exploratory factor analysis of the COPS items, this study’s confirmatory factor analysis found a two-factorial oblique structure to show good fit, providing further support for the factorial validity of COPS. When correlations with multidimensional measures of general perfectionism and performance perfectionism were examined, the COPS scales displayed the expected pattern of correlations. Positive consequences showed positive correlations with positive aspects of general perfectionism (high standards) and performance perfectionism (positive self-oriented and positive socially prescribed perfectionism) and negative correlations with negative aspects of performance perfectionism (negative self-oriented perfectionism). In contrast, negative consequences showed positive correlations with negative aspects of general perfectionism (discrepancy) and performance perfectionism (negative self-oriented and negative socially prescribed perfectionism) and negative correlations with positive aspects of performance perfectionism (positive self-oriented perfectionism).
Hierarchical regression analyses predicting positive and negative consequences from general perfectionism and performance perfectionism provided further evidence for the construct validity of the two COPS scales showing that positive consequences of perfectionism were predicted by positive aspects of general perfectionism and performance perfectionism whereas negative consequences were predicted by negative aspects. Also, when regarding affect and depressive symptoms in the past week, the two COPS scales showed the expected correlation patterns. Positive consequences showed positive correlations with positive affect and negative correlations with depressive symptoms whereas negative consequences showed positive correlations with negative affect and depressive symptoms.
The only exception in the pattern of positive versus negative associations that the two COPS scales showed was found for positive socially prescribed performance perfectionism, which, in the regression analyses, predicted higher level of both positive and negative consequences. Consequently, differently from previous studies (E. C. Chang, 2006; R. Chang & Chang, 2009), this study found positive socially prescribed perfectionism—which also showed positive correlations with both positive and negative affect—to be an ambivalent rather than a purely positive characteristic. Note, however, that the positive relationship between positive socially prescribed performance perfectionism and negative consequences was significant only in the regression analyses but not in the bivariate correlations. This may indicate that, when shared variance with other positive aspects of perfectionism are controlled for (e.g., high standards, positive self-oriented performance perfectionism), positive socially prescribed perfectionism loses its positive connotation and, like general socially prescribed perfectionism, becomes a negative characteristic.
Limitations and Future Directions for Research
The present study has a number of limitations. First, the finding that positive socially prescribed performance perfectionism is associated with higher levels of negative consequences of perfectionism and negative affect was unexpected. Thus, it needs to be replicated in future studies before the overall positive quality of positive socially prescribed performance perfectionism could be questioned. Second, the study was cross-sectional. Consequently, the findings from the correlation and regression analyses cannot be interpreted in a temporal or causal sense. Future studies need to employ longitudinal designs to establish that the consequences of perfectionism measured by the COPS are indeed consequences of perfectionism and not just correlates of perfectionism. Third, the study did not find any evidence for the COPS’s incremental validity in predicting subjective well-being (positive and negative affect) and psychological maladjustment (depressive symptoms) above general and performance perfectionism. However, nonsignificant findings are difficult to interpret, and many would argue that they should be disregarded (e.g., Reysen, 2006; Sternberg, 2003). Consequently, future studies may profit from including further indicators of subjective well-being (e.g., satisfaction with life) and psychological maladjustment (e.g., stress and anxiety) when investigating the relationships of the COPS with well-being and maladjustment.
Finally, future studies may profit from reconsidering what psychological processes and outcomes other than subjective well-being and psychological maladjustment may be influenced by positive and negative consequences of perfectionism. In particular, it would be important to investigate how positive and negative consequences of perfectionism are related to objective outcomes such as students’ exam results and grade point average (Stoeber, 2012b) or the time students spend on tasks and the numbers of correct responses they provide (Stoeber, Chesterman, & Tarn, 2010; Stoeber & Eysenck, 2008). Moreover, longitudinal studies may want to investigate what role positive and negative consequences of perfectionism play in the maintenance of perfectionism. Based on their clinical experience of working with people suffering from stress and anxiety caused by perfectionism, Shafran, Egan, and Wade (2010) have argued that perceptions of positive consequences may be a contributing factor to the maintenance of perfectionism and people’s reluctance to give up their perfectionistic tendencies. If people perceive perfectionism to have mostly positive consequences—and many perfectionists do (Slaney & Asbhy, 1996)—it may be difficult to overcome perfectionistic strivings, even if such strivings are associated with perfectionistic concerns and increased stress and anxiety. Finally, although performance plays a prominent role in perfectionism (E. C. Chang, 2006; Stoeber, 2012b) and perfectionism is most prevalent in professional and academic work (Slaney & Ashby, 1996; Stoeber & Stoeber, 2009), there are other domains of life in which perfectionism plays a significant role such as romantic relationships and physical appearance (Stoeber, 2012a; Yang & Stoeber, 2012). Consequently, future studies may consider going beyond the assessment of positive and negative consequences covered by the COPS and examine further domains of positive and negative consequences of perfectionism.
Implications for Counselors
Despite these limitations, the present findings provide further evidence that the COPS is a promising new instrument that provides for a reliable and valid assessment of positive and negative consequences of perfectionism. In perfectionism research, there is a strong tradition of viewing perfectionism as a personality characteristic that is overall maladaptive, unhealthy, dysfunctional, or even pathological (e.g., Blatt, 1995; Greenspon, 2000; Pacht, 1984). Most perfectionists, however, regard perfectionism as a characteristic that has both positive and negative aspects, which is something that counseling psychologists have long recognized (e.g., Johnson & Slaney, 1996; Slaney & Ashby, 1996; Slaney, Ashby, & Trippi, 1995). Capturing positive and negative consequences of perfectionism, the COPS and its subscales have the potential to help counselors understand the correlates and consequences associated with positive and negative aspects of perfectionism and provide significant novel insights into the nature of multidimensional perfectionism, particularly the strong association between students’ perfectionistic strivings and perceptions that perfectionism has positive consequences for their performance. In this, counselors may use the COPS to identify how students evaluate their perfectionism and how students perceive their perfectionism to influence their work and studies at school, college, and university. Indentifying perceived positive and negative consequences of perfectionism is an important step in providing students with help and guidance to make the most of the positive aspects of perfectionism (Szymanski, 2011) and to cope with the negative aspects (Antony & Swinson, 2009). Finally, the COPS can be used to monitor counseling-related changes in students’ perceptions of their perfectionism and evaluate the effectiveness of efforts to help students challenge their beliefs about perfectionism and question the instrumentality of perfectionism in achieving high standards of performance (Shafran et al., 2010).
Footnotes
Acknowledgements
We thank Jean Kim for providing us with the scale and all necessary details on the scale development.
Declaration of Conflicting Interests
The author(s) declared no potential conflicts of interest with respect to the research, authorship, and/or publication of this article.
Funding
The author(s) received no financial support for the research, authorship, and/or publication of this article.