
Abstract
Factor structure for the Goal Attainment Scale of Stabilization was evaluated using separate samples for exploratory factor analysis and confirmatory factor analysis. Results indicated a 25-item two-factor solution. The Goal Attainment Scale of Stabilization may be useful in identifying the extent to which adolescents in crisis meet therapeutic goals consistent with client stabilization.
Extant literature on models to address adolescents in crisis is limited with little empirical evidence to substantiate effective models and methods for assessing and treating adolescents in crisis. Although models for treatment related to specific disorders exist (e.g., Blank & Latzer, 2004), models that address emotional and behavioral crises among adolescents are limited.
To address this limitation, Balkin (2004) and Balkin and Roland (2007) proposed a model for counseling adolescents in crisis and admitted to acute care psychiatric hospitalization. The client’s ability to commit to safety, identify problems, process coping skills, and commit to follow-up significantly predicted positive client outcome (Balkin, Leicht, Sartor, & Powell, 2011; Balkin & Roland, 2007). This model incorporated the development of problem solving and coping skills in clients to promote client stability and well-being (Compas, Connor-Smith, Saltzman, Thomsen, & Wadsworth, 2001) by emphasizing the goal-directed nature of behavior and by providing a systematic method of identifying problems and implementing coping strategies (Nystul, 1995). In addition, the need for follow-up, defined as the necessity for continued intervention in a less restrictive environment, was identified in research (Collins & Collins, 1994; Cornsweet, 1990; Pfeiffer & Strzelecki, 1990). Follow-up is particularly important in a crisis residence setting because of the short-term nature of care, with typical lengths of stay being less than two weeks (Cornsweet, 1990; Pfeiffer & Strzelecki, 1990).
The purpose of this study is to summarize extant evidence of validity and provide evidence of internal structure for the Goal Attainment Scale of Stabilization (GASS), a theoretically derived instrument, based on the goal attainment model of stabilization, focused on therapeutic goal attainment for adolescents in crisis. The goal attainment model of stabilization is the combination of coping skills—consisting of commitment to safety, identification of problems, and coping strategies—and commitment to follow-up. Balkin (2004) created the GASS, which focused on identifying the extent to which clients met specific therapeutic goals related to the goal attainment model. Through previous studies, evidence of test content (Balkin, 2004; Balkin & Roland, 2007) and relationship to other variables (Balkin, 2004; Balkin et al., 2011; Balkin & Roland, 2007) were established. Although preliminary analyses of internal structure were promising (Balkin & Roland, 2007), larger sample sizes were necessary to establish norms and analyze factor patterns.
Evidence of Test Content for the GASS
The aforementioned theoretical framework (i.e., Collins & Collins, 1994; Compas et al., 2001; Cornsweet, 1990; Nystul, 1995; Pfeiffer & Strzelecki, 1990) was used to create items that were theoretically aligned with the literature. The GASS initially consisted of 26 items indicating specific goals related to each of the subscales: (a) commitment to safety (e.g., “The client is no longer a danger to self or others”), (b) problem identification (e.g., “The client is able to identify problems that led to being referred for services”), (c) processing coping skills (e.g., “The client has demonstrated ability toward healthy problem-solving and decision making”), and (d) commitment to follow-up (e.g., “The client agrees to attend follow-up services”).
Using goal attainment scaling (Kiresuk & Sherman, 1968) as a basis for measuring each goal-oriented item, clinicians rated each client on discharge between −2 and +2 for each item on the GASS. For each item a rating of −2 indicated the client was below attainment of the stated goal; −1 indicated the client was slightly below expected attainment of the stated goal; 0 indicated the client attained the stated goal; +1 indicated the client was slightly above expected attainment of the stated goal; and +2 indicated the client was above expected attainment of the stated goal. Content evidence was assessed by linking the instrument to literature and by having professionals complete an item validity assessment. Hambleton (1984) outlined this procedure using an index of item-objective congruence. Four content specialists examined each item and provided a score identifying the extent to which each goal measured commitment to safety, problem identification, processing coping skills, and commitment to follow-up. A score of +1, 0, or −1 was given. A +1 was given to the goals that were clearly measured by an item; a −1 was given to goals that were not measured by the item. A 0 was assigned if the item was not a clear measure of the goal. A cut score of .70 was used for identifying items that were not clearly measuring the objective identified. Content specialists experienced difficulty identifying how items related to commitment to safety were separate and distinct from items related to processing coping skills. Hence, these items were merged together, as commitment to safety could be viewed as a coping mechanism (Compas et al., 2001).
Preliminary Evidence of Internal Structure
Preliminary evidence of internal structure was evaluated using the Modified Multitrait–Multimethod Matrix (Trochim, 2000) and was indicative of high intercorrelations between problem identification and processing coping skills. Convergent evidence was identified by examining the intercorrelations of the items (n = 99) for each subscale, thus reflecting the related construct. Items with intercorrelations less than .40 were discarded. Intercorrelations for 10 items associated with problem identification ranged from .83 to .86; 8 items associated with processing coping skills ranged from .62 to .90; 7 items associated with commitment to follow-up ranged from .47 to .83; and 1 item was dropped. Discriminant evidence was identified by examining the intercorrelations of the subscales, in order to identify that each of the subscales measured a separate and distinct construct. The intercorrelations for the subscales were r = .58 (problem identification and commitment to follow-up), r = .62 (processing coping skills to commitment to follow-up), and r = .86 (problem identification to processing coping skills). Commitment to follow-up had distinctive qualities from problem identification and processing coping skills. Problem identification and processing coping skills were highly correlated. Although theoretically the items were distinguishable as evidenced by the index of item-objective congruence, statistically it was more difficult to differentiate items related to problem identification and processing coping skills. Items for problem identification were consistent with Heppner’s (2008) description of applied problem solving as an aspect of coping. Hence, problem identification and processing coping skills were merged to a single subscale: coping, consisting of items initially derived to measure commitment to safety, problem identification, and processing coping skills; commitment to follow-up was the second subscale.
Evidence of Relationship to Other Variables
As adolescents meet specific therapeutic goals related to crisis stabilization, a reduction in the severity of psychiatric symptoms is apparent. Correlational analyses indicated that an adolescent client’s ability to attain goals consistent with coping skills and commitment to follow-up related to a decrease in psychiatric symptoms in a crisis residence setting as measured by the Clinician Problem Scale–Revised (Balkin, 2004; Balkin & Roland, 2007).
Balkin et al. (2011) analyzed 109 adolescents admitted to an acute care psychiatric program in the North-Central United States. Adolescents were administered the following scales at the onset of their hospitalization: (a) Millon Adolescent Clinical Inventory, (b) Target Symptom Rating Scale, (c) Suicide Probability Scale, and (d) Minnesota Multiphasic Personality Inventory–Adolescent. Clinicians completed the GASS on discharge. A canonical correlation was conducted to establish predictive evidence of client characteristics and their ability to address therapeutic goals as measured by the GASS. Adolescents who exhibited features consistent with mood disorders (e.g., depression, anxiety) had higher therapeutic goal attainment than adolescents with features consistent with disruptive behavior disorders (e.g., impulsivity, delinquency) and substance abuse issues.
Method
Participants
Participants included adolescent clients (N = 435) aged 11 to 18 (M = 14.04, SD = 2.79) admitted to an acute care adolescent unit in the North-Central or Southern United States. Female-to-male ratio was 55.3% (n = 241) to 44.7% (n = 195). Participants were mostly White (78.4%, n = 338). African Americans represented 17.9% (n = 77) of the participants, followed by Latino (2.1%, n = 9), other (1.4%, n = 6), and Asian (0.2%, n = 1). Five (1.1%) participants did not have ethnicity reported. In terms of diagnostic categories, 406 participants had a diagnosis reported: mood disorder (76.6%, n = 311), disruptive behavior disorder (15.3%, n = 62), substance abuse disorder/dependency (1.2%, n = 5), psychosis (3.4%, n = 14), anxiety disorder (1.7%, n = 7), other (e.g., pervasive developmental disorder; 1.7%, n = 7). Adolescents from participating hospitals met criteria for admission to an adolescent acute care program established by the Joint Commission and participated in individual, group, and family counseling milieus.
Materials and Procedure
The institutional review boards of the participating university and each of the participating hospitals approved the research. Adolescent clients were admitted to an acute care facility, in accordance with guidelines by the Joint Commission for Accreditation of Hospital Organizations. Consent and assent procedures were followed, including clinician, parental, and patient permission to participate in this study, as established by federal guidelines and the participating university’s institutional review board. Licensed counselors, social workers, and/or psychologists employed on adolescent acute care units were provided with GASS protocols and trained to use the instrument. Training included a discussion of the scale and the implied meaning of each score on the scoring system (i.e., −2 to +2). Two sample cases familiar to the clinicians were discussed, which included case history and progress through treatment. In the first case presentation, the raters discuss the case, complete the GASS, and then discuss differences in rating. A second separate case was presented and the GASS was once again completed, but this time without discussion. On completion of the training, interrater reliability was assessed for the second case on one unit with two trained raters at r = .77. The other unit only had only one rater, thereby not lending an appropriate comparison with a second rater on a familiar case.
Clients received the same treatment protocol as they normally received consistent with program guidelines of each facility. Thus, no differences in the normal treatment experience were instituted by this study. When clients were discharged, the clinicians completed the GASS and a discharge information sheet, which included client demographic information, client diagnosis as assigned by the clinician, length of stay, previous psychiatric admissions, and disposition on discharge. No identifying information on the clients or clinicians was collected. The sample size of 436 was split into two random samples. The first random sample (n = 125) was used to conduct an exploratory factor analysis (EFA) with a promax rotation, due to the expectation that factors would be correlated. When factor loadings are strong (e.g., .60 or higher), a ratio of five participants to each item is sufficient for EFA (Stevens, 2009). Given the high reliability estimates and strong correlations in previously published research (e.g., Balkin et al., 2011; Balkin & Roland, 2007), a strong factor structure was expected.
A separate random sample (n = 310) was used to conduct a confirmatory factor analysis (CFA) using the factor structure from the previous EFA. Mplus (Version 6) was used to conduct the EFA and CFA procedures. SPSS was used for preliminary analyses of assumptions.
Results
Preliminary Analyses
MLM in Mplus (Version 6) was used to handle missing data (<1%). Following steps outlined by Tabachnick and Fidell (2007), assumptions of multivariate normality were evaluated through SPSS (Version 20). No significant deviations with respect to skewness and kurtosis were noted for each observable variable. Using Mahalanobis distance, no multivariate outliers were noted.
Exploratory Factor Analysis and Reliability Estimates
An EFA utilizing maximum likelihood with a promax rotation, due to the hypothesized correlations between the factors, was conducted to determine factor structure for the GASS. Scree plots and eigen values indicated a two-factor solution. Eigen values for the first two factors were 16.29 and 1.95, accounting for 65.15% and 7.82% of the total variance (72.97%), respectively. The eigen value for a potential third factor was .84; hence, both the scree plot and eigen values with respect to the Kaiser criterion (i.e., eigen values > 1.00) were indicative of a two-factor solution. After the rotation, factor loadings ranged from .75 to .91 on the first factor. Eighteen items had positive loadings and addressed coping, as item content was indicative of commitment to safety, problem identification, and processing coping skills. On the second factor, loadings ranged from .79 to .89. Seven items had positive loadings and addressed commitment to follow-up. Table 1 includes the results of the EFA.
Factor Loadings for the EFA With Promax Rotation of the GASS.

Note. EFA = exploratory factor analysis; GASS = Goal Attainment Scale of Stabilization. Factor loading are in boldface.
Items loaded more strongly on their hypothesized factors; however, cross-loadings were strong among the items. Despite the clear demarcation of a two-factor solution, a strong correlation between the coping subscale and commitment to follow-up subscale was note, r = .68.
Reliability estimates of the subscale scores were evaluated using Cronbach’s alpha. For the coping subscale, α = .98; for the commitment to follow-up subscale, α = .95. These reliability estimates were consistent with what was found by Balkin and Roland (2007).
Sample Comparisons and Confirmatory Factor Analysis
Prior to conducting the CFA, subscale scores in the CFA sample were evaluated to identify if results matched the EFA scores. For the coping subscale, there was no significant difference between EFA (M = .41, SD = .67, n = 125) and CFA (M = .30, SD = .79, n = 310) sample scores, t(434) = .37, p = .171. For the commitment to follow-up subscale, there was no significant difference between EFA (M = .52, SD = .65, n = 125) and CFA (M = .47, SD = .74, n = 310) sample scores, t(434) = .65, p = .74.
A CFA was conducted using maximum likelihood method for the two-factor solution from the previous EFA. The hypothesized model included two first-order latent variables: coping and commitment to follow-up with 18 and 7 indicators, respectively. The χ2 was significant for the hypothesized model, χ2(274) = 1203.82, p < .001. The fit indices indicated an acceptable model fit for the data, comparative fit index (CFI) = .91, Tucker–Lewis index (TLI) = .90, standardized root mean square residual (SRMR) = .069 (Dimitrov, 2012). SRMR was selected in lieu of the root mean square error of approximation, which tends to be overestimated with models that include fewer factors (Dimitrov, 2012). Table 2 provides standardized and unstandardized estimates for the factor pattern coefficients.
Standardized and Unstandardized Estimates for Factor Pattern Coefficients.

Note. For all estimates p < .001.
Consistent with guidelines from Dimitrov (2012), an alternative model was tested to identify if a better model fit could be obtained. As the initial factor contributed to the majority of the variance in the model (65%) and both factors included relatively high cross-loadings (see Table 1), a single-factor model was considered. The χ2 was significant for the single-factor model, χ2(275) = 1442.03, p < .001. The single-factor model was an unacceptable fit (Dimitrov, 2012), CFI = .83, TLI = .81, SRMR = .08, and therefore not improved from the two-factor model.
Scoring Procedures for the GASS
The GASS may be scored and interpreted based on two types of scoring methods: comparison to the normative sample or interpretation through goal attainment scaling (Kiresuk & Sherman, 1968). Table 3 provides information for both types of scoring methods.
Computation of T-Scores and Goal Attainment Score for Coping and Follow-Up Subscales.
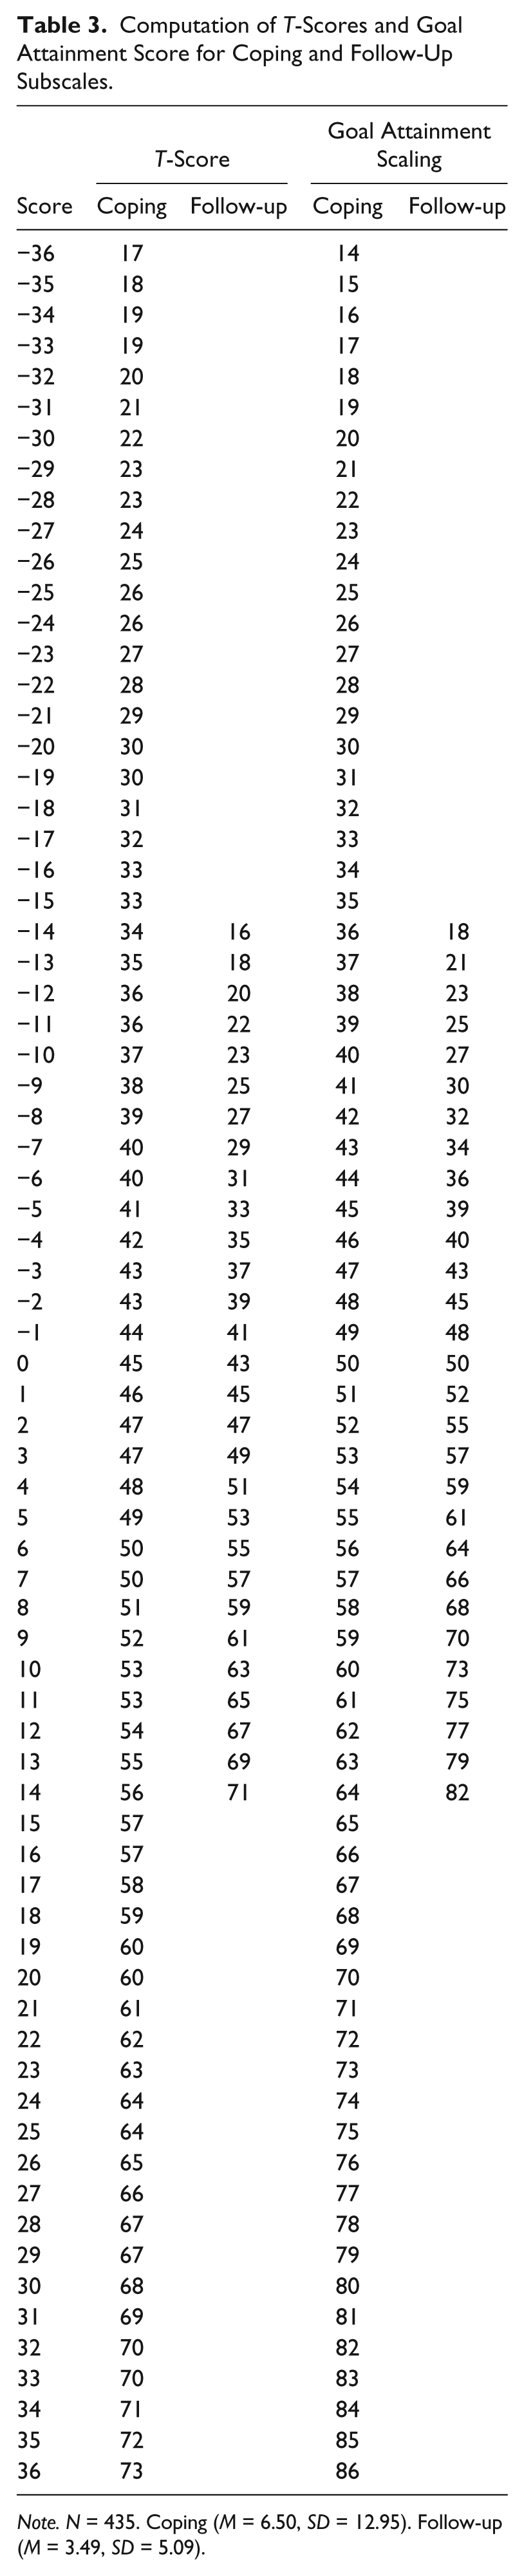
Note. N = 435. Coping (M = 6.50, SD = 12.95). Follow-up (M = 3.49, SD = 5.09).
The first column in Table 3 provides the T-scores consistent with each raw score. T-scores were derived using the means and standard deviations (see Table 3) for the scores of the normative sample (N = 435) on each of the subscales. Scores for each subscale may be summed. As each item ranges from −2 to +2, the 18 items on the coping subscale range from −36 to +36, and the 7 items on the commitment to follow-up scale range from −14 to +14. An advantage of this scoring method is that clients may be compared with a normative sample of adolescents who were evaluated on discharge from a crisis-residence setting. However, this type of comparison may be limited should counselors working in outpatient settings wish to use this instrument.
The second column in Table 3 was derived using goal attainment scaling (see Kiresuk & Sherman, 1968; Turner-Stokes, 2009). An advantage of this scoring method is that scores are criterion-referenced. However, each subscale score represents the general extent to which goals were met on the subscale. Individual goals may still deviate from 0, goal attained, as scores on each item may offset each other.
Discussion
The results of this study, along with results from previous extant research (Balkin et al., 2011; Balkin & Roland, 2007), provide a body of work on the GASS indicating evidence of test content, internal relationships to other variables, and internal structure. Internal consistency estimates of the scores appear strong and congruent with previous studies using the GASS.
The GASS was initially conceived as a four-factor instrument, based on the four phases of the hypothesized goal attainment model: commitment to safety, problem identification, processing coping skills, and commitment to follow-up. However, both expert review and ratings, as well as results from the EFA and CFA, support a two-factor model, with commitment to safety, problem identification, and processing coping skills combined into a single factor, coping, and commitment to follow-up. No items were dropped from the instrument and results from the evaluation of internal consistency indicated reliability estimates were adequate. Hence, 18 items were retained in the coping subscale, and 7 items were retained in the commitment to follow-up subscale.
Counselors and other professionals in behavioral health may find the GASS useful in identifying the extent to which adolescents in crisis met specific goals that relate to a decrease in the severity of psychiatric symptoms (e.g., mood disorders, disruptive behavior disorders) and may provide evidence for future recovery beyond the crisis stabilization phase of treatment. Furthermore, the GASS may serve as an outcome tool that can provide evidence to counselors, administrators, physicians, and third party payors on the need to either continue crisis stabilization services or transition toward discharge/termination. Unlike many other outcome inventories that are problem or symptom focused (e.g., Child and Adolescent Functional Assessment Scale, Target Symptom Rating, Youth Outcome Questionnaire), the GASS is a strength-based assessment instrument, focusing on the extent to which therapeutic goals are met. Hence, the counselor, client, and stakeholders can evaluate specific gains consolidated during treatment, as well as additional areas of concern for client stabilization to be attained.
Limitations of this study may include the sample size for the EFA, which was small, but given the history of previous studies using the GASS and the strong factor loadings, the sample size of 125 was sufficient. Stevens (2009) indicated that factors with “four or more loadings above .60 in absolute value are reliable, regardless of sample size” (p. 333). In this study, the 18 items that loaded on the coping subscale and the 7 items loaded on the commitment to follow-up subscale were all above .60. Another limitation with the EFA was the strong cross-loadings of items on each of the subscales. Although all item loadings were above .50 on both subscales, the theoretical rational of the items, evaluation of item-content by content experts, and results from scree plots and the Kaiser criterion provide evidence of a two-factor model used for the CFA. The structure was ultimately confirmed in the CFA using a larger sample size of 310. Evidence of interrater reliability of scores is preliminary at best, with data collected from only two raters on one unit. Further research in this area is necessary. A final limitation may include the generalizability of the participants, who were admitted to acute care psychiatric hospitalization. Representativeness of this sample to adolescents experiencing crisis outside of an institutional setting may be limited; however, this study does provide evidence of validity for the GASS using an identified sample of adolescents in crisis from a rather difficult population to obtain data. HIPAA and OHRP regulations provide many stipulations for adequate data collection on this protected population, and this study provides some evidence related to measuring therapeutic goal attainment for adolescents in crisis.
Three of the five evidences of validity were established in previous studies and the current study: evidence of test content, evidence of relationship to other variables, and evidence of internal structure. Additional studies on response processes and consequences of testing would be a logical follow-up to this study. Specifically, the GASS was designed to be completed by the counselor or other behavioral health care professional on the basis that if the client was recently identified as in crisis, as evidenced by admission to an acute care psychiatric facility, the self-report of the client may not be valid. However, such a supposition should be investigated by examining the relationship of client self-report to the rated response of the counselor or other behavioral health professional. Consequences of testing could be evaluated by the examination of readmission or regression back to previous high behaviors after discharge/termination. If higher scores on the GASS subscales correlate to fewer readmissions or relapses, the GASS could be used as an important screening for predicting outcome with adolescents previously experiencing emotional/behavioral crises.
Footnotes
Declaration of Conflicting Interests
The author(s) declared no potential conflicts of interest with respect to the research, authorship, and/or publication of this article.
Funding
The author(s) received no financial support for the research, authorship, and/or publication of this article.