
Abstract
This article describes the confirmatory factor analysis of the Student Engagement in School Success Skills (SESSS) instrument. The results of this study confirm that the SESSS has potential to be a useful self-report measure of elementary students’ use of strategies and skills associated with enhanced academic learning and achievement.
Keywords
Certain key skills and strategies have been identified as critically important to student success in school. These critical skills and strategies have been consistently identified over several decades in large reviews of educational research literature (Hattie, Biggs, & Purdie, 1996; Masten & Coatsworth, 1998; Wang, Haertel, & Walberg, 1994). Three skill sets have emerged from this research literature as common threads in contributing to student academic success and social competence: (a) cognitive and metacognitive skills such as goal setting, progress monitoring, and memory skills; (b) social skills such as interpersonal skills, social problem solving, listening, and teamwork skills; and (c) self-management skills such as managing attention, motivation, and anger. Additional support for these skills and strategies continues to weave a coherent research tapestry that is useful in separating successful students from students at risk of academic failure (Durlak, Weissberg, Dymnicki, Taylor, & Schellinger, 2011; Greenberg et al., 2003; Marzano, Pickering, & Pollock, 2001; Zins, Weissberg, Wang, & Walberg, 2004). Since there has typically been no standardized way to measure these types of outcomes, the present research addresses this challenge.
Linking school counseling programs and interventions to improved student outcomes has become increasingly important. The American School Counselor Association’s (ASCA; 2005) response to these accountability demands reflects the U.S. Department of Education’s (2001, 2010) call for more research on what is needed to improve student achievement. The call for more research tying school counselors to improved student academic performance has recently surfaced as a top priority for the field. In 2005, a Delphi study was conducted by leaders in school counseling to identify the most pressing research questions in the profession. The top priority cited by this Delphi study was the need to determine which school counseling interventions resulted in the greatest gains in student achievement (Dimmitt, Carey, McGannon, & Henningson, 2005). Several of the remaining top 10 research questions in the Delphi study also reflected the need for more research on the impact of school counselor interventions on academic achievement and behavior related to school success. In addition, five major reviews of school counseling research have all pointed to the need for more research to strengthen the link between school counselors and student achievement (Brown & Trusty, 2005; Dimmitt, Carey, & Hatch, 2007; Whiston & Quinby, 2009; Whiston & Sexton, 1998; Whiston, Tai, Rahardja, & Eder, 2011).
One way for school counselors to demonstrate the impact of classroom guidance and small group counseling on achievement is through the measurement of the impact of their interventions on intermediate variables associated with achievement. These intermediate variables include the previously mentioned skills involving cognitive, social, and self-management skills and strategies.
Instruments that measure these critically important fundamental learning skills and strategies are limited. Brown and Trusty’s (2005) review of school counseling research concluded that one of the limitations of school counseling research has been the lack of valid and reliable instruments that measure the skills, strategies, and personal attributes associated with academic and social/relationship success. The Student Engagement in School Success Skills (SESSS) instrument (Carey, Brigman, Webb, Villares, & Harrington, 2014) was developed to measure student use of the skills and strategies identified as most critical for long-term school success that can be taught by school counselors within the scope of the ASCA National Model, through classroom guidance and small group counseling.
Previous research on self-report measures of student metacognition indicates that it is feasible to develop such a measure for elementary-level students (Sperling, Howard, Miller, & Murphy, 2002; Yildiz, Akpınar, Tatar, & Ergin, 2009). Carey et al. (2014) described the development of the SESSS, reported adequate internal consistency reliability estimates for the whole scale, and reported the results of an exploratory factor analysis that indicated that a four-factor solution provided the best model of scale dimensionality. These four factors reflected students’ Self-Management of Learning, Application of Learning Strategies, Support of Classmates’ Learning, and Self-Regulation of Arousal. The purpose of this present study is to use confirmatory factor analysis to determine whether this factor structure is replicated in a large independent sample of students.
Method
Participants
The SESSS instrument was completed by 3,985 fifth-grade students enrolled in two large school districts in Florida at the beginning of the 2012–2013 academic year. The total sample was then randomly divided into two subsamples (Subsample A = 1,992 students and Subsample B = 1,993) to perform the confirmatory factor analyses.
Subsample A comprised 1,992 fifth-grade students, including 999 female (50.2%), 965 male (48.4%), and 28 (1.4%) students who did not disclose their gender. The racial background of Subsample A consisted of 3.4% Asian, 34.6% African American, 37.9% Caucasian, 19.4% Hispanic, 2.9% Multiracial, 0.4% Native/Alaskan American, and 1.4% of students who did not disclose their ethnicity. More than half of Subsample A was eligible to receive free or reduced lunch (1,062, 53.1%). Subsample A was used to attempt to confirm the four-factor solution and ultimately to arrive at a three-factor solution.
A total of 1,993 fifth-grade students were in Subsample B, which included 987 male students (49.5%), 986 (49.5%) females, and 20 students (1%) who did not disclose their gender. Subsample B was made up of 3.4% Asian, 33.4% African American, 38.3% Caucasian, 20.6% Hispanic, 2.8% Multiracial, 0.5% Native/Alaskan American, and 1% of students who did not disclose their ethnicity. More than half of Subsample B (1,058, 53.1%) was eligible for free or reduced lunch. Subsample B was used to replicate the three-factor solution.
The Student Engagement in School Success Skills Survey
Carey et al. (2014) described the development of the SESSS survey. The SESSS was developed to measure the extent to which students use the specific learning, social, and self-management strategies that have been shown to be related to enhanced academic achievement (Hattie et al., 1996; Masten & Coatsworth, 1998; Wang et al., 1994). These skills and strategies were also used as the framework for the development of a large group intervention, Student Success Skills (Brigman & Webb, 2004, 2012). SESSS survey items were developed as a self-report measure of student use of these skills that include the following: goal setting, progress monitoring, story structure, mental practice, use of memory aids, social problem solving, listening, attending, encouragement, empathy, test anxiety coping skills, positive self-talk, and optimism. Items were developed to reflect general skill use in these areas and did not include language specific to the Student Success Skills (SSS) program. For example, instead of an item asking the student about imagining going to their Safe Place to feel less stressed, the item asked if the student had imagined going to a quiet place to feel less stressed. After the initial pool of items was developed, items were reviewed by an expert panel of elementary educators and school counselors and subjected to a readability analysis using the Lexile Framework for Reading system (MetaMetrics, Inc., 2012). At each stage of review, minor changes were made to improve clarity on several items.
Twenty-seven self-report items were assembled into a scale with the following directions: Below is a list of things that some students do to help themselves do better in school. No one does all these things. No one does any of these things all the time. Please think back over the last two weeks and indicate how often you did each of these things in the last two weeks. Please follow along as each statement is read and circle the answer that indicates what you really did. Please do your best to be as accurate as possible. There are no right or wrong answers. We will not share your answers with your parents or teachers. We will not grade your answers.
The response format included four options that reflected frequency of strategy use in the past 2 weeks: “I didn’t do this at all,” “I did this once,” “I did this two times,” “I did this three or more times.” This format was not conducive to writing clear negatively stated items. Therefore, six additional items were developed to help control for response set; three of these items reflected strategies that elementary students were unlikely to use (e.g., searching the Internet for additional math problems to work on) and three items reflected strategies that elementary students were likely to use (e.g., asking a friend when homework was due) but were not covered in the SSS program.
Based on the administration of the SESSS to 262 elementary students in the fourth through eighth grades, Carey et al. (2014) reported an overall alpha coefficient for reliability for the 27-item scale to be 0.91. Coefficient alphas for each grade ranged between 0.87 (for fifth grade) and 0.95 (for seventh grade). All items correlated well with the total scale (ranging between 0.34 and 0.63). Scores on the total scale were found to be distributed approximately normally with a mean of 65.83 and a standard deviation of 15.44.
In addition, Carey et al. (2014) conducted an exploratory factor analysis of the SESSS scores of 402 fourth through sixth graders. They explored three-, four-, and five-factor solutions and found that these models accounted for 40.4%, 45.0%, and 49.0% and of the variability in the intercorrelation matrix, respectively. The four-factor solution provided the best model of scale dimensionality considering both the solution’s clean factor structure and the interpretability of these factors. These four factors reflected students’ Self-Management of Learning, Application of Learning Strategies, Support of Classmates’ Learning, and Self-Regulation of Arousal.
Data Collection Procedures
Data collectors were hired to administer the SESSS instrument as part of an Institute of Education Sciences federal grant project. The data collectors were graduate students enrolled in a Counselor Education program from two state universities. During the fall 2012 semester, 16 data collectors participated in a 1-day training during which they received instruction on and were given the opportunity to practice administering the study measures, including the SESSS instrument. Each data collector was provided with a data collection manual, which outlined the specific protocol for administering and handling completed surveys. Data collectors then visited the 60 schools in the two school districts over a 2-week period and administered the SESSS instrument in a classroom setting. Parent consent and student assent was obtained prior to administering the SESSS instrument. After a brief introduction, the data collector read each item and response choice on the SESSS instrument aloud to the fifth-grade students. To protect student identity, students placed a generic coded label on the top of their completed survey and returned their survey to the data collector. The generic coded label included a number from 1 to 30 for each school, classroom, and student and a district number of 1 or 2. At the conclusion of each data collection day, completed surveys were returned to the district project coordinator and later shipped to a partner university for data analysis.
Data Analysis
Confirmatory Factor Analysis
An initial confirmatory factor analysis (CFA) was conducted on the 27 items from the SESSS survey to assess a four-factor measurement model that was based on theory and previous research (Arey et al., 2014). The six items (5, 8, 18, 21, 25, and 28) used to control response set were excluded from the analyses. Figure 1 provides the conceptual path diagram for the measurement model. Eight items (2, 9, 11, 22, 23, 29, 30, and 31) loaded on factor one (C1), which was purported to measure self-management of learning. Ten items (3, 6, 10, 12, 13, 14, 17, 19, 20, and 32) loaded on Factor 2 (C2), which was purported to measure application of learning strategies. Six items (1, 15, 24, 26, 27, and 33) loaded on Factor 3 (C3), which was purported to measure support of classmates. Three items (4, 7, and 16) loaded on Factor 4 (C4), which was purported to measure self-regulation of arousal. All four latent variables were expected to be correlated in the measurement model.
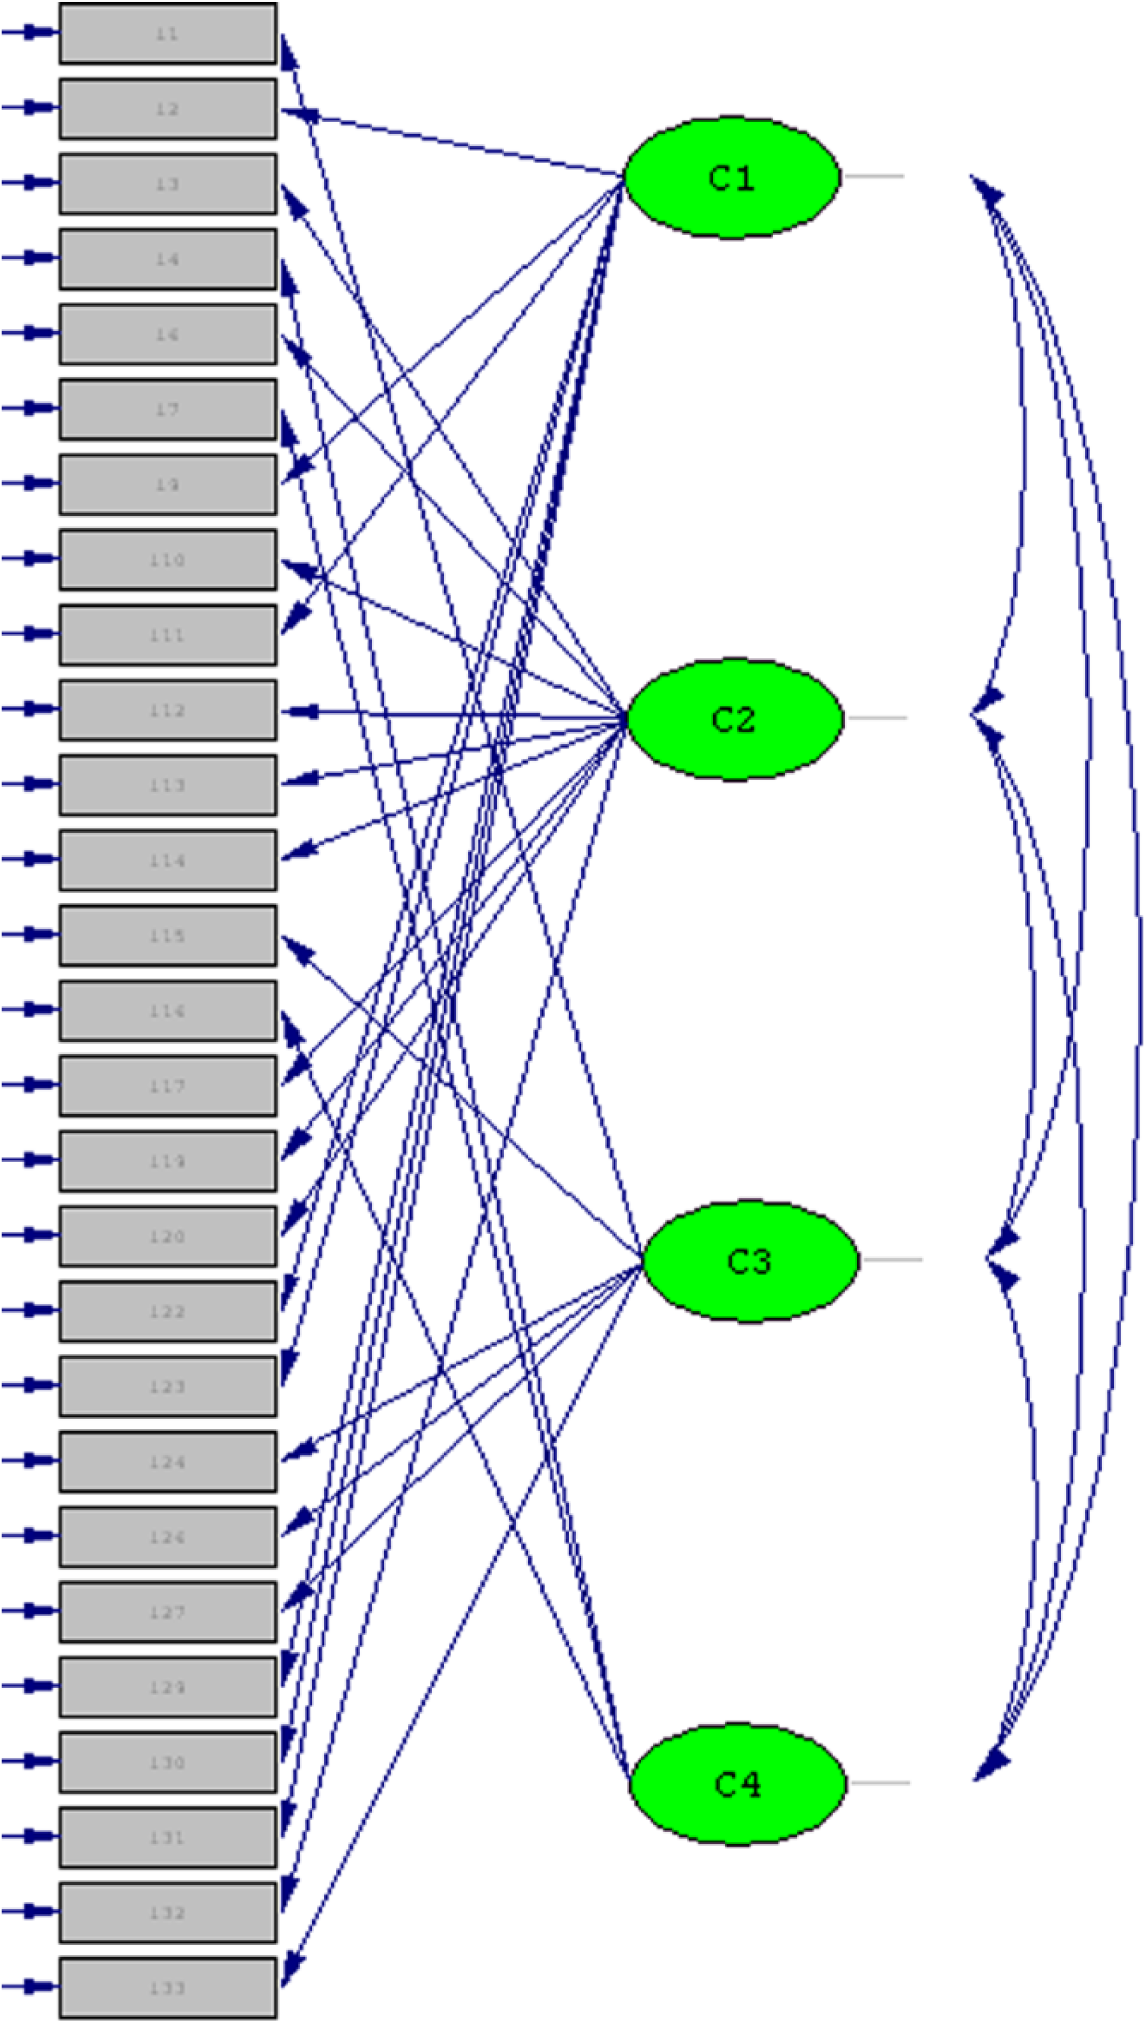
Conceptual diagram of four-factor measurement model.
CFA was used to assess the measurement model with respect to fit as well as convergent and discriminant validity. Large standardized factor loadings, which indicate large intercorrelations among items associated with the same latent variable, support convergent validity (Brown, 2006; Kline, 2011; Schumacker & Lomax, 2010). Correlations among the latent variables that are less than the standardized factor loadings are evidence of discriminant validity; that is, the latent variables are distinct, albeit correlated (Brown, 2006; Kline, 2011; Schumacker & Lomax, 2010). When the correlation between two latent variables exceeds the standardized factor loadings, it is evidence of a lack of discriminant validity in that the two latent variables have a stronger relationship with each other than they do with their respective indicators. In such a case, the latent variables should be combined presuming it makes theoretical sense.
When conducting CFA, it is not uncommon to have to respecify a poorly fitting model, especially those with multiple latent variables and many indicators. Therefore, for the purpose of cross-validation, the entire sample was randomly split in half. Subsample A, which had 1,992 students, was used to assess the fit of the four-factor measurement model shown in Figure 1. If the initial four-factor model needed to be respecified because of, for example, poor model fit, the respecification would be conducted using Subsample A. Subsample B, which had 1,993 students, was used to assess the fit of the initial model or to replicate the respecification process if the four-factor model was in need of revision.
The computer program PRELIS 2.8 (Joreskog & Sorbom, 2006b) was used to produce the polychoric and asymptotic covariance matrices for the CFA. Polychoric correlation coefficients were used because the items were ordinal. The computer program LISREL 8.8 (Joreskog & Sorbom, 2006a) was used to conduct the CFA using weighted least squares estimation. Model fit was assessed using several goodness-of-fit indices: comparative fit index (CFI), standardized root mean square residual (SRMR), and root mean square error of approximation (RMSEA). To conclude that the model exhibited reasonable fit, we used the following recommended cutoff values from Hu and Bentler (1999): standardized root mean square residual value less than 0.08, RMSEA value less than 0.06, and CFI value greater than 0.95.
Results
Data Screening
Before conducting the CFA, the distribution of the item responses was examined in both samples for problematic distributions with respect to skewness and kurtosis. Absolute values greater than 2 or 7 for skewness and kurtosis, respectively, were considered problematic (Finney & DiStefano, 2006; West, Finch, & Curran, 1995). Skewness ranged from −0.88 to 0.35 and kurtosis ranged from −1.52 to −0.65. Therefore, we did not find any indicators that appeared to have a problematic distribution that could cause problems with the CFA.
Confirmatory Factor Analysis
Subsample A
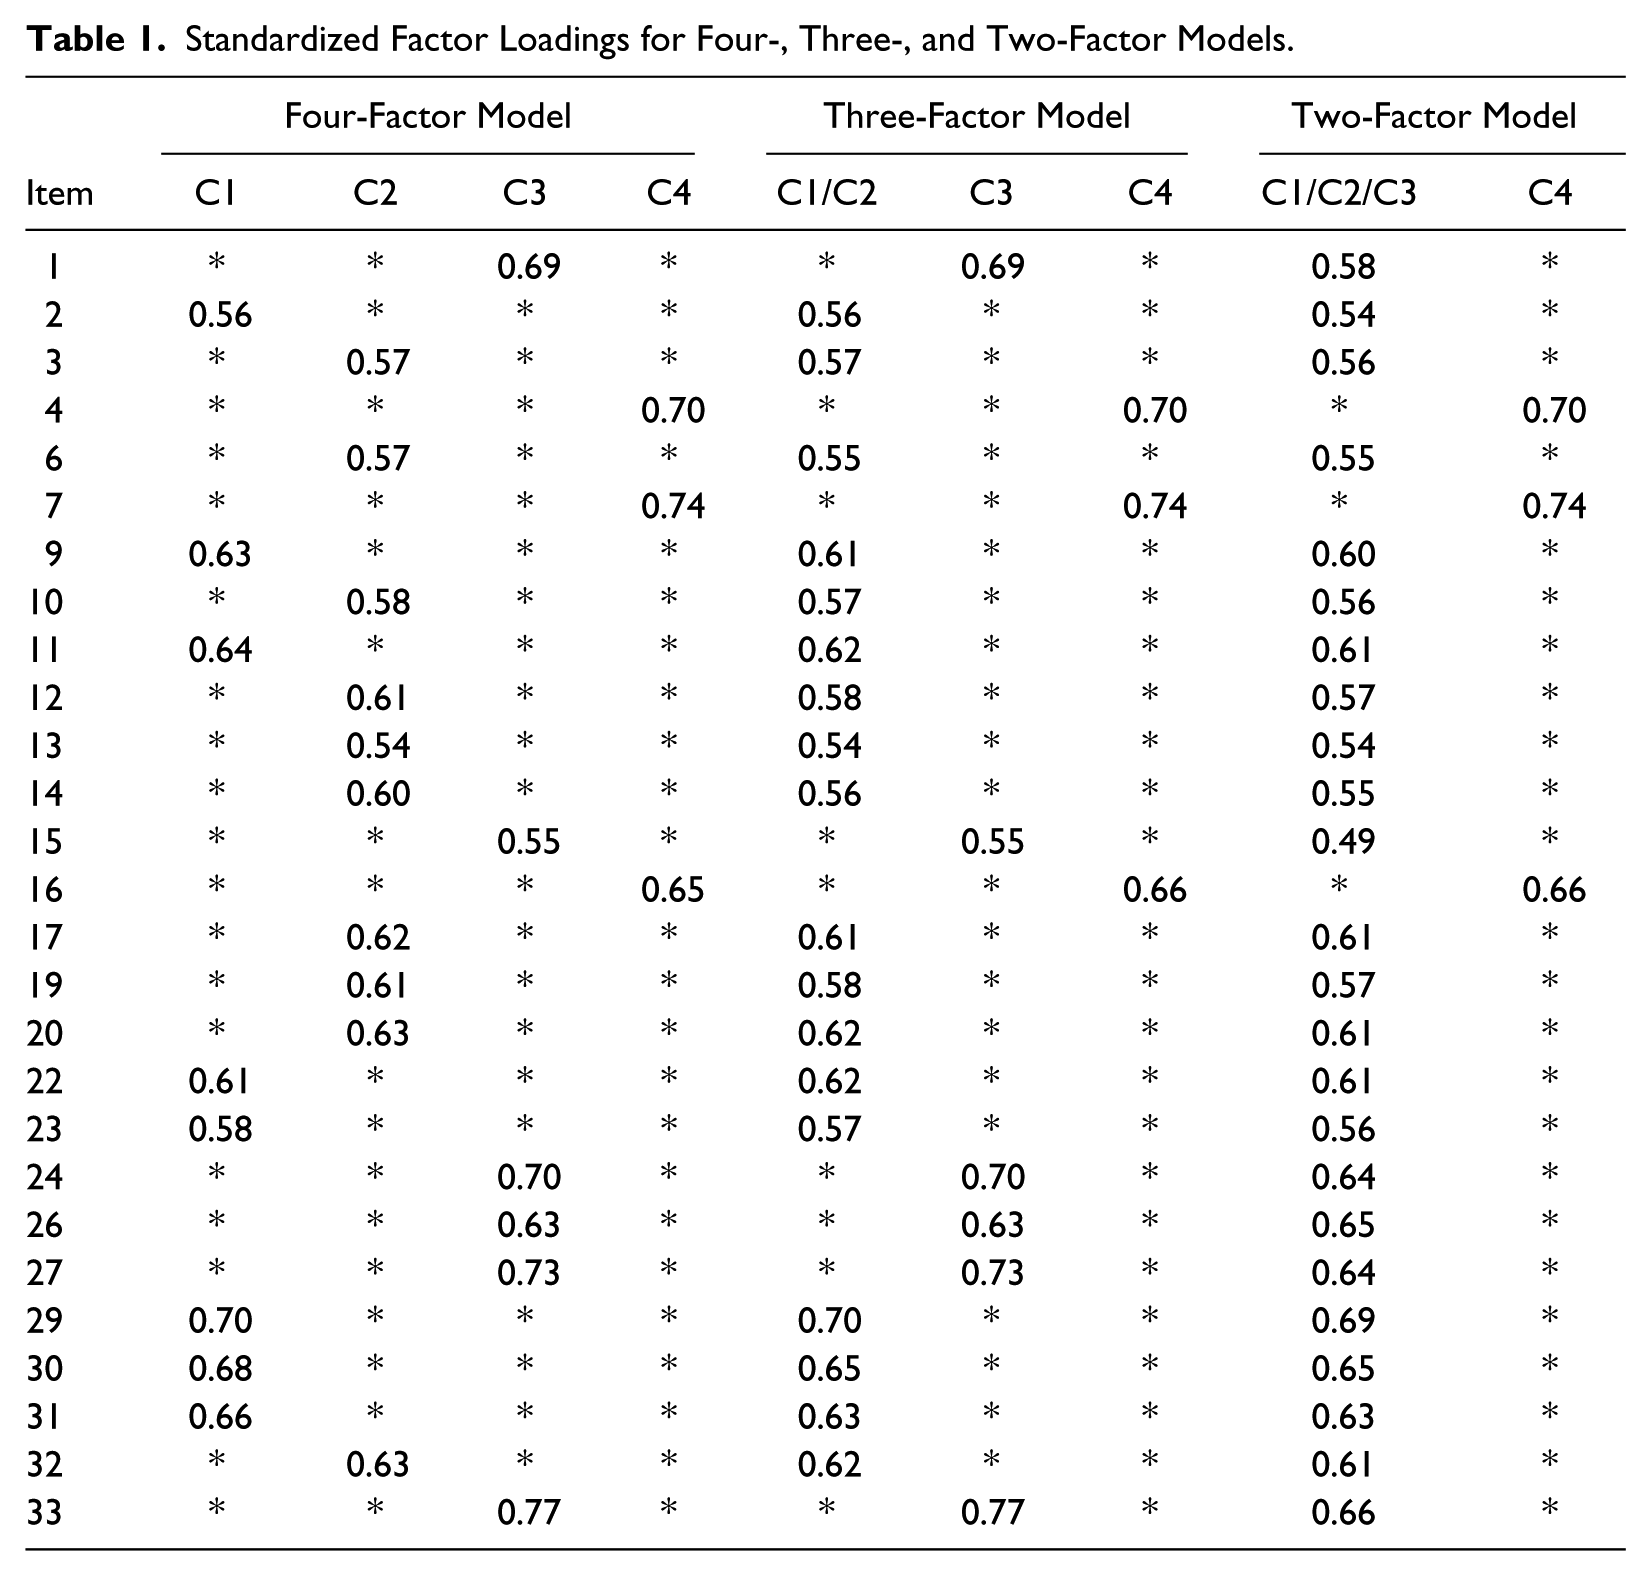
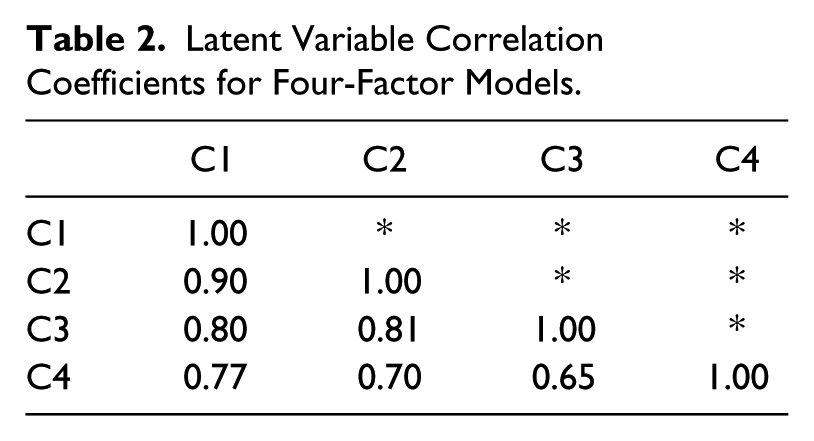
The goodness-of-fit indices from the CFA indicated that the four-factor measurement model fit the data well (RMSEA = 0.054, SRMR = 0.04, CFI = 0.98, χ2 = 2050.48, and df = 318). Table 1 reports the standardized factor loadings, which can be interpreted as correlation coefficients, for the four-factor model. The standardized factor loadings were relatively large, ranging from 0.55 to 0.74. The relatively large standardized factor loadings support convergent validity in that each indicator was at least moderately related to the respective underlying latent variable. Table 2 reports the correlation coefficients among the four latent variables. The large correlation coefficient between C1 and C2 (0.90) indicated a lack of discriminant validity in that the correlation between the two different latent variables was larger than the standardized factor loadings.
Standardized Factor Loadings for Four-, Three-, and Two-Factor Models.
Latent Variable Correlation Coefficients for Four-Factor Models.
Due to the lack of discriminant validity between C1 and C2 and because these two latent variables are similar theoretically, we fit a three-factor model where C1 and C2 were combined into one latent variable (hereafter referred to as C1/C2 and may be purported to measure self-directed learning). The three-factor model fit the data well (RMSEA = 0.058, SRMR = 0.042, CFI = 0.98, χ2 = 2205.12, and df = 321). Despite the large difference in chi-square statistics between the two models indicating that the three-factor model fit significantly worse than the four-factor model (χ2 = 2205.12−2050.48 = 154.64, df = 3, p < .001), the fact that the goodness-of-fit indices did not change indicated that the increase in misfit was negligible (Cheung & Rensvold, 2002). Table 1 reports the standardized factor loadings for the three-factor model. The standardized factor loadings were relatively large, ranging from 0.56 to 0.74 and supported convergent validity. Table 3 reports the correlation coefficients among the three latent variables, which were moderately large ranging from 0.65 to 0.82. The large correlation coefficient between C1/C2 and C3 (0.82) indicated a lack of discriminant validity in that the correlation between the two different latent variables was larger than the standardized factor loadings.
Latent Variable Correlation Coefficients for Three-Factor Models.

Due to the lack of discriminant validity between C1/C2 and C3 (although it may not be reasonable theoretically to combine them) we fit a two-factor model where C1/C2 and C3 were combined into one latent variable (hereafter referred to as C1/C2/C3 and may be purported to measure promoting individual and peer learning). Although according to the CFI and SRMR goodness-of-fit indices, the two-factor model fit the data well (SRMR = 0.044, CFI = 0.97, χ2 = 2847.62, and df = 323), the RMSEA value was beyond the acceptable cutoff value of 0.06 (RMSEA = 0.069). In fact, the 90% confidence interval for RMSEA was more than 0.06 (0.067, 0.071). Furthermore, in addition to the difference in chi-square fit indices between the two- and three-factor models indicating a significantly worse fit (χ2 = 2847.62−2205.12 = 642.5, df = 2, p < .001), the CFI value dropped by 0.01(0.98−0.97), indicating that the increased misfit may be nonnegligible. Table 1 reports the standardized factor loadings for the two-factor model. The standardized factor loadings were relatively large, ranging from 0.49 to 0.74 and the correlation between C1/C2/C3 and C4 was 0.76.
Subsample B
CFA was conducted on the four-, three-, and two-factor measurement models using Subsample B to cross-validate the results from Subsample A. The goal of analyzing these models using Subsample B was to determine if we would draw the same conclusions when using an independent sample and if the models were specified a priori.
The four-factor model fit well for Subsample B (RMSEA = 0.054, SRMR = 0.039, CFI = 0.98, χ2 = 2083.35, and df = 318) and the standardized factor loadings were similar to Subsample A’s values. In addition, the correlation between C1 and C2 was also very large (0.95) supporting a lack of discriminant validity. The three-factor model also fit well for Subsample B (RMSEA = 0.056, SRMR = 0.040, CFI = 0.98, χ2 = 2110.10, and df = 321) and the standardized factor loadings were similar to Subsample A’s values. Similar to Subsample A, the misfit between the four- and three-factor models was significantly worse (χ2 = 2110.10−2083.35 = 26.75, df = 3, p < .001), but may be considered negligible based on the small reduction in the goodness-of-fit indices (e.g., the CFI values were both 0.98 in the four- and three-factor models). The model fit for the two-factor model was similar when using Subsample B and Subsample A. According to the CFI and SRMR goodness-of-fit indices, the two-factor model fit the data well (SRMR = 0.043, CFI = 0.97, χ2 = 2937.04, and df = 323); however, the RMSEA value was beyond the acceptable cutoff value of 0.06 (RMSEA = 0.071). In fact, the 90% confidence interval for RMSEA was more than 0.06 (0.068, 0.073). Furthermore, in addition to the difference in chi-square fit indices between the two- and three-factor models indicating a significantly worse fit (χ2 = 2937.04−2110.10 = 826.94, df = 2, p < .001), the CFI value dropped by 0.01(0.98−0.97) indicating that the increased misfit may be nonnegligible. Given these results, it appears that the three-factor model is a reasonable solution.
Discussion
This study of the dimensionality of the SESSS was based on a very large and diverse sample of students. The results of this study confirm indications (Carey et al., 2014) that the SESSS has the potential to be a useful self-report measure of elementary students’ use of strategies and skills associated with enhanced academic learning and achievement. The need for valid and reliable instruments that measure student use of skills, strategies, and personal attributes associated with academic and social/relationship success has been cited as a limitation in school counseling research (Brown & Trusty, 2005). In this vein, the SESSS has the potential to be used as either a screening instrument (for identifying students in need of school counseling interventions to enhance the use of learning strategies) and as an evaluation instrument (to measure the impact of school counseling interventions in the academic development domain).
While the original exploratory factor analysis of the SESSS (Carey et al., 2014) found evidence for the existence of four latent factors, the present CFA found that two of these factors correlate so highly with each other that they cannot be discriminated from each other. CFA results suggest that the original SESSS Self-Management of Learning and Application of Learning Strategies factors are both manifestations of a common latent factor that can be thought of as reflecting Self-Direction of Learning. This self-direction can be accomplished by either the metacognitive management of internal mental processes (i.e., Self-management of Learning) or the intentional application of externally acquired strategies (i.e., Application of Learning Strategies). The present study suggests that the SESSS has three latent factors corresponding to Self-Direction of Learning, Support of Classmates Learning, and Self-Regulation of Arousal.
This factor structure of the SESSS is consistent with several decades of educational research that has identified skills and strategies associated with academic development and achievement including cognitive and metacognitive skills (e.g., goal setting, progress monitoring, and memory skills), social skills (e.g., communication skills, social problem solving, listening, and teamwork skills), and self-management skills (e.g., managing attention, motivation, and anger) (Durlak et al., 2011; Greenberg et al., 2003; Hattie et al., 1996; Marzano et al., 2001; Masten & Coatsworth, 1998; Zins et al., 2004). Regarding the SESSS factors, Self-Direction of Learning relates closely to the categories of cognitive skills, meta-cognitive skills, and the intentional self-regulation of cognitive processes. Support of Classmates Learning relates closely to social skills that support classroom learning. Self-Regulation of Arousal relates to the self-management of arousal and emotion that can interfere with effective learning. While the actual associations of SESSS factors with specific, previously established constructs requires empirical study, it is encouraging that the factor structure determined in this research corresponds with previous research.
Limitations
The SESSS measures three factors associated with student performance. It is not a comprehensive measure of student factors associated with achievement. While the SESSS may be useful to school counselors in measuring a portion of their impact on student behavior associated with achievement, it does not attempt to measure many other aspects of a comprehensive school counseling program that follows the ASCA model. Brown and Trusty (2005) cited the lack of instruments that measure the skills, strategies, and personal attributes associated with academic and social/relationship success. The SESSS attempts to address a small portion of this call for more valid and reliable instruments.
Implications for Future Research
To maximize the utility of the SESSS additional studies of its psychometric properties are needed. These studies should include: (a) a study of the reliability and intercorrelations of subscales corresponding to the three SESSS scales; (b) a predictive validity study that establishes the relationships between SESSS scales and measures of academic success (e.g., achievement test scores, grades, and teacher ratings); and (c) a convergent-divergent validity study to investigate how the scales relate to measures of similar (e.g., metacognitive skills, self-regulated learning) and dissimilar (e.g., self-efficacy, cognitive engagement) constructs. These additional studies are needed to firmly establish the utility of this instrument as a reliable and valid measure of student success skills. Studies of the test–retest reliability of the SESSS are needed to determine the stability of scores over time—especially since one intended use of the SESSS is as an outcome measure for treatment studies. Studies are needed to determine the appropriate age range within which the SESSS is appropriate, whether this age range can be extended through modifications in the instrument, and whether the same dimensionality exists in data from younger and older students. Finally, it would be very useful to determine national norms for the SESSS based on administration to a large nationally representative sample of students.
Conclusion
With additional research, SESSS has the potential to develop into a useful tool that can be used by professional school counselors and researchers to measure elementary, middle, and high school students’ levels of engagement in strategies linked to the self-regulation and application of learning skills, support of classmates’ learning, and self-regulation of arousal. The SESSS has several distinct benefits. It is short (33 items), can be administered in a classroom setting, and takes less than 15 minutes to complete.
Data collected on the SESSS instrument can help school counselors monitor student progress, identify barriers to learning, and increase understanding of factors affecting student behavior. A review of the SESSS student data may reveal gaps between student groups and identify the need for additional education opportunities and counseling interventions. Analysis of the SESSS student data could lead to decisions about future goals of the school counseling program and discussions with administration and staff about program improvement. Finally, results on the SESSS and changes in student attitudes and knowledge about their learning, self-regulation, and support of classmates can be shared with various stakeholders through a variety of report formats (i.e., websites, handouts, and newsletters), publications, or presentations at the local, regional, or national level. In addition, school counselors may use the SESSS instrument as a pre- and posttest measure in conjunction with delivering classroom guidance interventions. Student data on the SESSS can be used to demonstrate how school counselors can influence student academic and personal/social development related to classroom learning and achievement.
Footnotes
Authors’ Note
The opinions expressed are those of the authors and do not represent views of the Institute or the U.S. Department of Education.
Declaration of Conflicting Interests
The author(s) declare the following potential conflicts of interest with respect to the research, authorship, and/or publication of this article. Greg Brigman holds copyrights and receives royalties on the SSS program. An approved potential conflict of interest management plan to protect the objectivity of the research was in place during this study.
Funding
The author(s) disclosed receipt of the following financial support for the research, authorship, and/or publication of this article: The research reported here was supported by the Institute of Education Sciences, U.S. Department of Education, through Grant R305A120810 to Florida State University.