
Abstract
We adapted a work self-determination measure to create the Basic Needs Satisfaction at College Scale. Confirmatory factor analysis and item response theory analyses with data from 525 adults supported a 3-factor model with 13 items most sensitive for lower to middle range levels of the autonomy, competence, and relatedness constructs.
With the growing importance of obtaining a college degree in our society (Sidle & McReynolds, 2009), student persistence and academic performance have become prominent issues in higher education (Friedman & Mandel, 2009; Jones & Braxton, 2009). Research investigating student retention in college has often focused on the first year and directly after when attrition is highest (Barefoot, 2004), along with intervention programs designed to target student outcomes such as learning communities and first-year seminar courses. Furthermore, researchers have tried to identify and understand a multitude of student characteristics associated with important outcomes such as persistence and graduation rate (Peltier, Laden & Matranga, 1999). Although prior academic performance indicators (e.g., high school GPA) are often used as predictors of college GPA and persistence (Friedman & Mandel, 2009; Oseguera & Rhee, 2009), recent research has also provided strong support for cognitive variables such as academic self-efficacy (Brown et al., 2006; Wright, Jenkins-Guarnieri, & Murdock, 2013) as useful predictors (Robbins et al., 2004). In the same vein, a growing body of research supports the role of self-determination theory (SDT; Deci & Ryan, 2000, 2002) constructs and their relationships to intrinsic motivation (Dysvik, Kuvaas, & Gagne, 2013; Goudas, Biddle, & Underwood, 1995), persistence (Deci & Ryan, 2002), and achievement (Field, Sarver, & Shaw, 2003; Flink, Boggiano, & Barrett, 1990) in educational contexts. The central concept for SDT postulates that individuals are motivated by fundamental psychological needs for autonomy, competence, and relatedness, which are necessary for healthy development and well-being (Deci & Ryan, 2000). Despite this extensive scholarship on SDT and basic psychological needs fulfillment (Deci & Ryan, 2000), few studies have focused on psychometrically rigorous measurement of these constructs (Johnston & Finney, 2010). Thus, in this study we adapted a previously published measure of self-determination for work environments to create a new scale for the domain of college environments, evaluated its factor structure and item characteristics, and provided preliminary validity evidence for its use with undergraduate students. It is our hope that this new measure will offer researchers a more systematic and simplistic way to empirically test the theoretical concepts of SDT instead of having to use multiple scales or adapt prior measures when assessing students’ basic needs related to the college environment.
Self-Determination Theory
A synthesis of psychosocial variables, SDT has been a widely researched system of thought in the field of motivation and psychology for the past several decades (Deci & Ryan, 2002). As such, SDT has provided a powerful framework to help explain many of the processes affecting behavior in a wide range of contexts including educational and work settings (Deci & Ryan, 2002; Deci, Vallerand, Pelletier, & Ryan, 1991). During this time, SDT has evolved to reflect the contributions of related foundational theories that “all share organismic and dialectical assumptions and all involve the concept of basic psychological needs” (Deci & Ryan, 2002, p. 9). Deci and Ryan (2002) theorized that an individual’s basic psychological needs reflect an interaction of three key constructs: autonomy, competence, and relatedness. Furthermore, they state that all three of these basic constructs must be fulfilled or satisfied for an individual to function optimally and feel self-determined. Sheldon and Gunz’s (2009) recent study provided further support of these ideas, as well as providing evidence that a person low in these constructs would, “also be motivated to correct the situation” (p. 1486).
Deci and Ryan (2002) essentially define autonomy as the freedom to make decisions, and suggest that a responsive and motivating environment helps fulfill autonomy needs. Freedom allows individuals, “to act in accord with, or be ‘true’ to [the] self,” which is the basis of SDT (Deci & Ryan, 2002, p. 3). Haworth (1986) described this basic need as the ability for individuals to independently assess their interests and needs in a given environment with the agency to enact changes to manifest them. Thus, the construct of autonomy is central to SDT and satisfaction thereof is crucial for individuals to feel self-determined. The idea of competence has been identified as another integral theoretical construct that refers to a person’s perceptions of self-confidence and “effectance in action” (Deci & Ryan, 2002, p. 7) rather than any set of abilities. When individuals feel competent, they will seek out challenges and look for opportunities to improve their skills. Therefore, for individuals to feel self-determined, the environment must provide opportunities for them to demonstrate their competence as well as opportunities to develop competency. The idea of relatedness refers to an individual’s relationships with others. Does this person care about the others in his or her environment? Are these feelings reciprocated? Is there a sense of community? Answering each of these questions positively reflects a sense of belongingness, and hence relatedness as conceptualized in SDT (Deci & Ryan, 2002). Accordingly, individuals must experience fulfillment in all three domains of basic psychological needs (autonomy, competence, and relatedness), in order to feel self-determined and maintain psychological well-being.
Self-Determination Theory and College Student Outcomes
In predicting college student outcomes such as persistence and academic success, recent research supports prior work identifying high school GPA as an important variable in predicting college GPA (Friedman & Mandel, 2009), but this predictor may have only indirect relationships to student retention (Brown et al., 2006). Furthermore, Robbins et al.’s (2004) meta-analysis found that cognitive variables such as academic goals and academic self-efficacy, as well as skills related to academic success, best predicted student persistence in college. In addition, they found that achievement motivation and academic self-efficacy were important variables in predicting college GPA, even beyond the traditional predictors of high school GPA and standardized test scores. Furthermore, a number of studies have demonstrated the relationship between college self-efficacy, specifically, and student persistence (Barry & Finney, 2009) and academic performance (Gore, 2006). Thus, researchers are beginning to focus more intently on cognitive and psychosocial variables specific to the experience of college students in studying factors associated with important outcomes.
SDT’s basic needs satisfaction construct (Deci & Ryan, 2002) has also received prominent attention in this research literature. Studies have supported its potential role in student success (Sheldon & Krieger, 2007), and self-determination constructs have been associated with important student outcomes such as persistence intentions (Hardre & Reeve, 2003), achievement (Boiché, Sarrazin, Grouzet, Pelletier, & Chanal, 2008; Brockelman, 2009), student learning and performance (Vansteenkiste, Simons, Lens, Sheldon, & Deci, 2004), and motivation for class (Ciani, Sheldon, Hilpert, & Easter, 2011). Given calls for more research on self-determination and its potential relationships to student outcomes (Brockelman, 2009; Young, Johnson, Hawthorne, & Pugh, 2011), more research must investigate the role of SDT constructs in student outcomes such as persistence and academic success among college students. However, the research on these topics have focused on concepts related to SDT and have used multiple scales to asses SDT areas, with the exception of Brockelman’s (2009) study that used a 21-item basic needs scale related to academic course work. Therefore, the aforementioned studies were lacking a single measure that was theoretically derived from SDT and assessed all three basic need areas (i.e., autonomy, competence, and relatedness). As there is still a need for strong measurement for self-determination constructs (Guiffrida, Gouveia, Wall, & Seward, 2008), especially for college student populations and educational contexts (Johnston & Finney, 2010), we set out to develop a useful measure of self-determination with strong evidence for validity and sound psychometric data for a college student sample.
Measuring Self-Determination in College Students
In their recent work evaluating a general scale measuring basic needs fulfillment, Johnston and Finney (2010) called for more research on how SDT constructs are measured and operationalized. These authors evaluated the self-determination measure called the Basic Needs Satisfaction in General Scale (BNSG-S) created by Gagné (2003) by adapting a self-determination scale oriented specifically toward the work environment developed by Ilardi, Leone, Kasser, and Ryan (1993) called the Basic Needs Satisfaction at Work Scale (BNSW-S); see Johnston and Finney (2010) for a history of these scales’ developments. Gagné’s (2003) adapted measure was created to apply more generally, instead of measuring self-determination in a specific domain. In evaluating the BNSG-S, Johnston and Finney (2010) applied a rigorous methodology and presented evidence for a modified model that was validated in three independent samples of college students that consisted of freshman (N = 2,598), upperclassmen (N = 1,035), and psychology students (N = 492). However, these authors raised concerns about unexpected psychometric characteristics observed (e.g., low internal consistency estimates), the emergence of an effect for negative wording, and the potential for this scale’s limited utility without significant replication and refinement. With regard to low alpha coefficients, the freshman sample scores were .60, .55, and .78 for autonomy, competence, and relatedness subscales, respectively; the upper classmen scores were .68, .62, and .82, respectively; the psychology sample scores were .62, .60, and .80, respectively (Johnston & Finney, 2010). They also advocated for more research on domain-specific measures, arguing that generalizability of their findings should not be applied to other measures of self-determination in specific contexts. Thus, more research is needed to build on recent developments by these authors and others to create useful self-determination scales through rigorous methods in multiple domains of interest.
Many authors have adapted Ilardi et al.’s (1993) BNSW-S to measure self-determination (e.g., Deci et al., 2001), and some have used this scale with college student populations (e.g., Brockelman, 2009). Reeve and Sickenius (1994) developed a novel scale through moderately rigorous methods (e.g., two confirmatory factor analyses [CFAs] with a sample size of 162 and 120 individuals; goodness-of-fit index of .9) to measure basic needs in college student samples, but treated the three basic constructs of SDT as more transitory states. Their conceptualization of basic needs as short-lived ephemeral experiences does not align with SDT’s postulate that these are innate fundamental needs that are long-standing (Deci & Ryan, 2000), which may limit future researchers from empirically testing SDT. Sheldon, Elliot, Kim, and Kasser (2001) created three items per construct of self-determination for their study’s scale, but did not provide adequate psychometric data. Most recently, Sheldon and Hilpert (2012) provided evidence of further construct validity for a developed scale, the Balanced Measure of Psychological Needs Scale; however, the intent, again, was to measure need satisfaction more generally rather than in a specific domain. Despite these previous scales, some of which have been used with college student populations, no study thus far has created or adapted a measure of self-determination for the specific domain of the college student experience accompanied by strong psychometric data and validity evidence. Furthermore, researchers have called for more rigorous research on measuring self-determination constructs (Guiffrida et al., 2008), especially for use with college student populations and in educational contexts (Johnston & Finney, 2010). Therefore, more research is needed to develop a strong measure of self-determination specific to the college domain for use with college students.
Purpose of the Study
Following the calls for more research on strong measurement of SDT constructs, the purpose of this study was to adapt the BNSW-S (Deci et al., 2001; Ilardi et al., 1993) for the specific context of college student experiences, evaluate psychometric data, and provide preliminary validity evidence for its use with young adults in academic settings. Although a few self-determination studies have been conducted using the BNSW-S with college student populations (e.g., Filak & Sheldon, 2003), comprehensive psychometric data have yet to be presented for this scale in college student samples and we are not aware of any research following strong scale development methods to develop a self-determination measure specific to the college student experience and environment. When focusing on specific domains, researchers have used the BNSW-S (cf. Brockelman, 2009; Deci et al., 2001) as opposed to the general scale (BNSG-S; Gagné, 2003). Thus, the present study used CFA procedures to evaluate the factor structure of an adapted scale to create the Basic Needs Satisfaction at College Scale (BNSC-S). In parallel, item response theory (IRT) analyses provided further support as well as in-depth evaluation of item properties and functioning. In addition to positive relationships with intrinsic motivation and persistence, self-determination has been shown to be related to psychological well-being and vitality (Vansteenkiste, Lens, Soenens, & Luyckx, 2006) as well as enjoyment and satisfaction with school (Vallerand, Blais, Briere, & Pelletier, 1989). Therefore, we also assessed the relationship between students’ perceived self-determination at college and satisfaction with life at their specific university to provide preliminary validity evidence for the adapted BNSC-S.
Method
Participants
Participants were undergraduate students enrolled in sections of a first-year seminar course at a medium (N = 14,000), western region research university; this study’s protocol was approved by the host university’s institutional review board. Surveys were obtained from 541 participants on the last day of class; complete data were available for 525 participants (2.95% missing data with a pattern that suggested early attrition from participants who appeared to stop answering the survey items after a given point). Participants were all first-year, first-time college students and identified as 73% Caucasian, 15.9% Hispanic, 4.3% Asian, and 2.6% African American; 6% declined to state their ethnicity. In addition, 66% of participants were female and 44% reported being a first-generation college student.
Measures
Self-Determination
The BNSW-S (Deci et al., 2001; Ilardi et al., 1993) is a 21-item measure developed to evaluate perceived levels of autonomy, competency, and relatedness in a professional work context. We adapted these items in order to measure self-determination with young adults in college environments to create the BNSC-S. For the BNSW-S, respondents rate their level of belief in the truth of each scale item when applied to themselves by using a Likert-type scale ranging from 1 (Not at all true) to 7 (Very true) with a midpoint anchor on response option 4 (Somewhat true); subsequent research with the BNSW-S has used a 5-point Likert-type scale (Brockelman, 2009; Deci et al., 2001). Sample items include “Most days I feel a sense of accomplishment from what I do” (competency), “I am free to express my ideas and opinions” (autonomy), and “I get along with people at work” (relatedness). The original scale contained seven items measuring autonomy, eight for relatedness, and six for competency, with higher subscale mean scores indicating greater needs satisfaction in that domain. Deci et al.’s (2001) study found Cronbach’s alpha reliability coefficients of .73, .84, and .79 for data collected using the competence, relatedness, and autonomy subscales, respectively.
Following a process similar to Gagné (2003), we adapted the BNSW-S specifically for use with college student populations and their basic psychological needs during undergraduate academic environments, adapting scale items to apply directly to the college life context and experience (see Table 1 for BNSC-S items). The first two authors collaborated on adapting the specific wording of items based on SDT, repurposing them for our adapted, domain-specific scale; the second author is also an expert on the topic, which assisted with establishing content validity. For example, the three aforementioned BNSW-S items were adapted to become: “Most days I feel a sense of accomplishment from attending classes and studying” (competency), “I am free to express my ideas and opinions at school” (autonomy), and “I get along with people at [the university]” (relatedness). Seven items from the BNSW-S were excluded in the adaptation process due to poor fit with the specific purpose of our scale, as they would have applied well only for work settings without significant changes to content (i.e., Items 1, 5, 11, 13, 15, 20, and 21). Furthermore, we created two additional items based on SDT to capture the autonomy construct, as the number of items representing this basic need were significantly lower than for the other domains. These two items were “I understand the purpose of my classroom requirements” and “I am encouraged by my professors at [this university] to participate in my classes,” and reflect the idea that professors can support autonomy by “providing a meaningful rationale when choice is not possible” (Filak & Sheldon, 2003, p. 236). For the BNSC-S, respondents rated their level of belief in the truth of each scale item when applied to themselves by using a Likert-type scale ranging from 1 (Not at all true) to 5 (Very true) with a midpoint anchor on response option 3 (Somewhat true). Thus, the adapted scale initially containing 16 items yielded internal consistency reliability estimates for the three subscales based on these data of .78, .72, and .83 for the autonomy, competence, and relatedness subscales, respectively.
Basic Needs Satisfaction at College Scale Items.
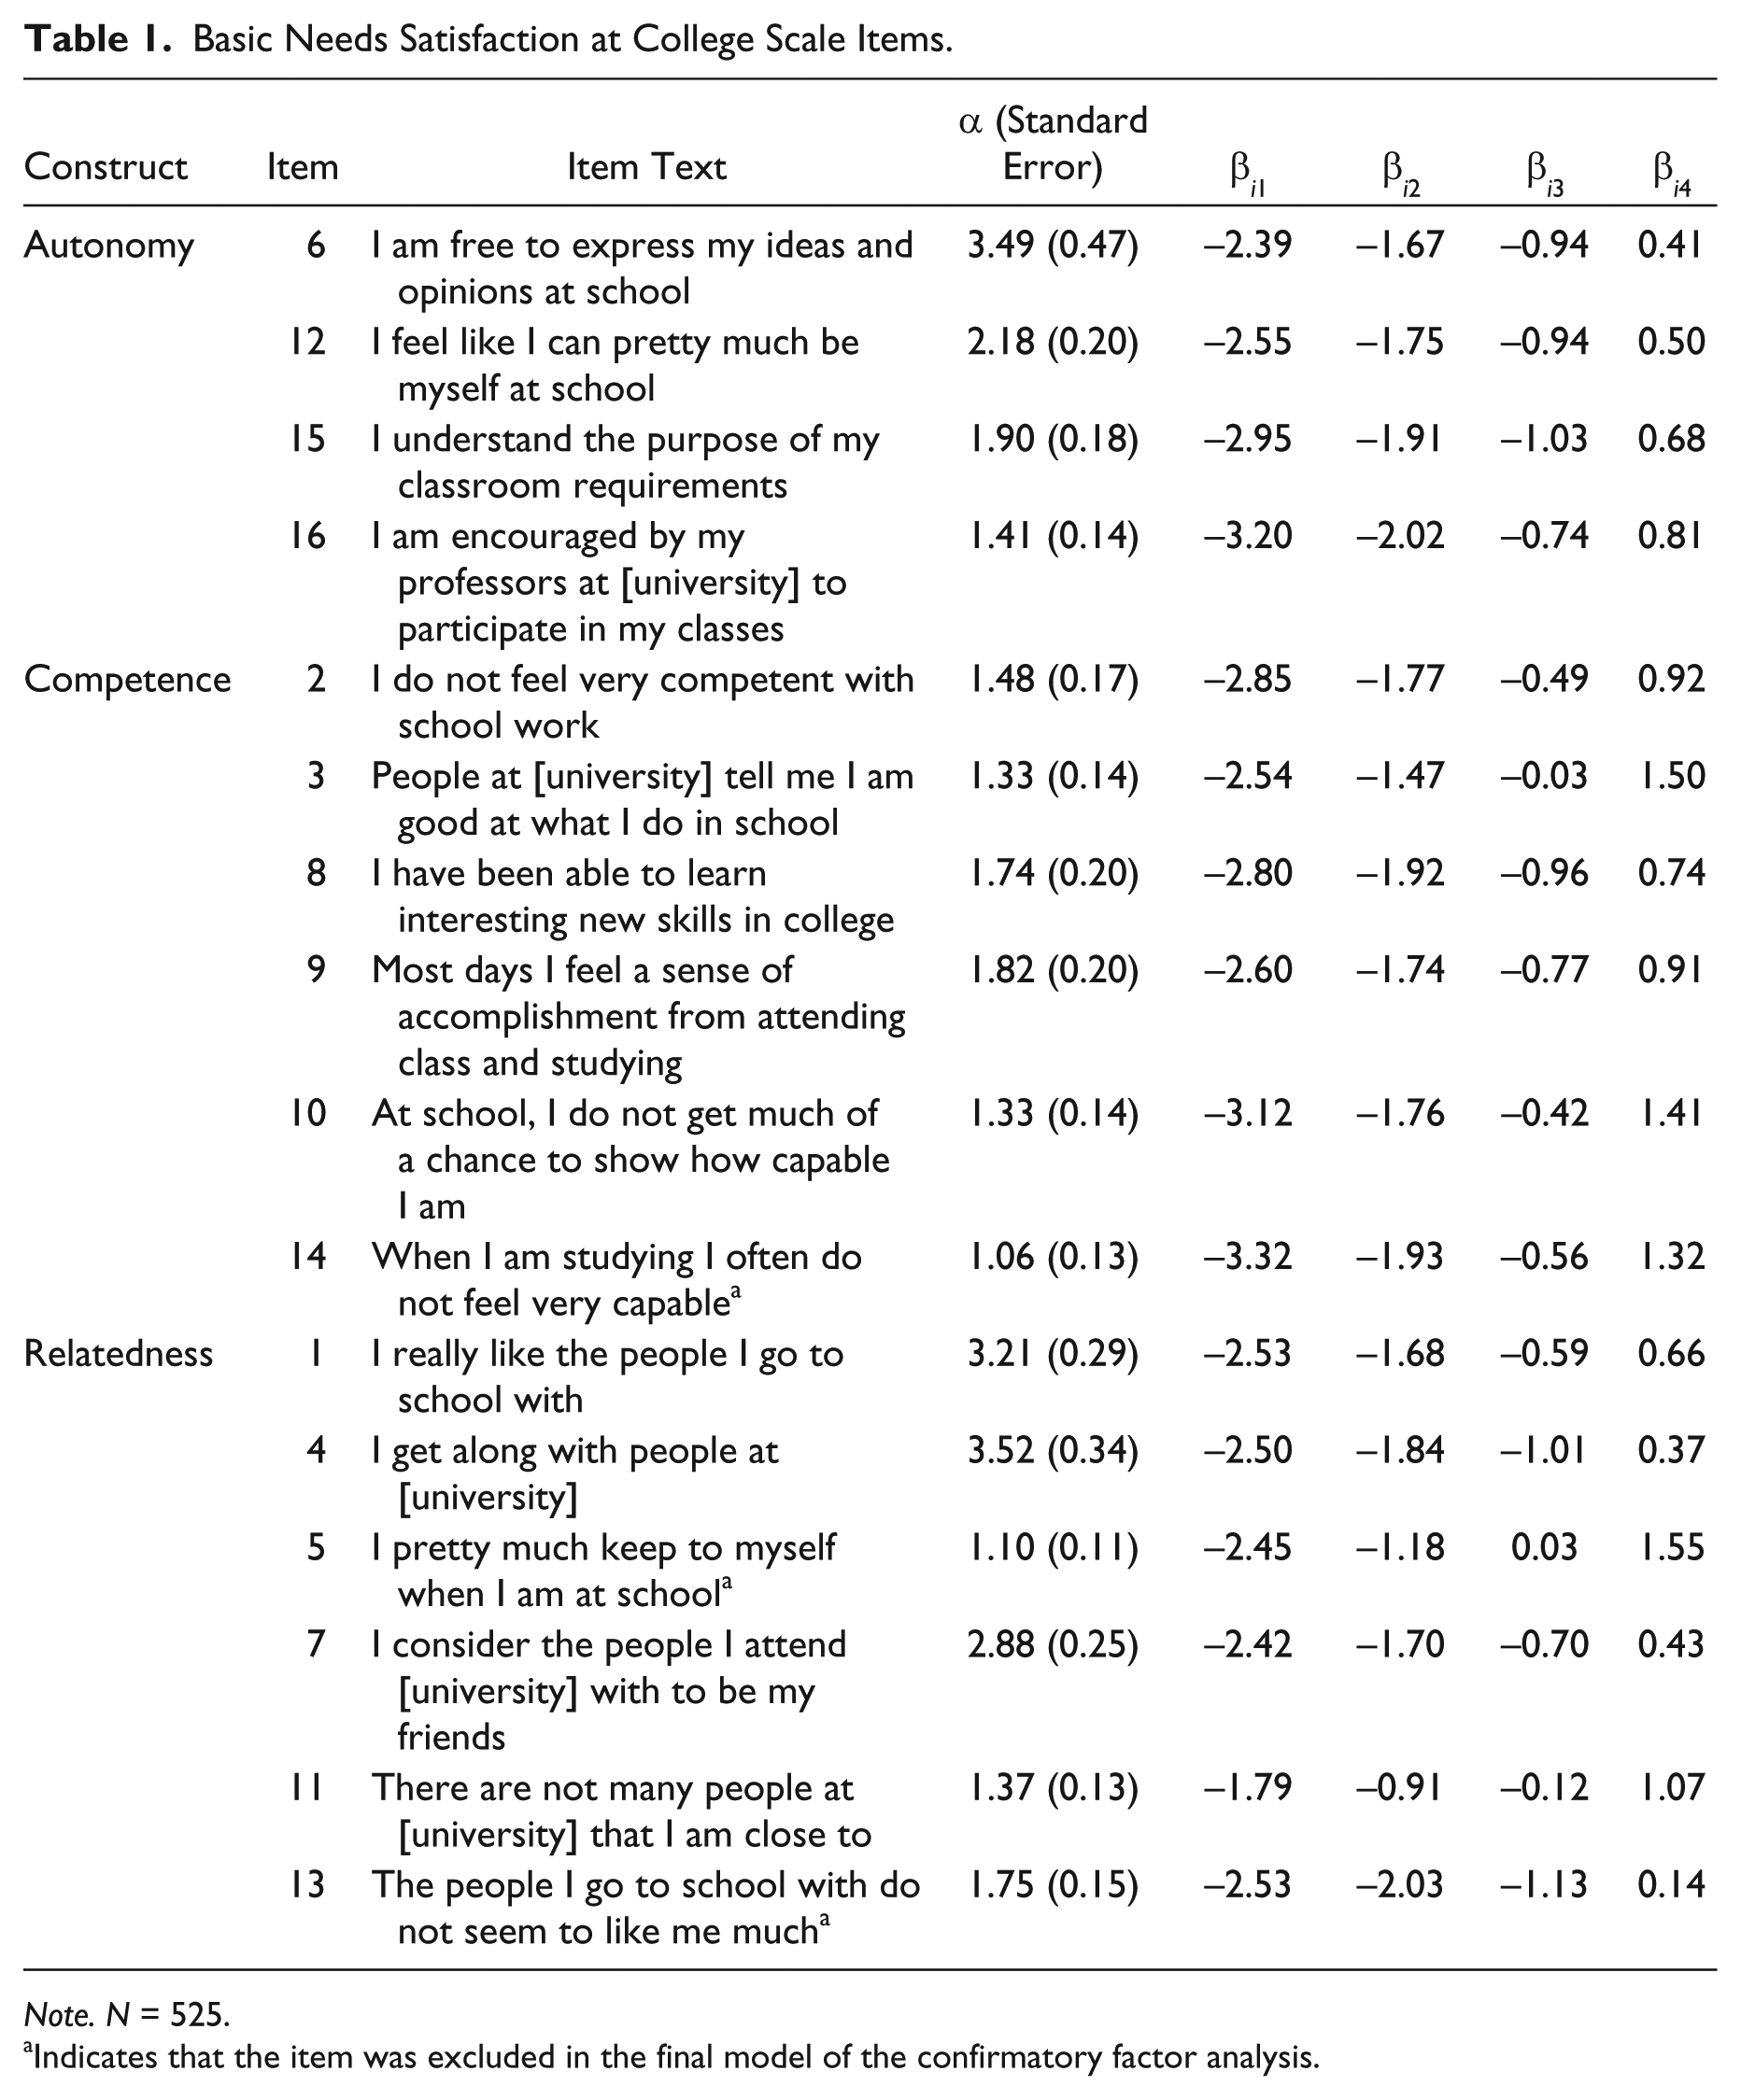
Note. N = 525.
Indicates that the item was excluded in the final model of the confirmatory factor analysis.
Student Satisfaction
Satisfaction with the university and life in college generally was measured using an adapted version of the Satisfaction with Life Scale (Diener, Emmons, Larsen, & Griffin, 1985). Previous research by Pavot, Diener, Colvin, and Sandvik (1991) found the original Satisfaction with Life Scale appropriate for use with all adult age groups, and presented strong evidence for its convergent validity and its unitary factor structure. Others have also found that items related to life satisfaction essentially tap a unidimensional construct (Slocum-Gori, Zumbo, Michalos, & Diener, 2009). This scale consists of five brief statements which we adapted to focus on satisfaction with life at a particular university instead of life in general. Adapted items included “I am satisfied with my life here at [this university]” and “the conditions of my life at this university are excellent.” Participants rated their level of agreement with each of these items using a Likert-tpye scale from 1 (Strongly disagree) to 7 (Strongly agree). Cronbach’s alpha internal consistency estimate calculated from Pavot et al.’s (1991) data was .87, whereas the alpha calculated from data collected using our revised items was .86 in our sample.
Data Analysis
We conducted preliminary analyses using PASW Statistics software (Release 17) to calculate descriptive statistics and examine the data distributions. Potential problems with nonnormality in these data were assessed by examining skew and kurtosis statistics falling beyond absolute values of 2 and 7, respectively (Hoyle, 1995). To help establish convergent validity evidence for the adapted BNSC-S, bivariate correlations were calculated to analyze relationships between BNSC-S subscale mean scores and mean scores on the adapted measure of satisfaction with life at college.
Following Johnston and Finney’s (2010) recommendation for more investigations into the factor structure of measurement scales, we conducted CFA using LISREL 8.80 (Jöreskog & Sörbom, 1996) to evaluate the factor structure of our scale and its three proposed subscales. Our sample size of 525 participants aligns well with Kline’s (2011) suggestions for minimum sample size, and exceeds the recommended ratio of 20:1 for cases to estimated model parameters (N:q). Given that we adapted a prior established measure that was theoretically developed in accordance with SDT (Ilardi et al., 1993) and has been empirically supported in prior studies (Deci et al., 2001; Filak & Sheldon, 2003), we decided to proceed with a CFA and not an exploratory factor analysis. Accordingly, a CFA is more appropriate when researchers have an idea about the number of factors (Ullman, 2006) and a prior hypothesis about the factor structure (Kline, 2011; Loehlin, 2004). Specifically, as the original BNSW-S proposed a three-factor structure, consisting of unidimensional and covarying autonomy, competence, and relatedness factors, this same factor structure was proposed for the BNSC-S. All residuals were estimated and were hypothesized to be uncorrelated, and the first item for each factor was restricted to 1 in order to ensure model identification (Kline, 2011). All models were evaluated for global fit (cutoff criteria described below) as well as component fit by assessing the statistical significance and plausibility of parameter estimates. Last, modification indices and squared multiple correlations for individual items were examined to determine any viable potential respecifications because of model misspecifications. Nested models were compared using the chi-square difference test to evaluate any potential change in fit for nested models (Kline, 2011).
We treated the scale data as ordinal by calculating a polychoric correlation matrix and using maximum likelihood estimation methods evaluated with multiple fit indicators to assess global fit (Bentler & Chih-Ping, 1987). The comparative fit index (CFI; Bentler, 1990) and the nonnormed fit index (NNFI; Bentler & Bonett, 1980) have been shown to be minimally affected by nonnormality (Hutchinson & Olmos, 1998) with maximum likelihood estimation. Beauducel and Wittmann (2005) also recommended using the Steiger–Lind root mean square error of approximation (RMSEA; Steiger, 1990) and the standardized root mean square residual (SRMR; Bentler, 1995; Jöreskog & Sörbom, 1986) in psychology research contexts. In assessing model fit, the following cutoff criterion for these fit statistics were used: >.95 for the NNFI and CFI, <.08 for the SRMR, and <.06 for the RMSEA (Beauducel & Wittmann, 2005; Hu & Bentler, 1999).
To compliment these classical test theory analyses, we also applied IRT and Samejima’s (1969) graded response model (GRM) using marginal maximum likelihood estimation for each of the three BNSC-S subscales using the Ltm package (Rizopoulos, 2006) for R software (Release 3.0.0; R Core Team, 2013). IRT examines the relationships between the underlying latent trait being measured and each item being analyzed as part of the measurement instrument, and assumes that a person’s likelihood of choosing a specific item response is determined by the level of trait that person exhibits (Ostini & Nering, 2006). The latent trait (labeled theta, θ; assumed to be normally distributed and commonly displayed with a mean of 0 and a SD of 1) and the items are placed on the same continuum, as items are assumed to capture different areas of the underlying trait range and are located at different points on the θ metric (item location symbolized as β; DeMars, 2010). Thus, someone with a high level of a given latent trait answering an item located in the middle range of the θ metric will be more likely to reflect this high trait level using the item’s scale (Ostini & Nering, 2006), for example, selecting the “true as applied to me” response option associated with a higher trait level. Items are also assumed to manifest differing levels of discrimination (labeled parameter α; often conceptualized as the slope of the item response function), which can be seen as the item’s ability to effectively differentiate among people with varying levels of the underlying trait (DeMars, 2010). In IRT these item characteristics are assumed to be invariant, meaning that they are not tied to a specific group of test takers.
In the GRM, the ordered categories of Likert-type scales can be dichotomized into “the probability of scoring in or selecting each category or higher” (DeMars, 2010, p. 23), and so the β parameters represent the thresholds between Likert-type number categories (for k − 1 response categories) on the θ metric (Embretson & Reise, 2000). Thus, a β ij threshold can be interpreted as “the trait level necessary to respond above threshold j with .50 probability” (Embretson & Reise, 2000, p. 98), and are depicted graphically by parallel item characteristic curves (DeMars, 2010) for each threshold (also called item response functions). The probability of someone actually selecting a specific response (i.e., Likert-type scale number choice) based on latent trait level can be represented by category response curves (CRCs; Embretson & Reise, 2000; also called operating characteristic curves). In IRT, scale items can be evaluated by analyzing their parameters (α and β), the performance of scale response options used and how well they capture the latent trait range (e.g., analyzing the distribution of CRC), and by considering estimations of information provided by items. Information functions for items reflect the amount of information provided about the latent trait and reflect the precision of measurement at different θ locations (Ostini & Nering, 2006). Summing information for items comprising a subscale yields a test information function (TIF), which can be seen as a correlate to the concept of reliability in classical test theory that varies by θ and the specific comprising item characteristics, and can be used to calculate the standard error of measurement for the θ range (DeMars, 2010). We considered the most information provided across the broad middle range of the trait spectrum (θ values from −2 to 2) to be ideal for measuring basic needs satisfaction domains measured by the BNSC-S. Our sample size exceeded Reise and Yu’s (1990) minimum recommendation of 500 for GRM applications.
Results
We first calculated descriptive statistics and bivariate correlations for all continuous variables (see Table 2) using the sample of 525 participants with complete data after using listwise deletion to address missing data for the original sample of 541 given the pattern of attrition in which some participants stopped answering survey items after a given item and some stopped during/after the demographic questionnaire. Thus, we had 16 cases (2.95%) that were removed using this method and it has been suggested that less than 5% of missing data is not a concern (Kline, 2011) and 5% is one of the more conservative cutoff levels (Schlomer, Bauman, & Card, 2010). No evidence of nonnormality was detected in these data and an inspection of the correlation matrix (see Table 2) revealed that multicollinearity (rxy > .85) was not detected among the subscales initially before proceeding with analyses (Kline, 2011). Overall fit indices for the CFA analyses are presented in Table 3 for all estimated models. Although parameter estimates were all significant in Model 1, this model did not demonstrate adequate overall fit to the data. We then made post hoc model modifications to produce a better fitting and useful model by analyzing modification indices, completely standardized coefficients, and R2 values for each scale item. In Model 1, Item 14 had an R2 of .13 and a completely standardized coefficient of .35, both of which indicated that this item did not explain a significant proportion of variance and so it was removed. Model fit improved significantly for this and all subsequent model modifications, based on a chi-square difference test (see Table 3). In Model 2, Item 13 was removed due to a large modification index suggesting a potential double-loading (>500), and in Model 3, Item 5 was removed due to a low R2 value (.18), a high modification index (>500), and a low completely standardized coefficient (.43). All the unstandardized parameter estimates in this final model were statistically significant (p < .01), and the overall fit statistics suggested acceptable fit. Although the RMSEA statistic was larger than the more stringent criteria upper boundary of .06 (Hu & Bentler, 1999), the model demonstrated acceptable fit to the data when considering all the fit indices together. Thus, analyses supported a 13-item, 3-factor model with practically meaningful parameter estimates that demonstrated acceptable overall fit to the data; the final model with completely standardized parameter estimates are shown in Figure 1. We did not investigate a higher order factor structure given our a priori hypothesized model structure, our theoretical foundation (SDT) specifying three interrelated constructs, and concerns about the potential for data-driven model modifications that could limit our findings to the sample under study.
Correlation Matrix, Descriptive Statistics, and Scale Reliability Estimates for All Continuous Variables.
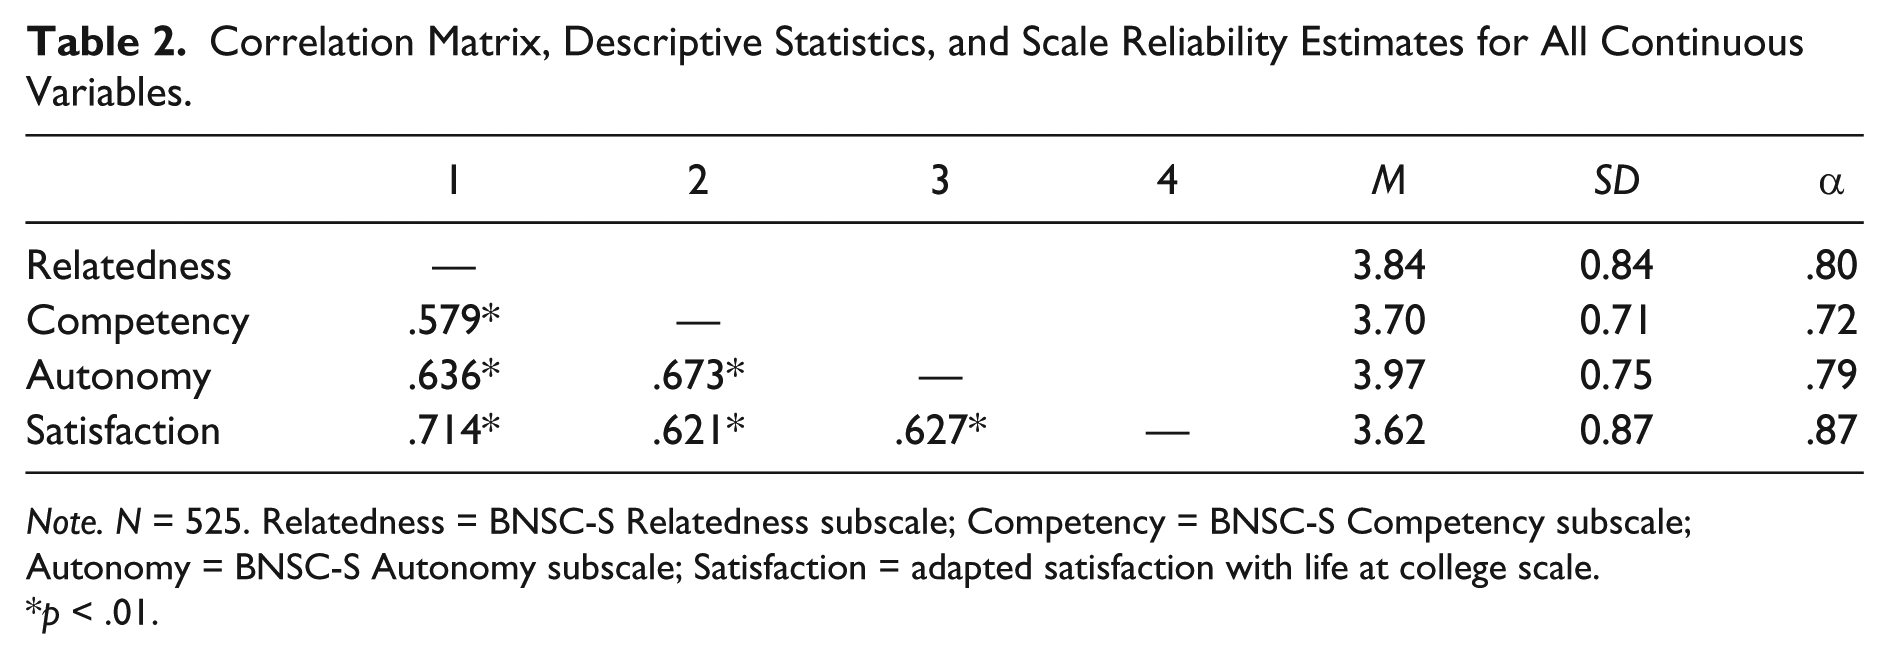
Note. N = 525. Relatedness = BNSC-S Relatedness subscale; Competency = BNSC-S Competency subscale; Autonomy = BNSC-S Autonomy subscale; Satisfaction = adapted satisfaction with life at college scale.
p < .01.
Overall Model Fit Statistics for Baseline and Nested Models.
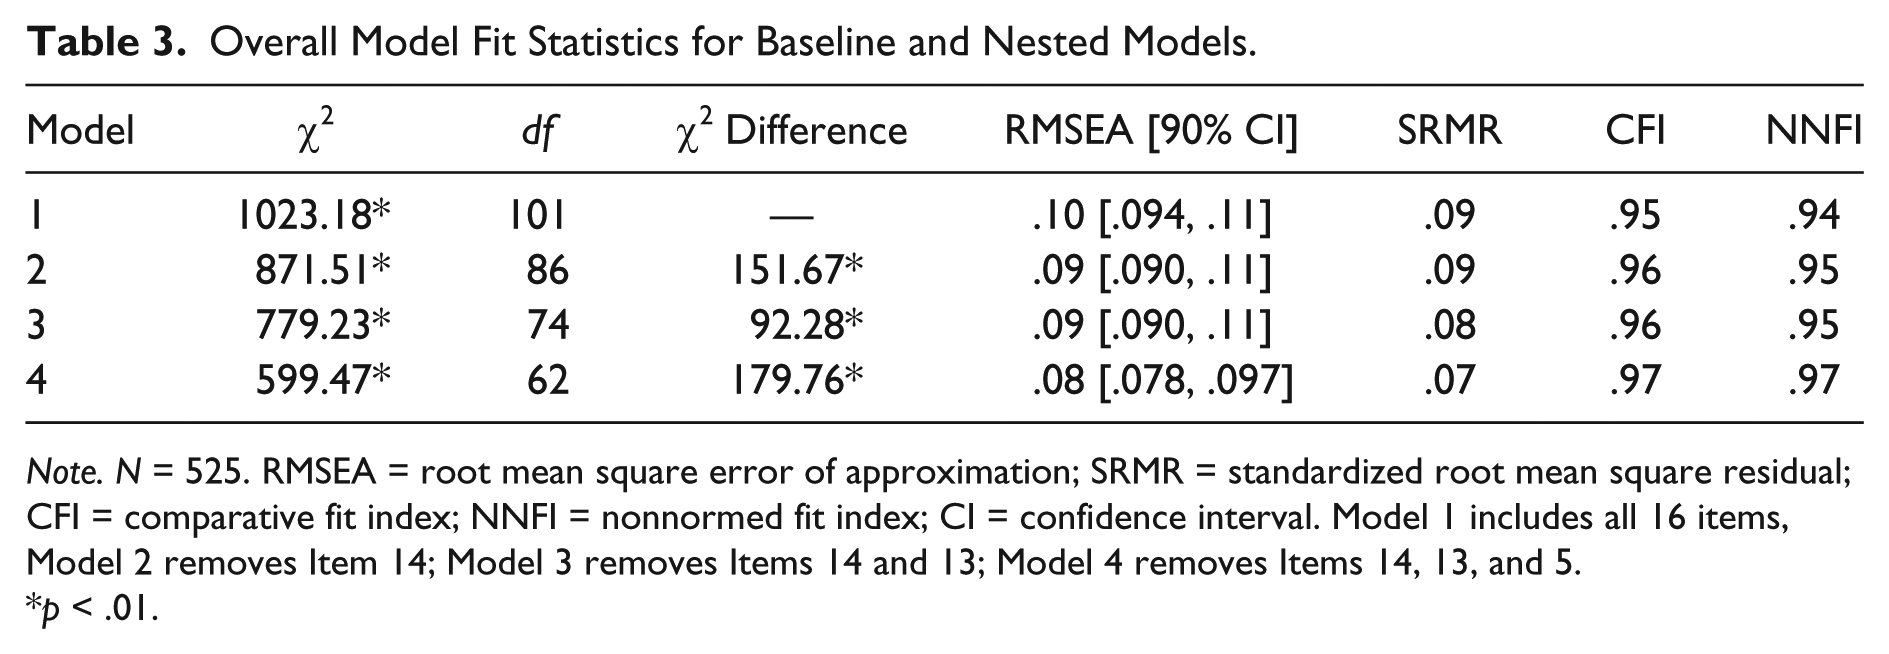
Note. N = 525. RMSEA = root mean square error of approximation; SRMR = standardized root mean square residual; CFI = comparative fit index; NNFI = nonnormed fit index; CI = confidence interval. Model 1 includes all 16 items, Model 2 removes Item 14; Model 3 removes Items 14 and 13; Model 4 removes Items 14, 13, and 5.
p < .01.
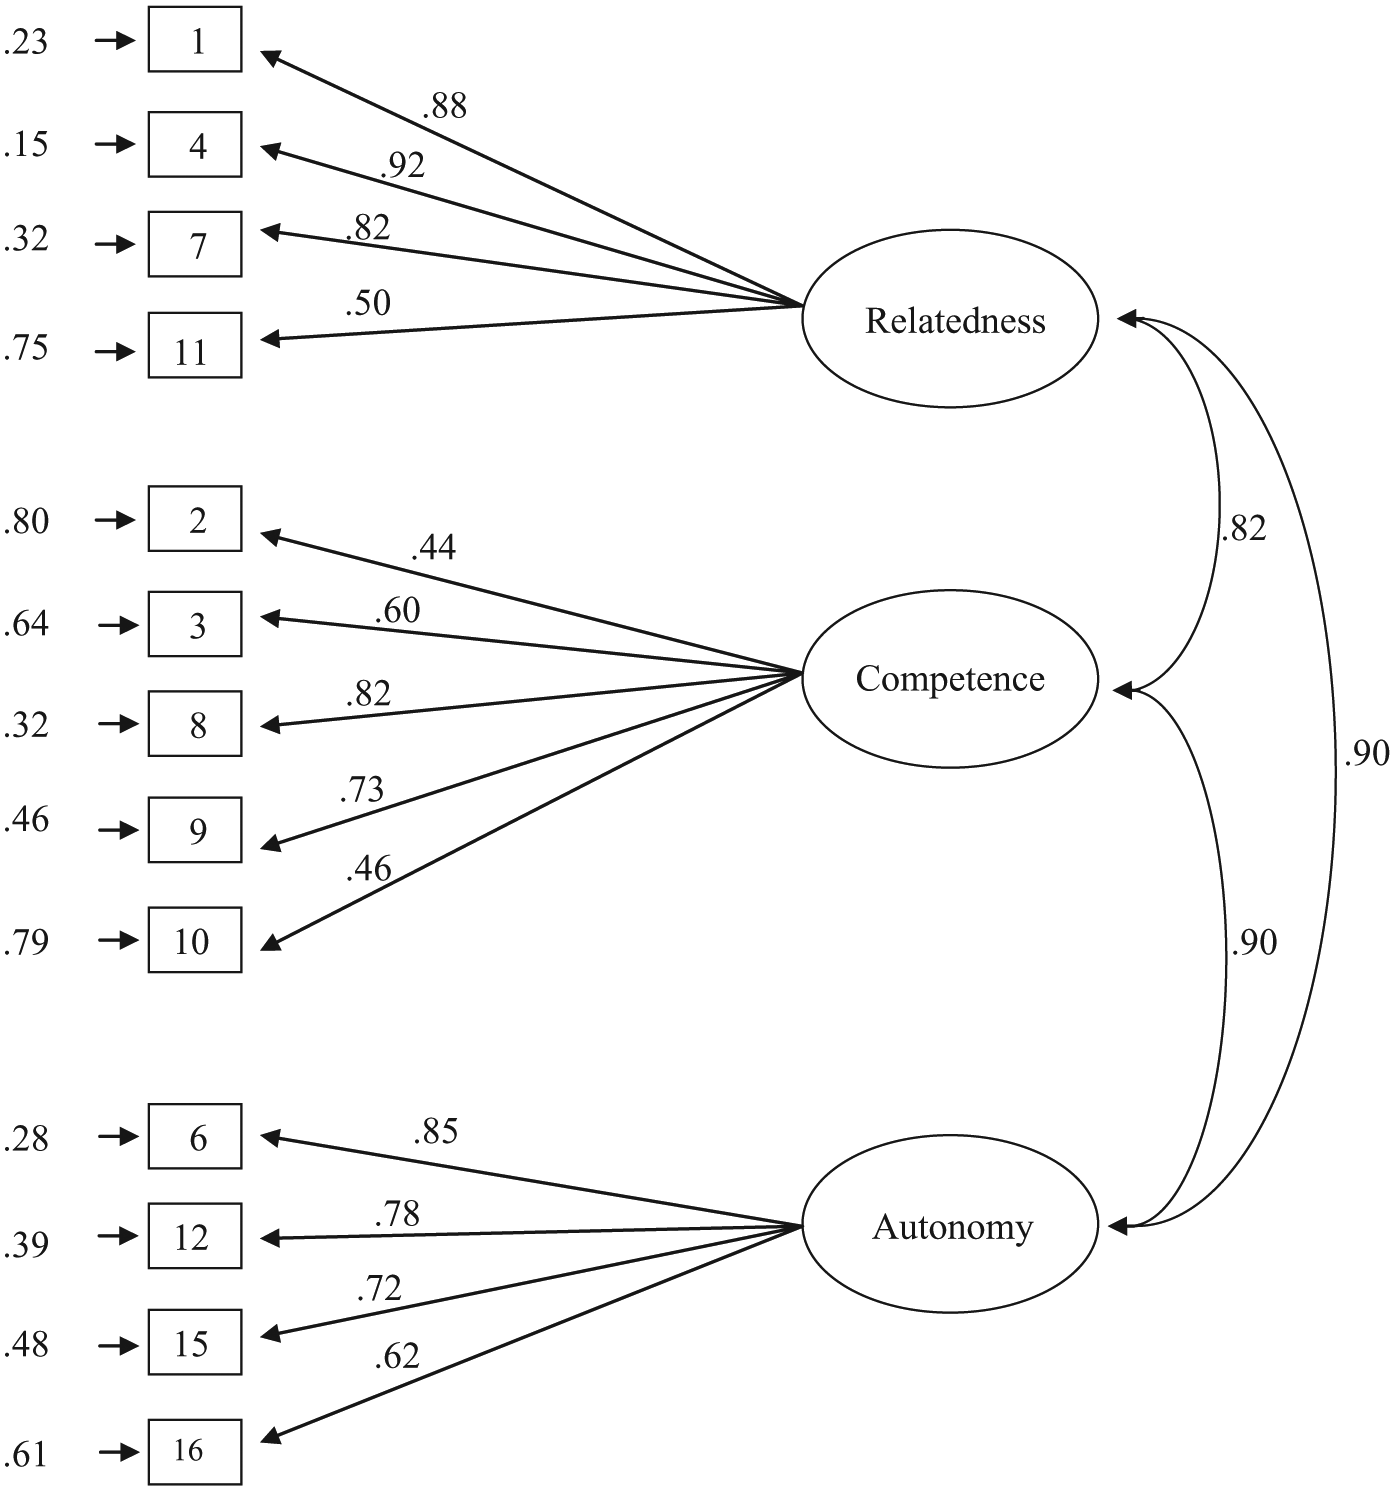
Final 13-item, 3-factor model with completely standardized path coefficients.
We provided initial validity evidence by calculating bivariate correlations between the final 13-item BNSC-S subscale mean scores and the adapted measure of satisfaction with life at college. These analyses yielded large and statistically significant relationships between each subscale and the satisfaction with college life scale (see Table 2). Cronbach’s alpha coefficient statistics calculated from these data using the final 13 items demonstrated adequate internal consistency estimates of .79, .72, and .80 for the Autonomy, Competency, and Relatedness subscales, respectively.
The IRT estimations of item parameters based on the initial 16-item scale are displayed in Table 1, and indicate item slope (α) parameters that can be considered moderate to very high for all items with the majority being high (1.35–1.69) or very high (>1.70; Baker, 2001). In addition, the two smallest α parameters were for Items 14 and 5, which were removed during CFA analyses. However, Item 13 was also removed during CFA analyses and was estimated to have a very high α value (1.75), which could provide some evidence for a rationale to retain this item based on these IRT results. Overall, these item slope parameters indicated good ability to differentiate among people with different levels of basic psychological needs in the three domains captured by the BNSC-S. Category threshold parameters (β) showed a fairly wide distribution across the latent trait range for most items, with lowest thresholds ranging from −3.32 (β14, 1) to −1.79 (β11, 1; mean of −2.65) and highest thresholds ranging from 0.14 (β13, 4) to 1.55 (β5, 4; mean of 0.83); mean absolute span for all thresholds was 3.49. However, they were predominantly negative and located in the lower end of the latent trait spectrum, indicating that these items better captured below average to middle range levels of these constructs with poorer performance for higher levels. For the Autonomy subscale, β thresholds ranged from −3.20 to 0.81, and so adequately captured very low to middle range levels of fulfillment for the basic psychological need of autonomy. Competency subscale β thresholds ranged from −3.12 to 1.50, and represented a wider spread of locations throughout this range covering more of the positive end of the spectrum. Items for the Relatedness subscale ranged from −2.53 to 1.55, and predominantly captured the lower to middle range of the latent trait. However, Item 5 with the highest location parameter (1.55) was later selected for removal due to low item information, which left the spread of β parameters skewed more toward the negative end of the spectrum.
Item parameters and functioning can be represented graphically as well, and CRCs for all items of the Relatedness subscale are displayed in Figure 2. These plots reflect the skew observed in the β parameters ranges, and show how the response options for these items best capture below average to average levels of the latent trait being measured. In addition, the CRC for Items 5, 11, and 13 reflect their low α parameters, and Item 13’s Option 2 curve is almost completely subsumed under the curve for Option 1 which suggests that these options are not operating effectively or distinctly. Close evaluation of the CRCs for the other subscales’ items did not reveal any prominent overlapping in response categories, indicating no significant problems with category response option functioning; plots for other subscales were thus analyzed but not shown. Figure 3 displays the item information functions for each subscale group, and shows the level of information provided by items across the latent trait range. Similar to the CFA results, all four Autonomy subscale items provided information across a large portion of θ and displayed no significant overlap with other items. However, some item functions and the accompanying TIF reflected a dip in information provided around the average trait level, suggesting a decrease in measurement accuracy and larger standard errors for levels of autonomy in that θ range. All Competency items provided information across a large range of θ except for 14, which provided far lower information than the other subscale items and was removed as suggested by the CFA analyses. Relatedness subscale Item 5 offered little information across the spectrum and was removed as suggested by the CFA analyses. While Items 11 and 13 offered the least information of the remaining items, Item 11 offered more information above trait levels of 1 and so could be retained despite its lower slope parameter; Item 13 was removed. The Relatedness TIF is displayed in Figure 3, and indicates that this subscale is most sensitive between approximately −2.5 and 1 on the latent trait spectrum, with a decrease in precision and greater standard errors around the middle average range. Examination of the other subscales’ TIFs (analyzed but not shown) revealed similar patterns, with Competency providing information between −3 and 2, whereas the Autonomy subscale was most sensitive between −2.5 and 1. It was also clear that the Relatedness subscale provided more information than the other two subscales across the below average to middle θ range given its relatively higher TIF.
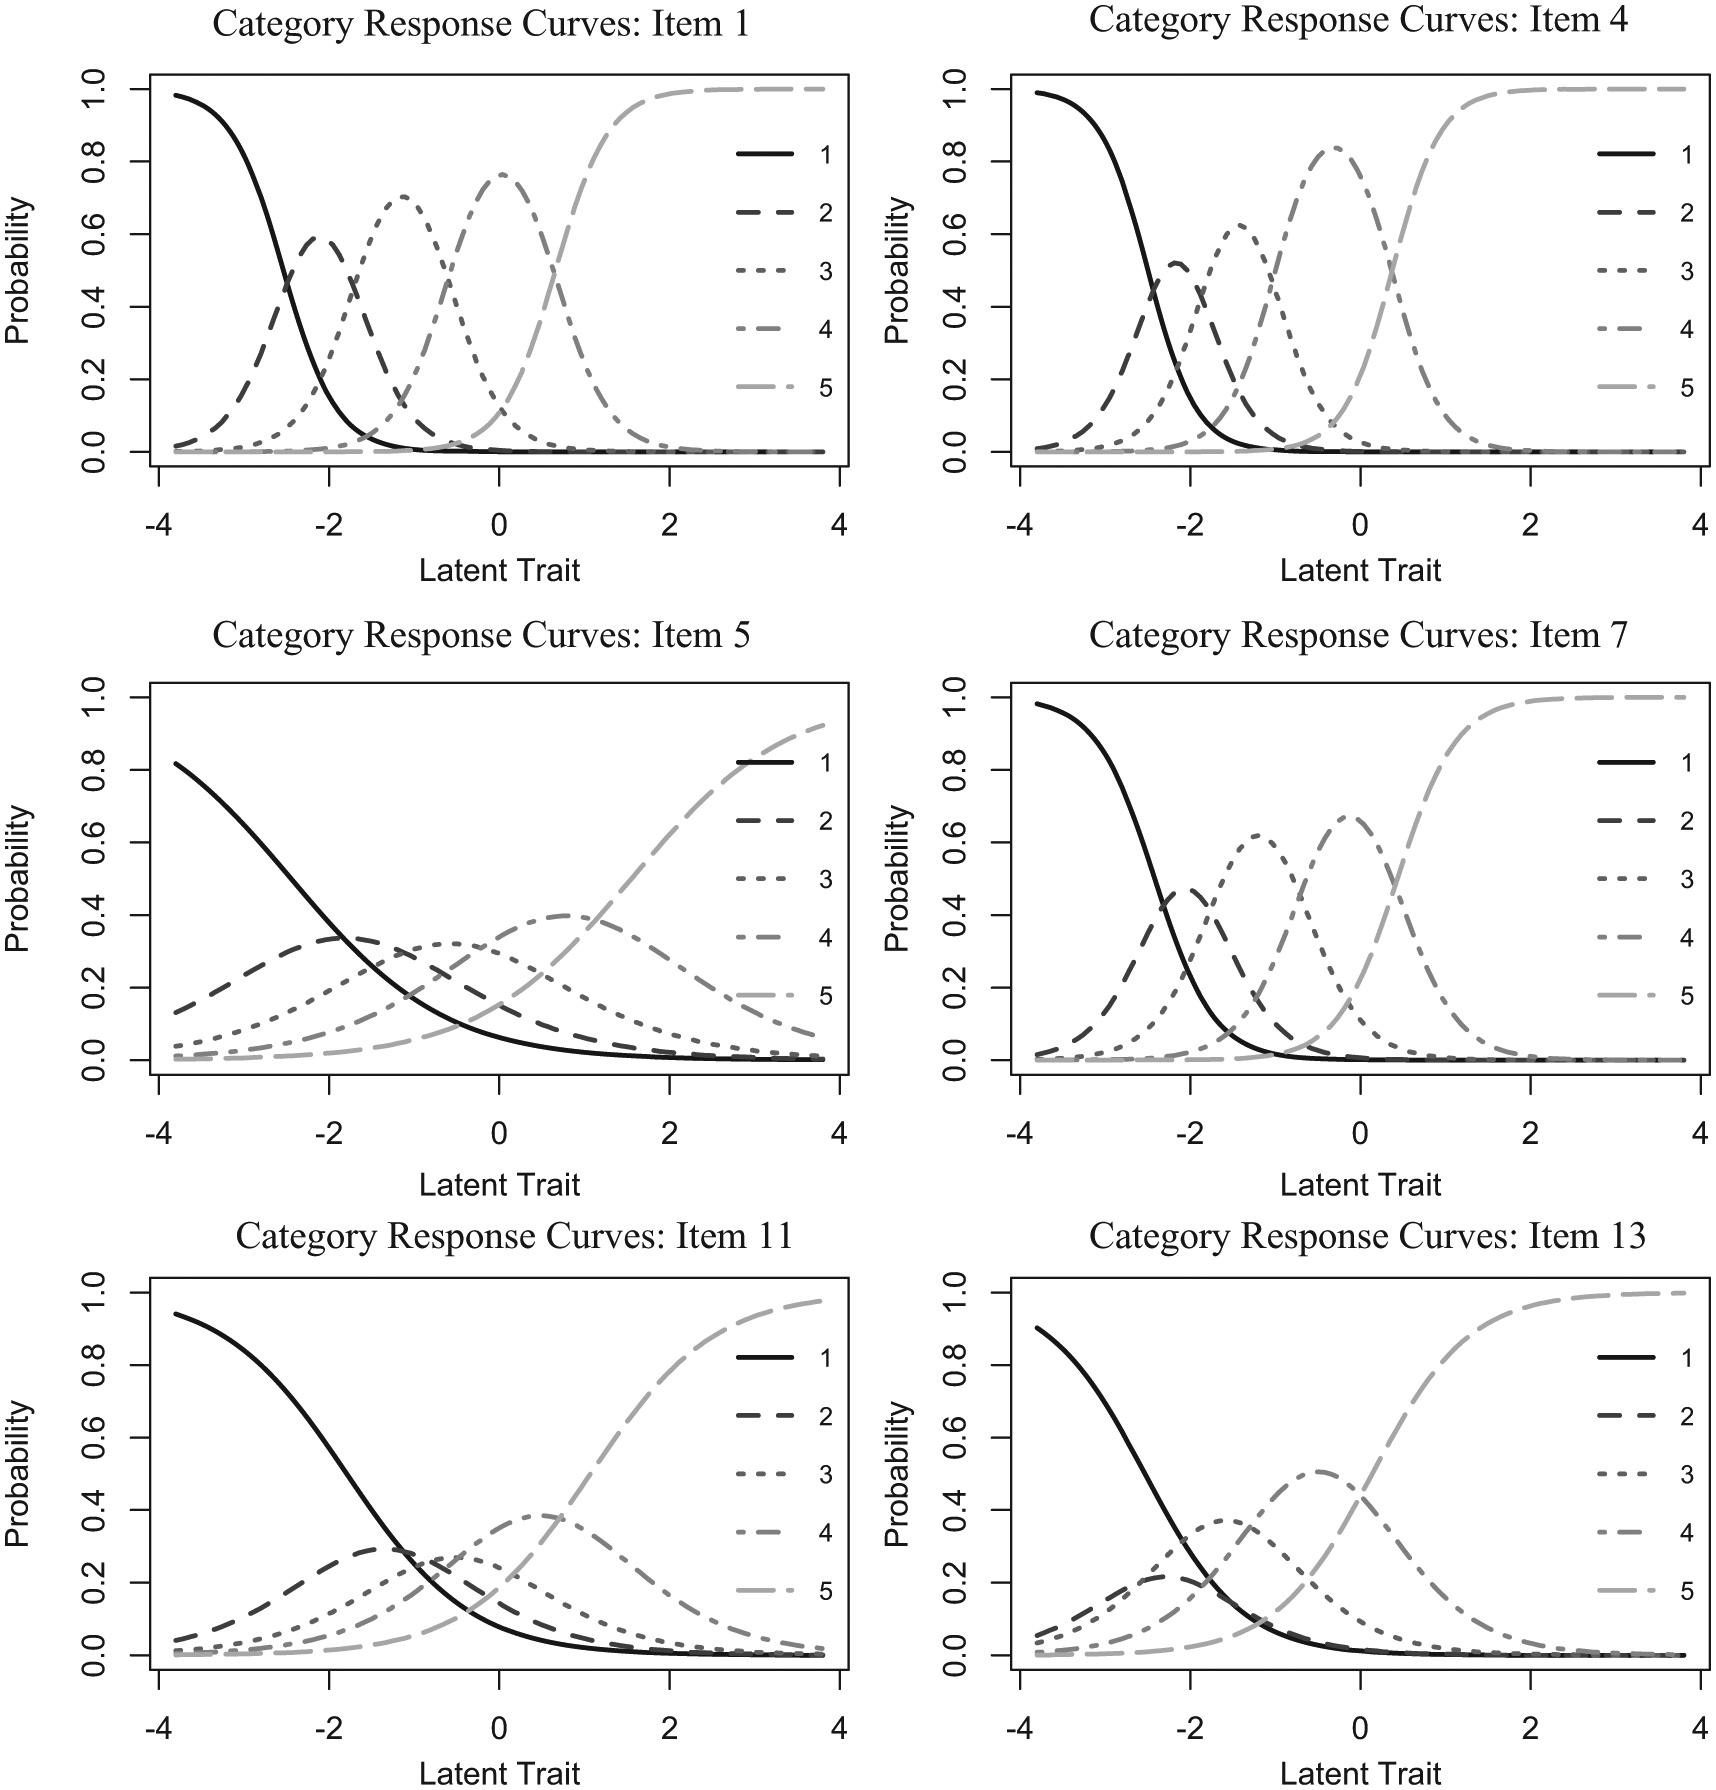
Category response curves for Relatedness subscale items.
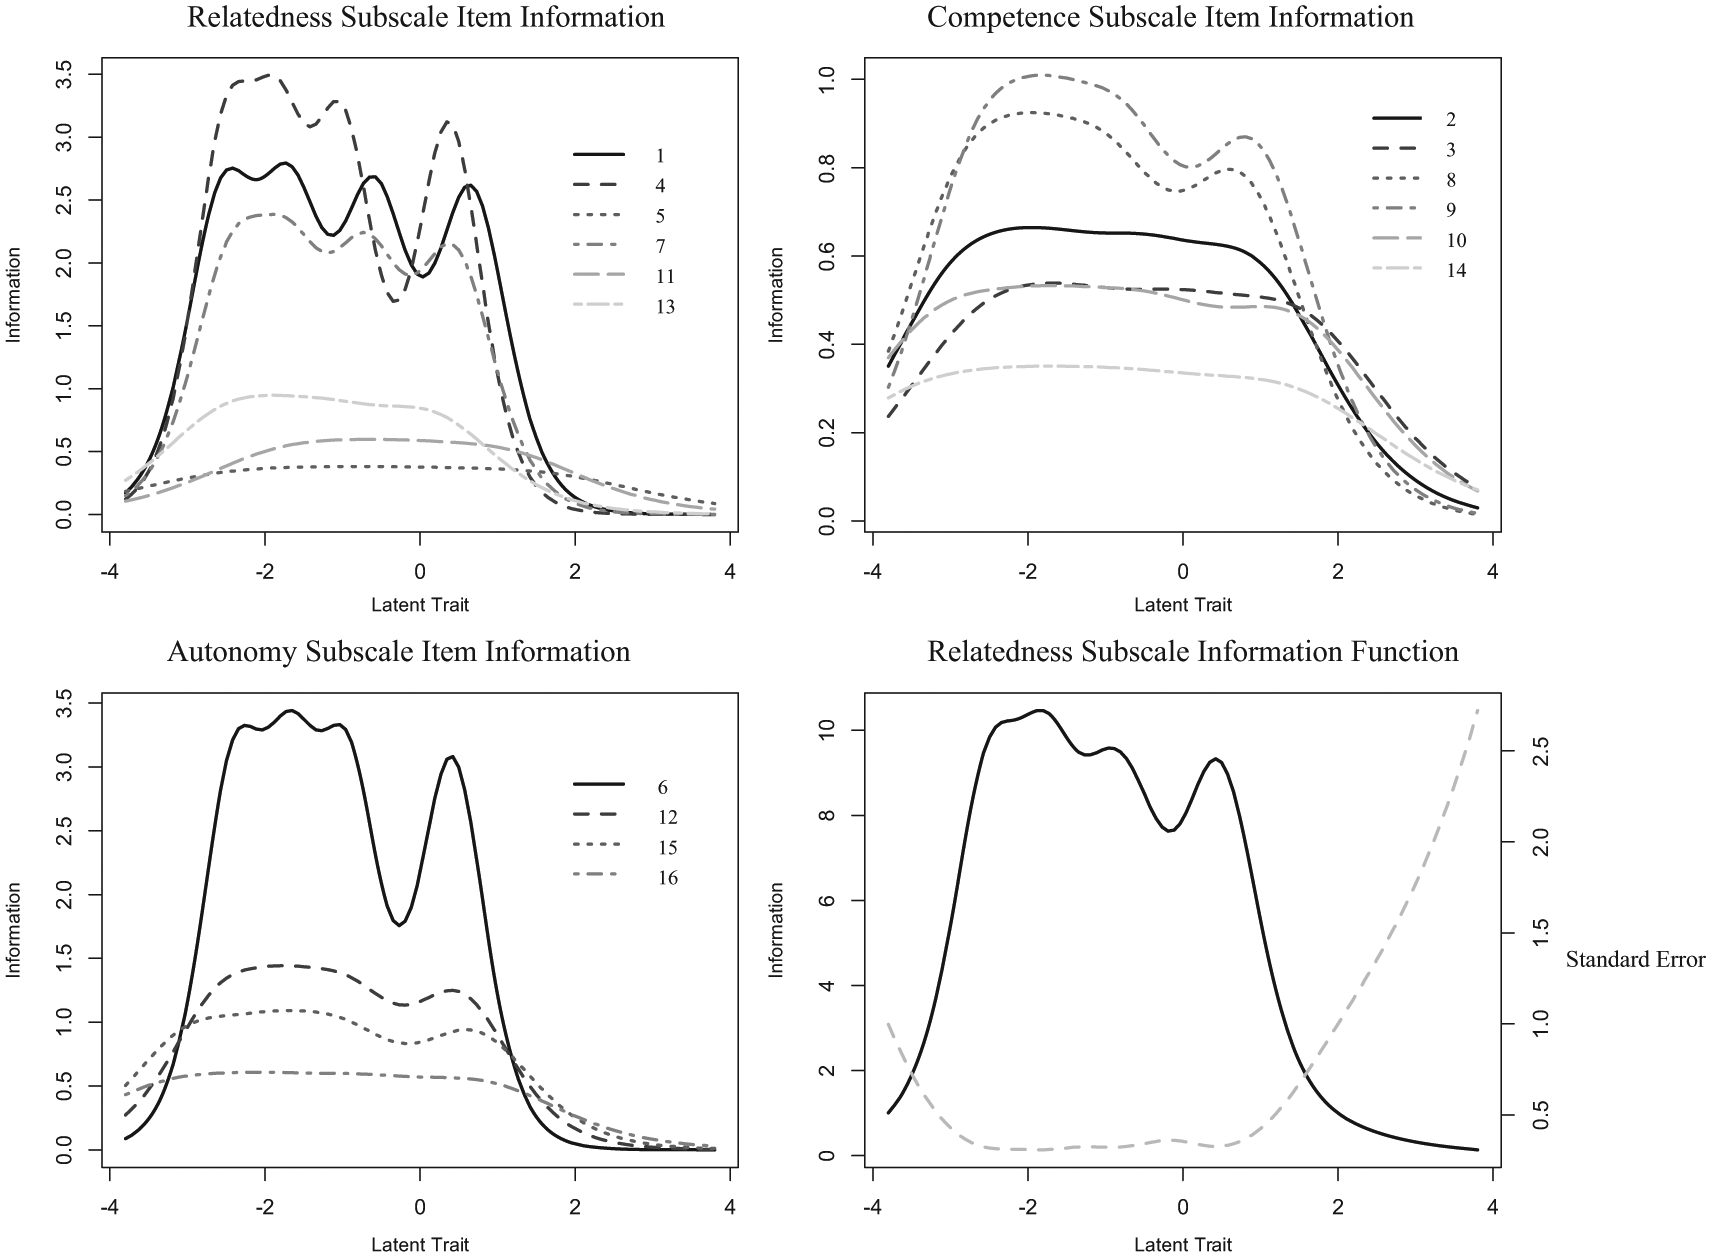
Item information functions for items of each subscale and Relatedness subscale test information function and standard error.
For the three subscales fitted using the GRM, the unconstrained models demonstrated improved fit compared with the constrained models by conducting likelihood ratio tests for the Autonomy, χ2(3) = 33.64, p < .001; Competency, χ2(4) = 21.9, p < .001; and Relatedness χ2(3) = 114.51, p < .001 subscales. Fit of each model for the revised subscales was assessed by analyzing residuals for pairs and triplets of items (Bartholomew & Tzamourani, 1999) on the two- and three-way margins using a 3.5 cutoff (Rizopoulos, 2006). Although results suggested some misfit for these models, simulation research has shown that Type I errors may be high for some χ2-based fit indices under certain conditions (LaHuis, Clark, & O’Brien, 2011), and our smaller sample size by IRT standards may help explain these findings. The Relatedness subscale model displayed marginal fit, with one pair of items demonstrating misfit and two triplets demonstrating lack of fit. The Competency model demonstrated adequate fit on the two-way margins although two triplets both involving Item 10 demonstrated misfit. The Autonomy subscale demonstrated adequate fit on the two-way margins with one triplet showing lack of fit on the three-way margins. We considered the underlying assumptions of unidimensionality and local independence to be met for the IRT analyses given the acceptable fit of the final CFA model.
Discussion
In this study, we adapted the BNSW-S for use with undergraduate students to develop the BNSC-S for measuring self-determination in college environments. Previous research has highlighted the lack of context-specific measurements for SDT as well as a lack of evaluation research for measurement scales in this area. Specifically, Johnston and Finney’s (2010) recent work encouraged an increased focus on research evaluating scales for measuring self-determination constructs. They acknowledged the various needs satisfaction scales available, and noted that although much research has been conducted with them, few have benefited from methodologically sound study of their psychometrics and validity evidence. Additionally, Johnston and Finney (2010) cautioned that general self-determination measures and results “should not be generalized to context-specific measures of needs satisfaction (e.g., BNSW-S). The factor structure and the relationships with external criteria may change given the change in context” (p. 293). As such, research on college student populations including the self-determination construct may benefit more from more specific measures (e.g., Brockelman, 2009). Thus, we followed a similar process to Gagné (2003) in adapting our revised BNSC-S scale from the BNSW-S and investigating psychometric data, analyzing item functioning in a college student sample, and providing initial validity evidence.
The CFA results from the present study suggest that the three-factor model based on the initial adapted 16-item BNSC-S scale did not demonstrate good fit to the data. However, modifications were made by removing poorly performing items to yield a final 13-item, 3-factor model that demonstrated acceptable fit to the data. In addition to improving model fit while remaining consistent with SDT, removing these items also provides a shorter version of the scale to assist with quicker completion by individuals. An examination of the three items also suggest inadequate content validity of the one item measuring Competence and the two items measuring Autonomy. These results provide support for the adapted BNSC-S scale’s three-factor structure in measuring the self-determination constructs with college students. Additionally, the 13-item scale’s internal consistency reliability estimates for the three subscales based on these data were adequate (see Table 2). Bivariate correlation analyses provided initial support for the convergent validity of the BNSC-S given its strong relationships with a measure of satisfaction with college life, results that align well with SDT’s predictions about psychological needs fulfillment, and accompanying level of satisfaction in a given context (Deci & Ryan, 2000). In addition, IRT provided more insight into the functioning of these items, and our analyses of the item parameters suggested that these 13 items functioned reasonably well in distinguishing among respondents based on their levels of basic psychological needs in these three key domains. However, they were most sensitive in the below average to average range of the latent trait spectrum, which has important practice implications for using this new BNSC-S. For example, these scale items may be more sensitive to the lower to middle range of the SDT constructs, and this should be incorporated into methodological design considerations for research. Caution should be taken by researchers when attempting to assess the higher end of the spectrum. Future research could explore modifying the items in attempts to increase their ability to assess the higher range of the SDT constructs. In addition, these results may motivate further developments in measuring basic psychological needs in a college context, especially scale development oriented toward capturing a wider range of SDT constructs. Last, variability in the TIFs and evident decreases in precision and increases in standard errors over some areas of the latent trait spectrum suggest that some of the subscales were less able to estimate latent trait levels in these ranges. These results should be incorporated into evaluations of the scale’s utility and practical applications for similar populations.
Although undergraduate student persistence and performance has been researched extensively from a variety of perspectives, the level of undergraduate student attrition has varied very little since the 1980s (Braxton, Brier, & Steele, 2007), and many intervention programs instituted by universities have had little effect (Tinto, 2006). SDT provides another possible lens through which to examine student behaviors and provide additional opportunities to promote environments that support student persistence, intrinsic motivation, and achievement. To investigate the role of self-determination constructs in college student outcomes, researchers are calling for more study of self-determination measures (Guiffrida et al., 2008). We developed a novel measurement scale in order to assess the SDT construct of basic needs satisfaction in the college environment specifically, with the hope that this measure can be used to better understand psychosocial and cognitive variables and their potential roles in college student success. Previous SDT research has also strongly supported the possibility of developing specific strategies to encourage student self-determination and as a result, student success (Deci & Ryan, 1985; Reeve, 2002). With sound measurement tools to accurately assess student levels of self-determination, faculty, staff, and administrators may be better able to support students’ perceived feelings of self-determination within educational contexts (Deci & Ryan, 2002), especially within the critical first year of college.
Limitations and Directions for Future Research
Although participants in this study represented students from a wide variety of racial/ethnic backgrounds, our findings are limited by the constraints of the sample under study. Students of color and males were underrepresented compared with the overall population of college students at the host institution, and thus generalizations from our results should be made with caution. Future research could also replicate our findings with independent samples by first performing a CFA and then performing IRT with a much larger sample, as well as investigating measurement invariance to determine similarities or differences among different groups. In addition, participants were entirely voluntary and therefore may have different personality characteristics than nonparticipants which influenced their decision to consent, and this self-selection design may have biased our results. Although we tried to establish convergent validity evidence by investigating how our adapted measure of self-determination was related to scores from an adapted scale measuring satisfaction with university experiences, further research is needed to provide construct validity evidence as well as psychometric analyses of data obtained with this scale from different samples. In addition, our validity findings may be limited by not testing the unidimensionality of our adapted life satisfaction scale on an independent sample and future research is warranted in this area. Although we collected data from more than 500 participants, potential homogeneity in the participant pool and a relatively smaller sample size given the requirements of IRT analyses and the number of parameters estimated in the GRM may represent another limitation to this study.
Given the latent correlations between the three factors of our final self-determination scale, future research may investigate the plausibility of a unidimensional or higher order factor structure for the construct of psychological needs, although special considerations must be given to how this structure could fit well within SDT theory. Similarly, our results are limited to our CFA and IRT approach and future researchers may be interested in first performing an exploratory factor analysis with the adapted items before proceeding with CFA or further analyses. In addition, our CFA models achieved acceptable fit only after multiple modifications, and so future analyses of the BNSC-S and its psychometric functioning are needed. Although we considered the fit for our final model to be acceptable, two of our fit indices indicated limitations with the model and must be considered. Particularly, our RMSEA value may not be considered relatively close to Hu and Bentler’s (1999) stringent .06 criteria and we had a significant model chi-square value. However, it has been recommended to not overgeneralize Hu and Bentler’s (1999) rigorous cutoff values (Marsh, Hau, & Wen, 2004) and the upper range of the RMSEA CI was less than .10, suggesting that the model was not a poor fit (Dudgeon, 2004). A significant chi-square value is also common to find because of sample size but it may suggest that the model may have possible problems and it should not be overlooked (Kline, 2011). Some researchers have recommended rejecting a model based on a significant chi-square value (e.g., Barrett, 2007), but this has been debated (e.g., Miles & Shevlin, 2007). Furthermore, conflicting fit indices are not uncommon (Ullman, 2006) and the degree of fit among the indices must be evaluated (Kline, 2011) to determine the “degree of fit along a continuum” (Hu & Bentler, 1999, p. 2). Based on Hu and Bentler’s (1999) combinational guidelines of the CFI and SRMR index scores, our model was an acceptable fit with the data, but not based on the RMSEA and SRMR stringent combination rule. Although both the RMSEA and chi-square values are influenced by sample size (Kline, 2011), it is noteworthy that these two indices did suggest that the model may not be a good fit to the data. Therefore, future researchers may want to construct a prior model that may better explain a fit to the data and our model is limited with regard to the aforementioned areas.
Similarly, our IRT models demonstrated marginal to adequate fit and the items best captured below average to average levels of the latent trait being measured; future IRT analyses of our scale using larger sample sizes may better explain item functioning. Although the original BNSW-S (Ilardi et al., 1993) used a 7-point Likert-type scale, our adapted scale used a 5-point Likert-type scale based on prior research (Deci et al., 2001) that also included college students (Brockelman, 2009). However, researches may want to consider additional changes in their rating scale to determine if this could improve response option functioning reflected in greater CRC distinctions. We also removed items from the original work scale to fit with a college environment and future researchers may want to investigate individual item performances that were removed from our scale. Furthermore, research assessing the relationship between college students’ perceptions of self-determination, as measured by the adapted scale, with their subsequent levels of intrinsic motivation, achievement, and persistence may help provide more comprehensive evidence for our scale’s construct validity and usefulness in this context.
From a practice perspective, a reliable and valid scale can provide opportunities to evaluate faculty professional development efforts that lead to effective implementation of autonomy-supportive strategies in the classrooms. Additionally, research could be conducted on incorporating these same strategies in large-scale programs such as first-year seminars to evaluate whether significant differences occur between participants and nonparticipants in their successful transition to the university and subsequent retention to graduation. As student characteristics are not malleable, other strategies to promote more meaningful student learning must be implemented and evaluated. The BNSC-S provides opportunities to measure the relationship of incorporating specific strategies (e.g., promoting student choice and responsibility, frequent feedback, community within the classroom) to critical student outcomes such as GPA and persistence. However, it is important to consider that this scale is more effective at assessing the lower to middle ranges of the SDT constructs. Mixed methods research could also provide further information about how and what strategies are most effective in promoting student feelings of autonomy, competence, and relatedness. Combining qualitative and quantitative methodologies can help provide a more complete picture and lead to continuous refinement of classroom practices and teaching strategies.
Footnotes
Declaration of Conflicting Interests
The author(s) declared no potential conflicts of interest with respect to the research, authorship, and/or publication of this article.
Funding
The author(s) received no financial support for the research, authorship, and/or publication of this article.