



Abstract
The General Regulatory Focus Measure has been used extensively in psychological research to gauge promotion and prevention orientations. Findings of this research show that for New Zealand secondary school students, the General Regulatory Focus Measure does not measure promotion and prevention as theoretically independent constructs.
Motivation is an important determinant of students’ school-related experiences. Moreover, for secondary school students, detrimental motivation patterns are associated with elevated risks for underachievement and academic failure (Hodis, Meyer, McClure, Weir, & Walkey, 2011). Therefore, it is important that educators, parents, and school counselors identify debilitating motivation tendencies early on in secondary schools. To this end, they need to gauge accurately students’ motivation orientations before designing and implementing effective motivation interventions. A hypothetical example illustrates this point.
Tony is a secondary school student. He is doing OK in school; in most subjects he obtains passing marks, but he is not among the highest performers in his classes. As Tony is constantly adopting a negative view regarding his ability to learn and he is often frustrated, his parents suggested that he make an appointment with his school’s counsellor. After analyzing Tony’s case, the counsellor considers two alternative strategies that could help him overcome these problems. The first strategy, which revolves around what Higgins (1997, 2012b) calls a promotion orientation, would involve strengthening both Tony’s ideals and aspirations and their links to knowledge acquired in school. The second strategy, which centers on a prevention orientation (Higgins, 1997, 2012b), would focus on reminding Tony of his duties and responsibilities (e.g., meeting the expectations of his loving family) and on highlighting that doing well in school is a safe route to fulfil them. Both of these approaches appear promising on the surface, but which one should the counselor choose? This choice is extremely consequential because, as research findings show, systemic failure related to promotion is linked to depression, whereas lack of success with respect to prevention is associated with anxiety disorders (see Higgins, 2012b, for reviews and extensive discussions). In light of regulatory focus, regulatory fit, and accessibility theories (Higgins, 1997, 2000, 2012a, 2012b), to answer the aforementioned question (and design effective strategies that can alleviate Tony’s problems) the counselor needs information about his promotion and prevention orientations.
For our target population—New Zealand secondary school students—published accounts of research gauging various facets of student motivation have generally employed self-reports and adopted quantitative data analytic techniques (e.g., Hodis et al., 2011; McClure et al., 2011; Meyer, McClure, Walkey, Weir, & McKenzie, 2009; Walkey, McClure, Meyer, & Weir, 2013). Additionally, studies investigating individual differences in promotion and prevention have relied overwhelmingly on self-reports and quantitative approaches, regardless of the nature of the populations targeted. Taking all of these aspects into account, in this research, we have used self-reports to collect data and have adopted a quantitative lens to investigate the promotion and prevention constructs.
Several instruments have been developed to measure promotion and prevention. A recent meta-analysis (Gorman et al., 2012) found that the General Regulatory Focus Measure (GRFM; Lockwood, Jordan, & Kunda, 2002) has been the most widely used among them. As the GRFM was validated with more mature respondents (i.e., university students; see Lockwood et al., 2002), it is currently not known whether it can gauge appropriately promotion and prevention in developmentally younger populations, such as that of secondary school students.
Aims of the Study
Gorman et al. (2012) recommended that “as more data become available, researchers should continue to explore the psychometric properties of the dominant regulatory focus inventories” (p. 170). In line with this recommendation, this study aims to evaluate the extent to which the GRFM (Lockwood et al., 2002) measures appropriately the promotion and prevention orientations of secondary school students. To this end, this research (1) analyzes whether the GRFM items can be used in their original form or need to be adapted to account for developmental, cognitive, or reading differences distinguishing secondary school students from more mature respondents and (2) evaluates whether for this population, the GRFM measures promotion and prevention as independent dimensions. These two aims are both salient because regulatory focus theory conceptualized promotion and prevention as independent constructs (Higgins, 1997, 2012b, 2012c). In turn, advancing knowledge of these aspects is important for both researchers and practitioners (e.g., teachers, school counselors) as it clarifies whether, and if so, how, this instrument can be employed to provide appropriate measures of these key motivation orientations in this population.
This investigation is built around a multiphase, multisample design that makes optimal use of data collected from two independent large samples while avoiding capitalization on sample-specific random fluctuations. Employing this design facilitates the achievement of several key outcomes. Specifically, it enables (1) analyzing how well original GRFM items measure promotion and prevention, (2) identifying weak indicators of these construct, (3) proposing changes to these items that improve their measurement properties, (4) evaluating the effectiveness of both original and modified items in a new sample, and (5) assessing the extent to which, in this population, the GRFM scores capture the two independent facets of regulatory focus, namely promotion and prevention.
Samples
Approval for conducting this study was secured from the university’s ethics committee (the equivalent of the U.S. institutional review board). Respondents gave individual consent for participation. Additionally, the principals of the schools at which students were enrolled provided consent for the study. All students enrolled in Years 10 to 13 in the participating schools were invited to take part in the research. They received no incentives for participating in this study.
The first sample included 972 secondary school students. They were enrolled in one of four schools, which were randomly selected from all secondary schools in New Zealand. Of the 972 respondents, 16.56% attended School 1, 22.94% School 2, 26.54% School 3, and 33.96% School 4. Based on the socioeconomic status (SES) of the community in which the schools are located, Schools 1, 3, and 4 are classified as high decile (i.e., high SES) schools, whereas School 2 is a medium SES school.
In New Zealand educational system, Year 13 is the last year of secondary school. Of the total number of participants, 20.27% were enrolled in Year 13, 22.84% in Year 12, 22.22% in Year 11, and 30.35% in Year 10; 4.32% of respondents did not provide data on their year of study. Although the research did not collect data on students’ age, it is informative to note that, in New Zealand, a Year 10 student is typically around 14 years old. With regard to ethnicity, 2.99% of the respondents in this sample reported being Māori, 0.93% Pacific, 68.93% European, 11.52% Asian, and 11.93% chose “Other ethnicity”; 3.70% of the participants did not provide data on their ethnicity. Most students in Sample 1 were female (80.97%); 3.70% of the participants did not report their gender.
The second sample included 605 students. They attended a low SES school, which was randomly selected from all secondary schools in New Zealand. Of the 605 respondents, 12.56% were in Year 13, 19.00% in Year 12, 29.26% in Year 11, and 31.57% in Year 10; 7.60% of participants did not provide their year of study. In terms of ethnicity, 22.48% of the respondents in Sample 2 reported being Māori, 20.99% Pacific, 19.50% European, 21.16% Asian, and 10.75% chose “Other ethnicity”; 5.12% of the participants did not provide data on their ethnicity. The sample included 48.60% males and 45.95% females; 5.45% of the respondents did not report their gender.
Instrument
In the first phase of the investigation, which involved Sample 1, we used the original items of the GRFM measure (Lockwood et al., 2002). The scale includes an equal number of promotion and prevention items (i.e., nine for each). The GRFM is grounded on a “reference-point” (Summerville & Roese, 2008, p. 248) conceptualization of regulatory focus, which has at its core the idea that people employ two major types of end-states to regulate their goal settings and strivings. More specifically, individuals having a strong promotion orientation self-regulate by trying to attain positive reference points (e.g., they try to ensure the presence of gains). In contrast, people having a strong prevention focus self-regulate by attempting to secure the absence of negative reference points (e.g., they try to secure the absence of losses; Higgins, 1997, 2012b; Summerville & Roese, 2008). The GRFM’s focus on reference points is apparent in 14 of the 18 items (e.g., “Overall, I am more oriented toward achieving success than preventing failure”; “I am more oriented toward preventing losses than I am toward achieving gains”). The remaining four items of the instrument tap onto other key determinants of regulatory focus: (1) the type of self-guide adopted by an individual—ideal self-guide for a strong promotion focus; ought self-guide for a strong prevention orientation (Higgins, 1987, 2012b)—(e.g., “I see myself as someone who is primarily striving to reach my ‘ideal self’—to fulfill my hopes, wishes, and aspirations”); and (2) the pursuit of hopes and aspirations, which characterize strong promotion orientations, or the attempt to meet responsibilities and obligations, which are typical for a strong prevention focus (e.g., “I am anxious that I will fall short of my responsibilities and obligations”). Importantly, four items of the GRFM refer to success/failure in academic settings (e.g., “I often think about how I will achieve academic success”). In extant research, the GRFM was mostly used with university students (e.g., Haws, Dholakia, & Bearden, 2010; Lockwood et al., 2002; Righetti, Finkenauer, & Rusbult, 2011; Summerville & Roese, 2008).
Method
In line with Bollen’s (2000) recommendations, we employed the “jigsaw piecewise technique” (p. 78, italics in original) to gauge whether GRFM scores measure appropriately promotion and prevention in this population. In this modeling technique, all the components of the overall measurement/structural model need to be first examined separately before fitting the overall model (Bollen, 2000). This strategy has three key features that make it ideally suited to our investigation. First, assessing separately individual model components enables the identification of construct-specific sources of misfit. Second, investigating the overall model allows assessing whether “the fit of the separate models was obscuring spurious or suppressor relations that were missed by treating the factors separately” (Bollen, 2000, p. 80). Third, when no indicators are dropped as a result of the investigations of individual factors, comparing corresponding parameter estimates between individual and overall models could identify potential model misspecifications (Bollen, 2000).
In this research, we first conducted separate one-factor confirmatory factor analyses (CFAs) to analyze the measurement properties of the original promotion and prevention items. Subsequently, we used the magnitudes of the standardized factor loadings in these unidimensional CFAs in order to identify weak indicators. Afterward, we reviewed the content of weak indicators, and when we had plausible hypotheses regarding their shortcomings, we modified them accordingly. The entire revision process, which we describe in detail in the Results section, preserved the operationalization of the promotion and prevention constructs, as reflected in the original GRFM instrument.
The second phase of the research involved data collected from Sample 2. In this phase, we conducted, again, separate unidimensional CFAs for promotion and for prevention. We used the results of these analyses together with findings from Phase 1 to identify the subsets of items that provide reliable and valid measures of the two constructs. Two independent sets of standardized factor loadings informed the decision regarding items that were not modified after Phase 1. Specifically, items that in both samples had loadings exceeding 0.50 were considered strong indicators and were retained for the analysis in Phase 3. The selection of the items that were modified centered on their standardized factor loadings from the CFAs in Phase 2. This decision used the same criterion (i.e., standardized factor loadings greater than 0.50) to retain items. The third phase of the research involved only the items retained in Phase 2. In this part, we evaluated the two-factor CFA model incorporating both promotion and prevention.
Research by Clark and Watson (1995) and Widaman, Little, Preacher, and Sawalani (2011) informed the choice of 0.50 as the cutoff value for standardized loadings. Specifically, Widaman and colleagues showed that standardized loadings of 0.50 correspond to mean interitem correlations (MIC) of about 0.25. In turn, an MIC of 0.25 belongs to the (0.15, 0.50) interval in which MIC values for scales should fall (Clark & Watson, 1995).
Students’ answers to the promotion and prevention items were recorded on a 7-point Likert-type scale anchored at 1 (Strongly agree) to 7 (Strongly disagree). All of the analyses in this research were conducted in Mplus, Version 6.11 (Muthén & Muthén, 2010). To use all available data, we employed full information maximum likelihood (FIML; Arbuckle, 1996). This procedure is robust to small and medium violations of multivariate normality (Fan & Wang, 1998); no problematic violations of the multivariate normality were detected in this study. In line with recommendations in Hu and Bentler (1999), we assessed the fit of the CFA models by means of the comparative fit index (CFI; Bentler, 1990), the Tucker–Lewis index (TLI; Tucker & Lewis, 1973), and the root mean square error of approximation (RMSEA; Steiger, 1990). Values of .90 and higher for CFI and TLI and below 0.05 for RMSEA indicate good fit.
Results
We begin this section with an overview of the results from Phase 1. In line with the tenets of the jigsaw piecewise technique, promotion and prevention are discussed separately, starting with the former. Subsequently, we summarize the results from Phase 2 of the research and then discuss the findings associated with Phase 3. For both constructs, the labels we use to identify individual items correspond to the ones in the original instrument (e.g., I1 denotes the first item on the original GRFM scale). Importantly, none of the analyses we conducted encountered any estimation problems or inadmissible solutions.
Phase 1.1: The One-Factor CFA Model for Promotion in Sample 1
This model had a suboptimal fit: Chi-square (27, N = 971) = 308.279, p < .001; CFI = .890; TLI = .854; RMSEA = .104, with the 90% confidence interval (CI) for RMSEA being [.093, .114]. The construct reliability, as measured by the H coefficient (Hancock & Mueller, 2001), was good: H = 0.853. Data reported in Table 1 show that eight items had standardized loadings equal to or larger than 0.50. Item 12 (i.e., I12), which had a loading of 0.464, is short and unambiguous, and touches on issues that are clearly relevant for the respondents. However, I12 appears somewhat redundant with I8, which is worded in more concrete terms. Specifically, I8 refers to achieving “academic success,” whereas I12 is centered on achieving “academic ambitions.” This hypothesis received support from an examination of model modification indices (MIs), revealing that the highest MI value (i.e., MI = 83.226; standardized expected parameter change = 0.332) was associated with the unmodeled residual covariance between these two indicators. After examining the potential sources of misfit in the one-factor CFA model for promotion, because we had no hypotheses as to why I12 was a somewhat weak indicator of the construct and wanted to avoid capitalizing on any chance fluctuations within a sample, we decided to leave I12 unmodified. Taking into account these results, we did not make any change to the original promotion items.
Maximum-Likelihood Estimates of Descriptive Statistics and One-Factor CFA Standardized Loadings and Standard Errors of Promotion Items in Sample 1.
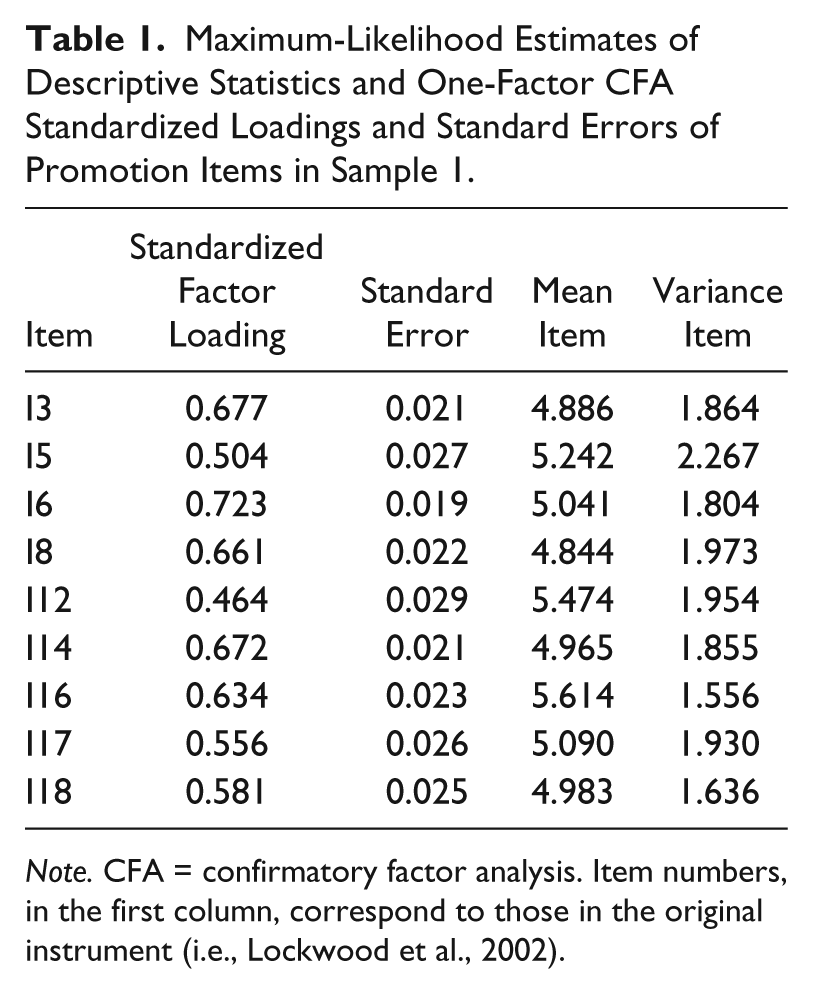
Note. CFA = confirmatory factor analysis. Item numbers, in the first column, correspond to those in the original instrument (i.e., Lockwood et al., 2002).
Phase 1.2: The One-Factor CFA Model for Prevention in Sample 1
This model had a poor fit: Chi-square (27, N = 971) = 619.096, p < .001; CFI = .653; TLI = .537; RMSEA = .150, with the 90% CI for RMSEA being [.140, .161]. The construct reliability, measured by the H coefficient (Hancock & Mueller, 2001), was acceptable: H = 0.772. Data reported in Table 2 reveal that five of the nine prevention items had standardized factor loadings less than 0.50. Analyzing the content and wording of these items, we noted that two of them, namely I10 and I13, were short, clear, and focused on the academic domain. As we had no hypotheses regarding their less-than-optimal functioning in Sample 1, we kept these items unchanged for the second wave of data collection.
Maximum-Likelihood Estimates of Descriptive Statistics and One-Factor CFA Standardized Loadings and Standard Errors of Prevention Items in Sample 1.
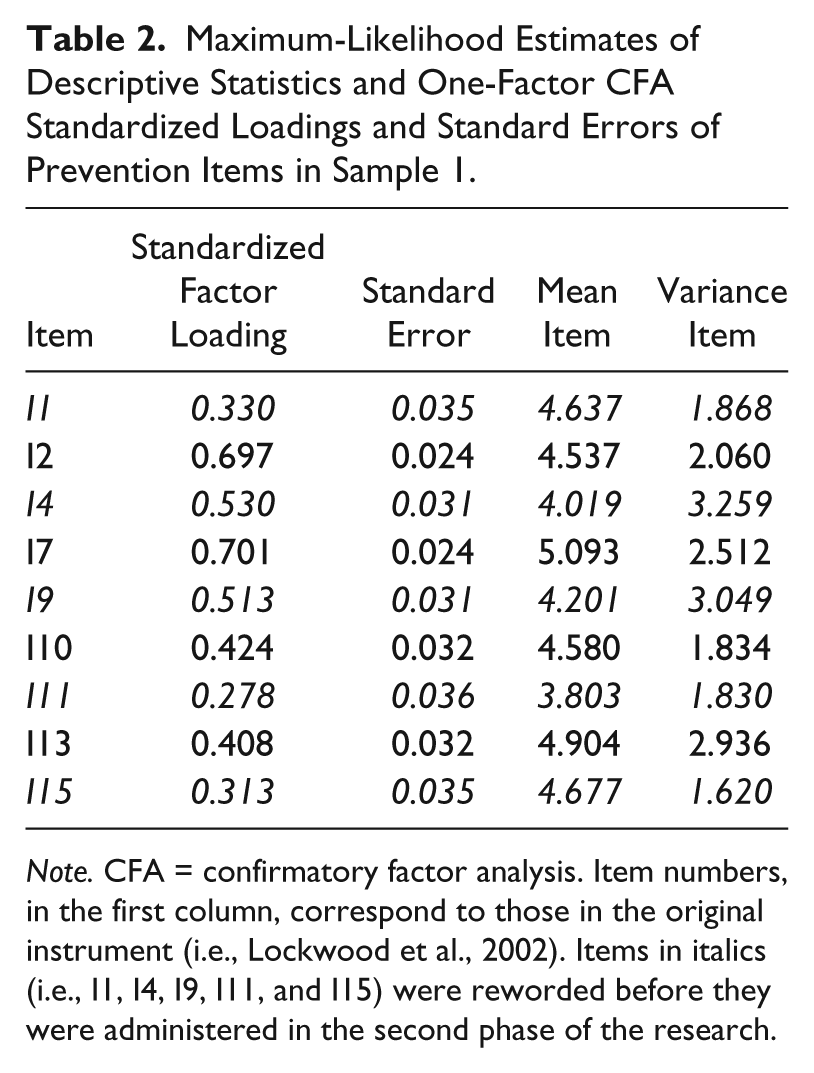
Note. CFA = confirmatory factor analysis. Item numbers, in the first column, correspond to those in the original instrument (i.e., Lockwood et al., 2002). Items in italics (i.e., I1, I4, I9, I11, and I15) were reworded before they were administered in the second phase of the research.
Another weak indicator of prevention, namely I1, used a term that is not commonly employed by members of this population (i.e., “events”). For the second administration of the instrument, I1 was modified by replacing this word with a synonym that is more commonly used by secondary school students (i.e., “outcomes”). Similarly, I11 (“I am more oriented toward preventing losses than I am toward achieving gains”) includes a word that may not be understood consistently by all respondents in this developmentally younger population (i.e., “oriented”). In an attempt to correct this potential problem, I11 was rephrased to read: “Overall, I am more focused on preventing losses than I am on achieving gains.”
The fifth indicator having a factor loading less than 0.50 (i.e., I15) is wordy (i.e., “I see myself as someone who is primarily striving to become the self I ‘ought’ to be—to fulfil my duties, responsibilities, and obligations”); thus, answering it may have been associated with increased cognitive load for some members of this population. As a result, it is possible that I15 was not understood uniformly by the respondents. To overcome these issues, we shortened the item while keeping its intended meaning. The reworded version of I15 reads: “I see myself as someone who is primarily striving to fulfil my duties, responsibilities, and obligations.”
In addition to rewording Items I1, I11, and I15, we altered slightly Items I4 (“I often think about the person I am afraid I might become in the future”) and I9 (“I often imagine myself experiencing bad things that I fear might happen to me”) before the second administration of the instrument. Even though these indicators had standardized loadings slightly above the 0.50 threshold (i.e., 0.530 and 0.513, respectively), feedback from some respondents and teachers who administered the questionnaire indicated that a number of students perceived these items as hard to understand or confusing. Moreover, an examination of the sources of misfit in this one-factor CFA model pointed that the largest model MI corresponded to the unmodeled covariance between these two items (MI = 174.951; standardized expected parameter change = 0.498). In light of these aspects, we modified slightly the two indicators by shortening them and simplifying their structure, while preserving their conceptual meaning. The revised I4 reads: “I often think about the person I ought to be in the future”; the revised I9 is “I often fear that bad things might happen to me in the future.” For the next phase of the analysis, involving Sample 2, we relabeled all of the items that we revised by adding the letter “R” to the beginning of their original code (e.g., we relabeled the modified version of Item I1 as RI1, etc.).
Phase 2.1: The One-Factor CFA Model for Promotion in Sample 2
This model had a good fit: Chi-square (27, N = 605) = 81.254, p < .001; CFI = .967; TLI = .955; RMSEA = .058, with the 90% CI for RMSEA being [.043, .072]. The construct reliability, gauged by the H coefficient (Hancock & Mueller, 2001), was good: H = 0.867. An examination of the standardized factor loadings, reported in Table 3, revealed that two items (i.e., I5 and I12) had standardized factor loadings below 0.50. Additionally, in both samples, the standardized loadings for I5 and I12 were the smallest among all of the nine promotion measures. Moreover, analyzing interitem correlations reveals that I5 had the smallest respective correlations with all of the other promotion items. Furthermore, as we noted in the analysis conducted in Phase 1.1, I12 appears largely redundant with I8. Finally, the correlations of I12 with all of the remaining seven indicators of promotion were smaller than their counterparts involving I8. Taking all of these aspects into account and considering that a pivotal aim in this study was to identify those items that are the strongest indicators of their given constructs across samples, we did not retain Items I5 and I12 for Phase 3.
Maximum-Likelihood Estimates of Descriptive Statistics and One-Factor CFA Standardized Loadings and Standard Errors of Promotion Items in Sample 2.
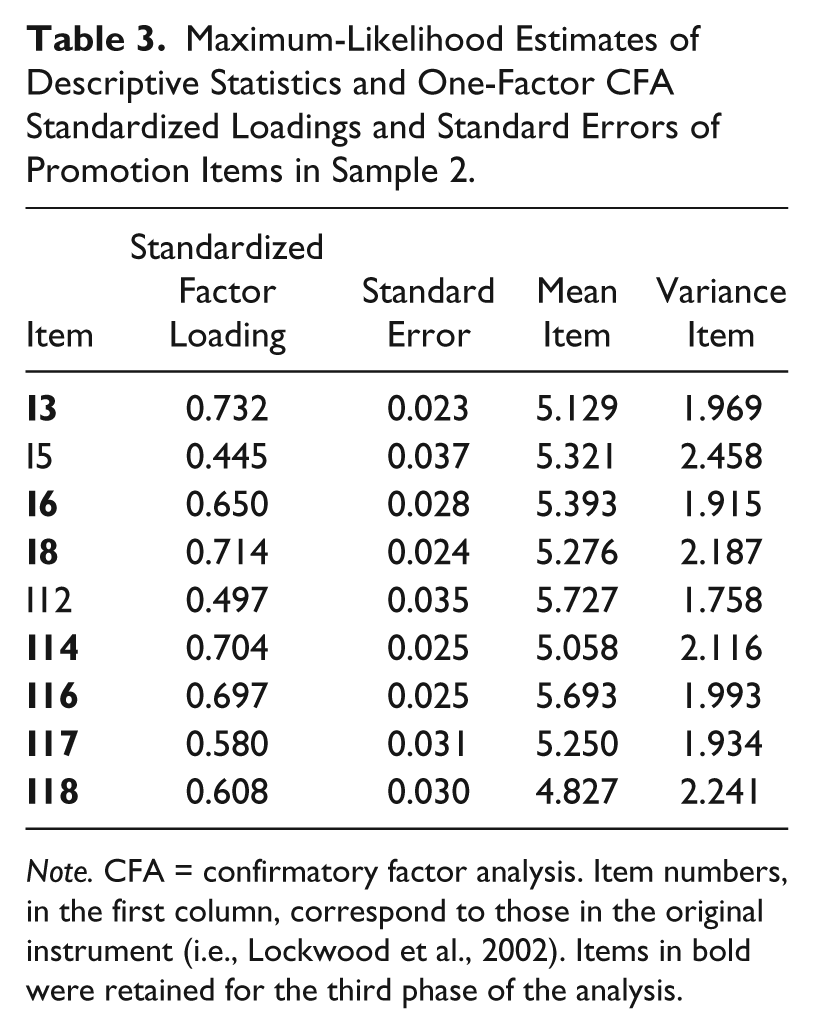
Note. CFA = confirmatory factor analysis. Item numbers, in the first column, correspond to those in the original instrument (i.e., Lockwood et al., 2002). Items in bold were retained for the third phase of the analysis.
Phase 2.2: The One-Factor CFA Model for Prevention in Sample 2
This model had a poor fit: Chi-square (27, N = 605) = 224.706, p < .001; CFI = .768; TLI = .691; RMSEA = .110, with the 90% CI for RMSEA being [.097, .124]. The construct reliability, measured by the H coefficient (Hancock & Mueller, 2001), was acceptable: H = 0.742. Three items had standardized factor loadings that were less than 0.50, whereas four more had loadings that were within rounding error of this threshold. All of the four items that were not modified as a consequence of the analyses in Step 1.2 (i.e., I2, I7, I10, and I13) had loadings that were at or above 0.50 in this sample (see Table 4). These results would suggest retaining all of them for Phase 3. However, an analysis of the model MIs revealed that even after taking into account the effect of the common factor (i.e., prevention), Items I2 (“I am anxious that I will fall short of my responsibilities and obligations”) and I7 (“I often worry that I will fail to accomplish my academic goals”) shared a significant residual correlation (i.e., 0.375; MI, which was the largest for this model, equaled 60.797). A comparative examination of these two indicators suggests that this high residual correlation may be due to the fact that answers to both items may also be influenced by the general level of anxiety of the respondent. Taking these aspects into consideration and noting that while I7 is specifically related to the everyday reality that students experience I2 is broad and vague, we decided to eliminate I2 from consideration for the next phase of the study. Thus, from the four items that were not modified, we retained three: I7, I10, and I13. Of importance, as the standardized loadings for both I10 and I13 were above the 0.50 threshold only in Sample 2 but not in Sample 1, question marks remain regarding the ability of these two items to provide consistently appropriate measures of prevention across different samples drawn from this population.
Maximum-Likelihood Estimates of Descriptive Statistics and One-Factor CFA Standardized Loadings and Standard Errors of Prevention Items in Sample 2.
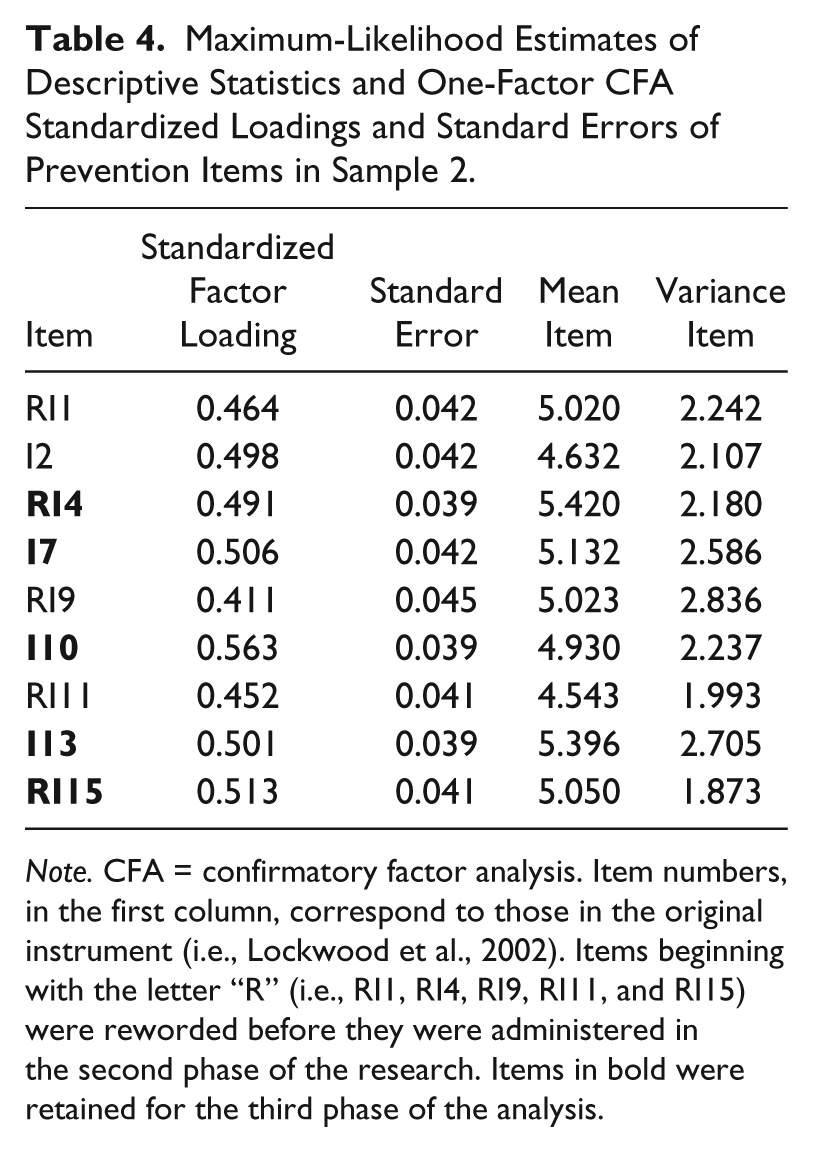
Note. CFA = confirmatory factor analysis. Item numbers, in the first column, correspond to those in the original instrument (i.e., Lockwood et al., 2002). Items beginning with the letter “R” (i.e., RI1, RI4, RI9, RI11, and RI15) were reworded before they were administered in the second phase of the research. Items in bold were retained for the third phase of the analysis.
Three of the indicators that were reworded after Phase 1 (i.e., RI1, RI9, and RI11) had loadings below the threshold and, thus, were not retained for Phase 3. The remaining two modified measures (i.e., RI4 and RI15) had acceptable loadings in this sample and, thus, were retained. In sum, considering the results of the analyses in Phases 1 and 2, in the final investigation we used seven promotion items (I3, I6, I8, I14, I16, I17, and I18) and five prevention items (i.e., RI4, I7, I10, I13, and RI15).
Phase 3: The Two-Factor CFA Model for Promotion and Prevention in Sample 2
The two-factor CFA model of promotion and prevention imposed a highly restrictive structure at the measurement level, as it did not include any cross-loadings or correlated residuals. This model had a good fit to the data: Chi-square (53, N = 605) = 145.729, p < .001; CFI = .957; TLI = .946; RMSEA = .054, with the 90% CI for RMSEA being [.043, .064]. The standardized parameter estimates associated with this model are summarized in Table 5. All factor loadings were statistically significant, and most of them were of sizeable magnitude. The promotion and prevention factors had a very high positive correlation (i.e., r = 0.986). This result casts serious doubts regarding the ability of the GRFM to measure promotion and prevention as independent constructs in this population. To further examine this issue, we run a one-factor CFA model in which all of the seven promotion items and the five prevention items were allowed to load on a single factor. This model had a good fit to the data provided by Sample 2: Chi-square (54, N = 605) = 146.101, p < .001; CFI = .957; TLI = .948; RMSEA = .053, with the 90% CI for RMSEA being [.043, .064].
Maximum-Likelihood Estimates of Two-Factor CFA Standardized Loadings and Standard Errors of Promotion and Prevention Items.
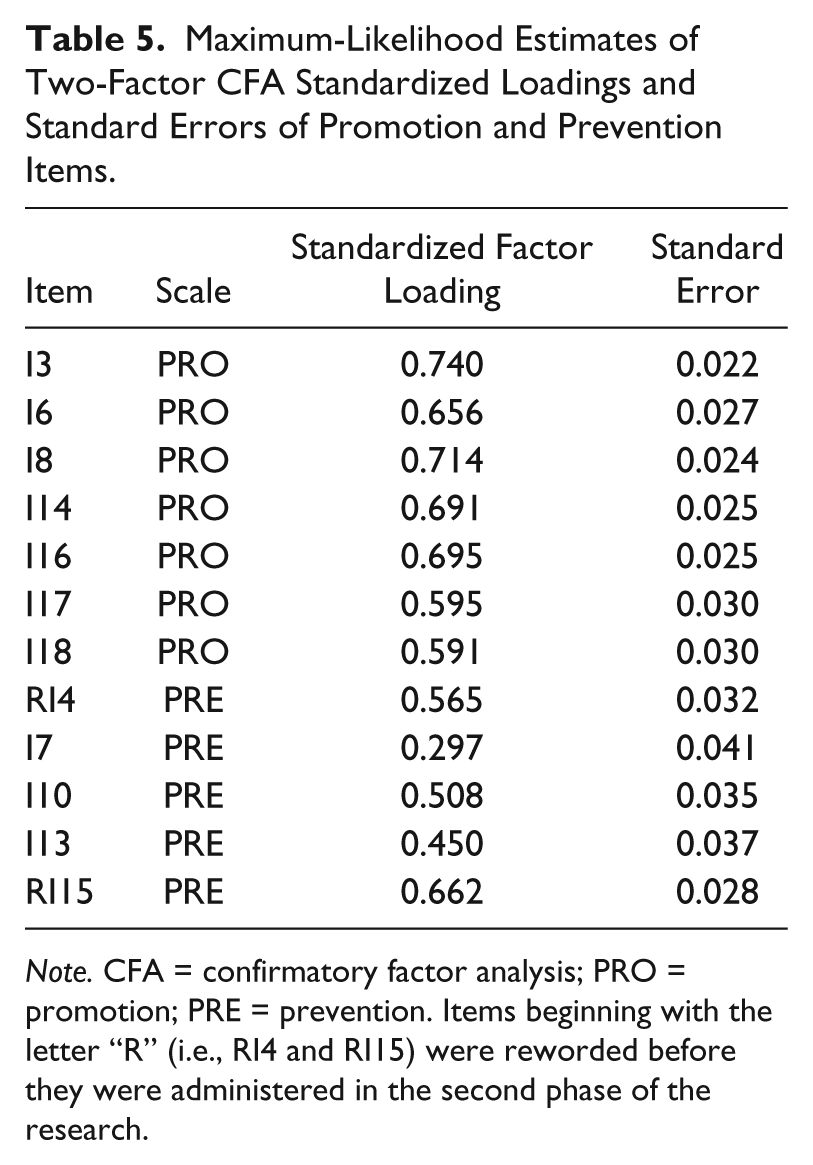
Note. CFA = confirmatory factor analysis; PRO = promotion; PRE = prevention. Items beginning with the letter “R” (i.e., RI4 and RI15) were reworded before they were administered in the second phase of the research.
In light of these findings, we decided to examine the correlation between the two constructs in the two-factor CFA model in Sample 1 (we are grateful for the suggestion an anonymous reviewer made in this sense). Notably, with Sample 1 we used the original GRFM items; hence, the magnitude of the association between the two factors was not affected by any alterations in item wordings. Unsurprisingly, in light of the results reported in Phases 1.1 and 1.2 (see Tables 1 and 2), this model had a poor fit to the data: Chi-square (134, N = 971) = 1659.446, p < .001; CFI = .703; TLI = .661; RMSEA = .108, with the 90% CI for RMSEA being [.104, .113]. The correlation between the promotion and prevention latent constructs in this ill-fitting model (i.e., r = .615; p < .001) was much higher than its counterpart reported in the study that introduced the GRFM (i.e., r = .170; Lockwood et al., 2002). Taken together, these results provide empirical evidence that data collected by means of the GRFM do not gauge promotion and prevention as independent dimensions in the population of New Zealand secondary school students.
Discussion
This study demonstrated that developmental differences characterizing target populations affect the ability of the GRFM instrument (Lockwood et al., 2002) to offer reliable and valid measures for promotion and prevention. Specifically, this research showed that administering the original items to New Zealand secondary school students results in a poor fit between the hypothesized unidimensional models and the empirical data. These findings have important implications for researchers, practitioners, teachers, school counselors, and school leaders who need to evaluate these pivotal motivation orientations for students in secondary school. The lack of research investigating how developmental differences affect the accurate measurement of promotion and prevention makes it difficult to identify the entire range of causes underlying the misfit of the original scales. However, the multiphase, multisample design we employed in this research enables us to identify some of them. We discuss these aspects below.
The original promotion scale required no alteration of its items; dropping I5 and I12 ensured a good fit to the data. Although the content of the first item purged (i.e., I5) touches on aspects relevant to the promotion construct, it does so in an indirect manner (i.e., “I often think about the person I would ideally like to be in the future”). More precisely, I5 attempts to gauge the strength of the promotion orientation by evaluating how often the respondent thinks about the person she or he would ideally like to be in the future. One plausible hypothesis as to why this item performs poorly is that for secondary school students it may make mentally accessible two different concepts: thinking of oneself and thinking about the person one ideally would like to become (see Higgins, 2012a, for recent discussions on accessibility theory). As a result of this confound, a low level of endorsement of I5 can result either because the respondent does not think a lot about herself or himself or because she or he has a low level of promotion. Noting that the promotion scale includes a strong indicator that references directly the “ideal self” (i.e., I14), we argue that purging I5 is unlikely to narrow the conceptual domain of the construct. Similarly, as we discussed previously, the second item dropped (i.e., I12) is largely redundant with a retained item (i.e., I8). Taking all of these aspects into consideration, it follows that the conceptual breadth of the shorter promotion scale, which excludes I5 and I12, is similar to that of the original GRFM measure (Lockwood et al., 2002).
In its original form, the prevention scale did not gauge the construct appropriately for New Zealand secondary school students. In an attempt to overcome this problem, we modified five of its nine items. These changes were not sufficient for obtaining a good fit to new empirical data. More specifically, three of the items that were altered remained weak indicators; an additional item had a significant residual overlap with another indicator, over and above the common influence of the prevention construct. Additionally, two items had acceptable loadings in Sample 2 but not in Sample 1. Following, we overview the characteristics of the weak prevention indicators we identified in this research. This knowledge is important for informing future work aimed at providing accurate measurements of prevention in similar populations.
The first weak prevention item, I1, uses a term that is not commonly employed by members of this population (i.e., “events”). However, replacing this word with a synonym (i.e., “outcome”) did not improve the item’s measurement properties. In light of these results, an alternative hypothesis is that participants in our studies did not have a common understanding of what it means to “focus on preventing negative events/outcomes.” This argument receives further support from the finding that two other items that reference prevention of failures (I10) and preventing losses (I11) had acceptable standard loadings either only in one sample or in none of them. Therefore, it is possible that students’ answers to these items included a significant amount of random “noise” and, as a consequence, were not driven primarily by the strength (the lack thereof) of their prevention construct.
The second suboptimal indicator of prevention, I2, had a significant residual correlation with another prevention item (i.e., I7). A plausible explanation for this significant residual correlation is that general anxiety may influence participants’ answers to both of these items, over and above the effect of prevention. Additionally, it is also possible that although for mature participants the two items probe different aspects of the prevention’s conceptual domain, the differentiation between these aspects is more obscure for younger respondents. Specifically, for some secondary school students the difference between “falling short of responsibilities and obligation” (i.e., I2) and “failing to accomplish academic goals” (i.e., I7) may be blurred. If this hypothesis is tenable, it suggests that, in developmentally younger populations, additional testing needs to be undertaken with regard to items that target adjacent/overlapping areas of the conceptual domain of a construct. This is a key endeavor that could provide important information regarding relations among certain items that cannot be accounted for by the influence of the common factor. An in-depth discussion of potential solutions for the problem of these unmodeled covariances is beyond the scope of this article. However, trying to account for these relations by means of bifactor models (Gignac & Watkins, 2013; Reise, 2012) or exploratory structural equation modeling (Asparouhov & Muthén, 2009; Marsh et al., 2009; Marsh, Liem, Martin, Morin, & Nagengast, 2011; Marsh, Morin, Parker, & Kaur, 2014; Morin, Marsh, & Nagengast, 2013) could be a fruitful strategy. Alternatively, if a simple structure is desired, researchers could retain a subset of the original indicators that contains only items that do not covary significantly with one another once the influence of the common factor has been taken into account. If this latter strategy is employed, it is important to assess the extent of the overlap between the conceptual domains spanned by the original and reduced sets of items.
In its original form, the third weak indicator of prevention (i.e., I9) was confusing for some respondents. This item is relatively long and involves several words that could activate different psychological constructs (e.g., imagine, experience, and fear). Our attempts to shorten this indicator and simplify its structure did not translate into better measurement properties. These findings highlight that developing simple and clear items that do not impose a heavy cognitive load on the respondents is not easy. This endeavor becomes even more complex when target populations comprise individuals having a broad range of reading abilities.
The fourth suboptimal measure of prevention we identified, I11, remained a weak indicator even after our attempts to modify it (see the summary in Phase 1.2). A plausible explanation for its inability to measure accurately the construct in our study is that in this young population the distinction between “preventing losses” and “achieving gains” is blurred or inconsistent across individuals (see also the discussion pertaining to I1).
Taking all of these aspects into consideration, it would appear that dropping four prevention items and modifying two more may make it possible to gauge prevention of New Zealand secondary school students by means of the GRFM (Lockwood et al., 2002). However, this conclusion would gloss over the inconsistent performance of some of the retained indicators of prevention across the two samples. (In contrast, the seven strong indicators of promotion worked consistently well in both samples.) In addition, such a conclusion would ignore the fact that in the well-fitting CFA model including both promotion and prevention items, the two latent factors have a very high positive correlation (i.e., r = 0.986); the latter finding was in line with the fact that a one-factor CFA model, grouping together promotion and prevention items, had a good fit to the data. Hence, results in this research suggest that the GRFM scores (Lockwood et al., 2002) did not capture promotion and prevention as independent constructs in the population of New Zealand secondary school students.
To frame our findings on a more general level, we note that the results of Summerville and Roese (2008; Study 2) suggested that a reference-point conceptualization of promotion and prevention may be problematic. Specifically, these authors showed that their results were inconsistent with theoretical predictions derived from regulatory focus theory (Higgins, 1997). Specifically, in contrast to theoretical predicaments, in their study, individuals’ attention to losses was unrelated to their employment of an ought self-guide, whereas a theoretically nil association (between attention to losses and attention to nongains) was significant. Summerville and Roese (2008) hypothesized that their findings may have reflected the fact that when employing reference-point conceptualizations of promotion and prevention in conjunction with self-report measures (as it is the case for the GRFM), “it appears difficult to disentangle the reference-point definition of regulatory focus from affectivity” (p. 253). Findings in our research pointing to significant residual correlations between pairs of prevention items that touch on the affective domain (i.e., I2 and I7; I4 and I9) are in line with their contention.
Future Directions of Research
Promotion and prevention have been theorized to be independent motivation orientations (Higgins, 1997, 2012b). Future research could examine whether or not this proposition is tenable when the target population is developmentally young (e.g., secondary school students). To this end, future work could measure these two constructs with some other standardized measures (e.g., Higgins et al.’s (2001) Regulatory Focus Questionnaire; Haws et al.’s (2010) Composite Regulatory Focus scale) and assess the correlation between the two factors. In addition, future work could investigate the extent to which factors tapped by other promotion scales overlap with promotion as measured by the GRFM. In case the GRFM’s promotion factor is found to have predictive power over and above other promotion measures, this finding could recommend its use in future research involving adolescents’ motivation.
Conclusion
The GRFM instrument (Lockwood et al., 2002) has been used extensively in psychological research. Findings of this study show, however, that the GRFM did a suboptimal job in gauging prevention in the population of New Zealand secondary school students. Moreover, our multiphase, multisample investigation highlighted that, for this population, the problems we identified with the prevention indicators were generally enduring and could not be solved by slight alterations of the items. In contrast, we found that the promotion scale had only small problems for only two of its nine indicators. The problems with the prevention items notwithstanding, findings from this research highlighted a key limitation of employing the GRFM in the population of New Zealand secondary school students: The GRFM scores did not measure promotion and prevention as independent dimensions. Whether this shortcoming is because the constructs are not independent in this population or because of GRFM failing to capture the theoretically posited distinctions between them is currently unclear and, hence, requires further research.
Footnotes
Acknowledgements
The first author is grateful for the help that Sara Finney, Kevin Grimm, and Keith Widaman provided in clarifying some ideas.
Declaration of Conflicting Interests
The author(s) declared no potential conflicts of interest with respect to the research, authorship, and/or publication of this article.
Funding
The author(s) disclosed receipt of the following financial support for the research, authorship, and/or publication of this article: The work of the first author was supported by a Fast Start Marsden Grant from Marsden Fund Council from Government funding, administered by the Royal Society of New Zealand (Contract VUW1210).