




Abstract
In the fruit fly, circadian behavior is controlled by a small number of specialized neurons, whose molecular clocks are relatively well known. However, much less is known about how these neurons communicate among themselves. In particular, only 1 circadian neuropeptide, pigment-dispersing factor (PDF), has been identified, and most aspects of its interaction with the molecular clock remain to be elucidated. Furthermore, it is speculated that many other peptides should contribute to circadian communication. We have developed a relatively detailed model of the 2 main groups of circadian pacemaker neurons (sLNvs and LNds) to investigate these issues. We have proposed many possible mechanisms for the interaction between the synchronization factors and the molecular clock, and we have compared the outputs with the experimental results reported in the literature both for the wild-type and PDF-null mutant. We have studied how different the properties of each neuron should be to account for the observations reported for the sLNvs in the mutant. We have found that only a few mechanisms, mostly related to the slowing down of nuclear entry of a circadian protein, can synchronize neurons that present these differences. Detailed immunofluorescent recordings have suggested that, whereas in the mutant, LNd neurons are synchronized, in the wild-type, a subset of the LNds oscillate faster than the rest. With our model, we find that a more likely explanation for the same observations is that this subset is being driven outside its synchronization range and displays therefore a complex pattern of oscillation.
Most living organisms organize their behavior following the succession of night and day. Since the early experiments of de Mairan with Mimosa pudica, it is well known that many of these organisms continue to display the same regularity even in the absence of environmental cues such as light and temperature. The period of this intrinsic activity, however, is usually close but not identical to the duration of daytime, and it is thus called “circadian.” With the advent of genetics, the question arose as to the complexity of the genetic basis of circadianly controlled behavioral traits. Since the early studies of Morgan, the fruit fly has proven to be a most versatile model organism not only due to its fast reproductive cycle, and that it can be easily bred, but also due to the numerous tools available for manipulating its genome. It is thus no wonder that the question of the genetic complexity of circadian rhythms was first addressed in the fruit fly. Yet, the answer, found by Konopka and Benzer (1971) in a series of landmark experiments, was rather unexpected. They discovered that circadian mutants, unaltered in any other respect, could be generated by manipulating only 1 gene, called “period.” After that, many other “circadian genes” were discovered, and there followed the discovery of homologies of these genes in mammals (Ralph and Menaker, 1988; Vitaterna et al., 1994) and other species. The picture that emerged was that many cells contain some kind of biochemical timer. The main mechanism at work in such timers is the negative feedback loop produced by a protein’s downregulation of the expression of its own gene (Hardin et al., 1990). Further work on Drosophila revealed that many other proteins contribute to the feedback loop, both with positive and negative effects, and functionally analogous proteins were later also found in mammals.
In multicellular organisms, cells displaying circadian rhythms seem to be present almost everywhere in the body. Yet, not all the cells are equally important for circadian behavior. In mammals, for example, it has been shown that circadian pacemaker cells can be found only in the suprachiasmatic nucleus (SCN) (Sujino et al., 2003). The question is how all these cells communicate to produce a single circadian rhythm for different behavioral traits (such as locomotor activity, body temperature control, oviposition, etc.). Again, the fruit fly turns out to be a very important animal model to study the interaction between the cells that compose the circadian pacemaker network. One reason for this is the relatively small number of circadian pacemaker neurons in the fly brain (about 150 compared with thousands of them in the mammal SCN) (Allada and Chung, 2010). The other is the fact that their neuroanatomy is well known (Helfrich Förster, 2003), which is essential to determine the structure of the circadian network.
The Drosophila brain contains approximately 150 clock neurons, which can be divided into 8 groups (Helfrich Förster, 2005). Of these, the most important, in terms of their ability to drive rhythmic locomotor behavior, seem to be the small lateral ventral neurons (sLNvs) and the lateral dorsal neurons (LNds). These groups, composed, respectively, by 4 and 6 neurons in each hemisphere, have been shown to be responsible for the timing of the 2 daily activity bouts of the fruit fly (Grima et al., 2004; Stoleru et al., 2004). The question of how these groups communicate with each other is still far from being resolved.
The search for a synchronizing agent between clock neurons has been intense both in mammals and insects, and it is still in full rage. Up to now, only 2 peptides have been related with any certainty to circadian function: vasoactive intestinal peptide (VIP) in mammals (Aton et al., 2005) and pigment-dispersing factor (PDF) in flies (Helfrich Förster, 1995) and cockroaches (Petri and Stengl, 1997). It is generally thought that beside these 2 peptides, there must be other synchronizing factors acting on the circadian neural network.
It must be stressed that even though mutants, for which the function of these neuropeptides has been altered to also display altered circadian rhythms (or are arrhythmic [Renn et al., 1999]), very little is known about the way in which they act to synchronize the circadian network. One way to infer these mechanisms from data from circadian mutants is to use mathematical models. These have been used to understand several aspects of circadian clocks since the seminal work of Goldbeter (1995) and have been applied to many different species and have sometimes led to very useful insights (Gallego et al., 2006). In recent years, some efforts have been directed to the modeling of communication between circadian cells in some rather general settings, which has provided some interesting insights about the general problem (Ueda el al., 2002; Abraham et al., 2010). However, recent experiments that make use of both great ingenuity and the development of new experimental techniques have led to very detailed (and specific) knowledge of the behavior of several neuron groups, especially in Drosophila melanogaster, which calls for the development of more detailed mathematical models. Here, we take a step in that direction by providing a model for the communication between 2 of the more important groups of circadian pacemaker neurons of the fruit fly brain, the sLNvs and the LNds. We have studied both the coupling between neurons within each group and the communication between the groups.
In section 2, we present the model that we use for a single neuron. In section 3, these model neurons are coupled to build a model for the sLNvs, usually assumed to constitute the main pacemaker of the fruit fly, and we show how some simple mathematical considerations can lead to insights that are confirmed by a more detailed model. In section 4, we consider the LNds and study the constraints set on the model by the data available. Some recent experiments suggest that the LNds must be divided into 2 groups with rather different properties (Yoshii et al., 2008; Im et al., 2011). We find that mutual coupling between the 6 neurons is not compatible with the experimental observations, which can only be reproduced if we assume that one of the groups “drives” the other. This is achieved with a synchronizing factor that is secreted by one group and acts on the other. Our model also allows us to give an alternative interpretation to the experimental data in the study of Yoshii et al. (2009). In the last section, our results are summarized, and some conclusions are drawn.
Materials and Methods
The Model for a Single Neuron
We consider that, at the individual level, all neurons are similar in the sense that the form of the equations that define them is the same. The differences are encoded in the values of the rates of the processes that take place inside each neuron. The model consists of simplified versions of the negative and positive arms of the feedback loop (Fig. 1). In the negative arm, messenger RNA (denoted by Pm(t)) of PERIOD (PER) is translated into protein (a state denoted by P0(t)) and can then pass through 2 states (denoted by P1(t) and P2(t)) and then enter the nucleus (i.e., make the transition from P2(t) to PN(t)). States 1 and 2 can represent increasing levels of phosphorylation or, in the case of state 2, the heterodimerization with the protein TIMELESS (TIM), which is needed for PER to enter the nucleus (even though the PER/TIM complex dissociates [Shafer et al., 2002] before this, heterodimerization seems to be a necessary previous step for nuclear entry [Meyer et al., 2006]). There, it represses the transcription of its own gene by hindering the activity of a transcriptional activator, which in our model is associated to the complex CLK/CYC, composed by clock proteins CLOCK and CYCLE. As the abundance of the protein CYC is very nearly constitutive, we have only considered the presence of CLK in the positive arm of the feedback loop. After translation, the protein CLK (represented by C(t)) enters the nucleus (where its state is CCN(t)), where it can activate the transcription of per.
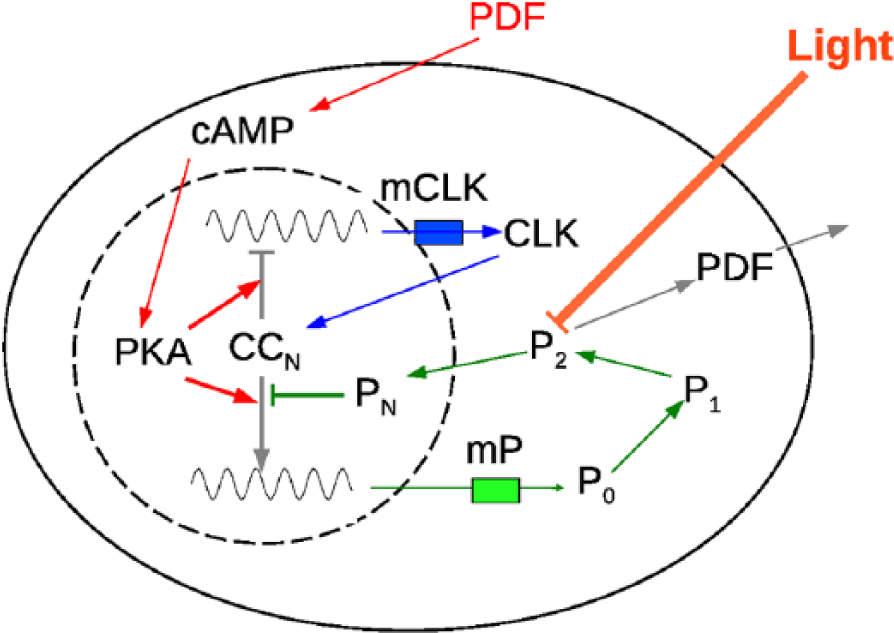
Schematic representation of the Drosophila circadian neuron model. The continuous and dashed lines represent the outer limits of the cytosol and the nucleus, respectively. The model consists of 2 interlocked feedback loops. In the first, the transcription of per into messenger RNA (Pm) is promoted by CLK-CYC (CCN); it is translated into P0 and suffers posttranslational modifications that transform it first into P1 and then into P2. This last species enters the nucleus, thus becoming PN, and represses the action of CCN. The second loop only includes the messenger RNA of CLK (Cm), which is translated into protein CLK and then enters the nucleus to form CCN, which both represses the transcription of clk and activates the transcription of per. The external PDF generates the cascade of cAMP and PKA, which further stimulate the action of CCN. The transport of internal PDF outside the cell is stimulated by P2. Light is assumed to increase the degradation rate of P2.
Even though the presence and action of TIM were not explicitly modeled, its main circadian functions were indirectly accounted for in the model. One of them is the formation of a heterodimer with PER, which allows PER to enter the nucleus. As mentioned above, this is modeled by the presence of the state P2, which is the only one that can have a transition to PN (nuclear PER). The other important function of TIM is mediating the influence of light. Light activates the cryptochrome CRY, which in turn induces the degradation of TIM, thus destabilizing the PER-TIM dimer. We have modeled this by increasing the value of the P2 degradation parameter when “lights” are on.
The neurons can differ in the equations and terms that govern their coupling with neurons of the same and different groups. We assume that communication is mediated by peptides, which by means of the correct receptor act by generating a signaling cascade in the cell. These cascades are usually very complex and involve a large number of proteins. In our model, we use a very simplified version of a cascade, with only 2 steps and 1 species associated to each step. In the first step, the abundance of the corresponding protein is affected by the presence of the peptide and can thus be interpreted as a signaling second messenger. For this reason, the corresponding model variable is called cAMP1[t] (or cAMP2[t]), where the number identifies the cascade to which the molecule belongs. The second step involves an action on the transcription of a clock gene, or the phosphorylation of a clock protein, and the model variable for the molecule involved is called PKA1[t] (or PKA2[t]). It is important to note that these names have been assigned only for ease of reference and that the corresponding variables are not assumed to model the abundance (nor even the presence) of real cAMP or PKA in the neurons involved.
The equations that define the models described above are given in the supplementary online material. The values of the parameters that define each neuron have been set by performing a random search in the parameter space and selecting those sets that provide some kind of oscillatory behavior. Even though the periods obtained for these oscillations are distributed across a certain range, every parameter set can be adjusted, by means of rescaling, for the oscillation to have any desired period (see the supplementary online material for details). At variance with what happens in mammals (Honma et al., 2004), for Drosophila melanogaster, there are no direct measurements of the period of individual neurons, and thus, these periods must be inferred from experimental data by indirect methods. In the next section, we show an example of how this can be done using published data.
Results
sLNvs
The sLNvs are considered the main pacemaker neurons in the sense that their absence (by ablation) or the disruption of their clocks (by several possible mutations) causes the behavior of the fly to be arrhythmic (Renn et al., 1999). This group is composed of 4 neurons, which are very close and placed ventrally in the lateral lobe of each hemisphere. There is another sLNv, conventionally called the fifth sLNv, which has the same arborizations as these 4 but has rather different properties (Rieger et al., 2006). One of the most important is that it does not express PDF (Johard et al., 2009). It is usually placed more dorsally than the sLNvs but closer to them than to the LNds. In spite of this, it is functionally more similar to the LNds because it is considered to drive the same locomotor activity bout as the LNds. Because of the mixed nature of this neuron, it is not considered in the following section, but in the discussion section, we comment on what our model could imply for the fifth sLNv.
Uncoupled neurons
Some experiments (Lin et al., 2004) in PDF mutants suggest that the sLNvs are autonomous oscillators and that they may not oscillate with the same frequencies. In terms of modeling, this implies that the values of the parameters that define each neuron should be slightly different to provide different oscillation periods. These values can be found by comparing the output of the neurons with the observations reported in PDF mutants. Unfortunately, even though single cell measurements have been performed for other types of clock neurons (by immunofluorescent staining or even by bioluminescent recording in the same brain for several days [Sellix et al., 2010]), data of measurements of single sLNvs have not been published yet probably because of their small size, which makes the observation quite difficult. Thus, the only data available correspond to the collective levels of the various clock proteins. The experiments show that these collective oscillations tend to dampen after a number of days, which can vary from 5 to 8 (Lin et al., 2004; Yoshii et al., 2009). With our model, we could obtain qualitatively similar behavior for 4 uncoupled neurons with many different parameter sets. We have chosen 4 of them, which provide periods distributed between 21 and 25 hours, which seem biologically quite reasonable, and produce a collective oscillation very similar to what has been observed in the experiments (Fig. 2).

Time course for the total abundance of a circadian protein of 4 uncoupled neurons in DD conditions (lower left panel). “0” marks the time when lights are set off. The period of the oscillation of each neuron is given by the maxima of the Fourier spectra (lower right panel). The upper left panel shows the evolution of 4 simple waves with the periods indicated in the upper right panel. The thick black lines represent the rescaled total abundance, whereas thin lines (lower left panel) represent the circadian protein abundance of single neurons.
To check that the periods obtained are not an artifact of the particular model that we use, we have resorted to a simple theoretical calculation. We have considered 4 simple waves of the form fi(t) = Sin(ωi t), where t is the time after lights-off and i = 1, 2, 3, 4 (the period of neuron i is given by Ti = 2 π/ωi). At t = 0, they start with the same phase, which models the fact that the neurons are synchronized until the lights go off. The sum of these waves produces a new wave that has an oscillatory envelope. The vanishing of the collective oscillation after lights-off can be modeled as the first time value at which the envelope vanishes (hereafter called t0). If we consider that the largest of the periods of the 4 neurons is Tmax, the smallest is Tmin, and the other 2 are Tmax – ΔT/4 and Tmin + ΔT/4, with ΔT = Tmax – Tmin, it is straightforward to obtain that ΔT = 3(Tmax)2/(4t0 + 3Tmax). This formula shows that if the signal vanishes at about 5 days, the difference between the largest and smallest periods should be about 4 hours (Fig. 2), whereas for 8 days, it should be between 2 and 2.5 hours (if Tmax is approximately 26 hours). Interestingly, these values are similar to the dispersions in the period of neurons in the SCN of mice (Honma et al., 2004).
It is important to note that very similar damping of the signal can be obtained with neurons that do not oscillate autonomously but can sustain oscillations when coupled to each other (or driven by light). The difference would be in what happens after the initial damping (i.e., after t0). Figure 2 shows that after about 10 days, the signal should oscillate for a few days with an amplitude close to the values that it had in LD. This would evidently not be the case if the neurons did not have autonomous oscillations (i.e., if the oscillations damped after lights-off). In principle, only an experiment that lasts more days could discriminate between these 2 possibilities. Using the harmonic waves approximation mentioned above, it is straightforward to see that a full revival of the signal happens at time 4t0. This time can be rather large for an experiment, but it must be noticed that a partial revival can be observed for smaller times.
Coupling
Given the fact that the sLNvs both secrete and have receptors for PDF (Helfrich Förster, 2003; Im and Taghert, 2010), we have assumed that this is the peptide that mediates communication between these neurons, and we have therefore used data about PDF mutants to build our model. Unfortunately, there is almost no information about which proteins the secretion of PDF depends on or on which protein the signaling cascade triggered by the PDF receptor acts.
Some experiments have studied the levels of expression of PDF and its presence in the terminals of sLNvs. In our model, we consider that the PDF generated in one cell is instantly sensed by all other cells. Thus, it is reasonable to associate PDF in our model with the abundance of this peptide in the terminals of the cell. It has been shown (Park et al., 2000) that there seems to be a negative relationship between the levels of PER and the presence of PDF in the terminals. In particular, in the per01 mutant, the levels of PDF are constitutive and larger than in the wild-type. To model this, we have used the following equation for the evolution of PDF:

which implies that PDF secretion is repressed by PER when it reaches its second state (i.e., when it is ready to enter the nucleus). From this equation, it is straightforward to show that when P2 is not present (as happens in the per01 mutant), the abundance of PDF rapidly evolves to a stable (i.e., constitutive) value.
Even though one of the signaling cascades of the PDF receptor has recently been characterized in some detail (Zhang and Emery, 2013), exactly how this cascade acts on the circadian clock is not known. For this reason, we have tested several mechanisms for the action of PKA on clock processes. Each mechanism is defined by adding 1 equation for each member of the cascade as well as some terms to 1 or more of the equations that define each neuron. The test consists of assigning random values to the parameters that control the evolution of PDF, cAMP, and PKA and solving the evolution equations to see whether the abundances oscillate. For each mechanism, we have tested between 1000 and 5000 parameter sets. We have considered that the result is positive not only when oscillations are present but also when the period is between 23.8 and 24.2 hours, as observed in the wild-type (more details are given in the supplementary online material).
As Figure 3 shows, the mechanisms that synchronize the 4 neurons are not exactly equivalent in the oscillations that they produce. In some of them, the transition from LD to DD is rather smooth (with the amplitude slowly decreasing to a stable value), whereas in others, this transition is very fast. There are also differences in the amplitude jumps between the stable oscillations at LD and DD.

Time courses for the abundance of a circadian protein of 4 uncoupled neurons in DD conditions. “0” marks the time when lights are set off. The upper panel shows a system where the signaling cascade has a negative effect on the phosphorylation of PER (mechanism 14), whereas in the lower panel, it has a positive effect on the transcription of clk (mechanism 3). The thick black lines represent the rescaled total abundance, whereas thin lines represent the circadian protein abundance of single neurons.
We have tested 21 mechanisms (detailed in Suppl. Table S2), but we have found that synchronization can only be achieved with a few of them. In the CLK loop, only a positive action on the transcription of clk can synchronize the 4 sLNvs. In the PER loop, this can only be achieved by some mechanisms that act “against” the loop, either by delaying transitions or providing reverse transitions or simply by faster degradation of a given member of the loop. It has very recently been found that PDF and cAMP enhance PER stability in Drosophila clock neurons (Li et al., 2014). One of the mechanisms that we have found (called mechanism number 6, which allows P2 to transition back to P1) does increase the stability of total PER. Yet, there are others that decrease the stability of total PER, as the addition of a PKA-dependent degradation term to P2 (mechanism number 11), and nevertheless synchronize the sLNvs. The common feature of both mechanisms is that they delay nuclear entry of P2. That this seems to be more fundamental than the stability of PER is confirmed by the fact that when the negative degradation term of the equation for P2 is added to the evolution equation of PN (mechanism number 17), so that the amount of P2 that was degraded in the previous mechanism now enters the nucleus, the neurons are no longer able to synchronize.
Remarkably, directly strengthening or repressing the action of CLK/CYC on the transcription of per (mechanisms 3 and 4) does not produce synchronization. However, this is not the case when the presence of PDF in the terminals is activated by PER (instead of repressed, as above), as mentioned in the next section.
LNds
It has recently been shown that, even though there are no clear morphological differences between them, the 6 LNds are not identical (Yoshii et al., 2008), and only 3 of them express fly cryptochrome CRY. Furthermore, it has been shown that these 3 neurons are the only ones that express the PDF receptor (Im et al., 2011). In the following, this group is called LNd+, and the remaining 3 cells, which do not express the PDF receptor, are called LNd–. In spite of these differences, it has been observed that the oscillations of PER abundance of all the LNds remain synchronized in the PDF-null mutant (Lin et al., 2004; Yoshii et al., 2009). If we assume that the intrinsic period of these neurons can be very different from each other (as we assumed is the case for the sLNvs), this implies the existence of a synchronizing factor distinct from PDF. As mentioned in the previous section, there are many possibilities for the components and processes of the cellular clock to influence or be influenced by the evolution of such a factor. Some of them were investigated in the previous section. Because there is no information regarding this unknown factor, we can lift the restriction that it is repressed by PER and study which mechanisms lead to synchronization when this unknown neurotransmitter (hereafter called UNT1), or its transport, is activated by PER. In this case (shown in the last column of Suppl. Table S2), we find collective oscillations when either the transcription of clk or the nuclear entry of CLK (and/or its association with CYC) is hindered by PKA (mechanisms 4 and 19). Interestingly, we also obtain oscillations both when the transcription of per is repressed or activated by PKA (by way of CLK [mechanisms 1 and 2]). Evidently, it could also happen that the presence of UNT1 in the terminals is repressed by P2, in which case the possible mechanisms involved would be the same as for PDF.
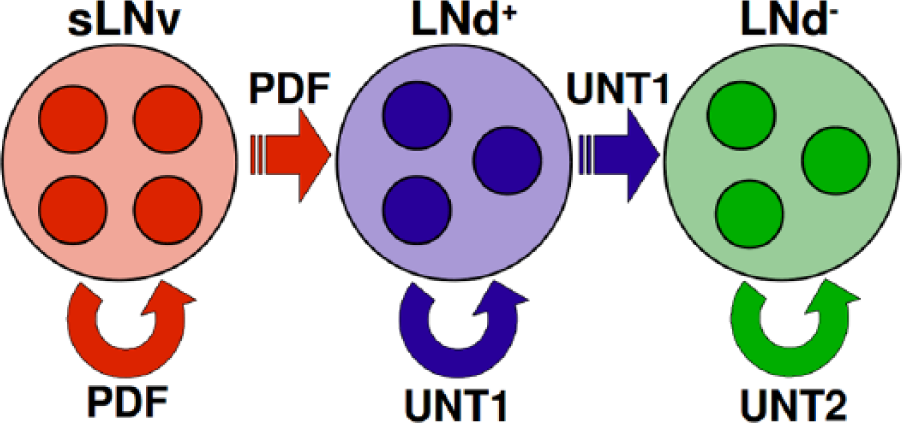
Schematic model for the relationship between the 3 main circadian neuron groups of Drosophila. The small circles represent neurons, and the arrows show the action of 3 synchronizing factors (PDF and 2 unknown neurotransmitters, denoted by UNT1 and UNT2).
Given that the LNd+ possess PDF receptors, one should consider that they are driven by PDF secreted by the sLNvs, which would explain the fact that the LNd+ are synchronized with them. The action of PDF in these cells, in the sense of the specific process of the cellular clock that is affected by the cascade, does not need to be the same as in the sLNvs. In fact, recent experimental results point to the fact that the cascade triggered by the PDF receptor in the sLNvs is different from the one triggered in the LNds (Duvall and Taghert, 2012; Duvall and Taghert, 2013). In our model, we have tested several mechanisms for the effect of the cascade of PDF on the cellular clock of the LNd+, and we have found that most of them lead to synchronization with the sLNvs for all choices of the cascades related to intragroup synchronization (i.e., the cascade triggered by PDF in the sLNvs and by UNT1 in the LNd+). This is not surprising since it is well known (Pikovsky et al., 2001) that forward synchronization (also called driving), where the synchronizing factor acts in only one direction (from the sLNvs to the LNd+), is easier to achieve than mutual synchronization. Furthermore, we have observed (see supplementary online material for details) that the range of values of the coupling parameters for which synchronization can be achieved is much larger for this driving than the range of values that produce mutual synchronization in the sLNvs.
For the LNd–, it has been observed (Yoshii et al., 2009) that these neurons are synchronized in the pdf01 mutant both among themselves as with the LNd+. This points to some kind of connection between both groups. To avoid the proliferation of neuropeptides, in our model, we have assumed that this synchronization is produced by UNT1. However, the same experiment showed that both groups do not seem to be synchronized in the wild-type. Moreover, the LNd+ oscillate in synchrony with the sLNvs, whereas the LNd– display a clearly different type of oscillation (Yoshii et al., 2009). In the experiment (Yoshii et al., 2009), Drosophila brains were collected at 2 different time points each day during the first 5 days in DD, and immunofluorescent recordings of the abundance of TIM in the 3 neuronal groups mentioned here were performed. These observations showed that the oscillation of the LNd+ is clearly different from the oscillations of the LNd–. Furthermore, it was assumed (Yoshii et al., 2009) that for the LNd–, these observations revealed an oscillation with a period of 21.7 hours. However, many other possibilities can generate such data points. We have used our model to see whether this or other hypotheses could best explain the data.
We have analyzed 2 families of models. In the first one, we have assumed that the 6 LNds are interconnected by a single unknown synchronizing factor (i.e., the LNds both secrete and have receptors for this factor) and that CRY-positive and CRY-negative neurons may differ in the cascades that are triggered by the UNT and in the process that activates its secretion. Even though we have tested several different possibilities for both mechanisms, we have not been able to find a parameter set for which, in the wild-type, the LNd+ neurons behave very differently from the LNd–, if we assume that these groups are synchronized in the pdf01 mutant.
In the second family of models (Figs. 5 and 6), we have assumed that only the LNd+ secrete a neurotransmitter (UNT1), for which both the LNd– and LNd+ have receptors. Thus, the LNd+ would be able to drive the oscillations of the LNd– but not the other way around. Additionally, we have also assumed the existence of a second neurotransmitter (UNT2) responsible for intragroup synchronization of the LNd–. For this family of models, we have found many parameter sets, for which the 2 groups are synchronized in the pdf01 mutant, but only the LNd+ are synchronized in the wild-type. However, in none of these instances did the LNd– display a coherent oscillation (i.e., an oscillation with a single significant Fourier peak) in the wild-type. What we find is that in many cases, these neurons are not even synchronized among themselves (Fig. 5). It is not difficult to see that if this abundance is sampled every 12 hours for 3 or 4 days, the sample obtained could easily be confused with an oscillation with a period that is less than 22.8 hours.
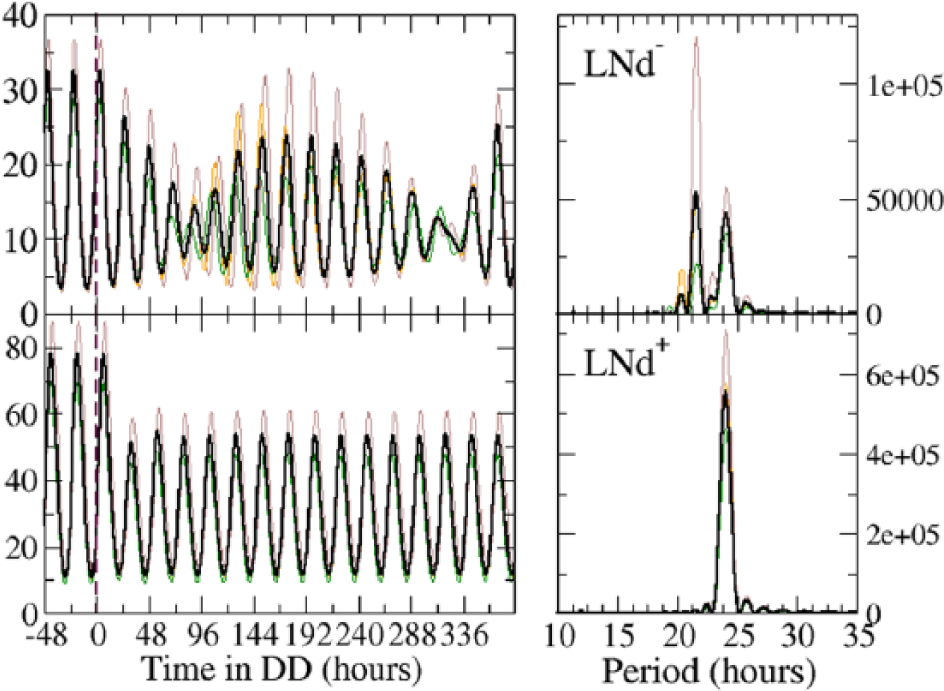
Time courses for the abundance of a circadian protein of 2 sets of 3 neurons in DD conditions for the wild-type. The lower and upper panels correspond to the models of the dorsal lateral neurons with (LNd+) or without (LNd–) PDF receptors, respectively. “0” marks the time when lights are set off. The thick black lines represent the rescaled total abundance, whereas thin lines (lower left panel) represent the circadian protein abundance of single neurons. The left panels show the power spectra of the abundances. Intragroup coupling of the LNd+ and LNd– is effected through mechanisms 3 and 5, respectively. Driving is effected through mechanism 3. The secretion of UNT2 is activated by PER.
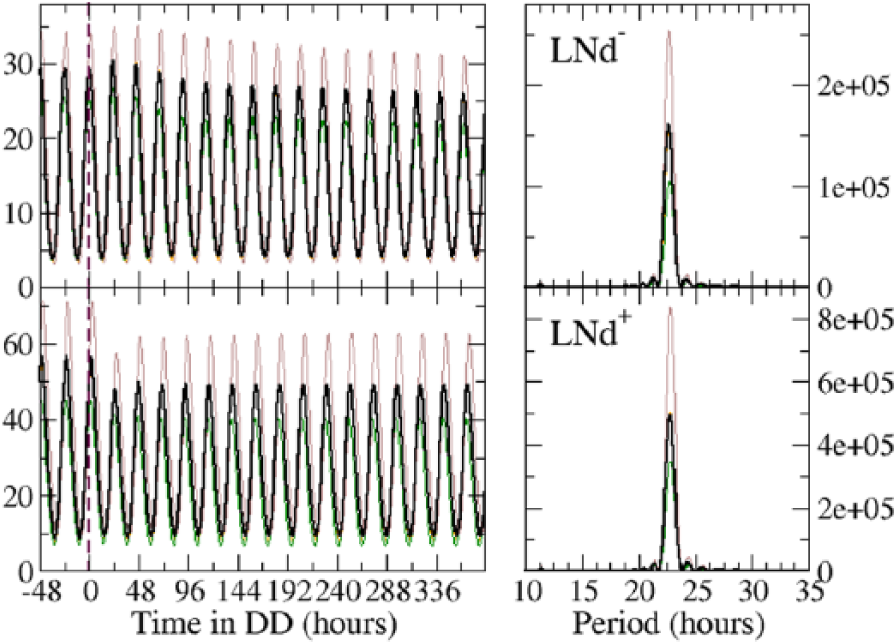
Time courses for the abundance of a circadian protein of 2 sets of 3 neurons in DD conditions for the pdf01 mutant. The lower and upper panels correspond to the models of the dorsal lateral neurons with (LNd+) or without (LNd–) PDF receptors, respectively. “0” marks the time when lights are set off. The thick black lines represent the rescaled total abundance, whereas thin lines (lower left panel) represent the circadian protein abundance of single neurons. The right panels show the power spectra of the abundances. Intragroup coupling of the LNd+ and LNd– is effected through mechanisms 3 and 5, respectively. Driving is effected through mechanism 3. The secretion of UNT2 is activated by PER.
In terms of dynamic systems, a simple explanation can be offered using the concept of synchronization range (Pikovsky et al., 2001), which is the range of values of a given variable, for which a dynamic system can synchronize with the driver system. What is happening in this case is that for the pdf01 mutant, the driving frequency of the LNd+ is within the synchronization range of the LNd–, whereas in the wild-type, the frequency of the LNd+ is outside the synchronization range of the LNd–. When this last situation happens, the driven system has a complex pattern of oscillations, whose Fourier spectrum (or periodogram) has more than 1 significant peak.
Given that the difference in the periods of the driving system in these 2 very different situations is relatively small, one might think that the system (i.e., the LNd–) is placed in a very special parameter region. However, we have performed a sensitivity analysis for the parameters of the system in Figures 5 and 6, and we have found that individual variations of 25% in each parameter of each neuron do not qualitatively change the behavior found.
For most of the parameter sets, for which synchronization is achieved for the mutant but not for the wild-type, the intrinsic oscillation period of the LNd– was between 1 and 2 hours shorter than the intrinsic period of the LNd+. Conversely, when the intrinsic period of the LNd– is larger, synchronization is achieved both for the wild-type and PDF01 mutant. Thus, any mutation that could slow down the clock only in the LNd– should produce a fly in which the LNd– and the LNd+ are synchronized in the wild-type.
Discussion
In this work, we have presented a model of the 2 groups of neurons that are considered to be the most important circadian pacemakers in Drosophila melanogaster: the small ventral lateral neurons and the dorsal lateral neurons. Within each group, the neurons are defined by equations of the same functional form, but they can differ in the values of the parameters of each equation. To set these values, we have assumed that the abundance of the clock proteins oscillates even when the neurons are not coupled and that the temporal evolution of the total amount of proteins in the sLNvs should qualitatively have the same features as in the experiments with PDF-null mutants. We have shown that this leads to a difference between the largest and smallest periods of the neurons of about 4 hours, which is consistent with what has been found for the distribution of individual periods in mammal circadian cell cultures. Furthermore, of the many possible mechanisms tested for the action and secretion of PDF in the molecular clock, we have found that only a few of them can produce synchronization with collective oscillations that are consistent with the observations available for the wild-type and PDF mutant. The most important common feature of these mechanisms seems to be that nuclear entry of PER is delayed.
We have assumed here that the release of PDF is negatively correlated with PER, as observed in the experiments. In particular, in our model, PDF release is repressed by P2. Yet, we have also found that if PDF release is instead activated by P2, the coupling mechanisms that produce synchronization are different from the previous case. In other words, for a given coupling mechanism, the timing of PDF release is important. The question that arises is how precise should this timing be. We have tested this in our model by allowing PDF release to be repressed (or activated) by other variants of PER (P0, P1, and Pm), whose abundances reach their minima early in the subjective day. We find that synchronization still occurs in these cases. On the other hand, synchronization cannot be achieved if PDF release is controlled by Pm. This implies that PDF can synchronize the sLNvs when it is released at various times during the first part of the subjective day but not later. Interestingly, a similar role for timing of the synchronizing factor VIP has recently been found in a model of the mammalian circadian clock (Ananthasubramaniam et al., 2014).
To model the LNds, we have used the information that only 3 of them (called LNd+) have receptors for PDF, which implies, assuming that this is the only synchronizing factor between sLNvs and LNds, that the sLNvs can drive the oscillations of only these 3 neurons. For this kind of driving, synchronization between the LNd+ and the sLNvs can be achieved by most of the possible mechanisms for the influence of PDF, as was to be expected because driving is easier than mutual synchronization.
Regarding the LNd–, experiments (Yoshii et al., 2009) have revealed a puzzling feature: in the wild-type, the sLNv and LNd+ are synchronized, but the LNd– seem to be out of sync with them, whereas in the PDF-null mutant, all the LNds are synchronized (Yoshii et al., 2009). Yoshii et al. (2009) interpreted that the LNd– in the wild-type were oscillating collectively but with a smaller period than the LNd+. Yet, as the observations consist of only 2 time points per day, many other interpretations are possible. In terms of our mathematical model, we have found that a more likely explanation for the pattern observed is desynchronization that causes a complex oscillation (i.e., an oscillation with more than 1 significant peak in its periodogram) of clock proteins in LNd– neurons. Furthermore, such desynchronization cannot occur if all the LNds secrete and receive the same synchronizing factor. It does happen when one assumes that there is a synchronizing factor that is secreted only by the LNd+ and is responsible for intragroup synchronization but also acts on the LNd–, driving their oscillation in the pdf01 mutant. For the wild-type, the oscillations of the LNd+ have a period that is outside the entraining range of the LNd– and are therefore not able to drive the LNd–, which then display a rather erratic collective oscillation.
Two possible candidates for the second synchronizing factor could be the short neuropeptide F and the ion transport peptide (ITP) that are expressed in at least some of the LNd+ neurons (Johard et al., 2009). Very recently, it has been found that the ITP does seem to have an influence on circadian locomotor rhythms (Hermann-Luibl et al., 2014), but because the ITP receptor is still unknown, it is not clear yet which clock neurons could be the targets of the ITP (if any). In fact, indirect evidence seems to indicate that the ITP is more involved in the output than in the internal synchronization of the circadian clock (Hermann-Luibl et al., 2014).
As mentioned above, in this model, we have not considered the fifth sLNv. It expresses both CRY and the PDF receptor, and thus, it could be considered (in some sense) to be similar to the PDFR-positive LNds. Yoshii et al. (2008) have shown that the oscillations of the clock proteins of this neuron have the same period as the ones observed in the LNd+, both in the wild-type and the mutant. Furthermore, there seems to be phase synchronization with the LNd+, which would point to some kind of communication. If this was the case, it could be included in our model simply as one more member of the LNd+ group. We have checked that the results presented here do not change if this group has 3 or 4 neurons.
A relatively detailed mathematical model such as the one presented in this paper can also be used to make predictions for future experiments. For example, we have shown in the previous section that a mutation that slows down the molecular clock of only the LNd– should produce flies, for which the LNd+ and the LNd– are synchronized in the wild-type (and also in the pdf01 double mutant). Evidently, it is not clear that this more coherent oscillation of the whole system could also cause a change in circadian behavior. The link between the activity of circadian neurons and a given behavioral phenotype is far from being established. Furthermore, the role that different neuronal groups play in the timing of behavior is still largely unknown. Very recently (Yao and Shafer, 2014), several mutants were generated whose molecular clock was accelerated or slowed down but only in selected groups of neurons. That study showed that the circadian behavioral phenotypes cannot be unequivocally correlated with the activity of a single neuronal group. Rather, they seem to depend on certain interactions between neuronal groups that have to be inferred from the behavioral data. Our mathematical model of the circadian neural network could be applied to these mutants to help in the identification of the outputs of the network that could be associated to the circadian behaviors observed in the experiments.
Footnotes
Acknowledgements
We acknowledge financial support from CONICET, Argentina, with grant PIP 11220090100349.
Conflict of Interest Statement
The author(s) have no potential conflicts of interest with respect to the research, authorship, and/or publication of this article.
Notes
References
Supplementary Material
Please find the following supplemental material available below.
For Open Access articles published under a Creative Commons License, all supplemental material carries the same license as the article it is associated with.
For non-Open Access articles published, all supplemental material carries a non-exclusive license, and permission requests for re-use of supplemental material or any part of supplemental material shall be sent directly to the copyright owner as specified in the copyright notice associated with the article.
