



Abstract
The circadian system drives the temporal organization of body physiology in relation to the changing daily environment. Shift-work (SW) disrupts this temporal order and is associated with the loss of homeostasis and metabolic syndrome. In a rodent model of SW based on forced activity in the rest phase for 4 weeks, we describe the occurrence of circadian desynchrony, as well as metabolic and liver dysfunction. To provide better evidence for the impact of altered timing of activity, this study explored how long it takes to recover metabolic rhythms and behavior. Rats were submitted to experimental SW for 4 weeks and then were left to recover for one week. Daily locomotor activity, food intake patterns, serum glucose and triglycerides, and the expression levels of hepatic Pparα, Srebp-1c, Pepck, Bmal1 and Per2 were assessed during the recovery period and were compared with expected data according to a control condition. SW triggered the circadian desynchronization of all of the analyzed parameters. A difference in the time required for realignment was observed among parameters. Locomotor activity achieved the expected phase on day 2, whereas the nocturnal feeding pattern was restored on the sixth recovery day. Daily rhythms of plasma glucose and triglycerides and of Pparα, Pepck and Bmal1 expression in the liver resynchronized on the seventh day, whereas Srebp-1c and Per2 persisted arrhythmic for the entire recovery week. SW does not equally affect behavior and metabolic rhythms, leading to internal desynchrony during the recovery phase.
Keywords
A large part of the worldwide active population is involved in shift-work (SW) (ILO, 2008). Epidemiological studies show that SW is a risk factor for disturbed circadian rhythms and enhances the risk of developing metabolic dysfunction, including obesity, type-2 diabetes and metabolic syndrome (Biggi et al., 2008; Gan et al., 2015; Knutsson et al., 2004; Proper et al., 2016).
The mammalian circadian system, including that of humans, consists of a master clock, the suprachiasmatic nucleus (SCN), which resides in the hypothalamus and synchronizes the organs and systems according to the environmental LD cycle by transmitting temporality to peripheral biological clocks (Kalsbeek et al., 2011). The expression of circadian rhythms in the SCN and in the periphery depends on a set of so-called clock genes. In the absence of external stimuli, these genes can maintain self-sustained oscillations with a period of about 24 h and are responsible for endogenous rhythms (Hogenesch and Herzog, 2011). Clock gene transcripts form complex positive (Bmal-Clock) and negative (Per-Cry) feedback loops, which drive the rhythmic expression of clock-controlled genes and convey rhythmicity to metabolic processes.
The circadian system may become temporarily and severely disorganized under perturbing factors such as SW (Buijs et al., 2016), which represents a condition during which environmental signals contradict the internal timing driven by the circadian system. We have previously reported that, in a SW rat model, forced activity during the light phase does not affect SCN synchronization with the LD cycle. However, it triggers a condition of internal desynchronization, where peripheral oscillators are temporally uncoupled from the master clock (Salgado-Delgado et al., 2010b; Salgado-Delgado et al., 2013). This desynchronization results in altered daily patterns of locomotor activity, food ingestion, metabolites (i.e., glucose and triglycerides) and the hepatic expression of metabolism-related genes (e.g., Sirt1, Nampt and Pepck, among others) and clock genes (i.e., Per1-2 and Clock) (Salgado-Delgado et al., 2008; Salgado-Delgado et al., 2013). The effects that we observed in the metabolism of SW animals include alterations that have been reported as significantly prevailing in humans subjected to shifting working schedules: weight gain and propensity to obesity, glucose intolerance and dyslipidemia (Salgado-Delgado et al., 2010b; Su et al., 2016; Ulhôa et al., 2015).
It is still not clear whether this internal circadian desynchrony can be restored and, with it, the internal homeostasis. In the present study, we explored the speed for recovery of behavioral and metabolic rhythms in rats undergoing a 4-week experimental SW protocol. At the end of the protocol, animals could recover for one week. Daily patterns of locomotor activity, food intake, plasma glucose and triglycerides, hepatic metabolic (Pparα, Srebp-1c, and Pepck) and clock genes (Bmal1 and Per2) were analyzed and compared with a non-working control group. Our results provide evidence that the recovery of circadian synchrony after 4 weeks of SW may take more than a week, and that such long-term effects of disrupted activity might contribute to the poor physiological adaptation to and pathological outcomes of SW.
Materials and Methods
Animals and Housing
Male Wistar rats, weighing 180 to 200 g at the beginning of the experiment, were housed in individual transparent acrylic cages (40 × 50 × 20 cm) and placed in soundproof lockers housing 8 animals each, in a soundproof monitoring room. Rats were maintained in a 12:12 h LD cycle with lights on at 0700 h, defined as zeitgeber time 0 (ZT0), constant temperature (22°C [1°C]), circulating air and free access to water and food (Rodent Laboratory Chow 5001; LabDiet, IL). Experiments were approved by the ethics committee of the School of Medicine at Universidad Nacional Autonoma de México, in accordance with the national guide of care and use of experimental animals (Norma Oficial Mexicana NOM-062-ZOO-1999).
Groups
Rats were randomly assigned to 1 of 2 groups: control (CTRL) or experimental SW. CTRL rats were housed in individual cages in the monitoring system and were left undisturbed for 4 weeks except during the implantation of the jugular cannula. Rats assigned to the experimental SW were submitted to a forced activity protocol during the light phase, which corresponds to the animal’s sleep/rest interval.
Experimental Design
Experiment 1. Recovery speed in general activity
All rats were monitored in their home cages for 8 to 10 days in LD conditions to establish a baseline. To determine the recovery in general activity, rats were exposed to a 4-week long protocol of forced activity. The evaluation of recovery began the first day the animals (n = 8) were permitted to rest and left undisturbed in an LD photoperiod for 7 days. Daily general activity was monitored in order to determine the daily acrophases, number of total daily activity counts, and the proportion of day-night activity. For each parameter, we considered that rats had achieved recovery after they reached values similar to those at their baseline.
Experiment 2. Recovery of metabolic variables
At the end of the third week of the SW protocol a series of CTRL (n = 4) and SW (n = 4) rats underwent surgery to implant a jugular cannula. Rats recovered over the weekend and, the following Monday, the working protocol was restarted for one more week.
During the recovery week, blood samples were obtained on the third, fifth and seventh day of recovery (RD3, RD5, and RD7, respectively) and at 4 time points: ZT0, ZT6, ZT12 and ZT18 for both the CTRL and SW groups. Data at ZT0 are double-plotted as ZT24. Blood samples (240 µl) were collected in Eppendorf tubes (1.8 ml) containing a clot-activator gel (BD Vacutainer 367983, BD, Mexico City, Mexico) and were centrifuged at 2500 rpm for 10 min. Plasma was stored in 100-µl aliquots at −80°C until assay.
Experiment 3. Recovery of metabolic and clock genes in the liver
To determine metabolic and clock gene expression, another group of rats was exposed to the 4-week long SW protocol, after which tissue was collected on RD3, RD5, and RD7. We avoided an unnecessary use of animals for RT-PCR experiments by analyzing gene expression in the CTRL group only on RD7. These results were compared with those in the SW group. Tissue samples were obtained at ZT0, ZT6, ZT12 and ZT 18 (n = 3 per time point). Rats were killed with an overdose of sodium pentobarbital (65 mg/ml Sedalpharma, Pet’s Pharma, Mexico DF, Mexico) and part of the hepatic left lobule was quickly removed and immediately frozen at −80°C.
Shift-work Protocol
To induce activity during the rest phase, SW rats were placed in slow rotating drums (designed by Omnialva SA de CV for our laboratory) for 8 h daily, as previously described (Salgado et al., 2008). The drums rotated with a speed of 1 revolution/3 min. Drums had ample enough space to allow rats to move, eat and drink freely (more details in Salgado et al., 2008).
From Monday to Friday, SW rats were taken out of their home cages at ZT2 and placed in the rotating drums for 8 h; at ZT10 rats were returned to their home cages, where they rested until the next day. On Saturday and Sunday, rats were left undisturbed in their home cages. This procedure was carried out for 4 weeks.
Monitoring of Behavioral Rhythms
General activity in the home cage was continuously monitored using pressure sensors placed under individual cages. Behavioral events were collected with a digitized system and automatically stored every minute in a PC for further analysis with the SPAD9 (Sistema de Procesamiento y Adquisición de Datos, Version 1.1.1) program designed for this system. For each group, a mean activity wave was constructed for the baseline and for the fourth weekend of the protocol. For both waveforms, the percentage of diurnal and nocturnal activity was calculated. The acrophase and the mean daily total activity counts were calculated for the baseline, and then for each day of the recovery period.
Monitoring of Food Intake
The amount of consumed food was weighed twice a day (at ZT0 and ZT12) at baseline, on the last day of the SW protocol, and on the subsequent 7 days of recovery. The amount of ingested food was compared between the respective light (rest) and dark (active) phases.
Jugular Catheter Surgery
At the end of the third week of the SW protocol, a series of CTRL (n = 4) and SW (n = 4) rats underwent surgery to implant a jugular cannula. Animals were anesthetized with a mixture of ketamine (90 mg/kg) and xylazine (10 mg/kg) (both provided by PiSa, Hidalgo, Mexico) and catheterized in the jugular vein with a polyethylene silicon tube (0.635 mm inner diameter and 1.19 mm outer diameter; Silastic Laboratory tubing; Dow Corning Corp., Midland, MI), filled with heparin (500 U/ml; PiSa, Hidalgo, Mexico) as an anti-coagulant. The outer end of the cannula was fixed between the shoulder blades, and clotted with a small needle.
Serum Metabolite Determination
Blood samples for both the CTRL and SW groups were obtained on RD3, RD5, and RD7 at 4 time points: ZT0, ZT6, ZT12 and ZT18. Glucose levels were estimated using a commercial colorimetric kit (Hycel de México; Jalisco, México), which is based on the reaction between glucose and fenol-4-aminofenazone as a chromogen. Serum triacylglycerides (TAG) were assessed with a commercial diagnostic kit (SERA-PAK plus, Bayer; Sees, France) based on the reaction with 4-amino-antipiridin. Both glucose and TAG reactions were measured at 500 nm with a spectrophotometer (Novaspec II Visible, Amersham Pharmacia Biotech, Cambridge, UK).
Semi-quantitative qRT-PCR
Total RNA was isolated from liver with Trizol (Invitrogen, Thermo Fisher Scientific Inc., Waltham, MA, USA) according to the manufacturer’s recommendations. Equal quantities of total RNA were used for complementary DNA generated by SuperScript III (Invitrogen). Metabolic genes Srebp-1c, Pparα, Pepck and clock genes Bmal1 and Per2 were analyzed by quantitative reverse-transcriptase-mediated PCR (qRT-PCR). The oligonucleotide primer sequences are listed in Table 1. All data were normalized to β-actin expression. Expression of mRNA was quantified using a Bio-Rad Personal Molecular Imager FX (Bio-Rad; Hercules, CA) and analysis was performed using Scion Image for Windows 4.0.
Primer sequences used for semi-quantitative PCR.

Statistical Analysis
The acrophase, amplitude, mesor, and rhythmicity significance were calculated for samples taken on RD3, RD5, and RD7 for locomotor activity, serum metabolites and gene expression by performing a cosinor analysis test. Only the acrophase of locomotor activity was evaluated daily. In addition, total activity counts per day during the recovery week were compared with the baseline activity. Recovery was achieved when the acrophase and activity counts were not statistically different from baseline values.
The single cosinor analysis was performed as previously described (Nelson et al., 1979), using the formula: Y(t) = M+ACos[(2π/T)*(t-φ)], where Y = collected data; M = mesor; A= amplitude; φ = acrophase; T = period, t = sampling time. Double-plotted data (ZT24) were not included in the cosinor analysis. Circadian rhythmicity significance (24-h period) was assumed when the amplitude of the fitted curve was statistically >0.
Data were classified by groups (CTRL vs. SW) and time (day) and are represented as mean ± standard error of the mean (SEM). Food intake data were analyzed with a 2-way ANOVA for 2 factors: days (9) and phase (light and dark). Serum concentration of glucose, TAG and daily profiles of clock and metabolic genes were evaluated also by a 2-way ANOVA for the factors group (2 levels) and time (4 levels).
All analyses were followed by a Tukey post hoc test with significant values set at p < 0.05. Statistical analysis was performed with GraphPad Prism version 6.00 for Windows, (GraphPad Software, La Jolla, CA).
Results
Recovery of General Activity After 4 Weeks of Shift-work
At baseline, SW rats exhibited clear daily rhythms entrained to the LD cycle (Figure 1A and 1B), and nocturnal activity represented 74% of the total daily activity (Figure 1B). After 4 weeks, the proportion of nocturnal activity decreased to 52% (Figure 1A and 1B, lower panel). On the first day of recovery (RD1), the acrophase of general activity showed a phase advance of 1 h (p < 0.05); however, on the second day (RD2) and subsequent days, the acrophase was similar to that of the baseline (Figure 1C and 1D).

Shift-work (SW) alters daily locomotor activity and food intake pattern. (A) Representative double-plotted actograms of SW animals. Boxes with diagonal lines represent time in the activity wheel. Black and white bars represent the LD cycle. (B) Percentage of daily locomotor activity during the weekends in the baseline (BL) and fourth week of SW. (C) Days of recording during the fourth week of SW and the recovery week. (D) Acrophases of locomotor activity of SW animals during the recovery week. Dashed lines represent the expected acrophase time with respect to the BL. (E) Total daily locomotor activity counts during recovery time compared with BL. (F) Mean daily food intake during the BL, the fourth week (4W) of SW, and the following recovery days (RD). White bars represent mean food intake during light phase (ZT0 to ZT12) and black bars during the dark phase (ZT12 to ZT24). Data are represented as mean and SEM. * p < 0.001 or # p < 0.05 indicates statistical difference from the baseline.
Activity counts were significantly reduced during the first days of recovery and progressively reached similar activity levels on RD5 (Figure 1E).
Shift-work Affects Feeding Behavior and Recovery on RD6
At baseline in the SW group, 79% of total daily-ingested food was consumed during the active/dark phase (p < 0.05) and the rest during the inactive/light phase (Figure 1F). On the last day of SW, animals had changed their feeding behavior, since they ate 58% of the daily-ingested food during the light phase (Figure 1F and Supplemental Table S1). During the recovery week, SW animals exhibited a progressive shift in feeding behavior and the physiological pattern was restored on RD6 (27% light- vs. 73% dark-phase food intake, p < 0.05, Figure 1F and Supplemental Table S1).
TAG and Glucose Rhythms Were Restored Within One Week
Plasma TAG and glucose concentrations were measured at ZT0, ZT6, ZT12, and ZT18 on RD3, RD5, and RD7 and for the CTRL group on RD7.
On RD3, SW displayed rhythmic levels of TAG but the acrophase presented at ZT7, in phase advance (~9 h, p < 0.05) and with a lower amplitude (~60%, p < 0.05) with respect to the CTRL group (Figure 2A, upper panel; Table 2). On RD5, TAG levels were transiently arrhythmic, with rhythmicity recovered on RD7, when they were in phase with the control rhythms; albeit, with a lower amplitude (~50%, p < 0.05) and an approximately 2 h delay in the acrophase (p < 0.05) (Figure 2A, lower panel; Table 2).
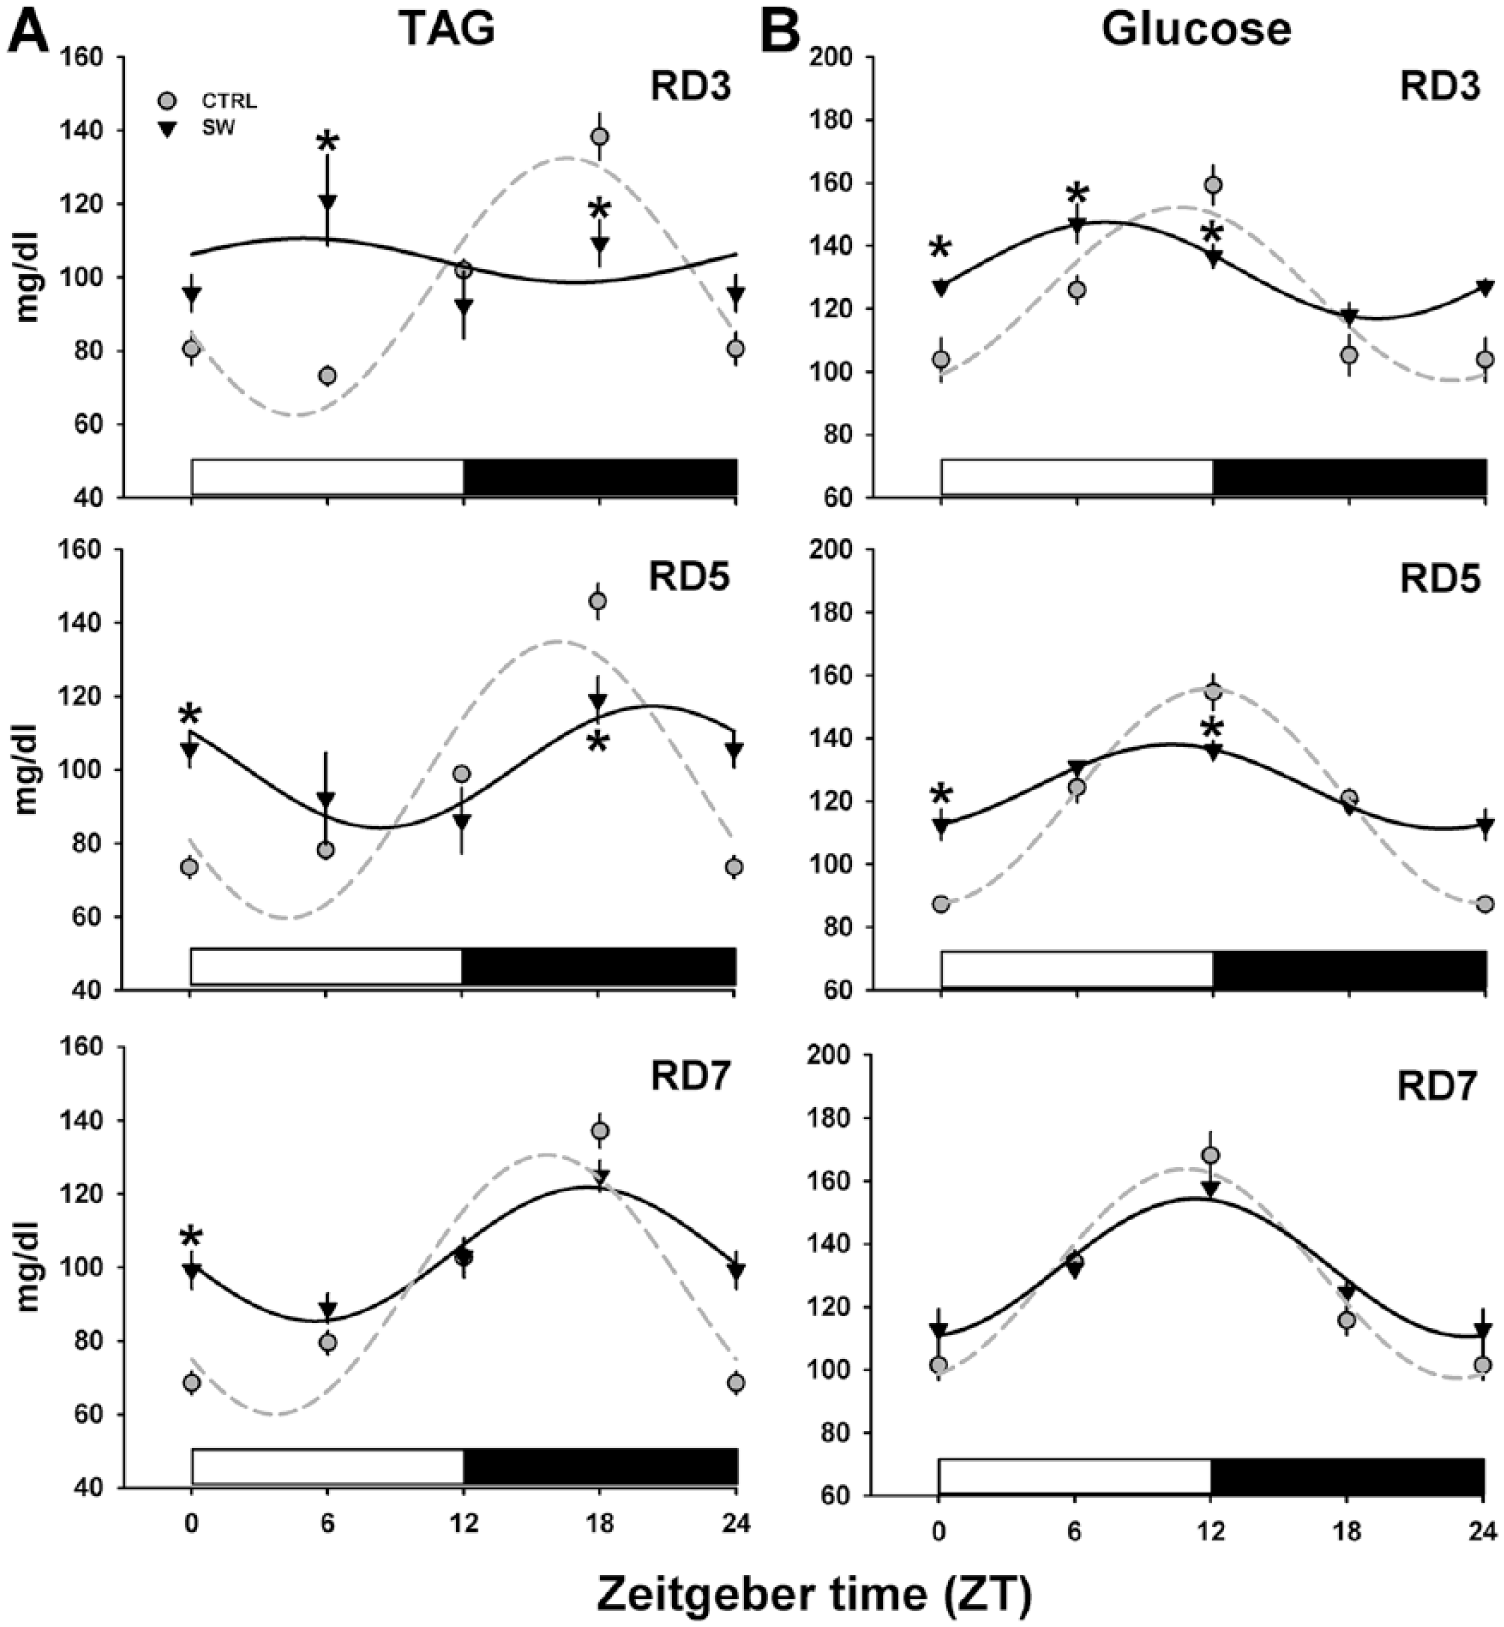
Recovery of plasma triglyceride and glucose daily patterns after shift-work (SW). Serum TAG (A) and glucose (B) fluctuations in rats in the SW group on the third, fifth and seventh day of the recovery week compared with the control (CTRL) animals. Black and white bars represent the LD cycle. Data are represented as mean (SEM). n = 4 per each time point. *p < 0.05 among groups. RD, recovery day; TAG, triglycerides.
Parameters of cosinor analysis (period = 24 h), including the mesor, amplitude, acrophase, and rhythm significance of locomotor activity, and clock- and metabolism-related genes for the entire week of recovery from shift work.

Mesor and amplitude values are expressed as mg/dl in the case of glucose and TAG, and as relative levels in the case of mRNA expression. Data are the mean [SEM]. Acrophase is represented as zeitgeber time (ZT). TAG, triacylglycerides; SW, Shiftwork group; NS, no significance; +p < 0.05 significance against day 3 of SW group; *p < 0.05 significance against the CTRL group.
During recovery, plasma glucose of SW animals remained arrhythmic on days RD3 and RD5; however, on RD7, levels exhibited a rhythmic pattern in phase with the CTRL group (Figure 2B, Table 2).
Hepatic Metabolic Gene Rhythms Were Not Completely Restored during the Recovery Week
In the CTRL group, Pparα, Srebp-1c, and Pepck presented a daily rhythmic mRNA expression, with acrophases at ~ZT14, ~ZT13 and ~ZT11, respectively (Figure 3, Table 2). SW induced a loss of rhythmicity in both Pparα and Pepck daily expression on RD3 and RD5, and recovery occurred on RD7 (p < 0.05) (Figure 3A and 3C; Table 2). Nevertheless, on RD7, Pparα amplitude remained diminished with respect to that in the CTRL rats (p < 0.05) (Table 2). For Srebp-1c, the SW group presented a phase advance of around 7 h (p < 0.05) on RD3 and RD5 (Figure 3B; Table 2), and became arrhythmic on RD7 (Figure 3B, lower panel). This indicates that no recovery was achieved after 7 days.
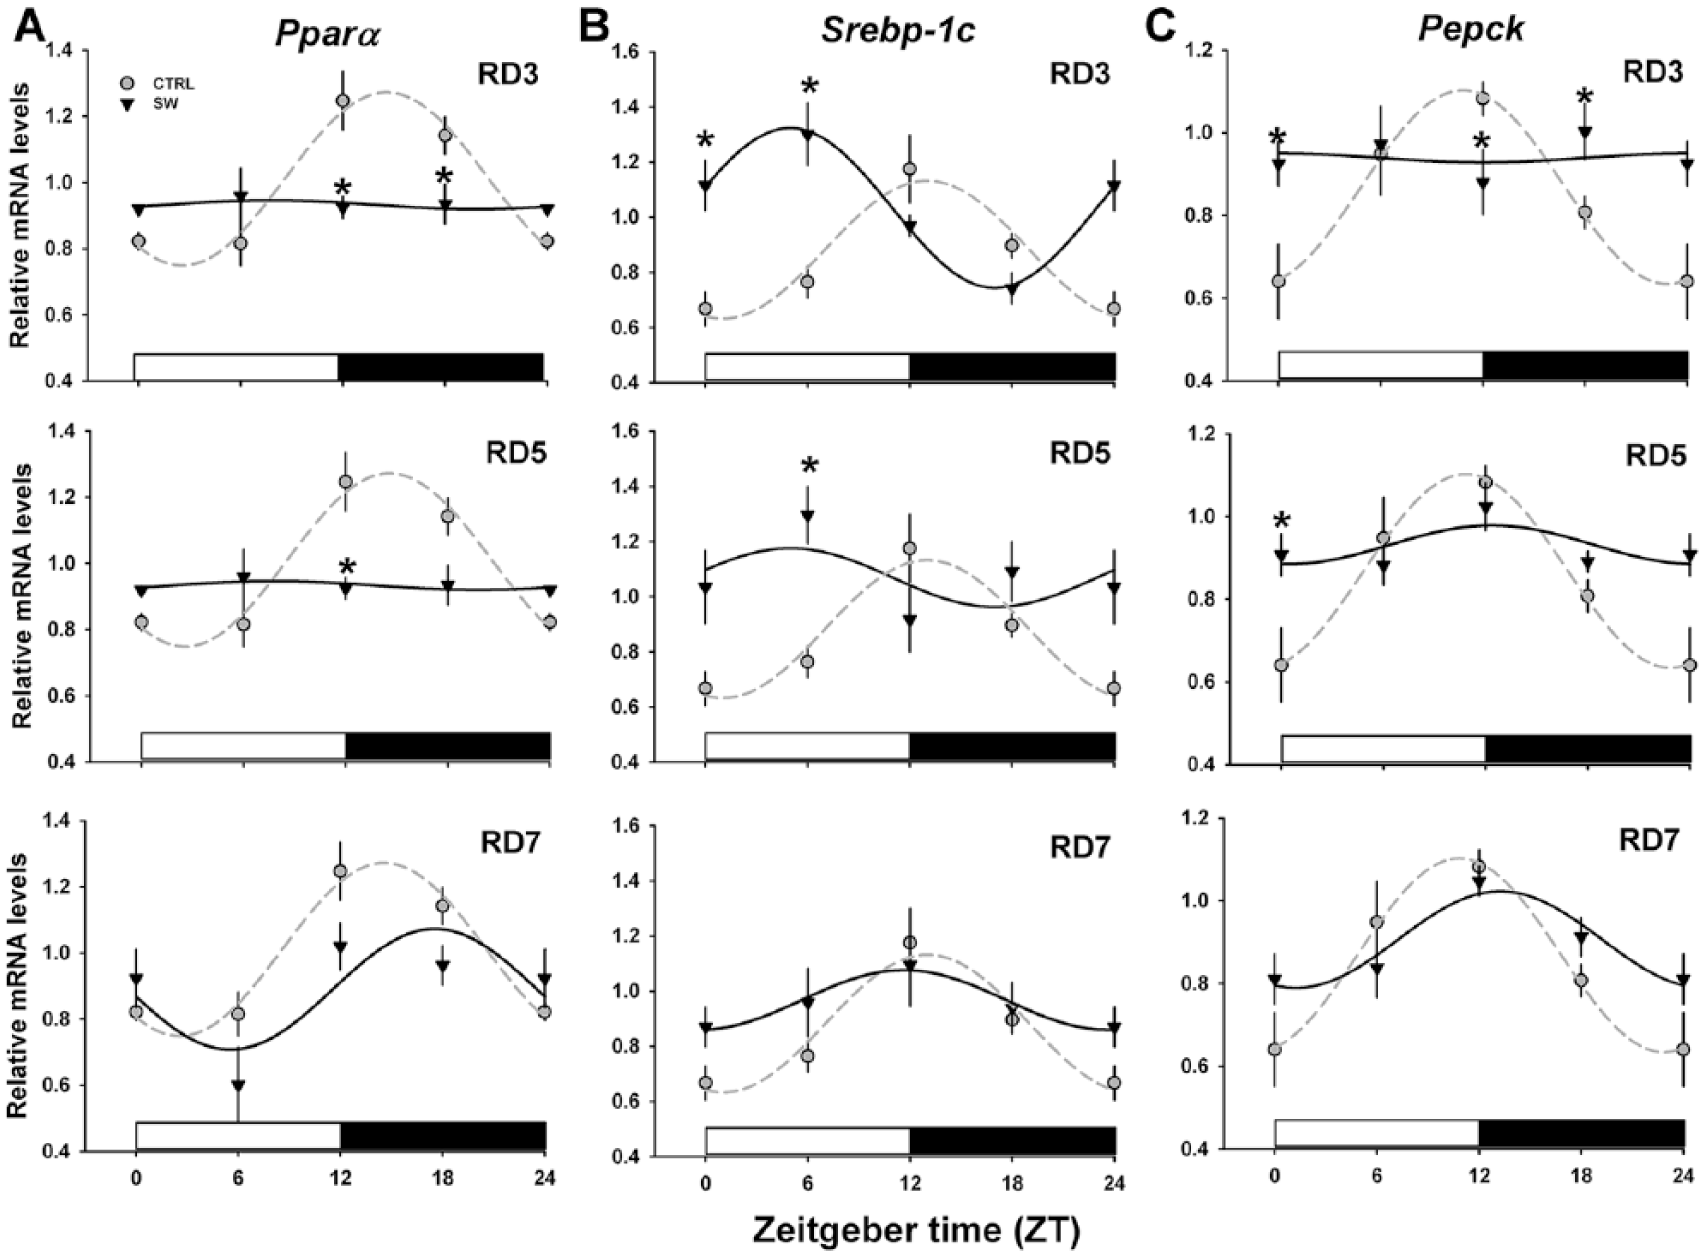
Recovery of metabolism-related gene expression in the liver after shift-work (SW). Lipid metabolism is represented by Pparα and Srebp-1c (A and B), whereas glucose metabolism is represented by Pepck (C) in the control (CTRL) and SW groups during the third, fifth and seventh days of the recovery week. Black and white bars represent the LD cycle. Data at ZT0 are double-plotted as ZT24. The CTRL curves for RD3 and RD5 represent the data from RD7. Data are represented as the mean and SEM. n = 3 per each time point. *p < 0.05 among groups. RD, recovery day.
Hepatic Clock Gene Rhythms Were Not Completely Restored during the Recovery Week
In the liver of CTRL rats, Per2 and Bmal1 mRNA displayed daily rhythmicity, with Per2 peaking during the LD transition and Bmal1 peaking at the dark-light (DL) transition (Figure 4, Table 2). In the SW rats, Per2 persisted arrhythmically for the entire recovery week (Figure 4A). On RD3, Bmal1 expression exhibited rhythmicity, but the acrophase was in antiphase with respect to the CTRL (p < 0.05) (Figure 4B, upper panel; Table 2). On RD5, Bmal1 displayed transient arrhythmicity (Figure 4B, middle panel; Table 2), whereas, on RD7, its expression recovered a rhythm in phase with respect to that CTRL, even though the relative mRNA levels were significantly upregulated (p < 0.05) (Table 2).

Recovery of clock gene expression in the liver after shift-work (SW). RT-PCR analysis of daily Bmal1 (A) and Per2 (B) expression in control (CTRL) and SW groups on the third, fifth, and seventh days of the recovery week. Black and white bars represent the LD cycle. Data at ZT0 are double-plotted as ZT24. The CTRL curves for RD3 and RD5 represent the data from RD7. Data are represented as the mean and SEM. n = 3 per each time point. *p < 0.05 among groups. RD, recovery day.
Discussion
In this study, we used a SW rat model to induce internal desynchrony and to explore the kinetics of resynchronization (recovery) 1) at the behavioral level, by monitoring locomotor activity and food intake; 2) at the metabolic level, by quantifying the daily fluctuation of blood TAG and glucose; and 3) at the molecular level, by determining the temporal patterns of expression of several hepatic metabolic and clock genes. We observed that recovery is faster at the behavioral and metabolic levels than for most of the molecular parameters investigated. During this recovery period, an internal desynchrony persisted among behavior, metabolism and hepatic gene expression.
Locomotor Activity
The SW protocol affected general locomotor activity in 2 ways. First, it shifted the daily acrophase by advancing the peak of activity by 1 h, leading to a desynchronized behavior (Figure 1). Second, it decreased the nocturnal activity counts as compared with the baseline (Figure 1E). Whereas resynchronization of the acrophase took only 2 days, the levels of nocturnal activity recovered within 5 days. According to previous reports, the SW protocol employed in the present experiment represents a model of internal desynchronization, in which the SCN activity and clock machinery oscillate in harmony with the LD cycle (Salgado-Delgado et al., 2010). Thus, the faster recovery of the activity rhythm, as compared with the peripheral oscillators, could indicate that light masks the actual effects of SW over endogenous circadian rhythmicity (Reddy et al., 2002; Yamazaki et al., 2000). Masking could involve retinorecipient centers that have been suggested to modulate the synchronizing effects of light, either in the thalamus or in hypothalamic areas, rather than the SCN (Gooley et al., 2003; Hannibal and Fahrenkrug, 2004). These thalamic and hypothalamic centers can respond directly to the light signals that drive behavior under a weak SCN, as we have previously shown (Salgado-Delgado et al., 2010a).
The delayed return of total locomotor activity to baseline levels might be related to the sleep disturbances induced by SW. As demonstrated by Grønli and colleagues (2017), SW degrades arousal and promotes micro-sleep episodes, thus reducing locomotion.
Metabolic Parameters
As our group already reported, SW abolished the daily rhythm of plasma glucose and shifted the TAG rhythm toward the light phase (Salgado-Delgado et al., 2010b).
It is interesting to note that TAG daily rhythms mirrored feeding behavior. They peaked during the light phase at the beginning of recovery week (RD3); were flattened at RD5 (when the amount of food consumed during the light phase was significantly higher than the baseline, and dark-phase food ingestion had already recovered); and peaked during the dark phase on RD7 (when 73% of the daily food ration was consumed). In this respect, there is evidence that, even in clock-disrupted mice, circadian regulation of lipid metabolism persists if meal access occurs in a shifted restricted time (Adamovich et al., 2014). These data are consistent with our results; daily TAG rhythms perfectly correlated with food intake patterns observed during the recovery week after SW.
An additional contribution to the TAG phase advance might come from the changes observed in Srebp-1c expression. SREBP-1C is a transcription factor that promotes de novo lipogenesis in the liver by regulating the synthesis of several enzymes involved in lipid metabolism (including the fatty acid synthase and glycerol-3-phosphate acyl transferase) (Moon, 2017). We found that Srebp-1c mRNA in the CTRL group exhibited a daily expression profile, with acrophase at around the LD transition. In contrast, SW rats on RD3 displayed a phase advance of about 8 h, peaking approximately 2.5 h before plasma TAG. These results for the CTRL and SW groups on RD3 resemble those presented by Mukherji et al. (2015), who reported a similar pattern of Srebp-1c expression in 2 groups of animals fed ad libitum and fed only in the light phase, respectively. On RD5, the phase advance was reduced by ~1.5 h, whereas rhythm was restored (in both acrophase and amplitude) on RD7. Thus, once again, lipid metabolism appears to be strongly regulated by the daily patterns of food consumption.
The reason for the loss of rhythmicity in glucose daily patterns is unclear. Although plasma glucose rhythmicity is mainly regulated by the SCN (la Fleur et al., 2001), it is unlikely that the arrhythmicity observed in the SW rats during recovery reflects the central clock; we have shown that SW does not affect clock gene rhythmicity in the SCN (Salgado-Delgado et al., 2008). Thus, the breaking point for glucose homeostasis must be explored elsewhere, in the many conflicts triggered by the forced activity, the consequent sleep disturbances, the changes in feeding patterns, and all the circadian misalignments that affect metabolic oscillators downstream of the SCN and worsened by SW (Morris et al., 2015). Here, we found that gluconeogenic hepatic enzyme Pepck mRNA expression—just as plasma glucose levels—was arrhythmic on RD3 and RD5, and restored on RD7. Pepck expression in the liver is regulated by orexin neurons (Tsuneki et al., 2015). We have previously shown that the daily rhythms of orexin neuronal activity in the hypothalamus are flattened by feeding during the subjective rest phase (Ramirez-Plascencia et al., 2017). Thus, glucose deregulation by SW might depend on the influence of the shifted feeding behavior over hepatic glucose production.
Another consequence of SW was the loss of mRNA rhythm in the hepatic catabolic gene Pparα (Salgado-Delgado et al., 2013), which recovered rhythmicity on RD7. Physiologically, Pparα expression induces fatty acid synthesis/utilization and promotes gluconeogenesis from glycerol, and it is critical for the adaptive response to an increased energy requirement (Kersten et al., 1999; Tanaka et al., 2017; Xu et al., 1999). Since there were no significant differences in Pparα expression between CTRL and SW animals during the light phase, it is unlikely that SW represents signals of increased energy demand that would contribute to flatten the Pparα daily rhythm. Instead, it is possible that reduced fatty acid consumption during the dark phase down-regulated Pparα expression, contributing to the flattened daily levels and resulting in lipid accumulation in the liver (Lemberger et al., 1996; Salgado-Delgado et al., 2013). In addition, as corticosterone levels are increased in SW rats, a significant contribution to hepatic steatosis might be due to corticosterone via Pparα inhibition (Marino et al., 2016; Salgado-Delgado et al., 2010b). It has been shown previously that Pparα and clock genes regulate reciprocally in the liver (Chen and Yang, 2014). In particular, Pparα and Bmal1 are involved in a signaling loop in which PPARα promotes Bmal1 expression, and Bmal1 is essential for the daily rhythms of Pparα and Pparα–controlled genes (Canaple et al., 2006; Inoue et al., 2005; Wang et al., 2013). By observing the temporal profile of Pparα and Bmal1 in CTRL animals, it is possible that the Pparα constitutive expression is enhanced by the Bmal1 rise after the lights are off. In turn, PPARα increase might contribute to the Bmal1 peak directly by promoting transcription, and indirectly through its interaction with Per2.
Clock Genes
Most of the published literature reporting the ability of the circadian system to adapt to new time cues (e.g., light phase advance and/or restricted feeding schedules) indicates that there are significant differences among clock genes and tissues (Angeles-Castellanos et al., 2007; Davidson et al., 2009; Kiessling et al., 2010; Stokkan et al., 2001; Wu et al., 2010). In the present work, we did not change the photoperiod or restrict food access, and the changes that we observed at the behavioral and molecular levels were a spontaneous outcome of SW and the following recovery week. Our results show that SW induced a large phase advance of Bmal1 mRNA expression in the liver, which was restored on RD7; although, with a lower amplitude than that of the CTRL. Since hepatic Bmal1 expression is mainly driven by food intake rather than by the SCN (Dang et al., 2016; Sabath et al., 2014), it is likely that the phase advance and resynchronization rate reflect the hepatic adjustments to feeding behavior.
Although Per2 rhythm in the liver is entrained by feeding schedules independent of the SCN (Hara et al., 2001), the conclusion proposed for Bmal1 is not appropriate for Per2. This is because SW flattened the expression of this gene and a week of recovery was not sufficient to restore rhythmicity. Per2 is the most sensitive component of the liver clock to food cues (Wu et al., 2010), and its persistent arrhythmicity, despite recovered feeding behavior, suggests that weakened and/or contradictory behavioral and physiological rhythms induced by SW still provided desynchronizing signals to the periphery. For instance, hepatic Per2 dark-phase expression is suppressed by exogenous glucocorticoid administration in both in vitro and in vivo models (Kayanagi et al., 2006; Wu et al., 2017). Thus, the flattened Per2 rhythm we observed in the experimental animals might be due to the corticosterone peak coincident with access to the wheel after 4 weeks of SW (Salgado-Delgado et al., 2010b).
In conclusion, SW promotes a condition of internal desynchronization that results in either the alteration (TAG, Srebp-1c, Bmal1) or loss (locomotor activity, glucose, Pparα, Pepck, Per2) of daily rhythms (Table 3). The persistence of desynchronization or asynchrony during recovery confirms that the peripheral effectors are uncoupled from the SCN. Although there is evidence that some consequences of SW on biological rhythms and health depend on the years and the type of alternate work schedules (Knutsson, 2003; Knutsson and Kempe, 2014), the present results may be important when translated to human night workers who can rest no more than 2 days per week (which represent up to 20% of shift-workers) (Lee et al., 2007). This means that their metabolic daily patterns would be constantly altered and never readjust to a physiological rhythmicity.
Summary of recovery rate for daily behavioral, metabolic, and gene patterns after shift-work.

Supplemental Material
TABLE_S1 – Supplemental material for Differential Recovery Speed of Activity and Metabolic Rhythms in Rats After an Experimental Protocol of Shift-Work
Supplemental material, TABLE_S1 for Differential Recovery Speed of Activity and Metabolic Rhythms in Rats After an Experimental Protocol of Shift-Work by Nadia Saderi, Adrián Báez-Ruiz, Lucia E. Azuara-Álvarez, Carolina Escobar and Roberto C. Salgado-Delgado in Journal of Biological Rhythms
Footnotes
Acknowledgements
This study was supported by Consejo Nacional de Ciencia y Tecnología (CONACyT), Mexico (grant number: 183078 to R.S.D., 243298 to N.S); UASLP-CA-254 and FAI 2017 to RSD.
Author Contributions
NS, CE, and ABR analyzed data and wrote the manuscript. RSD and CE conceived the project. RSD and NS designed and conducted the experiments. RSD is the guarantor of this work and, as such, had full access to all the data in the study and takes responsibility for the integrity of the data and the accuracy of the data analysis.
Conflict of Interest Statement
The author(s) have no potential conflicts of interest with respect to the research, authorship, and/or publication of this article.
Notes
References
Supplementary Material
Please find the following supplemental material available below.
For Open Access articles published under a Creative Commons License, all supplemental material carries the same license as the article it is associated with.
For non-Open Access articles published, all supplemental material carries a non-exclusive license, and permission requests for re-use of supplemental material or any part of supplemental material shall be sent directly to the copyright owner as specified in the copyright notice associated with the article.
