




Abstract
There is large interindividual variability in circadian timing, which is underestimated by mathematical models of the circadian clock. Interindividual differences in timing have traditionally been modeled by changing the intrinsic circadian period, but recent findings reveal an additional potential source of variability: large interindividual differences in light sensitivity. Using an established model of the human circadian clock with real-world light recordings, we investigated whether changes in light sensitivity parameters or intrinsic circadian period could capture variability in circadian timing between and within individuals. Healthy participants (n = 12, aged 18-26 years) underwent continuous light monitoring for 3 weeks (Actiwatch Spectrum). Salivary dim-light melatonin onset (DLMO) was measured each week. Using the recorded light patterns, a sensitivity analysis for predicted DLMO times was performed, varying 3 model parameters within physiological ranges: (1) a parameter determining the steepness of the dose-response curve to light (p), (2) a parameter determining the shape of the phase-response curve to light (K), and (3) the intrinsic circadian period (tau). These parameters were then fitted to obtain optimal predictions of the three DLMO times for each individual. The sensitivity analysis showed that the range of variation in the average predicted DLMO times across participants was 0.65 h for p, 4.28 h for K, and 3.26 h for tau. The default model predicted the DLMO times with a mean absolute error of 1.02 h, whereas fitting all 3 parameters reduced the mean absolute error to 0.28 h. Fitting the parameters independently, we found mean absolute errors of 0.83 h for p, 0.53 h for K, and 0.42 h for tau. Fitting p and K together reduced the mean absolute error to 0.44 h. Light sensitivity parameters captured similar variability in phase compared with intrinsic circadian period, indicating they are viable targets for individualizing circadian phase predictions. Future prospective work is needed that uses measures of light sensitivity to validate this approach.
Keywords
Knowledge of circadian timing is critical for the accurate diagnosis and treatment of circadian disorders, and the timing of countermeasures or chronotherapy. Substantial interindividual variability in circadian timing has been reported, spanning 5 h even under controlled laboratory conditions where individuals have the same patterns of light exposure (Wright et al., 2005). Mathematical models of the human circadian system have been developed for predicting circadian phase (Asgari-Targhi and Klerman, 2019). The most widely used model consists of a limit-cycle oscillator combined with a simple model of retinal light processing. Although this model has been carefully validated and shown to perform accurately at the group-average level under a range of laboratory (Forger et al., 1999; Jewett et al., 1999; St Hilaire et al., 2007) and field conditions (Phillips et al., 2017; Woelders et al., 2017; Stone et al., 2019a), the model accounts for only a small fraction of the observed interindividual variability in circadian phase. New approaches are therefore needed to improve individual-level phase predictions.
Interindividual differences in circadian phase may arise due to physiological differences in properties of the circadian system (Winfree, 2001), such as intrinsic circadian period (tau) or responsivity to light. Multiple studies have demonstrated interindividual variability in tau (Sack et al., 1992; Duffy et al., 2011), which has been related to chronotype and entrained phase (Duffy et al., 2001; Duffy and Czeisler, 2002). Variations in tau have been previously modeled as a putative mechanism for interindividual differences in sleep and circadian timing (Phillips et al., 2010; Skeldon et al., 2017; Swaminathan et al., 2017; Woelders et al., 2017). In addition, interindividual variation in sensitivity to light has been reported across a range of populations (Brainard et al., 1988; Laakso et al., 1991; Higuchi et al., 2008; Gooley et al., 2011; McGlashan et al., 2018c; Watson et al., 2018; Phillips et al., 2019). Theoretically, variations in the shape of the phase-response curve (PRC) or dose-response curve to light could be important contributors to circadian timing. These factors have not been explored in models to date and may therefore represent a major source of unexplained variance.
In this study, we investigated whether adjusting parameters related to light sensitivity could improve individual-level predictions of circadian phase at a level comparable with intrinsic circadian period. We used real-world light data from participants monitored over 3 weeks, with weekly circadian phase assessments, allowing us to assess both within- and between-individual variations in circadian timing.
Methods
Protocol
Data were collected from 12 healthy participants (20.6 ± 2.7 years, range 18-26 years; 7 women) in a repeated-measures design. Participants were screened for medical, psychiatric, and sleep disorders. Exclusion criteria were age <18 or >30 years, body mass index <18 or >30 kg/m2, history of a medical condition or medication use that may affect sleep or circadian rhythms, diagnosed sleep disorder or mental illness, immediate family history of bipolar disorder or psychosis, an atypical menstrual cycle (<21 or >36 days, or irregular), hormonal disorders or current pregnancy, regular shift work or recent overseas travel, average sleep time <7 or >9 h, general anesthetic within the past 3 months, current cigarette smoking, or regular recreational drug use or recreational drug use within 4 weeks of the study.
All participants provided written informed consent prior to study enrollment. All study procedures were approved by the Monash University Human Research Ethics Committee, and the study was conducted in compliance with standards set by the latest revision of the Declaration of Helsinki.
Participants completed 3 consecutive weeks of at-home monitoring on an unrestricted sleep-wake schedule (i.e., on a sleep schedule that was typical for them). Participants abstained from medications, caffeine, and alcohol throughout the 3 weeks, with sleep monitored via wrist actigraphy and sleep diaries. Light and activity were monitored continuously using an Actiwatch Spectrum Plus (Philips Respironics, Bend, OR), worn on the nondominant wrist. Participants were asked to wear the Actiwatch at all times throughout the study and to ensure the sensor remained uncovered by sleeves during waking hours.
At the end of each week, participants attended the laboratory for a circadian phase assessment (3 times per participant). On arrival, participants completed a breathalyzer test and provided a urine sample for toxicology and pregnancy testing. At this stage, participants were excluded if their toxicology screen returned a positive result, were pregnant, or had failed to maintain a typical sleep schedule (defined as variations of more than 4 h from their normal sleep/wake times). Circadian phase was measured via dim-light melatonin onset (DLMO) assessments. Participants sat in a dimly lit room (<1 lux) and provided 7 hourly saliva samples, beginning 5 h prior to their average bedtime from the preceding week, until 1 h after their average bedtime. Participants were in lighting of <1 lux for at least 30 min prior to the first saliva sample to avoid melatonin suppression effects of light. Light levels were assessed (lux meter, Tektronix J17 Luma Color, Tektronix, Beaverton, OR) prior to the in-lab session and every 2 h thereafter at the participant’s level of gaze to ensure light levels did not rise above 1 lux in the line of vision. Twenty minutes before each sample, participants refrained from consuming any food or drink. Samples were collected via the passive drool method and subsequently stored at −80 °C. Saliva samples were assayed in duplicate at the Adelaide Research Assay Facility via radioimmunoassay with the G280 antibody and [1251]2-iodomelatonin radioligand (BÜHLMANN Direct Saliva Melatonin RIA, Schönenbuch, Switzerland). DLMO was determined as the time melatonin concentration surpassed a threshold of 4 pg/mL (Nagtegaal et al., 1998), using linear interpolation between samples.
Mathematical Model
A dynamic model of the human circadian timing system and its response to light was used to predict DLMO timing (St Hilaire et al., 2007). The model has 2 key components: a model of retinal processing of light (Process L), and a limit-cycle oscillator model of the central circadian clock and its response to light (Process P). Model parameters have been tested and refined based on experimental data (Kronauer, 1990; Forger et al., 1999; Jewett et al., 1999) to account for phase and amplitude responses to differing light intensity and timing. Default model parameter values were reported by St Hilaire et al. (2007). Here, 3 model parameters were varied to investigate their effects on individual-level DLMO predictions. Parameter p determines the steepness of the dose-response curve to light, K determines the bias of the light PRC toward either advance or delay phase shifts, and tau sets the intrinsic circadian period (Fig. 1).
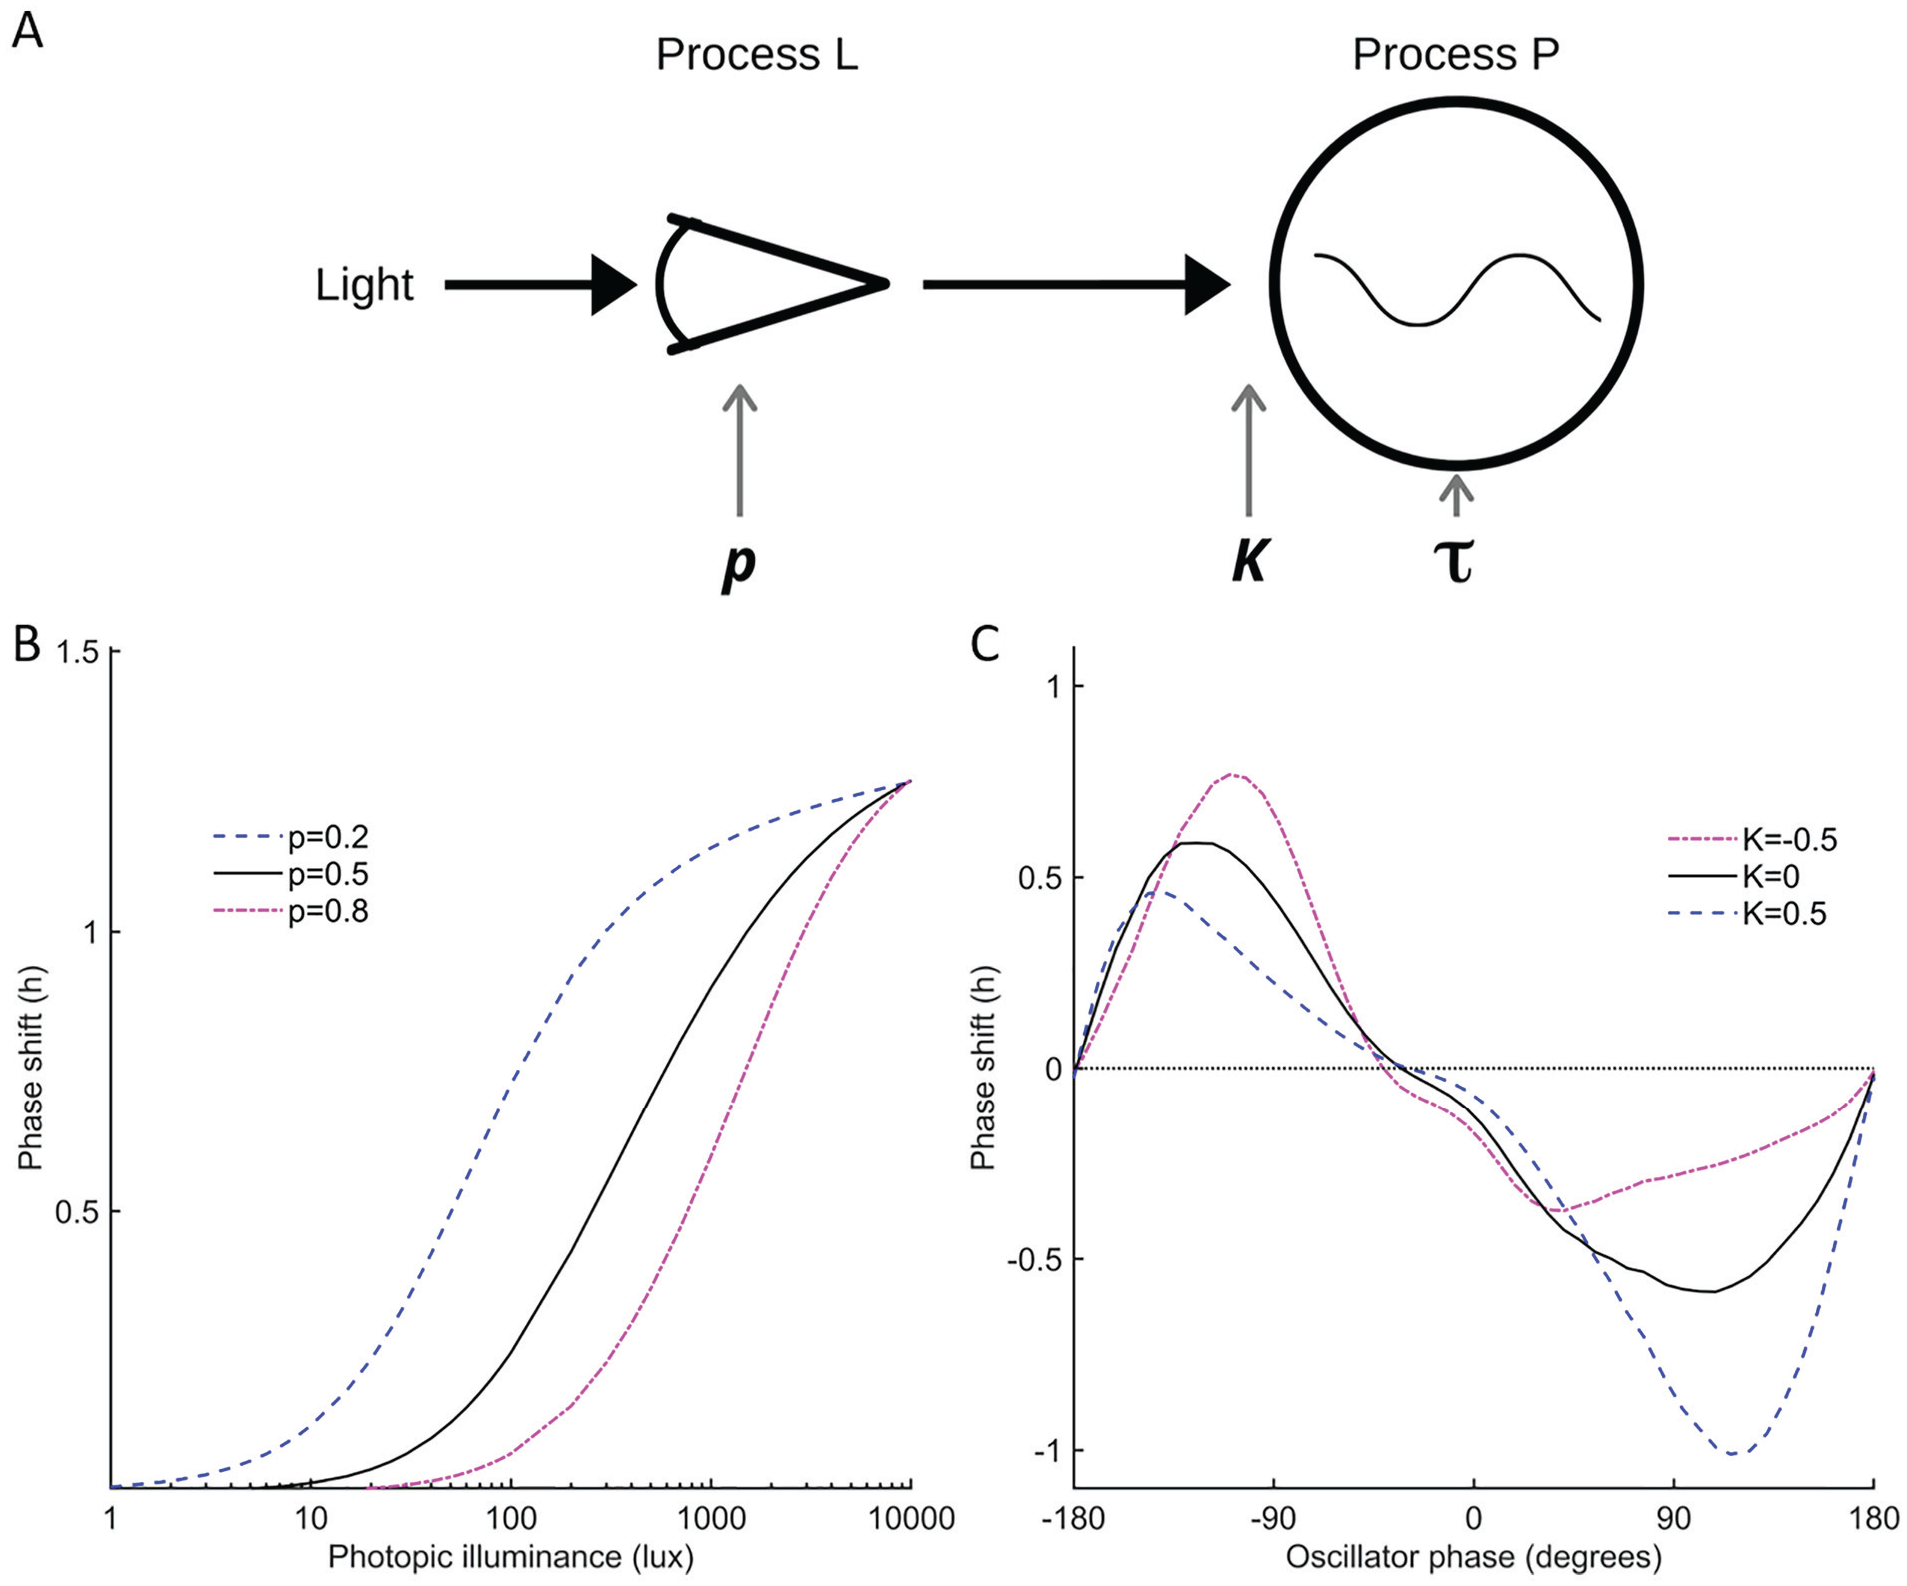
Schematic of the circadian model and the effects of modulating two light sensitivity parameters. (A) Schematic of the model of the human circadian pacemaker and its response to light (St Hilaire et al., 2007). Light is input into Process L, which models the retinal response to light. Process P simulates the central circadian clock as a limit-cycle oscillator, with phase and amplitude modifiable depending on the timing (controlled by K) and intensity (controlled by p) of light exposure and the intrinsic circadian period (tau). (B) The effect of varying p on the dose-response curve to light. (C) The effect of varying K on the phase-response curve to light. Color version of the figure is available online.
Initial values for x and xc are needed at the start time of each simulation. For all implementations, we initialized the model using 2100 h as an estimated initial DLMO time at the beginning of the first week (choosing the point on the limit cycle corresponding to this phase). To ensure continuity in the case of any missing data between weeks, the predicted DLMO time at the end of each week was used as the initial condition for simulation of the following week. Alternate initialization methods could be considered for use in applied settings, where regularly reinitializing may be impractical. The model outputs predicted the timing of the core body temperature minimum (CBTmin). Predicted DLMO was obtained by subtracting 7 h from predicted CBTmin, consistent with prior applications of the model (Woelders et al., 2017) and reported experimental phase relationships between CBTmin and salivary DLMO (Benloucif et al., 2005).
Light and sleep-wake timing measured via actigraphy were inputs to the model, in 1-min epochs. Light values <2 lux during wakefulness were treated as missing. For gaps of up to 2 h, the light value was set to the average value for the preceding 2 h. Longer gaps than this were not permitted, and in cases of gaps >2 h, the longest unbroken time series was used as input to the model. Prior to processing, 97.3% ± 2.6% of light data were available, and on average 5.83 ± 1.56 days of data for each week were inputted into the model. The predicted phase on the last day of complete data each week was used as the predicted DLMO time. The in-laboratory DLMO assessments necessarily resulted in alterations in light exposure patterns, which are included via inputs to the model.
Sensitivity Analysis
Using the circadian model and the recorded light patterns, we conducted a sensitivity analysis to determine the impact of varying 3 model parameters on predicted DLMO times. Parameters were systematically varied within physiologically reasonable ranges. For the parameter p, we used a range of 0.0001 to 1 (default value = 0.5), representing a range of 19 to 1645 lux for the half-maximum phase delay relative to the delay caused by 10,000 lux, where lower values lead to higher sensitivity to low light levels (see Fig. 1A). The parameter K was set to range from −1 to 1 (default value = 0.4) to maintain the characteristic mammalian PRC waveform (one phase-delay and one phase-advance region per circadian cycle), in which negative values bias the PRC toward phase advances, zero represents a balanced PRC, and positive values bias the PRC toward phase delays (see Fig. 1B). The parameter tau was set to range from 23.5 to 24.7 h, which is representative of the observed range of intrinsic circadian period as measured in laboratory forced desynchrony protocols (Duffy et al., 2011). The range in the predicted DLMO time was calculated to quantify the sensitivity of the model to variations in each parameter, both within individuals and between individuals.
To further investigate the dependence of the model dynamics on the parameter p, simulations were performed using p = 0.01 and p = 1 for two distinct light patterns: (1) dimmer light (50 lux) from 0800 h to 1600 h and brighter light (500 lux) from 1600h to 0000 h; and (2) brighter light (500 lux) from 0800 h to 1600 h and dimmer light (50 lux) from 1600 h to 0000 h. In each case, the model was run for 28 days to ensure stable entrainment, with outputs from the final day presented.
Parameter Optimization
Model parameters were fitted using least-squares estimation to obtain optimal predictions across the 3 DLMO measurements for each individual. Fitting was performed for each parameter independently and in combination with other parameters (see Table 1 for a full list of implementations). Model predictions using the optimized parameters (i.e., model fits with the lowest sum of squared residuals across weeks) were compared with salivary DLMO times to obtain goodness-of-fit metrics (described below).
Model prediction error using default compared with optimized parameters.
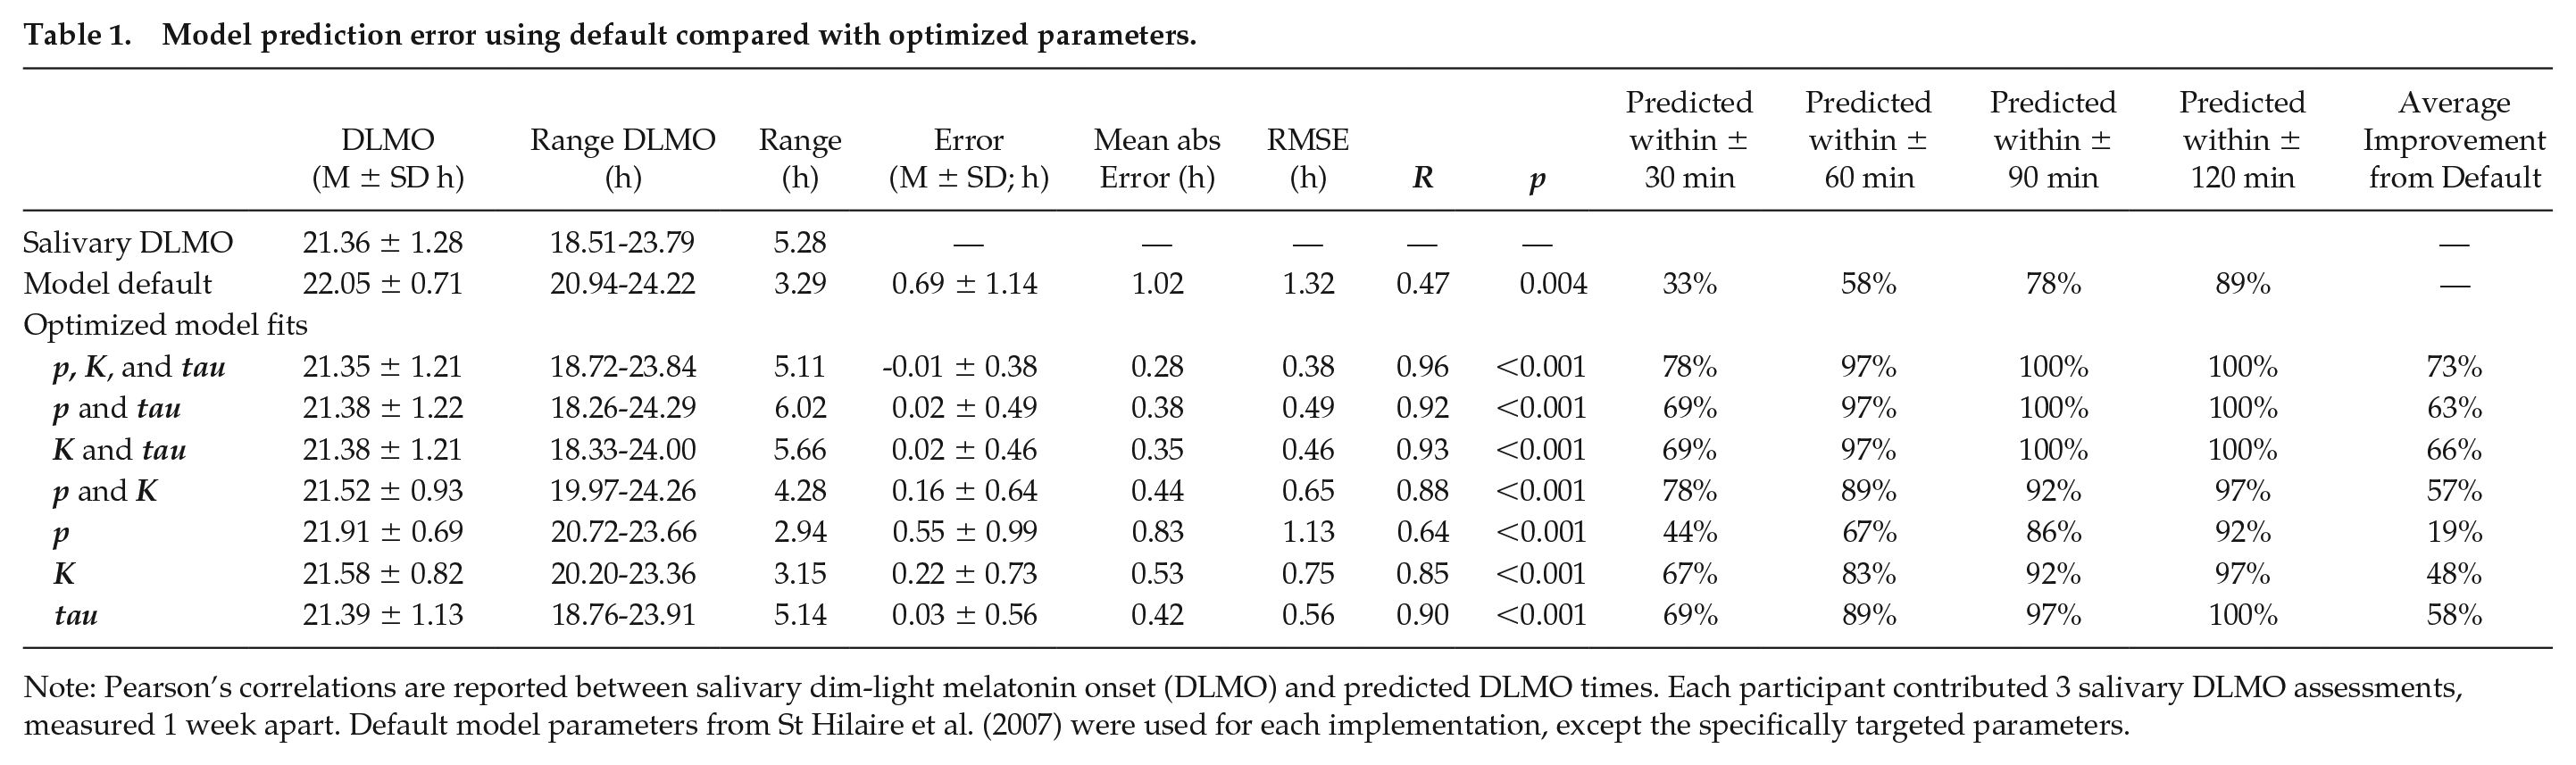
Note: Pearson’s correlations are reported between salivary dim-light melatonin onset (DLMO) and predicted DLMO times. Each participant contributed 3 salivary DLMO assessments, measured 1 week apart. Default model parameters from St Hilaire et al. (2007) were used for each implementation, except the specifically targeted parameters.
Data Analysis
Prediction error was calculated as the difference between model-predicted DLMO and salivary DLMO. The mean and standard deviation of the error, absolute mean error, and root mean square error were calculated for each of the optimized model fits. The percentage of predictions within ±30, ±60, ±90, and ±120 min of salivary DLMO were calculated to show the individual-level performance of each implementation. The percentage improvement in absolute mean error relative to using default model parameters was calculated for each implementation. Pearson correlations were used to test the relationship between predicted and measured DLMO times for each implementation. Intraindividual variation in DLMO times across the 3-week protocol was calculated using two methods: (1) the standard deviation of DLMO times across the 3 weeks and (2) the change in phase from week 1 to week 3. To examine whether prediction accuracy was related to intraindividual variability in circadian phase, Pearson correlations were used to test the relationship between each measure of intraindividual variation in DLMO and the mean prediction error from each model implementation. To test for an effect of protocol week, one-way analyses of variance (ANOVAs) were conducted to compare mean absolute error between weeks.
Results
DLMO Predictions are Sensitive to Both Light Sensitivity and Intrinsic Circadian Period
Sensitivity analysis showed that the median predicted DLMO time varied by 0.52 h when varying p from 0.0001 to 1, by 4.10 h when varying K from −1 to 1, and by 3.96 h when varying tau from 23.5 to 24.7 h (Fig. 2). At the individual level, the average absolute change in predicted DLMO across the parameter range within individuals was 0.95 h when varying p, 4.21 h varying K, and 4.15 h varying tau. This indicates that changing parameters that modulate light sensitivity in the model produces meaningful changes in predicted DLMO times, with changes in K producing a similar range in predicted DLMO times to tau.

Sensitivity analysis for the model parameters p, K, and tau. (A) Mean predicted dim-light melatonin onset (DLMO) time for each individual when varying p from 0.01 to 1. (B) Mean predicted DLMO time for each individual when varying K from −1 to 1. (C) Mean predicted DLMO time for each individual when varying tau from 23.5 to 24.7 h. Each data point represents the average of 3 weekly predicted DLMO times for each participant. Each participant is represented by a different color/shade. Box plots show the median and interquartile ranges for each parameter value across participants. Range reported on each panel is the time between the earliest and latest median predicted DLMO times across the parameter range explored.
The parameter p produced smaller changes in predicted DLMO times than the other 2 parameters, but notably changed DLMO times in different directions for different participants. Larger values for p resulted in earlier predicted DLMOs in some participants but later predicted DLMOs or a non-monotonic pattern in other participants, depending on their particular light exposure pattern. In this respect, p differed from K or tau, which had uniform directional effects on circadian timing across participants: larger values of K or tau resulted in later predicted DLMO times for all participants.
To understand these dynamics, we investigated the effects of changing the parameter p for simulated, illustrative examples. In Figure 3, we show the model outputs for two simulated light inputs: (1) higher morning light and (2) higher evening light. For each light input, we generated model outputs using either a low value of p (higher sensitivity to light) or a high value of p (lower sensitivity to light). With higher sensitivity to light, the model responds to both the dimmer and brighter light levels, whereas with lower sensitivity to light, the model appreciably responds only to the brighter light level. As a result, lower light sensitivity results in a predicted later phase of entrainment when evening light levels are high, but an earlier predicted phase of entrainment when morning light levels are high. These simulations demonstrate an interaction between p and the pattern of light exposure, explaining the non-monotonic dependence of predicted DLMO times on p.
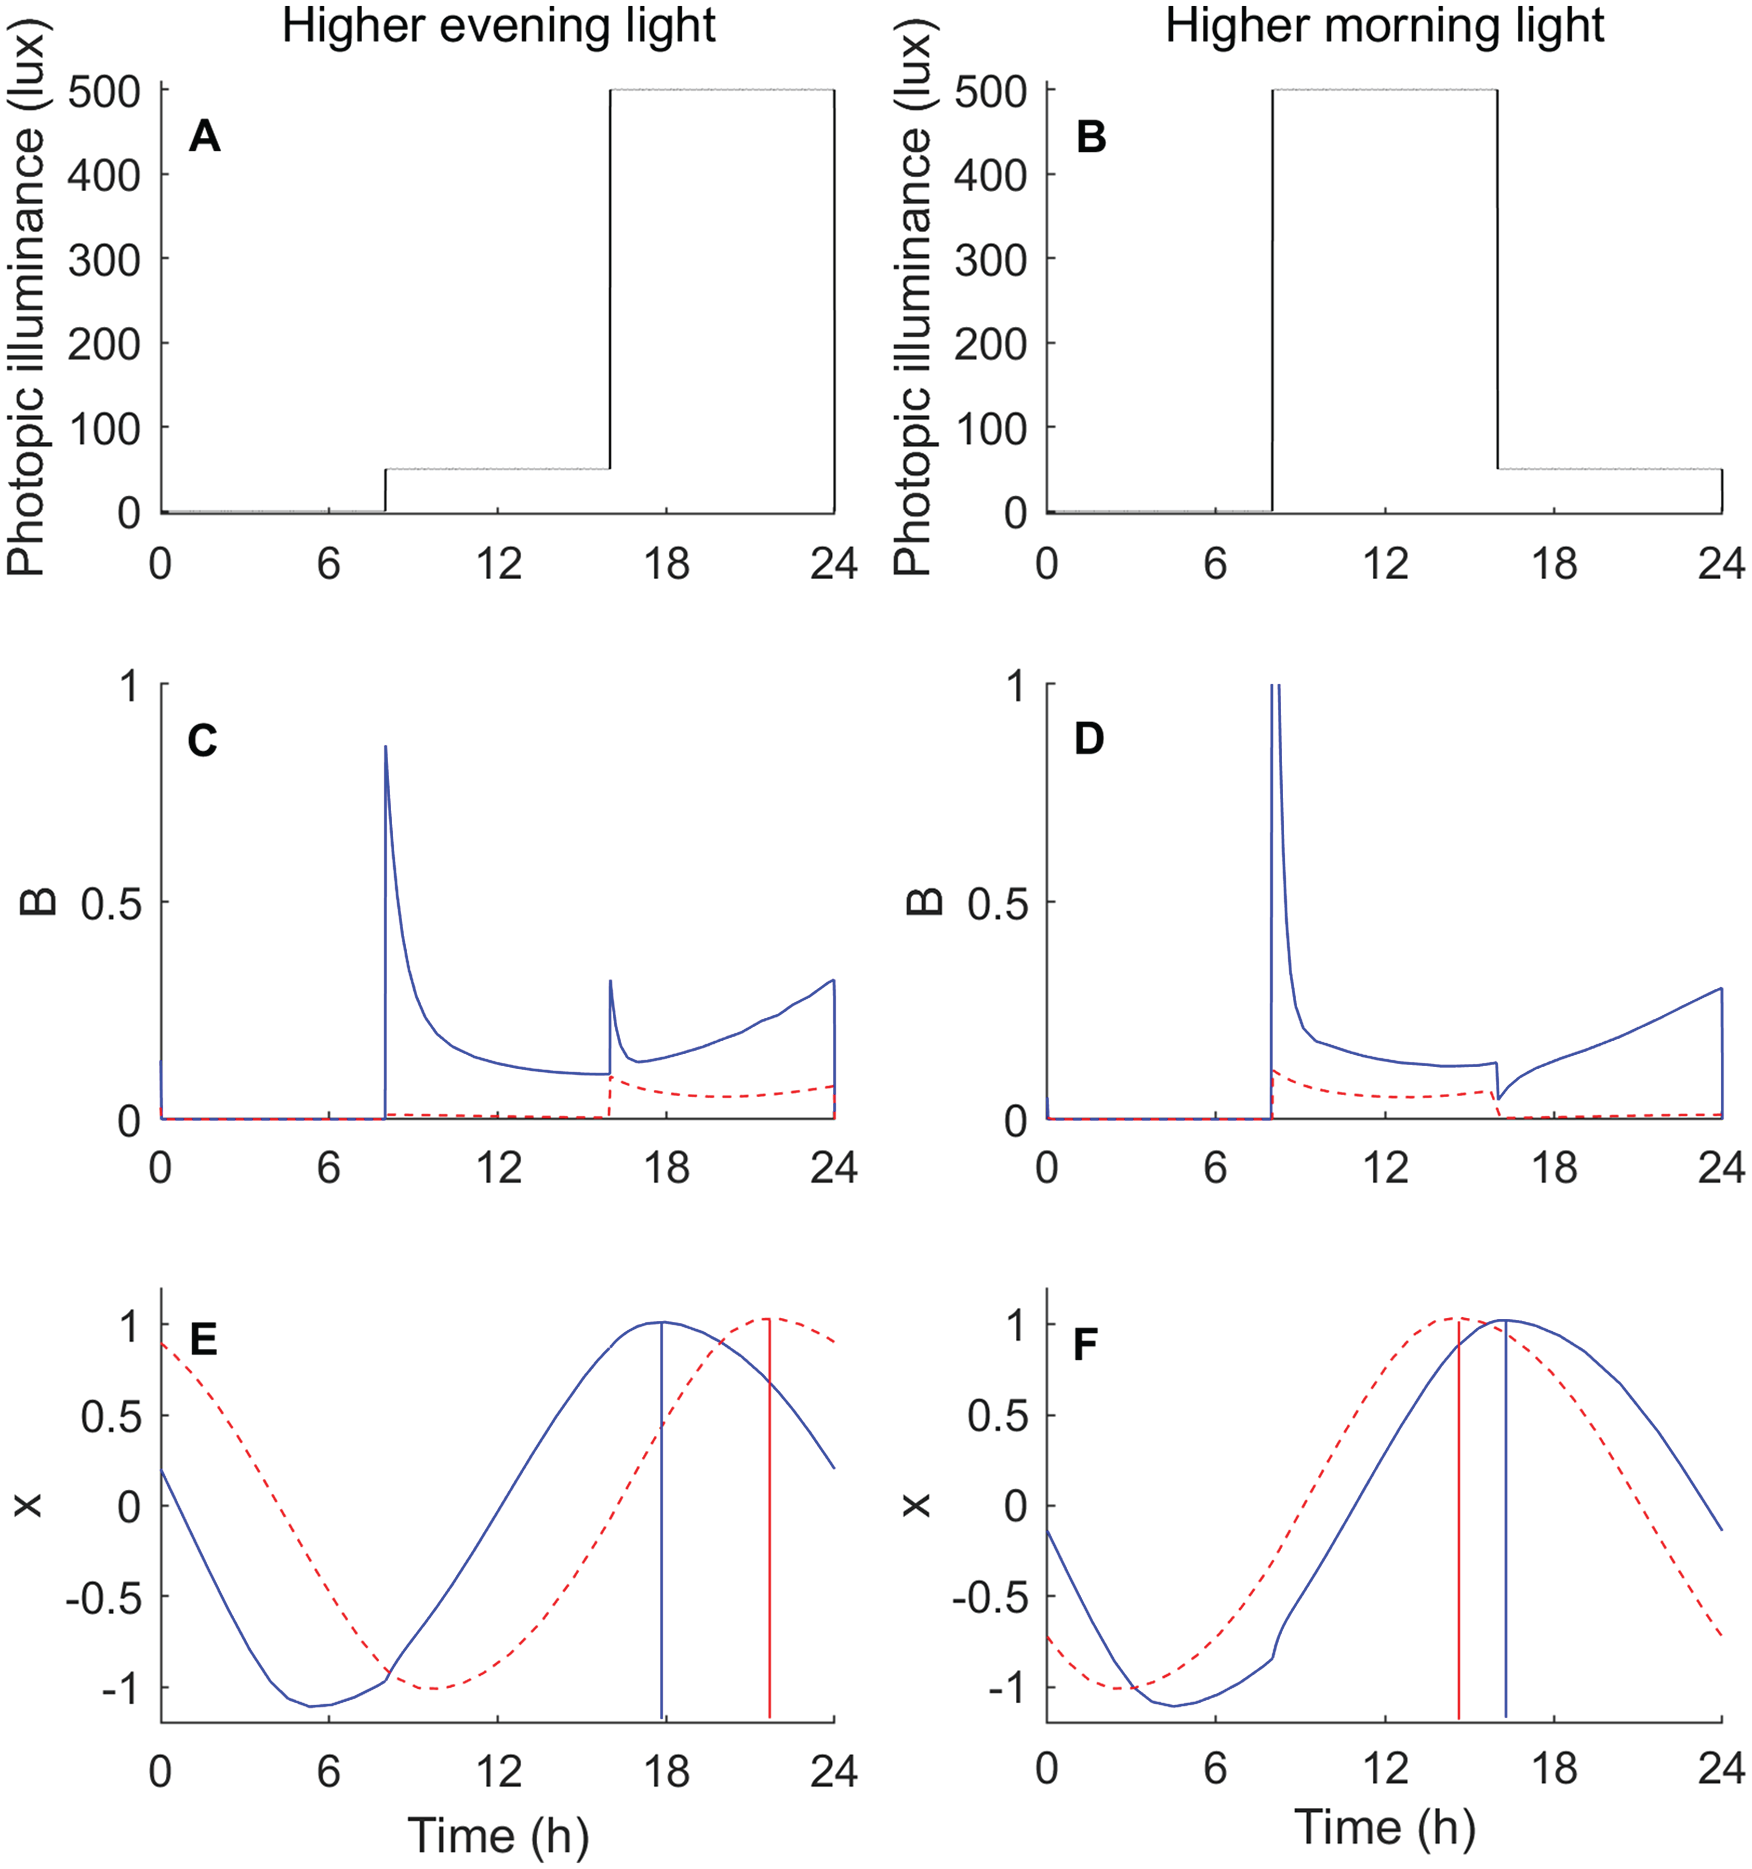
Model simulations for higher evening light (left column, panel A) versus higher morning light (right column, panel B). The photic drive (B) generated by the light is shown in panels C and D, with the solid blue curves corresponding to high light sensitivity (p = 0.01) and the dashed red curves corresponding to low light sensitivity (p = 1). The model’s rhythmic pacemaker variable x is shown in panels E and F, with vertical lines indicating the timing of the peak of the blue curve (high light sensitivity) and the peak of the red curve (low light sensitivity). Color version of the figure is available online.
Improved Individual-level Predictions Using Optimized Parameters
The default model predicted DLMO timing to occur on average at a decimal clock time of 22.05 ± 0.71 h, which was 0.69 ± 1.14 h later than the average salivary DLMO time (21.36 ± 1.28 h). There was a significant moderate positive relationship between salivary DLMO and predicted DLMO time (r2 = 0.22, p = 0.004; Fig. 4A). When optimizing the parameters p, K, and tau, model accuracy improved by 73% (average predicted DLMO 21.35 ± 1.21, mean error −0.01 ± 0.38 h, mean absolute error 0.28 h) and resulted in a strong positive relationship between individual salivary and predicted DLMO times (r2 = 0.91, p < 0.0001; Fig. 4B). When optimizing the two light sensitivity parameters p and K together, the model accuracy improved by 57% (mean absolute error 0.44 h). This was similar to model performance when optimizing either p or K combined with tau, which resulted in 63% and 66% improvement, respectively (see Table 1).

Relationship between salivary dim-light melatonin onset and model predictions (n = 36), using a model of the circadian clock and its response to light. Model predictions generated using (A) default parameters; (B) optimized p, K, and tau; (C) optimized K and tau; (D) optimized p and tau; (E) optimized p and K; (F) optimized tau only; (G) optimized p only; and (H) optimized K only. Each color/shade represents 1 participant, with colors kept consistent with Figure 2.
The largest improvement from fitting an individual parameter (i.e., optimizing one parameter with others set to default values) was observed with tau, which resulted in a 58% improvement relative to default (mean absolute error 0.42 h, r2 = 0.81, p < 0.001, Fig. 3E), followed by K with 48% improvement (mean absolute error 0.53 h, r2 = 0.72, p < 0.001, Fig. 3D) and then p with 19% improvement (mean absolute error 0.83 h, r2 = 0.41, p < 0.001, Fig. 3C).
The distribution of optimized parameters for each implementation is presented in Supplemental Figure S2. In general, there was no significant effect of week on mean prediction error (ANOVAs were p > 0.05 for all implementations, except when varying tau alone, p = 0.047), indicating minimal impact on prediction accuracy due to initializing on the limit cycle.
Within individuals, salivary DLMO time across the 3-week protocol had a mean standard deviation of 0.49 ± 0.30 h (range 0.17-1.02 h) and mean absolute phase shift of 0.68 ± 0.57 h (range 0.07-1.80 h). Greater intraindividual variability in DLMO was associated with larger prediction errors for implementations that fitted tau, but not implementations that used the default tau value (i.e., default model, model optimizing p and K together or independently; Suppl. Table S1).
Discussion
Models of the circadian clock have limited accuracy for predicting circadian timing at the individual level. Prior studies have focused on the intrinsic circadian period as a parameter that could account for interindividual differences in circadian timing (Granada et al., 2013; Skeldon et al., 2017; Swaminathan et al., 2017; Woelders et al., 2017). We found that light sensitivity parameters and the intrinsic circadian period can capture similar variability in circadian timing. These findings suggest that fitting light sensitivity parameters may be a practical way to improve individual-level predictions of circadian phase.
We found that modifying the shape of the light PRC had a large systematic effect on predicted phase. For each individual, modifying the parameter K to bias the PRC toward either phase advance or delay resulted in a corresponding systematic advance or delay in predicted DLMO times, respectively. Fitting K for each individual significantly improved individual-level phase predictions (r = 0.85 with measured DLMO), comparable to fitting tau (r = 0.90 with measured DLMO). The parameter K modifies the shape of the PRC by increasing the amplitude of either the phase-delay or phase-advance region while decreasing amplitude of the other region. This means that increasing the sensitivity to one region in the model reduces sensitivity to the other. It remains unknown, however, whether this relationship between the advance/delay regions is representative of human physiology.
Recent findings indicate that there are significant interindividual differences in the dose-response curve for suppression of melatonin by light (Phillips et al., 2019). Although it is not yet known whether these interindividual differences translate to phase shifting, this is a plausible mechanism for interindividual differences in circadian timing. We found that varying the shape of the dose-response curve for phase shifting using the parameter p did not account for as much interindividual variation in circadian timing as did varying the shape of the PRC. This finding is consistent with the observation that an individual’s DLMO time does not correlate with the light level required for 50% suppression of melatonin (Phillips et al., 2019). Notably, however, we found that increasing the sensitivity of the dose-response curve could result in either earlier or later DLMO predictions, depending on the timing and intensity of an individual’s light exposure patterns. A more sensitive dose-response curve would result in greater phase shifting by exposure to low light levels, including indoor lighting. The specific timing of exposure would then determine whether this increased sensitivity results in a net phase advance or phase delay. Consequently, a change in the parameter p can result in shifting some DLMO predictions earlier and other DLMO predictions later, within the same individual. This is unlike the parameter K, changes to which systematically shift all DLMO predictions in the same direction within the same individual. These differing parameter dependencies explain why fitting p and K together results in a substantial improvement in accuracy compared with fitting either light sensitivity parameter alone.
Modeling interindividual differences in light sensitivity could help to translate phase prediction to clinical populations. Although large interindividual differences in light sensitivity have been observed in healthy controls, substantial differences have also been observed in various clinical populations. Patients with bipolar disorder (Lewy et al., 1985; Hallam et al., 2009) and individuals with preclinical bipolar disorder–related traits (Bullock et al., 2019) have been shown to exhibit increased light sensitivity, as have patients with delayed sleep-wake phase disorder (Aoki et al., 2001; Watson et al., 2018). Conversely, patients with unipolar depression and seasonal affective disorder show decreased light sensitivity (Roecklein et al., 2013; McGlashan et al., 2019). Either of these phenotypes could lead to the development of abnormal phase relationships, contributing to sleep and mood disturbance. Furthermore, antidepressant (McGlashan et al., 2018c) and mood stabilizer medications (Hallam et al., 2005a; Hallam et al., 2005b) have been shown to modulate light sensitivity in humans, which could lead to different treatment outcomes dependent on an individual’s light exposure patterns (McGlashan et al., 2018b). Models that are optimized for light sensitivity parameters could be useful for tracking phase during diagnosis and treatment, as well as informing the timing of light-based interventions to enhance treatment outcomes. Further research is needed to establish broader generalizability to clinical populations, particularly where different parameters may be more or less important for model accuracy (for example, individuals with no, or reduced, light input to the clock may require alternate optimization approaches).
While previous work has modeled interindividual differences in circadian period (e.g., Phillips et al., 2017; Woelders et al., 2017), this is the first study to demonstrate the potential utility of light sensitivity parameters to improve phase predictions. Previous studies have fit only a single parameter using a single DLMO assessment, whereas we fit multiple parameters using multiple DLMO assessments within individuals. One advantage of fitting light sensitivity parameters compared with tau is that they may be easier to obtain experimentally. Accurate assessment of an individual’s circadian period requires desynchronization of the circadian system from the rest-activity cycle, via a forced desynchrony protocol (Kleitman, 1963; Klerman et al., 1996; Stack et al., 2017), which is highly time and resource intensive. Current approaches to measuring circadian light sensitivity—either via phase shifting or melatonin suppression—also require extended lab visits. However, pupillary measures may provide a more rapid assessment of circadian light sensitivity (Roecklein et al., 2013; Adhikari et al., 2015; Van Der Meijden et al., 2016; McGlashan et al., 2018a; Bullock et al., 2019), which would be suitable for optimizing model parameters. We note, however, that these studies do not directly link pupillary responses to shifts in circadian phase. Future work will need to relate these pupillary measures to standard measures of light sensitivity and to directly map physiological measures to the model parameters. There are parameters besides p and K that influence light sensitivity in the model. In some implementations, the best fits for p and K reached the outer bounds of the examined parameter ranges (see Suppl. Fig. S2), indicating there may be further unexplained variance not accounted for by these parameters alone. Physiological measures may help inform which parameters are most relevant.
The model used in this analysis is currently the most widely used model of the human circadian clock and its response to light (Dijk and Duffy, 2020; Stone et al., 2020). Retinal physiology is highly simplified in this model, without differentiation of photoreceptor types (rods, cones, ipRGCs). Light inputs in the model are based on photopic illuminance, whereas circadian responses are more strongly predicted by melanopic illuminance (Gooley et al., 2010; Lucas et al., 2014; Brown, 2020). A more detailed, mechanistic model could help to determine precisely where in the biological pathway the differences in light sensitivity emerge, as well as potentially improve the accuracy of phase predictions. In addition, there is potential to improve phase predictions with more accurate measures of light exposure. Light in this study was measured using wrist-based sensors—as used in previous field-based phase prediction studies (Phillips et al., 2017; Woelders et al., 2017; Stone et al., 2019a)—rather than sensors worn closer to the eye. Devices that are capable of accurately measuring melanopic illuminance nearer to eye level should be used to further refine model predictions, as they are likely to enable more accurate phase prediction.
Our study sample consisted of young healthy adults with relatively stable circadian phase (no week-to-week phase changes exceeded 2 h). Populations with greater intraindividual variability in circadian timing, such as shift workers (Gibbs et al., 2002; Hansen et al., 2010; Jensen et al., 2015; Stone et al., 2018) and some circadian rhythm disorders (Lockley et al., 1997; Lockley et al., 1999; Burgess et al., 2017; Watson et al., 2018; Watson et al., 2020) would be valuable prospective test cases. Recent work in populations with high intraindividual variability, such as shift workers, has shown accurate prediction of phase at the group-average level but with large errors for some individuals (Phillips et al., 2017; Stone et al., 2019a; Stone et al., 2019b). Further prospective testing in populations with high variability in phase dynamics is important, particularly given the need for practical methods for tracking circadian phase for accurate timing of chronotherapy. We note that in this study we optimized parameters using measured salivary DLMO to identify targets for future prospective model individualization. The errors obtained using this approach cannot be directly extrapolated to the error that would arise if light sensitivity parameters were measured experimentally. An important next step will be to use physiological markers to identify individual-level light sensitivity parameters to prospectively validate this approach.
Although differences in light sensitivity have been reported between individuals and populations, light sensitivity has not been evaluated as a factor for improving phase predictions until now. We have shown that light sensitivity parameters can account for a significant amount of the interindividual variance in circadian timing, indicating that light sensitivity is a promising target for improving individual-level phase predictions. Prospective testing using physiological markers of light sensitivity should be performed to validate this approach.
Supplemental Material
Supplementary_Material_clean – Supplemental material for The Role of Light Sensitivity and Intrinsic Circadian Period in Predicting Individual Circadian Timing
Supplemental material, Supplementary_Material_clean for The Role of Light Sensitivity and Intrinsic Circadian Period in Predicting Individual Circadian Timing by Julia E. Stone, Elise M. McGlashan, Nina Quin, Kayan Skinner, Jessica J. Stephenson, Sean W. Cain and Andrew J. K. Phillips in Journal of Biological Rhythms
Footnotes
Acknowledgements
The authors thank Mark Salkeld at the Adelaide Research Assay Facility for conducting the melatonin radioimmu-noassays.
Conflict of Interest Statement
The authors declared no potential conflicts of interest with respect to the research, authorship, and/or publication of this article.

Notes
References
Supplementary Material
Please find the following supplemental material available below.
For Open Access articles published under a Creative Commons License, all supplemental material carries the same license as the article it is associated with.
For non-Open Access articles published, all supplemental material carries a non-exclusive license, and permission requests for re-use of supplemental material or any part of supplemental material shall be sent directly to the copyright owner as specified in the copyright notice associated with the article.
