
Abstract
This article explores the development of my PhD dissertation’s methodological approach, based on Social Network Analysis (SNA), or the collection and analysis of network data, in order to deal with political parties and their members (party membership). I extensively relied on this alternative, growing methodological background in three extents. First (1), SNA was used to analyze bibliographic references related to my dissertation topic, i.e. party membership studies, and identify the most central authors, thereby illustrating the literature review while describing their key contributions. Second (2), SNA was employed to collect and analyze network data likely to better grasp how interpersonal networks affect the probability for a random citizen to turn into party member, assuming that social influence matters in the process of joining a political party. Third (3), I further capitalized on SNA to deal with the question of party activism and why some members become active whereas others remain passive, arguing theoretically and showing empirically that part of the answer lies in members’ position within their local party branch’s social network. Each of these three applications is discussed in the light of the main methodological developments, the empirical findings and their interpretation, while shortcomings and research opportunities are more systematically highlighted at the end.
Introduction
I may not have gone where I intended to go, but I think I have ended up where I needed to be. (Douglas Adams, 1988, The Long Dark Tea-Time of the Soul)
This article explores the development of my PhD dissertation’s methodological approach, based upon Social Network Analysis (SNA), or the collection and analysis of network data, in order to deal with political parties and their members (party membership). I extensively relied on this alternative, growing methodological background in three extents. First, SNA is used to illustrate the literature review of my dissertation topic, i.e. party membership and activism, understood as traditional forms of political participation. Indeed, scientific contributions provide a wide amount of relational data that can be analyzed via SNA. This method offers an original way of performing a state of the art identifying the different sub-areas existing within/across scientific field(s) through mapping, for instance, networks of co-citation or co-authorship. Second, SNA is employed to collect and analyze data likely to better grasp how social networks affect party membership, assuming that social influence occurs in the process of joining a political party. I introduced the ‘name-generating’ procedure in a large-scale population survey in order to map my respondents’ social networks (N=2,801 Belgian citizens), mixing alternative network perspective with common survey tradition dominant in the field. After gathering these network data, I performed network analysis to reach network visualizations and related measurements, which have then been introduced in multivariate statistical models seeking to predict the probability of a random citizen to be party member on the basis of the features and his/her social network. Third, I further capitalized on SNA to approach the issue of party activism. I questioned party members’ interactions outside their (local) party organization and tested whether the structural position occupied by a member in the underlying social structure of his/her local branch might affect his/her chance to be active, and not to remain only passive member. To do so, I distributed questionnaires to party members and activists belonging to seven local party branches (Brussels-Capital Region, Belgium) that were part of a larger ethnographic investigation. The survey encompassed two name-generators, which aimed at finding informal strong ties existing between party members outside their local party branch. Thus, comparing and crossing the results among respondents of the same local branch, I mapped a whole network for each group. Network indicators (centrality) were then implemented as independent variables in multivariate regression models trying to predict individual-level activism of members, combining SNA with more classical quantitative analysis.
To tackle the main underlying issues, the structure of this article is as follows. First, I expose the general background behind my PhD dissertation, its main research question and objectives. I argue also why SNA turned out to be an interesting path to take in order to reach these goals, and its singularity as a methodological approach. Second, I expose, explain and discuss the three different applications highlighted above and summarized in Table 1. On the one hand, I come back on the different methodological choices, the reasons why I made them, and what were the implications. On the other hand, I briefly present the empirical results of theses applications, how to interpret them, and how I related to existing social network theories. Third and finally, I conclude by summarizing the main strengths and weaknesses of the SNA application to treat party members and activists, while I also point out further methodological and analytical developments that I intend to explore in the future.
Summary of the Three SNA Applications
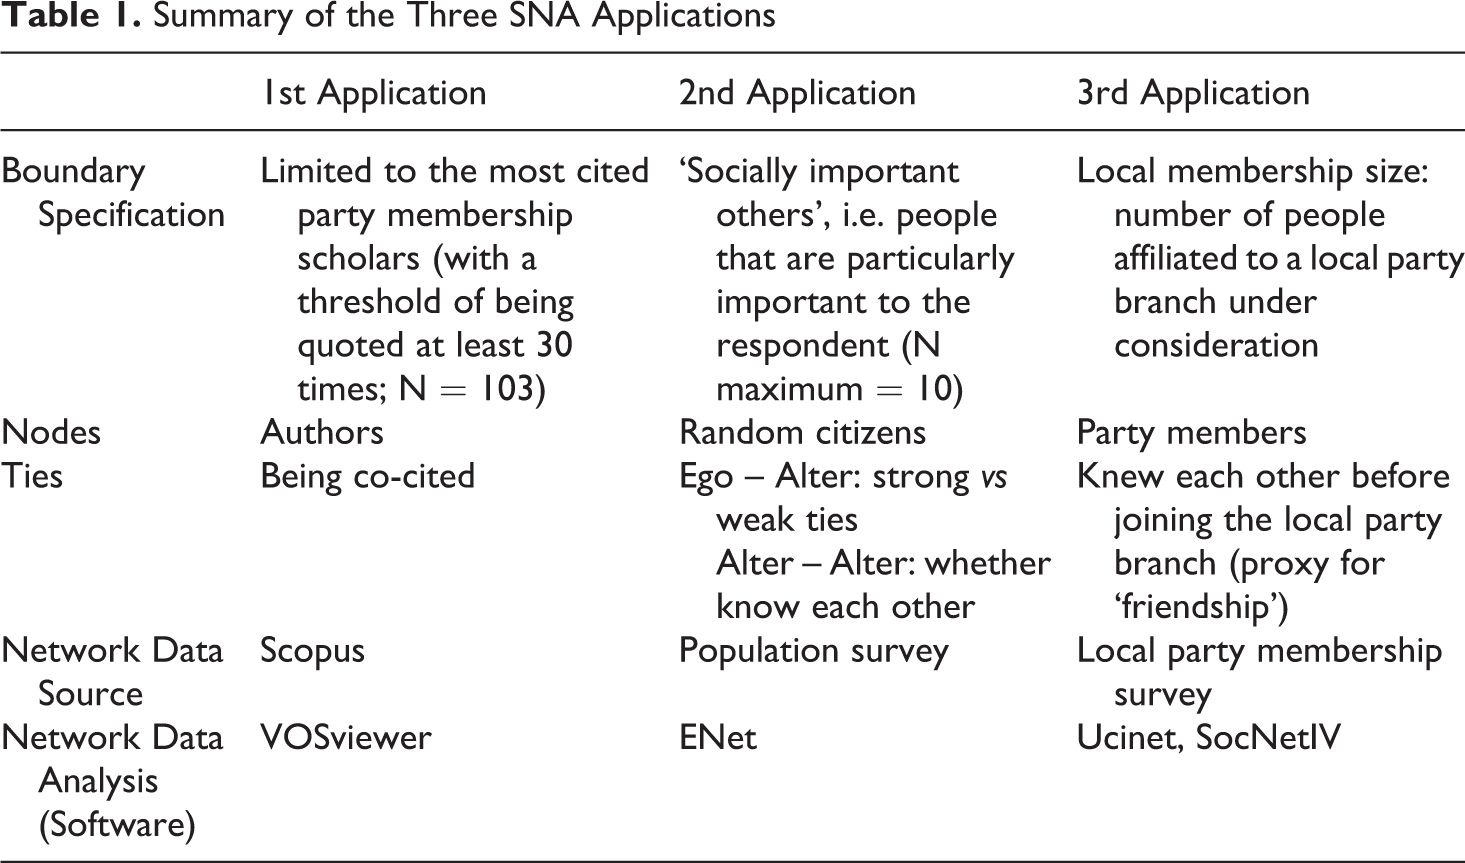
It is worth noting that the first application stands out from the two others by being not empirical per se. SNA was used as additional tool to map, illustrate and somehow validate the literature review, mirroring the very large diversity of application that this methodological toolbox underlies. The two other ones are properly empirical in the extent that they serve to answer the overall research question of my doctoral research.
The Original Background of the Dissertation: Organize the Meeting of Social Networks and Party Membership
Party membership is on the wane in most Western democracies. Many studies ended up with the same conclusion since the beginning of the 21st Century (Mair and Van Biezen, 2001; Van Biezen et al., 2012; Scarrow and Gezgor, 2010). The decline of the proportion of citizens affiliated to political parties raises many general concerns about the state of political parties and representative democracy because it embodies the deliquescence of the dominant linkage between citizens, parties and the State (Katz, 1990). The general question raised by my dissertation starts from this empirical observation and intends to deal with current explanations of party membership: why and how do people join parties nowadays? What drives the decision of citizens to become members, but also to stay away from these organizations?
I quickly acknowledged that existing studies confine the explanation of party membership and activism to individualistic factors like personal resources, socio-demographic profiles, political attitudes, ideological incentives, etc. (van Haute and Gauja, 2015). Yet, it appeared to me that the understanding of the mechanisms behind the act of joining remained patchy and underexplored: how exactly do prospective members turn into formal affiliates and, if so, how do they choose the party to join? Furthermore, what about the process of activism once members have formally joined? As most party members tend to remain rather passive after their affiliation (Weldon, 2006), even in most participatory parties (Bennie, 2017), how do they turn into activists? In order to fill this little gap about the processes and triggers, my dissertation put the emphasis back on the social process of party membership and activism by studying party members and activists, not as isolated and individual units, but as social units, interacting and connecting with other social agents in their proximate environment. After all, the civic voluntarism model developed by Verba et al. (1995) states that people do not participate because they cannot (they lack the resources), because they do not want to (they lack the motivations), or because nobody asked, suggesting de facto the potential effect of surrounding ‘others’ in recruitment processes. If party membership studies have largely explored party members’ profiles and motivations, or the individual incentives for activism, they have largely left aside social structures, interactions and networks as factors influencing the process of joining. This is less surprising since you know that political scientists studying political behaviors were quite reluctant to explore them until recent developments (Lazer, 2011).
Therefore, to provide an original empirical analysis of the effects played by interpersonal networks in the processes of joining a party and becoming active afterwards, I looked for a methodology likely to help me collect data on social networks, that is what I referred to as Social Network Analysis (SNA). The basic insight of social network analysis is that social structure is an emergent property of the networks of relationships in which individuals (and other social actors, such as organizations) are embedded. Therefore, if one wants to understand social structure, one should study social networks. While research on social networks may use quantitative or qualitative or mixed methods, social network analysis itself is fundamentally neither quantitative nor qualitative, nor a combination of the two. Rather, […] the fundamental quest is to understand the structure of the network, which is neither a quantity nor a quality (Carrington, 2014: 35). Actors and their actions are viewed as interdependent rather than independent, autonomous units. Relational ties between actors are channels for transfer or ‘flow’ of resources (either material or nonmaterial). Network models focusing on individuals view the network structural environment as providing opportunities for or constraints on individual action. Network models conceptualize structure (social, economic, political and so forth) as lasting patterns of relations among actors.
Overall, SNA is particularly desirable ‘to carry out investigations at both the individual and group levels’ (Emirbayer and Goodwin, 1994: 1417). Hence, it is ‘neither a study of individuals nor a study of groups. It is both’ (Kadushin, 2012: 115).
This leads me to the first application of SNA and a co-citation network analysis of a large sample of scientific contributions studying party membership and activism. Overall, the contribution of SNA in that part of the dissertation is that it has allowed me to validate that my field of research was composed of three, almost isolated sub-fields of scholars, who were dealing with the topic in three different theoretical perspectives. Along with the qualitative review of their works’ content, I acknowledge that network-based explanations that may have the potential to bridge the gap between existing lines of research were scarcely explored.
First Application: Bibliometric Network Analysis for the Literature Review
The scientific literature provides a very large pool of relational data that can be used to run network analyses. SNA is often applied to map the structure of scientific/knowledge networks, and better understand the intellectual interactions (co-citations) and interpersonal collaborations (co-authorship) leading to the emergence of scientific sub-fields (Mingers and Leydesdorff, 2015). Hence, I decided to apply the method to my field of interest, i.e. party membership studies, and so to provide an original overview of the literature.
The first issue to tackle was to find and collect bibliographic data that could be processed in a software that allows to produce network bibliometric maps. After exploring the different existing possibilities in terms of software (for a review see Cobo et al., 2011), VOSviewer turned out to be the most adequate tool for my purpose, especially given its ‘user-friendly’ nature. Indeed, this free, open-access software offers the possibility to ‘create [network] maps of scientific publications, scientific journals, researchers, research organizations, or countries based on bibliographic coupling relations (i.e., multiple items citing the same publication), co-citation relations (i.e., multiple items being cited by the same publication), or co-authorship relations (i.e., multiple items co-authoring the same publication)’ (Van Eck and Waltman, 2015: 13). I opted for the analysis of co-citation relations, which is also demonstrated as a way to identify key literature for cross-disciplinary ideas (Trujilo and Long, 2018). Two publications are co-cited if there is a third publication that cites both publications (see Figure 1). The larger the number of publications by which two publications are co-cited, the stronger the co-citation relation between the two publications. If co-citations can be used to analyze and visualize relations between publications, they are also used to study relations between researchers and between journals (other units of analysis). Applied to my case, I decided to look at the proximity of scholars, rather than their publications. The authors’ relatedness in my bibliometric network is thus determined by the degree to which they are co-cited in the same publications. This means that, in the visualization presented in Figure 1, the more two researchers are cited at the same time in publications, the stronger their relatedness. It is fair to note in that regard that, because some contributions encompass multiple scholars in the reference, I used the fractional counting to avoid missing references by focusing only on the first name (Perianes-Rodriguez et al., 2016). The overall goal and main value of the integration of this network analytical technique in my literature review was to highlight, in an original way, the most central authors working on my topic of interest. Additionally, the idea was to better visualize and understand the general intellectual structure of this specific field of research.

Co-Citation Network of the Most Quoted Scholars in the Party Membership Literature
In practice, I built and exported my own dataset of bibliographic data from the general Scopus database 1 (year of data collection: 2016). Although other similar datasets systematically gathering citation data for many different academic disciplines exist (like Web Of Science), 2 their access is subscription-based and therefore scholars highly depend on the one that their university has subscribed with. Here, I made the choice to articulate my search with the two main key words that best summarize my research topic, i.e. ‘party membership’ and ‘party activism’. The output was slightly over 500 publications encompassing these two key-words. After looking through the references nonetheless, I realized that a certain number of studies were related to party membership/activism in the Chinese one-party system (basically how being member of the Communist party grants many opportunities and privileges in the Chinese society). Therefore, I decided to add a third key word along with the two others: ‘Western democracy’. It meant that, to be included in my final original list of references, publications (articles, books and book chapters) had to refer to one of the two major key words (party membership or party activism), plus the additional one (Western democracy) in their title or in their abstract/summary. My final dataset – exported in a basic Excel format through the Scopus platform – was composed of 375 relevant documents, plus their 13,833 references mentioned in their bibliographies, used by the software to connect authors together (i.e. to see whether authors tend to be quoted together in the same publications).
Then, I ran the VOSviewer software and imported the Excel file of bibliographic data. The software asks for the minimum number of citations that a scholar must have received in order to be taken into consideration in the co-citation network. The default value is 20 citations, but I choose to require at least 30 citations. This means that a researcher can be included in the network only if, in my Scopus output files, there are at least 30 cited references that point to him/her. Among the 9,149 different names of scholars identified in the whole dataset, there turned out to be 103 who met that requirement. This subjective choice impacts, above all, on the quality of the visualization, as it allows to limit the view to the most significant scholars; at least to those who hold a certain position in the field by being extensively quoted by their peers. It allows to identify them directly and visually in the network graphs, but also to avoid having many different clusters of scholars, making it more difficult to interpret (see below). It is worth agreeing though that beyond simplifying the visualization, this approach has the main drawback of making emerge only dominant perspectives, while more recent or bridging approaches are less discernible.
Finally, Figure 1 presents the visualization obtained and proposed in my doctoral thesis. Each circle (node) represents an author. The size is proportional to the number of citations in my dataset, whereas smaller nodes represent researchers with fewer citations. More generally, the closer two researchers are located to each other in the visualization, the stronger they are related to each other based on co-citations. In other words, researchers that are cited by the same publications are close to each other, and vice versa.
After getting the network visualization, I first observed the general structure of the network and the main clusters of scholars identified by the software. Indeed, VOSviewer assigns network nodes to clusters via a community detection algorithm (Van Eck and Waltman, 2014). A cluster, identified by a color in the graph, is a set of closely related nodes, emphasizing their structural proximity. Interestingly, it appeared that the structural proximity of these scholars matched with their closeness in terms of research approach. Three broad groups of researchers can be distinguished, highlighting the three main lines of investigation in party membership studies (van Haute and Gauja, 2015): those working on political participation (macro-level studies, dark grey cluster), party organization (meso-level studies, middle grey cluster) and party members (micro-level studies, light grey cluster). Hence, secondly, I associated scholars’ clusters with the content of their contributions. In doing so, I reviewed and highlighted the main contributions and gaps existing in the current literature on party membership and activism, and positioned my own ‘network’ argument accordingly.
The dark grey cluster tends to associate authors leading macro-level studies focusing on institutional and systemic explanations of the erosion of political participation. On the one hand, systemic models focus on societal changes across modern industrialized democracies, such as economic development, increase of education levels, or changes in citizens’ values and attitudes – development of post-materialism, prominence of individualism, political disinterest, distrust in institutions, etc. (e.g. Putnam, 2000; Dalton and Wattenberg, 2003). These changes would have undermined conventional modes of political participation, including party membership, by modifying repertoires and targets of political participation (Norris, 2002). In parallel, the digital and technological revolution has also been questioned as potentially eroding traditional forms of political engagement (Gibson and Cantijoch, 2013). On the other hand, some scholars emphasize the potential effects of institutional factors, and link party membership evolution to the size and age of democracy (Van Biezen et al., 2012; Weldon, 2006), the type of political regime (Bartolini, 1983; Tan, 2000), the type of electoral system, the structure of party system or inter-party competition (Dahl and Tufer, 1973; Tan, 2000; Norris, 2002).
The middle grey cluster, on the other hand, regroups authors providing meso-level studies focusing on party-based explanations of membership decline. Because macro variables cannot account for the diverging membership trends existing across parties, other studies appeal to alternative, meso-level explanations pertaining to parties per se (Koülln, 2016). This line of inquiry explores party membership as an organizational resource for political parties (Katz and Mair, 1992). Some of these scholars rely on a rational approach, considering parties as rational unitary actors, able to adapt to their changing environment (Scarrow, 2015). To account for party membership decline, they argue that there has been a change in the cost-benefit calculation made by parties regarding their membership (Bowler and Farrell, 1992; Scarrow, 1994). The decline is seen as a by-product of a reduced demand: parties have less need for party members and therefore recruit fewer of them. Economic and ideological costs exceed the benefits that parties can obtain from membership recruitment, such as legitimacy, electoral gain, financial resources, working forces, prospective staff and officials, or linkage with citizens. Others argue that political parties did not choose to stop recruiting affiliates. Rather, they increasingly became less attractive since they no longer provide members with the incentives to join and participate in their organizations (Ware, 1987).
Finally, the light grey cluster relates scholars studying party members from the perspective of individuals and focusing on incentives and resources-based explanations of party membership and activism. Indeed, to complement the explanations exposed above, other studies take into account the individual-level determinants of party membership, inspired by classic theories of political participation. This rich corpus of studies, among which Whiteley and Seyd played a central role (see their centrality and proximity in Figure 1), provides tools for addressing questions such as who joins (resource model), why (rational choice model), and what opinions they hold (socio-psychological model).
Overall, the existing, dominant and well-established literature on party membership has allowed to answer questions such as how many members parties have and why is this number in decline, or ‘who’ are party members, ‘why’ they join, and ‘what’ they think and do. Nonetheless, they do not answer everything. More precisely, I argued that, despite the social and collective nature of party membership, individual-level theories predominantly see party members as individuals isolated from their social context, whereas individuals are embedded in social networks, in sets of relationships with other individuals, likely to (have) trigger(ed) their membership/activism. Few contributions pay systematic attention to the role that these sets of relations, and their features, exert, more specifically regarding partisan participation (Morales, 2009). In addition, I also stressed that my network explanation of party membership can, in turn, provide alternative theoretical insights for party-based research, as it allows to discuss the issue of parties’ recruiting capacity, and how these organizations are capable of recruiting and mobilizing citizens, as well as keeping members loyal and active, through interpersonal networks (issues of recruitment and retention). In that sense, my thesis intended to somehow bridge the gap between individual and party explanations of party membership thanks to the use of a network approach.
This leads me to the second application of SNA.
Second Application: Belgian Citizens’ (Ego-Centric) Social Networks
One empirical chapter of my dissertation focused on mapping the proximate social networks of Belgian citizens in order to assess whether the structure (how many people are part of the network and do they know each other) and composition of the latter (who are these people, what do they think and do politically, and is it congruent) might affect their odds of joining a political party (dependent variable). To address this question, I capitalized on a large-scale cross-sectional survey of Belgian citizens to raise and gather my own, original data (see Appendix 2 3 for a summary of data collection and operationalization). The data was collected through an online survey conducted by an external company (Qualtrics) between June 25, 2016 and July 6, 2016 among a non-random quota sample of 2,801 Belgian citizens (based on the characteristics of the Belgian population regarding gender, age, and region of residence). The research was introduced to participants as a survey about their participatory behaviors. Overall, the cost of the survey was 2,500 euros, while the total duration to fill in the questionnaire was about 15 minutes.
The questionnaire in itself was split into two main sections. The first one was the shortest and consisted in getting respondents’ personal sociological profiles (age, gender, and education) as well as more precise individual-level information about their political attitudes (political interest, political satisfaction and party identification) and participatory behaviors (party membership and activism, but also less conventional forms of participation like protest or boycott). For that, I used very classical questions applied in the field of political participation survey research (Gibson and Cantijoch, 2013). The second part was more substantial and aimed at specifically reaching the information on respondents’ proximate social peers (i.e. network data). It is probably the one that led me to the most reflective thoughts, especially regarding the burden effect that network data collection through survey may imply. As underlined further, I adapted the most basic ‘name-generating procedure’, early developed by network scholars for population surveys. The main task for my respondents was thus to provide substantial information throughout this procedure. The fact that they were slightly compensated for their participation by the survey company allowed me to slightly enlarge the threshold of network peers that can be elicited from large scale survey name-generator and, above all, contributed to make them accept the potential burden that can emerge when providing information on these peers.
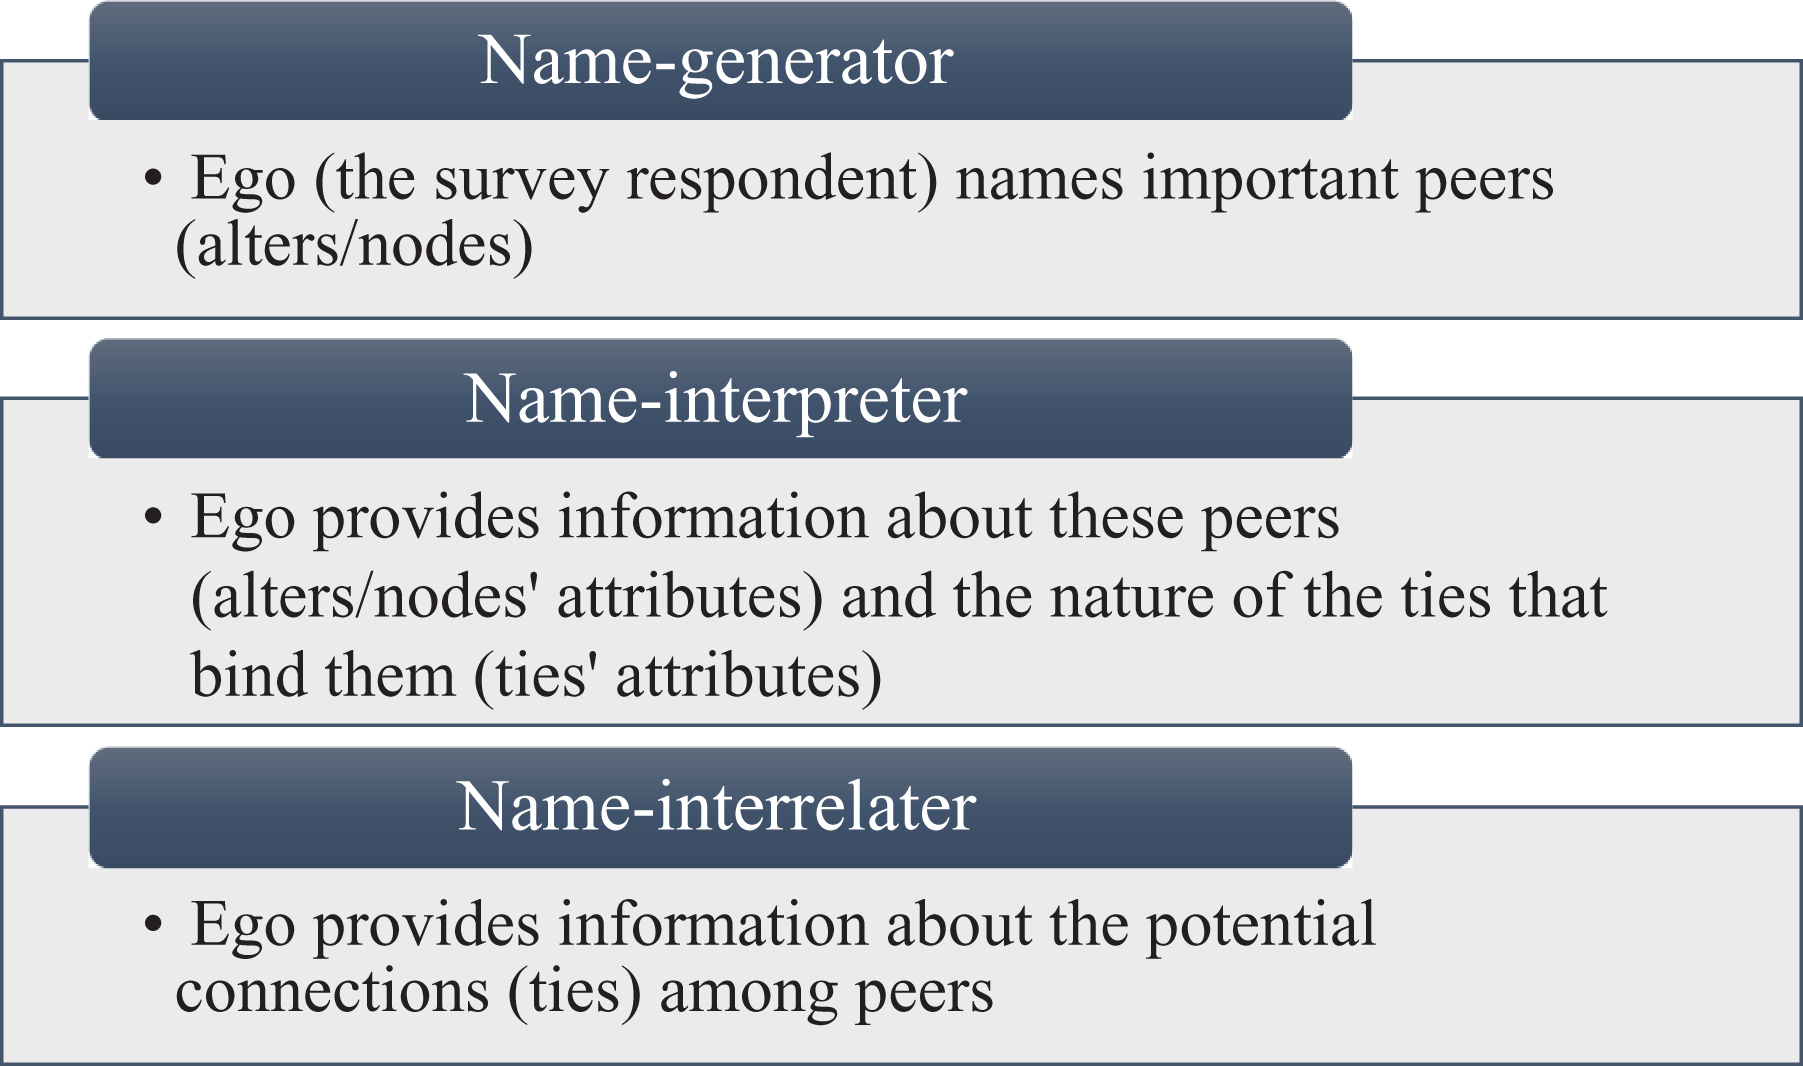
No matter how it is set up (face-to-face, phone call, paper, or online) and what the target is (large/small N), surveys are a widespread technique to collect and generate data on networks of all kinds (Marsden, 1990; Crossley et al., 2015; Perry et al., 2018). Recent method-driven research has emphasized the web’s usefulness in collecting network data (Matzat and Snijders, 2010; Vehovar et al., 2008). It ‘substantially reduces the costs, time and fatigue in managing the complex questionnaire required for data collection of ego-centred data’ (Manfreda et al., 2004: 295). Moreover, it considerably moderates the interviewer effect occurring when building networks via face-to-face/phone call surveys (Eagle and Proeshold-Bell, 2015). Doing it online may even sometimes lead to a better quality and reliability of network data (Coromina and Coenders, 2006; Matzat and Snijders, 2010), when a rigorous control is ensured by the building of a relevant and robust questionnaire design. The wording of the network questions, their order, and the complexity of tasks may of course affect the quality of the data afterwards (Marsden, 2011). As network measurement in large population survey supposes collecting ego, personal networks, an ego-network module (name-generator) has been implemented. All the network information is elicited from respondents themselves. Each observation is an individual and his proximate network. The collection of this specific type of data has led to the development of many techniques at the heart of rich methodological debates in the field of SNA (Marin and Hampton, 2007; Bidart and Charbonneau, 2011; Merluzzi and Burt, 2013). In my dissertation, I opted for the most common and straightforward tool to generate data on personal networks: the name-generating procedure. The latter was designed in the 1980s in order to generate network data through the US general social survey (Burt, 1984). It consists of a three-step process, summarized in Figure 2.
Name Generating Procedure
Name-Generator: Network Size (Structure)
The name-generator aims at extracting a list of individuals’ names from respondents based on a specific social interaction, which is at the heart of the analysis. For instance, this first step may look for names of people who are particularly important to respondents (‘significant others’), with whom they are frequently in social contact (‘frequent-contact other’), communicate about important, personal matters (‘important matters discussant’), or politics (‘political discussant’) (Crossley et al., 2015). The choice of the best instrument entirely depends on the aims of the research and may have various consequences on network data (Marin, 2004; Marsden, 2011; Sokhey and Djupe, 2014), although combining multiple name-generators and/or snowball sampling can be an efficient solution to triangulate information when time and resources allows (Aeby, 2016), which is barely the case for young researchers.
For my own research, the idea was to approach the proximate social circle of individuals. As a starting point, I used existing questions looking at social support through discussion and asked my respondents more globally to name people that they perceived as particularly important to them, with whom they socialized on a regular basis over the six months preceding the survey 4 . Although free recall of network has provided relatively good scores of data reliability and validity (Ferligoj and Hlebec, 1999), it is worth noting that network scholars often recommended to carefully limit the number of people to be named in order to avoid the respondent being burdened in the second step of the network data generation (Burt, 1984; Marsden, 2011). In this step, (s)he has to inform about the characteristics of the named people (alters). If the number of alters is not restricted, the respondents’ odds of errors and mistakes increase as they have to provide substantial information about many people within a limited time-period. Although many researchers limit the number of names to three, five or sometimes seven in large-scale surveys, where many different modules are integrated, I agreed with a more substantial number (10), meaning that respondents could name up to 10 other individuals. As underlined above, I broadened this number because my survey was mostly concerned with getting reliable network information related to the proximate social environment (and much of the response time was dedicated to this specific task), but also because my respondents were financially compensated and would therefore be more likely to accept the eventual constraint of providing details about 10 very close peers.
For the purpose of logistic regression analyses, relating network structure/composition (independent variables) and the probability of joining a party (dependent variable), the number of alters provided in the name generator was used to measure the size of a social network. On average, respondents named from 6 to 7 people. We can see from the distribution presented in Figure 3 that the limit of 10 alters exerts a certain threshold, probably because it is quite easy for people to name 10 important proximate peers. It is at least easier than for networks where less social support is found (confidence, love, advice, service, etc.). Using the measurement of network size in a continuous way might therefore be deservedly questioned. Nonetheless, Figure 3 shows that, even though a large part of respondents took the opportunity to name 10 alters (38.4%), a significant proportion reported smaller networks, with 1 (14.1%) or 2 (7.5%) alters. The median is 6, meaning that more than 50% of respondents are above the mean and were not constrained by the limit of 10 alters, reporting overall smaller social networks. Respondents who did not provide at least one name were not allowed to carry out the rest of the survey, while those who had provided extravagant or doubtful responses about their peers were removed. Finally, no previous information was given about the following questions: respondents did not know that the number of peers provided in the name-generator could affect the length of the survey and they might not come back on the names provided afterwards. This configuration decreased probably slightly the burden effect that could emerge from this first step.

Output of the Name-Generator
The results of the logistic regression models (available in Appendix 1) generated network size as statistically significant in its positive relationship to the probability of joining a party, supporting my theoretical expectation. To interpret this, I referred to network theory of political participation upon which my hypothesis is based. The latter demonstrates network size as a fairly good proxy for social integration. This indicator is shown to impact positively the odds of voicing in the political process, and so in different ways (Knoke, 1990; La Due Lake and Huckfeldt, 1998; Teorell, 2000; McClurg, 2003; Zuckerman, 2005; Sinclair, 2012). Extensive networks expose people to a social supply of information that broadens their exposure to and understanding of politics (Huckfeldt et al., 2004), which in turn positively affect their participation by stimulating political knowledge, expertise, interest and other attitudes (trust, support, etc.). Furthermore, a larger network implies also a better social embeddedness through extensive connections to other social peers. This structural configuration enlarges the pool from which interpersonal mobilizing triggers may be launched, all the more if it meets social agents that are already politically active. If a larger number of alters are active politically in the same way (i.e. party membership) and diffuse politically-relevant information in their surrounding social environment, it is very likely to reinforce the idea that such political commitment is desirable, triggering the stimulus for an effective membership. Put in another way, this particular network configuration can be seen as a social endorsement cue (Bond et al., 2017). My thesis thus found some empirical support for these patterns regarding party membership. Indeed, Belgian citizens with extensive social networks show a higher probability of joining a party than their fellows with smaller social networks, all the more if the proportion of party members in the network tends to increase. I also explained that social cognition, imitation and mimicry could account for why this relation is positive, as the increasing occurrence of affiliation behaviors in a network enhances the chances for the nodes to adopt the same behavior (Kavanagh and Winkielman, 2016).
Name-Interrelater: Network Density (Structure)
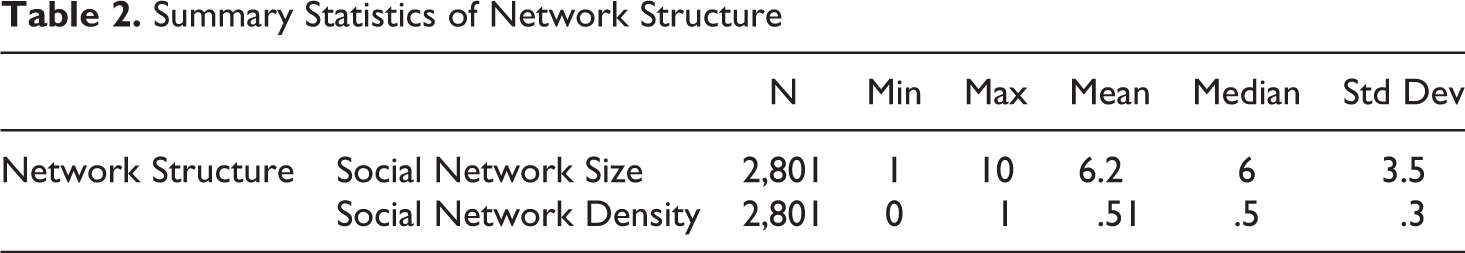
The name-interrelater asks about the potential connection(s) between the individuals named by the respondent (alters); in other words, whether these people know each other (or not). This step is often neglected. Scholars use to stick to the basic, most common form of the name generating i.e. using only the two other steps – naming and interpretation. I argue that this additional task of asking about alters’ relationships may provide a more complete structure of ego-network data through survey because it enables to turn personal networks into genuine small complete networks (Aeby, 2016), where ties between alters are also taken into account. It therefore enlarges network analytical opportunities by bringing network density, transitivity (open/closed triads), or the concept of structural holes into the equation (Crossley et al., 2015; Perry et al., 2018). For instance, sparser networks imply more structural holes, and perhaps a more centralized and less fluent share of information within a network (Burt, 2000). Hence, I built an independent variable ‘network density’, ranging from 0, when all alters are disconnected from each other, to 1 when it is the opposite situation and they form a perfect ‘clique’ (everybody is tied to everybody). The mean value for the whole population (.51) supposes that 50% of ties among alters are effective on average (see Table 2). It mirrors the very social nature of the networks studied in my doctoral research and the pre-dominance of strong ties in respondents’ proximate environment (see further), which supposes de facto more chances for alters to know each other and to be tied to each other (closed triangles).
Summary Statistics of Network Structure
Neither bivariate nor multivariate statistics using network density as independent variable appeared to be statistically significant in their relationship to party membership. Whether people in the network tended to know each other to a larger extent did not affect my dependent variable, even though I found the expected positive coefficient. Indeed, I had hypothesized that denser networks should constitute a configuration likely to spark membership, especially in networks with high levels of party involvement, and where a more substantial social cohesion and pressure would push ego to favor this type of political engagement. Nonetheless, the analysis did not corroborate the theoretical expectation.
Name-Interpreter: Attributes (Composition)
The name-interpreter consists in collecting information (attributes) about people who have been named (alters), as well as the type of ties that bind them to the respondent (ego).
Ties’ Attributes
First, respondents had to specify in a pre-defined list of social ties how they were connected to their network fellows. They were offered to select one category among a list of nine different types of social ties, ranging gradually from very ‘strong’ to very ‘weak’ ties: spouse, close relative (DNA family), extended relative, friend, colleague, member of an organization to which I belong, professional advisor, acquaintance, or other. While it can sometimes be difficult to describe a relationship as belonging to one single category (e.g. someone can be your friend and your colleague at the same time), I made the choice to simplify the reality by asking for the most significant or relevant link in the respondent’s eyes. This allowed me to set aside the issue of ‘multiplexity’, or the fact that two individuals can be connected to each other through overlapping social circles 5 . Looking at the distribution (Table 3) reveals that more than 80% of the people named in my name-generator were spouses, relatives or friends. Weaker connections were much less reported, which is not surprising given the nature of the interaction upon which my networks were mapped.
Distribution of Social Ties

An indicator of tie dispersion (IQV index) can be computed via E-Net for each network, ranging from 0 (all the ties in one category - homogeneity) to 1 for the most heterogeneous networks in terms of relationship type (Borgatti, 2006). The mean value for the whole population was .46 (see Table 4 for all summary statistics of social ties’ derived compositional variables). Respondents’ social networks thus tended slightly more toward homogeneity than heterogeneity, meaning that they tend to be tied to their alters in more or less similar manners. There was, in fact, few social ties’ diversity, despite the large number of ties’ category. This can be explained by the large proportion of strong ties and the social proximity among peers forming the networks that were mapped.
Summary Statistics of Network Composition – Ties’ Attributes

I designed a specific logistic regression model to test my hypothesis that strong ties should be the most important channels of party membership. Indeed, this expectation is suggested by early studies on personal influence that first put forward the power of strong-tie networks for political recruitment and participation (Katz and Lazarsfeld, 1955). More recently, some scholars have re-insisted on the family circle as a source of political mobilization and engagement (Zuckerman, 2005), especially within political parties (Hooghe et al., 2004). There is also evidence that political small talk taking place at the family dinner table can be determinant for future political commitment (Liebes and Ribak, 1992; Cramer Walsh, 2004), while strong-tie networks tend to face less political disagreement and therefore to generate more participation (Mutz, 2006). In addition, some scholars interestingly stressed that the role of the family as vector of recruitment in a party might have increased over time, making thereby parties even more exclusive in their access and thereby explaining part of the shortage (Cross and Young, 2008). In line with these pieces of literature, my results showed that spouses and DNA relatives’ membership were both statistically significant in their positive relationship to the individual chances of joining a party (see Appendix 1B), all the more for younger citizens (18-35 years old). The case of Belgium in itself can also help to untangle the significant role played by family ties for sparking membership among the youth. First, there is a high proportion of ‘filiations’ (‘son/daughter of’) that can be found among politicians, candidates, or members, from the local to the national level. Even if it has never been systematically quantified in a longitudinal manner or explored from a cultural point of view, this phenomenon greatly questions the diversity of the profiles that are drawn by Belgian political parties, giving sometimes to ordinary citizens the image of party dynasties. Second, the pillarization of the society has long implied that family membership was a common way to join political parties for younger members (Hooghe et al., 2004), which were then enlisted by their parents. Since the individualization of the membership process, membership fees are also generally lowered as long as other relatives join or are already members (van Haute and Gauja, 2015). Besides strong ties, I had also contrasted the first hypothesis by claiming that citizens reporting also more distant types of ties in their network might be more likely to join a party as their ties connect them to diverse social circles that can provide them with the support and resources likely to affect the process of joining a party. Reflecting on Granovetter’s (1983) work, I pointed out theoretically that a mixture between strong and weak ties might generate a situation where ego has better access to new information and resources, likely to mobilize him/her politically, than those with only strong ties. However, this interpretation is corroborated by my empirical models only for older respondents (more than 36 years old). It appeared that weak ties are much less relevant for explaining youth party membership. This configuration increases rather the odds of joining a party among older respondents. From this, I claimed that my findings were well pointing toward a certain exclusivity in recruitment patterns: young citizens need their relatives to be already involved in a party to become members themselves, rejecting a large part of potential members. Since the proportion of affiliates is constantly dropping, it is therefore not surprising to find shortage among party grassroots and especially among the youth. My results suggest also that this exclusivity seems to be somehow later balanced by the social capital achieved by citizens through more social distant relationships. Other findings support nonetheless that parties recruited mostly people with and surrounded by high level of individual resources, and therefore that the membership stimulated by these weak ties do not probably allow parties to reach new profiles of activists but rather the usual suspects (see further).
Nodes’ Attributes: Social/Political Features and Homophily
The second step of the name-interpreter is the most substantial and time-consuming for the respondent. It consists in collecting more specific data about the profiles of alters. Respondents were asked to report exactly similar information than what they did for themselves, i.e. socio-demographics (age, gender, and education) as well as political attitudes (interest, satisfaction, party identification) and behaviors (party membership and other forms of political participation). Given that the same questions and items are proposed for the respondent and the alters 6 , descriptive analysis of network composition makes even more sense when respondents are compared to network peers. As far as the social composition is concerned, Table 5 stresses how the distribution of socio-demographic profiles tends to be quite similar on three main criteria: gender, age, and level of education. By and large, there are just slightly more male, younger and lower educated alters than respondents.
Distribution of Social Attributes

Based on this information, I built my independent variables measuring the social network composition (see summary statistics in Table 6). First, for each social attribute, I generated variables summarizing the mean by network (alters’ average score). Then, I calculated an indicator of homophily (EI index). The EI index measures the congruence or similarity between ego and alters on each socio-demographic criterion, implying therefore that individual-level variables must be dismissed as control. The value of the homophily index ranges from -1, when it describes a situation of perfect dissimilarity between ego and his/her network on the concerned attribute (left hand side in Figure 4), to +1 for a completely homophilic network and a total similarity between ego and alters (right hand side in Figure 4).
Summary Statistics of Network Composition – Nodes’ Attributes
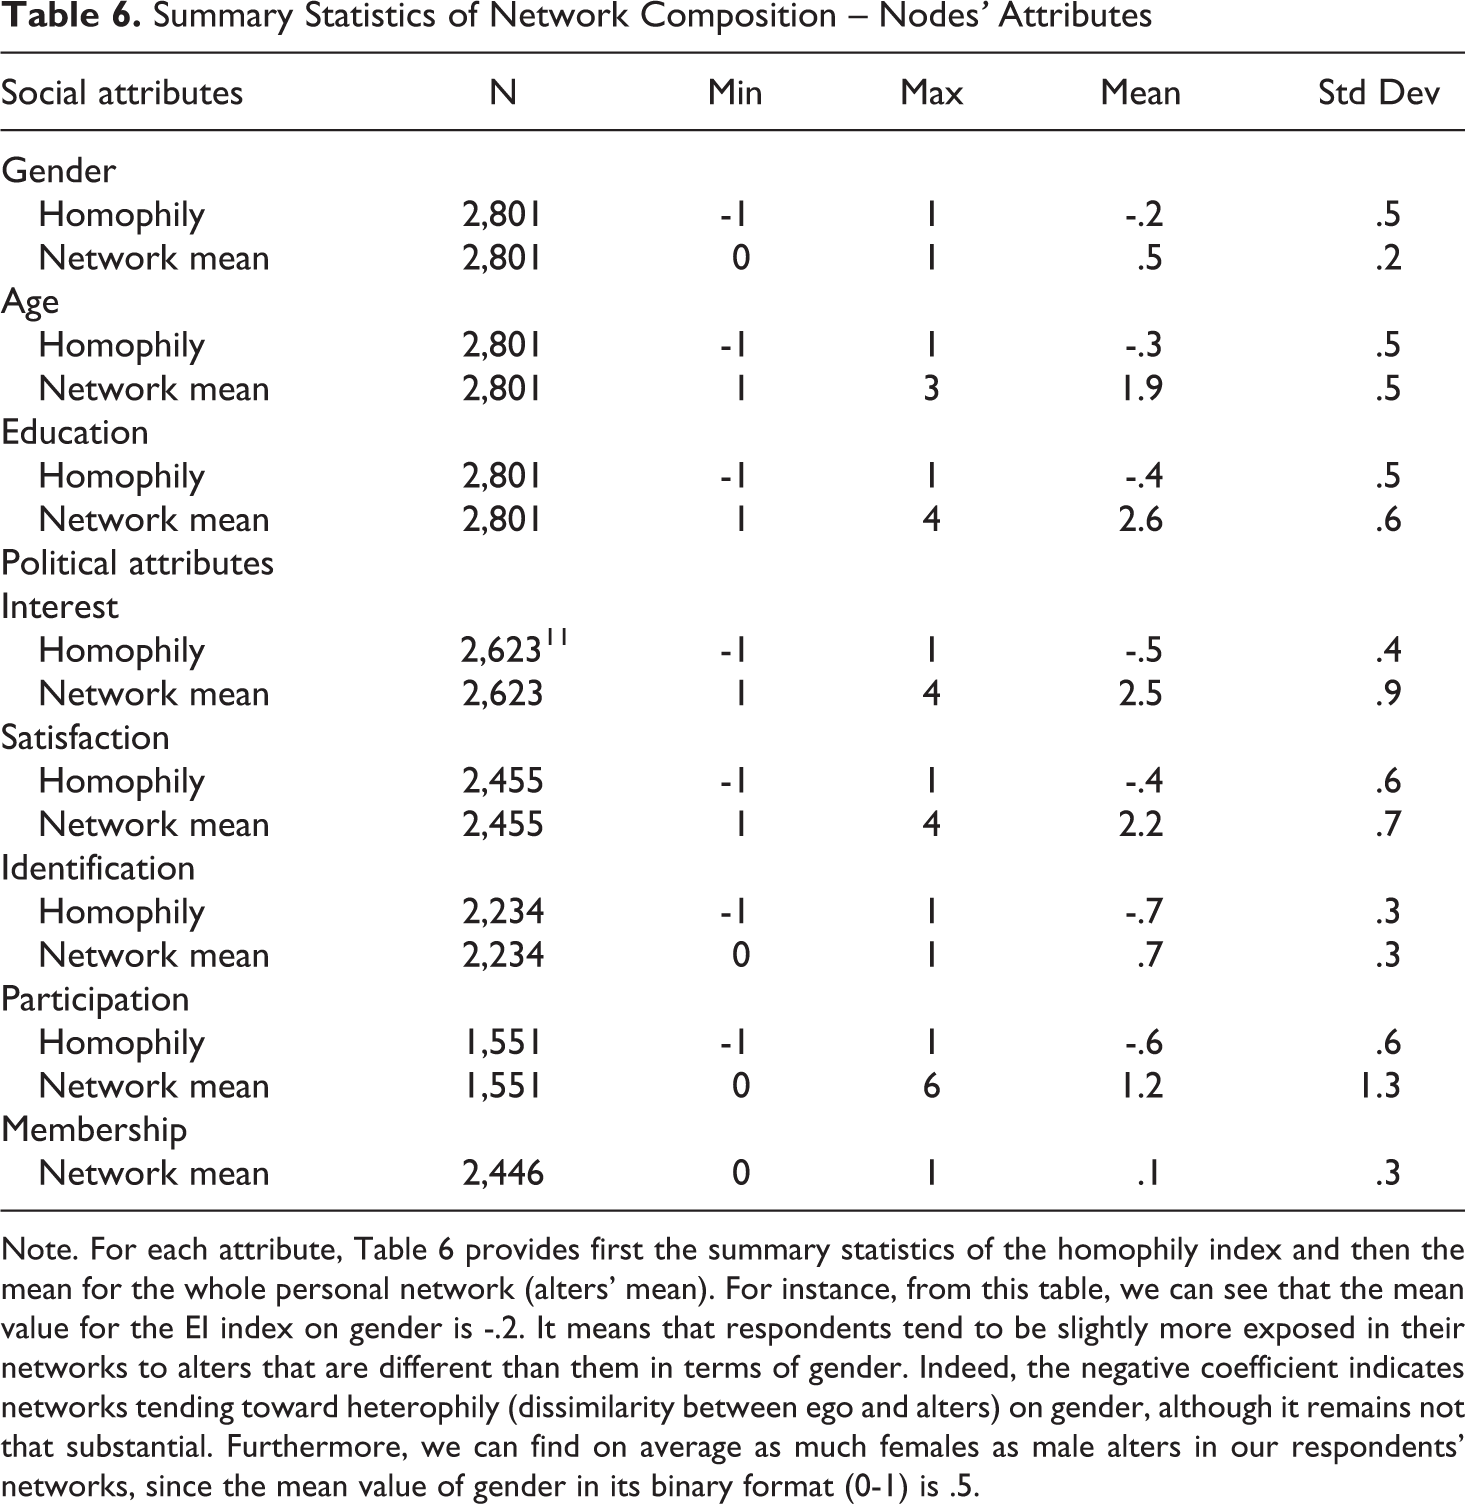
Note. For each attribute, Table 6 provides first the summary statistics of the homophily index and then the mean for the whole personal network (alters’ mean). For instance, from this table, we can see that the mean value for the EI index on gender is -.2. It means that respondents tend to be slightly more exposed in their networks to alters that are different than them in terms of gender. Indeed, the negative coefficient indicates networks tending toward heterophily (dissimilarity between ego and alters) on gender, although it remains not that substantial. Furthermore, we can find on average as much females as male alters in our respondents’ networks, since the mean value of gender in its binary format (0-1) is .5.

Illustration of Homophily Index
The mean values presented in Table 6 indicate that the alters tend on average to have a different sociological profile than the respondent, whatever the attribute concerned (negative scores for homophily on age, gender, and education). In my dissertation, I was particularly interested in the situation where ego and alters tend to converge in terms of sociological profile. Since we know that individual socio-demographic characteristics are crucial determinants of political participation and participatory modes at the individual level (Marien et al., 2010), in the same way, the social profiles of alters in the network play a significant role too, providing ego’s individual attributes a social dimension (Campbell, 2013). For instance, it is shown that education acts as a status-sorting mechanism within social networks for some types of participation (Persson, 2015). I hypothesized that a pattern of social similarity, where ego and his/her network alters share the same high level of socio-demographic resources, should increase ego’s chance of joining a party. Therefore, a third variable was constructed and mainly discussed in the model. ‘Positive’ homophily (see Figure 5) takes into account whether a network tends toward similarity on one attribute (EI index’s positive score), plus whether it coincides with a high score on that attribute (i.e. high level of resources). It turns out that 23% of the networks mapped in this research follow this similarity-based pattern for age (i.e. 23% of networks were homophilic on higher age categories - 35 years old and more), 24.6% for gender (i.e. 24.6% of networks were homophilic on male sex) and 18.1% for education (i.e. 18.1% of networks were homophilic on higher education categories). The related logistic regression model provided only partial empirical evidence supporting my expectation (see output Appendix 1A). The coefficients for age/gender ‘positive’ homophily turned out to be statistically significant and positive, meaning that networks fully composed of male and older peers are more effective recruiting channels toward a party. I put forward that this finding mirrors the aging of party members in Belgium, a deep gender inequality in party-based participation, and the current substantial recruiting difficulties faced by Belgian parties to enlarge and renew the profile of their current members by recruiting among networks where younger age cohorts and female citizens are proportionally more represented. Hence, age and gender homophily can be seen as two network composition patterns that negatively affect the current recruitment capacity of political parties in Belgium which, in turn, struggle to reach younger and female prospective affiliates through the social networks of their current members (especially beyond the proximate family circle of the latter – cf. effect of strong ties). In other words, it can explain why they always seem to recruit similar profiles, i.e. the ‘usual suspects’ of traditional political participation (male and older citizens), and why their membership size may be shrinking.

Distribution of (Positive) Homophily (IV)
When it comes to the political features of alters (political attitudes and behaviors), the same can be expected than for the social composition. Political attitudes are also crucial determinants of political participation and participatory modes at the individual level (Marien et al., 2010). Hence, the political profiles of alters in the network play a significant role too. For instance, being surrounded by people with greater political knowledge conducts to higher levels of political involvement (Campbell, 2013). Still, exposure to other peers’ political commitment is shown particularly relevant to explain mobilization processes in social movements, sects, clubs or any kind of voluntary associations (Diani and McAdam, 2003), but also in politics and political groups (Beck, 2002; McClurg, 2003; Zuckerman, 2005; Sinclair, 2012; Morisi and Plescia, 2018). From that, I hypothesize that a pattern of political proximity, where ego and his/her network alters share the same high level of political resources (i.e. interested, satisfied with democracy, identified with a party, politically active), should increase ego’s chance of joining a party, but not just any party: the party that network fellows tend to identify with. To test that, I then adopted the same recoding approach than for social homophily. I first computed continuous independent variables measuring (1) the alters’ average score on each political attribute (to see whether it was a low or high political resource pattern), as well as (2) the proportion of alters identifying with a party and the different ideological families. According to my survey results, respondents globally report more interest in politics than satisfaction with the way democracy works in Belgium. This is also the case when it comes to their alters (see Table 7). Besides, derived variables’ descriptive statistics presented in Table 7 suggest that respondents tend to perceive themselves as slightly more politically interested than their alters, but see their network peers as more satisfied than they are. This discrepancy is, nonetheless, very minimal. In addition, respondents tend to identify with a party as much as their alters, at least when considering alters for whom the information is available. Moreover, alters’ distribution by party families is relatively similar to that of the respondents, except that small party families (Green, Radical left and Extreme right) are somewhat less populated. The Social democratic party family is the one that gathers the largest number of alters, after Liberals. It suggests that respondents are predominantly exposed to the two main, traditional left-wing and right-wing Belgian party families within their social networks. Put differently, it emphasizes the substantial societal penetration of traditional pillar parties among the Belgian population (Deschouwer, 2012). Finally, jumping to behaviors, the two activities that gather proportionally more alters than respondents are protest and boycott. When looked as an additive scale it turns out that respondents are slightly more politically active than the alters, even though both range on average between one and two political activities undertaken. This brushes a picture of the generally low level of involvement in politics of Belgian citizens, with petitioning emerging as the most frequent act of participation.
Distribution of Political Attributes

Note. The left-hand column reports the proportion of respondents (in %) in each category, whereas the right-hand column provides the proportion of network peers (in %) falling into the same categories. For example, reading the first line, we have 11% of all our respondents who are not politically interested at all, while 17.9% of alters named by these participants were associated with the same category of political interest (i.e. not interested at all). Please note that alters for which information was referred to as ‘unknown’ have been removed when calculating these proportions.
Like for social attributes, homophily or similarity indexes for each political characteristic were calculated to serve as independent variables in a logistic regression model. Overall, they appeared to be more dissimilar than social attributes (lower negative coefficients in Table 6), especially regarding party identification (-.7). It means that respondents display very heterogeneous networks when political attitudes and behaviors of their peers are scrutinized and put in perspective with their own. In other words, they tend mostly to face people who think and do politics differently than themselves.
As explained earlier, I expected the more political congruence, or similarity, on higher level of political attitudes and behaviors (larger pool of political resources) the higher chances of joining a party for ego. Accordingly, I built variables measuring the ‘positive’ homophily. They depict whether a network tends toward similarity on a given political attribute (i.e. EI index’s positive score: ego and alters tend to be the same), plus whether this similarity was matching with a high score on the concerned attribute. From Figure 5, it appears that 16.7% of my networks were positively homophilic on political interest (i.e. ego and alters tend to be similarly interested in politics). This figure falls to 10.9% for political satisfaction but increases to 33.4% for party identification. Regarding the latter case, it means that, in a third of the observed networks, the ego and his/her alters all identify with a party.
The related regression model (see Appendix 1A) gave partial empirical support for my expectation. One the one hand, a network gathering people homogeneously interested in politics does increase positively the chances for ego to join a party. In other words, the more someone is embedded in a proximate personal context interested in politics, the more this person is likely to join a party. Second, the model clearly pointed out that the congruence on party identification was a significant predictor of party membership. A network compositional pattern where everybody identifies with a party makes ego more likely to be recruited by a party. It is fair to note, nonetheless, that the inclusion of exposure to alters’ party membership in the model made this variable lose its statistical significance in favor of the latter. Furthermore, through a specific logistic regression model designed to deal with the expectation (Appendix 1C), I highlighted that people tend to conform to their network fellows and to join a party belonging to the ideological family to which they are the most exposed. Here, it supports empirical evidence that had already been put forward regarding voting behavior and voting choice but not regarding party membership: when individuals tend to comply with their network peers in terms of political views, they tend to vote for (in my case, to join) the dominant party of their network (Fowler, 2005; Nickerson, 2008; Sinclair, 2012). In other words, interacting with like-minded people (alters who identify with a party, and above all the same party) positively affects the individual’s probability of joining and, what is more, of joining the party dominant in the proximate environment.
We can now switch to the third and last application of SNA, which was related to a chapter that went a step further and questioned whether social network explanations might hold also for party activism.
Third Application: Party Members and Activists’ Social Networks
For this third application, I changed the perspective as to switch from the question why and how do random fellow citizens turn into party members to the issue of activism: why some members remain passive while others turn to be very active for their party? I suggested again that part of the answer might lie in social network and interaction mechanisms within and outside the party organization. I decided to look at the local level, which is one of the first gate to party politics (Saiz and Geser, 1999; Clark, 2004; Roscoe and Jenkins, 2015). To approach the question, I decided to survey party members of local party branches directly (over the year 2016). 7 The first important issue was not only to get the local parties’ presidents’ blessings to forward a paper or online survey questionnaire to their affiliates. As expected, most of the local presidents’ reluctance regarding the content of the survey was precisely orientated toward the elicitation of network, relational data, as it implies to name people and to store interpersonal relations in a list. The most reported argument was the issue of anonymity and a fear of undesirable use of survey data, despite many attempts to reassure them regarding these matters. Here, I limit the discussion to the seven ‘most successful’ local party branches that participated in my research, in the extent that the data gathered allowed me to build networks for each of them. The participation fluctuated considerably depending on the branch and the party. As a young researcher with little resources and incentives to provide, the difficulties to organize my party membership survey are mirrored by the low response rates presented in Table 8. They were ultimately disappointing, given the small number of respondents (120) for which I had complete information for my multivariate analyses at the end. Compared to the second application, it is worth mentioning that no material incentives were provided, no company was in charge of administrating the survey, while the length of the questionnaire was more or less the same (about 15 minutes).
Local Party Branches’ Response Rates
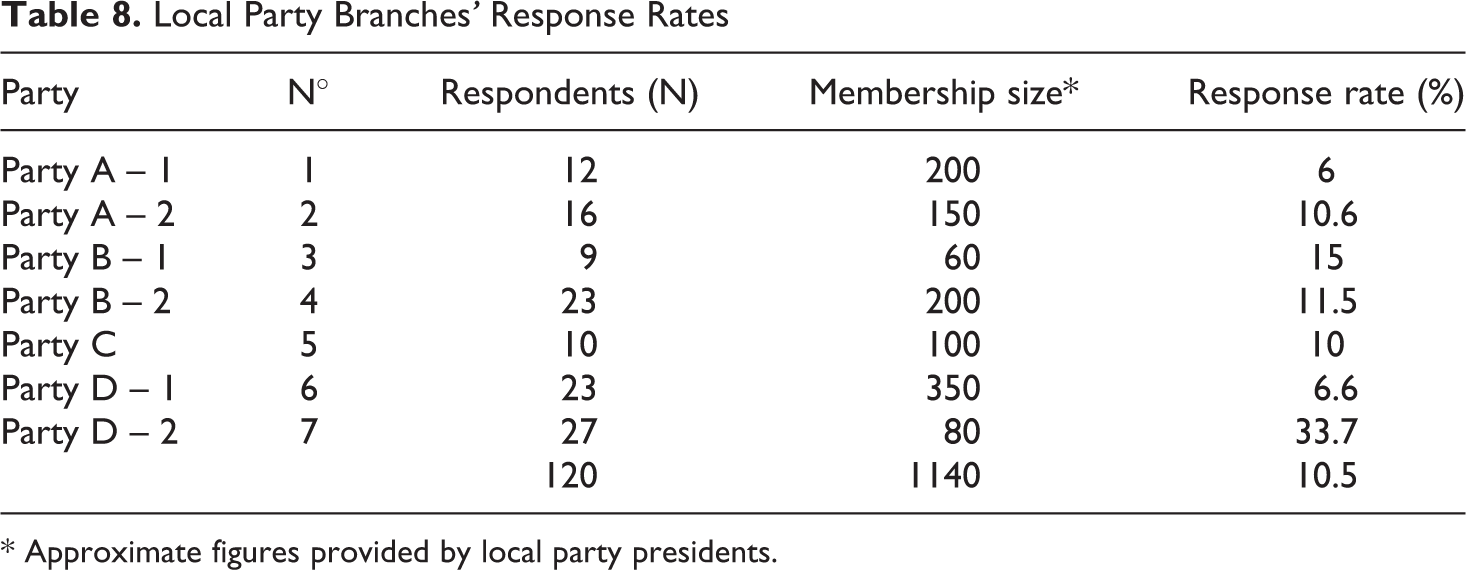
* Approximate figures provided by local party presidents.
As far as my questionnaire is concerned, in addition to modules collecting information about respondents’ socio-demographic profiles and level of participation in party activities (as well as more generally, their life inside the party), one of the central objects was precisely related to the generation of network data. If all party members are linked together by a common formal tie (their membership), which obviously states the boundary of my network (members affiliated via the local party branch under study), the theoretical argument supported by this chapter of my dissertation implied to grasp stronger connections among members, based on informal interactions outside their party, taken as proxy for friendship.
In order to do so, a ‘name-generator’ was designed. It aimed at capturing the social interactions and ties existing between local party branch members (network nodes). The question asked them to list the names of people that they knew before joining the local party branch. In practice, the questionnaire asked respondents to mention up to 10 other members of their local branch. To guarantee anonymity, they had to name people on a first name basis plus the first two letters composing their last name if they had similar first names in their roster. It is worth noting that network ties were considered as undirected: if one member named another member in the generator, the link was supposed to be reciprocal.
Once completed, these questionnaires were retrieved by online survey platform (Qualtrics) or by mail (pre-paid postage), and processed into a dataset. Information about the names and relations of party members were crossed in a square matrix for respondents belonging to the same local branch. It was then computed in a free network software (SocNetV), which allowed to produce network maps for each local branch (see one example in Figure 6), as well as export related basic network descriptive statistics (see Table 9).

Network Visualization of One Local Party Branch Under Study
Network Information
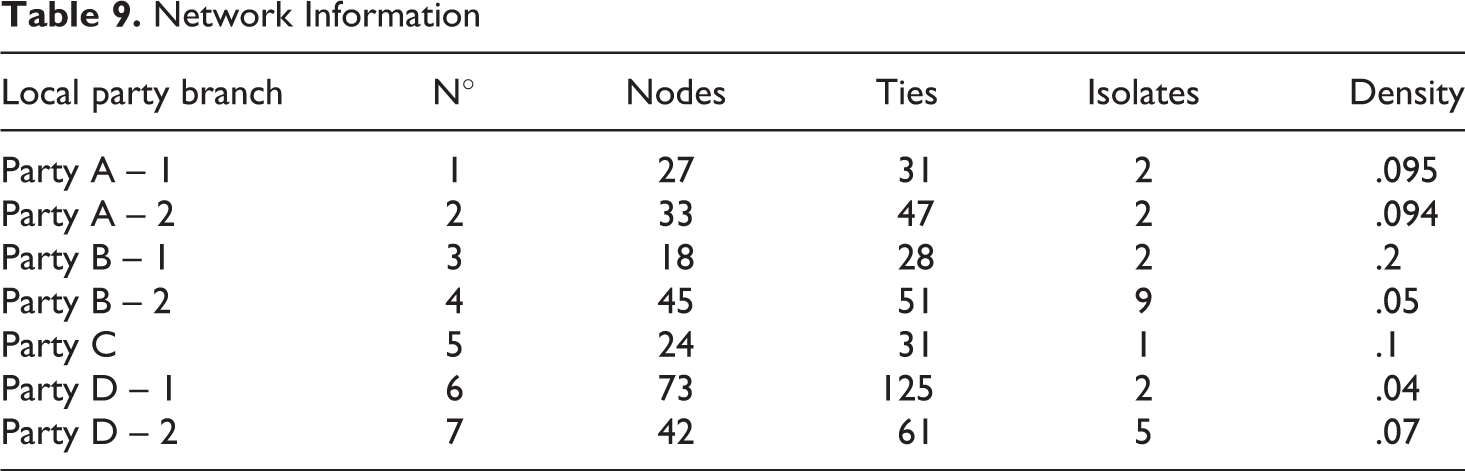
Some general observations can be made regarding the seven networks taken as a whole. In terms of structure, they were relatively low in terms of density (less than 0.1 – except for the smallest network, where density was higher: .2) and small in size: 37 nodes on average, among which a mean of 17 answered the survey, and for which I had complete information about their attributes. 8 In that regard, the composition was also rather limited regarding nodes’ profiles on the dependent variable. First, passive rank-and-file members who participate little or not at all in the inner life of the party and the local branch were more difficult to access, despite the online option for filling the questionnaire and the wave of online invitations sent by local parties’ presidents. Hence, those who did participate tended to be located at the periphery of the network or to turn into isolates. In fact, part of my field observation allowed me to acknowledge that the core of my networks were quite representative of the small ‘clique’ of local party activists overseeing the branch (basically what they called the local ‘committee’), as the people I had seen and heard about were generally part of the networks that I had drawn. Therefore, there is a bias in favor of respondents that were somewhat active, at least in local party activities. Second, regional and national party officials affiliated to the local branch under consideration were also more challenging to reach as survey respondents (they were also much less present in branch meetings). Nonetheless, some of their names came out from name-generators, but they were barely among the most cited, stressing more generally the social distance between party members active at the local level and higher elected officials.
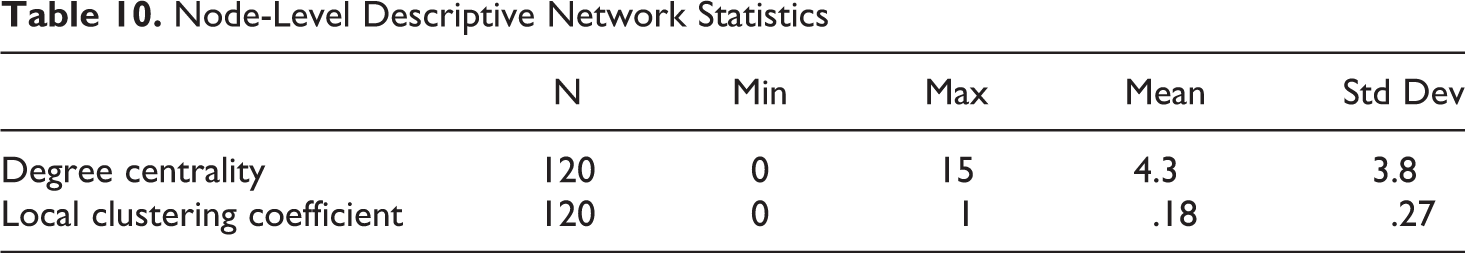
On the other hand, a second dataset was built to centralize only survey respondents’ information (N=120) about their sociological profiles (control), level of activism and involvement within the party (DV), as well as network indicators derived from the SNA performed on the network of their branch (IV). More specifically, I relied on two indicators that are used at the individual/node level for each respondent. First, there is the respondent’s position in the structure of the network (centrality). Centrality seeks to measure the contribution of a node to the whole structure of the network. There are many different ways in which a node can matter structurally: for example, a node matters if removing it would disconnect the network (betweenness centrality), or because a large number of ties involves that node (degree centrality). Centrality is consequently often used as an independent variable to predict positive or negative outcomes for individual nodes, such as the acquisition of wealth, status, influence, knowledge, life satisfaction, health and so on (Burt, 2000; Lim, 2008). For my analysis, I capitalized on degree centrality as a measure of informal social interaction and connectedness with other party members. Data show that my respondents were tied, on average, to 4 or 5 other members before they joined their local branch. The maximum value goes up to 15 people (see Table 10). Second, the local clustering coefficient measures the transitivity of each node’s proximate network, i.e. whether the alters’ node are also connected to each other. It ranges from 0, when they are all disconnected from each other, to 1 for a fully-connected sub-network, in which alters are all connected to each other, meaning that they knew each other before their membership. Respondents show low levels of clustering local coefficient (mean= .18), stressing once again the low-density features underlined at the structural level. It means that party members knew other members before they joined, but these persons do not seem to specially know each other (many unconnected triads, especially at the network periphery). This pattern might nonetheless be related to the low response rate and a lack of information about these potential ties.
Node-Level Descriptive Network Statistics

Regression Plot Between Degree Centrality and Party Activism
Multivariate statistics (see Appendix 1D) were run to link a member’s place within the network structure (degree centrality and local clustering) and his/her individual chance of being an active member, i.e. participating actively in very diverse sets of intra-party activities. 9 My dissertation gave empirical evidence to a significant role played by the position in the underlying ‘social structure’ (Krackhardt, 1987). It especially highlighted the members’ centrality in the process of becoming more active in the party, forming a kind of social foundation, essential to trigger the activism. Indeed, I showed that members who were strongly socially connected to their branch fellows before joining, tend to extensively take part in the full range of participatory opportunities provided by the organization. To account for this, I had first hypothesized that informal interactions outside an organization might be used to grasp friendship ties between members of this organization, which transcend the boundaries of the formal structure and link party members to each other outside the context of party activities. Hence, I argued that a better social connectedness and embeddedness with other individuals in the organization context provides individuals with social trust, support, and prestige (Krackhardt, 1992; Burt, 2000). This, in turn, stimulates political and civic skills, knowledge, and expertise, and ultimately, their participation (Diani, 2004; Lim, 2008) inside the party organization. In other words, I showed that members relying on a larger pool of friends with whom they share the experience of being members of the same party organization, have greater chances of being party activists, as by-product of increased social cohesion between them. It provides some empirical evidence pointing towards the relevance of the ‘strength of strong ties’ theory (Krackhardt, 1992; Kilduff and Krackhardt, 2008), but applied to the context of party organizations and regarding the process of activism.
Moreover, in multivariate models, the clustering coefficient appeared to be positively related to activism as well, but even more statistically significant when I distinguished between local and higher-level opportunities of participation. It means that the more a member has ‘friends’ in the party before joining, who, in turn, are also ‘friends’ and knew each other before their membership (higher density of the ego network), the more the activities undertaken at the national/regional level. It translates a situation of members for which the branch is a significant social base. They are particularly well embedded, rooted and integrated in their local organization and their party, as are their friends. Nonetheless, the branch in itself seems to be more a source of socialization than a source of genuine participation, as they have a tendency to favor higher party activities for being active. Turned the other way around, higher opportunities of participation seem to attract, to a larger extent, members with good social integration with their branch peers. More generally, these findings confirm the relevance of the party members’ network embeddedness for sparking intra-party activism. If networks are vital for recruitment, they are also important for discouraging exit and stimulating continued participation and satisfaction (Krackhardt and Porter, 1985), working also in the process of retention. Overall, mixing methodologically SNA with a more traditional statistical approach, this chapter empirically suggested that party members do not turn into activists on their own, as isolated islands; they do it in close interaction with other members. The social logic of politics (Zuckerman, 2005) is also at work within political parties.
Discussion: Networks and Participation, an Issue of Causality
Overall, the main contribution of my doctoral dissertation to the study of party membership and activism is that it pushes to bridge together two parts of the literature on political participation that tends to be isolated from each other. Indeed, my different findings have brought insights both to the supply and demand side of the phenomenon, considering at the same time the individual and the group/organizational dynamics behind the process of joining a party. Before concluding the paper, it seemed nonetheless important to discuss a few general issues related to the perspective of linking network and political participation in the way I did it.
One the one hand, I have to acknowledge that homophily is a complex network phenomenon. The impact of social networks on any behavior or attitude is something that is difficult to grasp because these sets of relationships among (sets of) actors do not form randomly (McPherson et al., 2001). Individuals are simultaneously ‘creators and captives’ of their social networks (Lazer et al., 2010). They intentionally generate their social networks through their social life (social selection), but these networks provide, in turn, constraints and opportunities on their social life (social influence). Huckfeldt and colleagues recognize the slippery and tricky nature of this dynamic process of co-evolution between individuals and networks in terms of political opinions: individuals tend to become more similar to, and to comply with their networks regarding political views, but they also look for politically similar others. Homophily is generally studied for its implication in terms of tie formation (social selection) and whether people sharing common features, or attributes, tend to form ties together and to cluster within social networks (‘birds of a feather flock together’). My dissertation assumed that homophily could be studied as an important factor, also playing in behavior formation (social influence) and whether citizens’ political behaviors are influenced by their social peers. The similarity/congruence existing in a network, meaning that ego (respondent) and alters (network peers) are similar on a given attribute (same views, values, opinions, socio-demographic profile, etc.) generates patterns that spark or impede party membership, also reversing the explanation for why people do not join and are not recruited by Belgian party organizations.
It is true though that this issue points toward the problem of chicken or the egg when trying to make networks intervene in our explanation of political participation: the politicization of the network can lead to more political participation, but more political participation can also lead to have a more politicized network. Disentangling the genuine causality here is a colossal effort for which adaptive tools need to be properly produced (e.g. via experimental design), and we admit having been mainly interested in one aspect of the causal arrow (i.e. ‘how my network influences my participation’).
Second, the name-generating procedure in large-scale survey suffers from one repeated critique: it is based on subjective information, elicited from the perception of one person (ego). Information about people who are named (alters) might lead, therefore, to inaccurate conclusions about them and their role. Nonetheless, I think that this main drawback must be addressed to account paradoxically for the procedure’s scientific relevance. Indeed, the rationale behind such network perspective is that these sets of relationships help people to make up their minds and change people’s beliefs or behaviors according to advice or information received within social networks. What actually seems to matter is more what respondents believe to know about their network members (normative attributes), and not necessarily what these persons know or are exactly (objective attributes). The process of influence and persuasion is not especially driven by real knowledge as social psychologists have frequently put forward (Cacioppo and Petty, 1984; Epley, 2014). More interestingly yet, some studies suggest that individuals tend to describe quite accurately their close environment in the name-generating procedure (Ikeda and Huckfeldt, 2001). The latter remains the ‘best practice’ in the field and a fairly reliable way to collect data on social networks in large-scale surveys (Perry et al., 2018). As suggested though, a few primary methodological considerations must be taken to ensure a good quality in the information obtained through it. Scholars have to reflect upon the ‘operational boundaries of the interpersonal environment’ (Marsden, 1987: 123), i.e. the interaction at the center of the analysis, the number of names that can be elicited from one respondent and thereby the amount of information to be provided about these people (respondent burden effect), or still, more technically, the way network questionnaires are administrated.
Conclusion
Social networks are intricate things of beauty. They are so elaborate and so complex – and so ubiquitous, in fact – that one has to wonder what purpose they serve. Why are we embedded in them? How do they form? How do they work? How do they affect us? (Christakis and Fowler, 2009: xiii)
This article put the emphasis on the methodological background of my PhD thesis, whose main inspiration to study members and activists of political parties has been found in diverse applications of Social Network Analysis (SNA). First, I explained the main lines of reflection guiding my thesis, as well as how and why SNA turned out to be a relevant method to apply in order to organize the theoretical meeting of social networks and party membership. In short, adopting SNA as a method, implies to assume strong theoretical assumptions, which helped me bridge the gap between individual and party-based explanations of party membership and activism. Second, through three different applications of this singular method, the article highlighted that the genuine methodological originality of my dissertation lied in using SNA as a preliminary tool for the literature review (1st application: bibliometric networks), or in mixing the perspective with more traditional quantitative survey methods (2 other applications) for two other empirical chapters.
In this conclusion, rather than summarizing any ‘findings’, I would like to address what I see as the two main weaknesses of my SNA applications. I want to do so because they actually embody very stimulating triggers, opening the path to further research opportunities. On the one hand, they are based only on static ‘snapshots’ in terms of data. Henceforth, acquiring temporal and longitudinal dimensions is a crucial issue for my future research. To better understand how network patterns affect citizens’ political behaviors (social influence), I strongly argue in favor of coordinating scholars’ efforts to reach panel network data collection, where different time points may be considered in the analysis. Hence, changes in the structure and composition of citizens’ social network might be analyzed in the light of the evolution of their political behaviors and attitudes, using dynamic network modelling. On the other hand, my SNA applications are rather descriptive. For instance, it is true, first, that I used bibliometric network analysis only to identify key authors in the field. Basic network and textual statistical insights could be explored more in depth, while the data might be used to perform more complex SNA. However, it was not my purpose, as the idea was more to see whether existing theoretical sub-groups might emerge also from bibliometric network patterns. Second, to overcome the descriptive nature of other SNA applications, I combined the method with traditional multivariate statistical analyses to fall more into a conventional explanatory design. In that regard, while the different quantitative analyses performed in my dissertation provided evidence that network variables can in themselves account for party membership and activism, extensive investigations intend to question whether they might play a significant role, especially among the ‘unusual’ suspects: do networks play a role in overcoming individual-level inequalities inherent to party membership and activism? Are they more effective channels of political recruitment for people that have less individual-level resources? Or in contrast, do they multiply and echo the inequalities, blocking the gate toward political organizations for low SES citizens? Moreover, the effect of networks could be investigated regarding other forms of participation and especially protest politics, where the usual profile differs somehow from party-related political activities (Marien et al., 2010). Finally, regarding the second and the third applications, some network scholars would argue that using SNA to export independent variables that are used in classic multivariate regression models is not SNA per se. The structure of my network data, nonetheless, allowed me to further investigate the effect of network structure and transitivity (open/closed triads) on the spread and diffusion of political behaviors, using genuine models of SNA and corroborating the overall findings (Paulis et al., 2017). Besides, I also intend to switch the scope of analysis from social influence to social selection and tie formation (whether party members tend to form ties and networks together), thereby bringing into my methodological box dynamic models of SNA (ERGMs) and closing the loop regarding the issue of endogenous causality inherent to research on social networks.
Supplementary Material
Supplemental Material, sj-pdf-1-bms-10.1177_0759106320939886 - Using Social Network Analysis (SNA) to Study Members and Activists of Political Parties
Supplemental Material, sj-pdf-1-bms-10.1177_0759106320939886 for Using Social Network Analysis (SNA) to Study Members and Activists of Political Parties by Emilien Paulis in Bulletin de Méthodologie Sociologique
Footnotes
Supplementary Material
The annexes cited in this article are available on the BMS website. They can be downloaded as ‘Supplementary Material’ attached to the article.
Acknowledgements
The author would like to thank Florent Gougou (Sciences Po Grenoble), the editors and the anonymous reviewers for their insightful comments.
Declaration of Conflicting Interests
The author declared no potential conflicts of interest with respect to the research, authorship, and/or publication of this article.
Funding
The author received financial support for the research under a PhD grant associated with the project ‘Members and Activists of Political Parties (MAPP)’, funded by the Fonds National de la Recherche Scientifique (FNRS) and supervised by Professor Emilie van Haute (Université libre de Bruxelles).
Notes
References
Supplementary Material
Please find the following supplemental material available below.
For Open Access articles published under a Creative Commons License, all supplemental material carries the same license as the article it is associated with.
For non-Open Access articles published, all supplemental material carries a non-exclusive license, and permission requests for re-use of supplemental material or any part of supplemental material shall be sent directly to the copyright owner as specified in the copyright notice associated with the article.