



Abstract
Work exclusion is often associated with lacking or having certain body functions and structures, that is, disabilities. There are various types of disabilities, including visual, hearing, physical, and intellectual. The focus of this paper is to examine whether different disability types concur with different likelihoods of work exclusion; this approach differs from that of current disability statistics, which, in effect, treat people with disabilities as a homogeneous group. The 2011 Irish Census microdata from the Integrated Public Use Microdata Series (IPUMS) International database are used, since the data include information about disability types and have a sufficient sample size for the analysis of disabilities from type to type. Although all the included disability types significantly increase self-reported incapacity, logistic regression analysis of the data shows that the odds ratios with the adjustment of some sociodemographic variables widely differ from one another, which demonstrates the need for a type-sensitive approach to disability statistics.
Introduction
This paper examines the statistical association of work exclusion and disability types. We adopt a type-sensitive approach that estimates the effect of each disability type separately, instead of the existing wholesale approach in current disability statistics that only compares persons with and without disabilities, thereby ignoring the different effects that disability type variables may have on employment. This analysis forms a part of social statistics; disability types are treated as sociodemographic variables that, together with education, gender and other variables, may affect the social standing of an individual.
Work exclusion has been a focus of social inquiries into disability issues, especially disability studies. Its main idea, the social model of disability, distinguished impairment (bodily defect and malfunctioning) and disability (the social disadvantage and exclusion that people with impairments experience), the latter of which centres around work disadvantages. The Union of the Physically Impaired Against Segregation (UPIAS), a British disability rights organisation that advocated the original social model, emphasised ‘the right to paid, integrated employment’ (UPIAS and DA, 1976: 15) for people with disabilities. Based on the assumption that ‘developments in modern technology have made it increasingly possible to employ even the most severely physically impaired people’ (UPIAS and DA, 1976: 15), the UPIAS blamed the incomes approach of other organisations (Disability Income Group and Disability Alliance) for justifying the dependence of people with disabilities. In developing the social model of disability, Michael Oliver (1990) identified the capitalist mode of production as the main cause of the social creation of disability. He suggested that the speed and production norms that modern factory labour imposes prevented people with disabilities from working, which resulted in their exclusion from other aspects of social life, e.g. institutionalisation. Deborah Stone (1984) also associated the social construction of disability with work. She argues that the disability category was constructed as a solution to the ‘distributive dilemma’ (Stone, 1984: 17) between the work-based and need-based systems of distribution. She also argues that since distributing solely in accordance with the work a person does cannot fulfil the needs of people who are deemed unemployable, people with disabilities were excluded from the labour force and placed in the need-based system, which is the origin of the disability category. Thus, in disability studies, exclusion from labour lies at the core of disability issues.
In light of the centrality of work in the context of disability, various national and international bodies collect statistics on the employment of people with disabilities. Although work disadvantages are not limited to unemployment, the first point we have to consider is how many people with disabilities are in any form of employment, given their overwhelming exclusion from the labour market. A background paper by the Organisation for Economic Co-operation and Development (OECD) (OECD, Directorate for Employment, Labour and Social Affairs, 2009), which is referred to by the World Report on Disability (WHO, 2011), remarks that among the member states, the employment rate of people with disabilities (in this case, people whose activities of daily living are hampered by their health condition) is just above 40% on average, while the rate for people without disabilities is 75%. The paper also finds that the unemployment rate of people with disabilities is almost twice as high as the rate for people without disabilities, based on the national surveys of the member states. Based on the 2011 ad hoc module of the EU Labour Force Survey, the European Union (EU) finds that the employment rate among persons who have basic activity difficulties (sight, hearing, walking, communicating, etc.) is on average less than 50% and is nearly 20% below the rate for persons who do not have such difficulties (Eurostat, 2018). The gap in the employment rate of the two groups varies between countries, from 37% in the Netherlands and Hungary to 2% in Luxembourg. The gap widens when another disability definition based on work limitations is adopted. The EU also gathers statistics on people registered as having disabilities (Shima et al., 2008). Some EU countries have employment quota schemes and sheltered employment systems that are based on national disability registers. According to the policy brief, the employment rate of registered persons with disabilities among the EU member states was the highest in Austria (54%).
In the United States, trends in the employment status of individuals with disabilities have been the subject of controversy regarding whether Title I of the Americans with Disabilities Act (ADA) (P.L. 101-336, as amended by P.L. 110-325), which prohibits employment discrimination on the basis of disability, actually achieves equal opportunities. Daron Acemoglu and Joshua D. Angrist (2001) used the 1988–1997 March Current Population Survey (CPS) data to conduct a regression analysis of weeks worked by individuals aged 21–58 years, adjusting for disability status, year, age, schooling, race and region, with year-specific interaction terms for disability, age, schooling, race, and region. The disability-year interaction dropped sharply after 1992, when the ADA came into effect, especially among men aged 21–39. Acemoglu and Angrist argue that the likely cause of the decline in disability employment is the ADA, which requires employers to make reasonable accommodations at their own expenses. The authors identify persons with disabilities by work limitations based on the following question: ‘Does [respondent] have a health problem or a disability which prevents him/her from working or which limits the kind or amount of work he/she can do?’ (Acemoglu and Angrist, 2001: 925). Douglas Kruse and Lisa Schur (2003) criticise this definition for not reflecting the ADA coverage; the ADA protects individuals with some ability to work despite their major life activities being substantially limited by impairments. Kruse and Schur analysed the Survey of Income and Program Participation (SIPP) data and argue that alternative disability definitions yield different results. For instance, after the ADA came into effect, employment situation has improved among persons with functional activity limitations (seeing, hearing, speaking, lifting, climbing stairs, and walking) that do not prevent work.
Although these analyses are important, they have some fundamental limitations. The work limitations definition is almost redundant in employment statistics; it is self-evident that people who have some form of work limitations (even with accommodations) are less likely to be employed. In other words, such a statement is almost tautological. In contrast, analysing the association between basic activity limitations and employment status is meaningful. However, the literature practically disregards heterogeneity in disability. Difficulties in seeing, hearing and walking may have different effects on employment status; some may concur with severe work exclusion while others may not, and some may actually be irrelevant. In other words, the social structure may attach various bodily conditions with different levels of relevance to participation. For example, ‘post-industrial society’ (Bell, 1973: 117), unlike industrial society, is characterised by the centrality of theoretical knowledge and by information rather than by energy. Based on this idea, it seems to follow that persons who have difficulty understanding the abstract are more likely to be excluded from social participation than others. Even if we do not accept Bell’s idea, or if we consider that the post-industrial and industrial elements actually coexist, heterogeneity in body-exclusion associations is still possible. Nevertheless, without exploring such a possibility, different disability types are merged into one disability category.
The solution is evident: disability type variables should be handled separately without being merged. This is feasible in large-scale survey data. If the sample size is 10,000 and the prevalence of a certain limitation is 0.5%, the number of observations will be 50, which in many cases may be insufficient to detect any significant association between the limitations and employment status. If the sample size increases to 100,000, there will be 500 individuals with the limitation, which is more likely to yield significant results. Although an individual researcher cannot usually conduct a survey of this scale, there are relevant datasets available for secondary analysis, which is attempted in this paper.
The results of the analysis provide a basis for disability policy. The data may indicate that heterogeneity among body-exclusion relations cannot be disregarded. In other words, it is possible that some bodily conditions are much more closely associated with work exclusion than others. If this is the case, intensive actions are demanded to include persons with such conditions.
Defining impairment and disability
To measure disability, it has to be well defined. However, existing frameworks fail to do this. This section highlights the flaws of the disability definition in the International Classification of Functioning, Disability and Health (ICF) (WHO, 2001) before examining a statistical operationalisation of an alternative definition.
The ICF defines disability as a health-related problem; it is an ‘umbrella term’ of impairments, activity limitations and participation restrictions (WHO, 2001: 3). The three aspects of disability are defined as follows: Impairments: problems in body function or structure such as a significant deviation or loss Activity limitations: difficulties an individual may have in executing activities Participation restrictions: problems an individual may experience in involvement in life situations (WHO, 2001: 10) Impairment is a loss or abnormality in body structure or physiological function (including mental functions). Abnormality here is used strictly to refer to a significant variation from established statistical norms (i.e. as a deviation from a population mean within measured standard norms) and should be used only in this sense (WHO, 2001: 213).
The ICF has become one of the dominant frameworks of disability theory. It is also considered a basis for disability statistics (WHO, 2015). However, Kenjiro Sakakibara (2016) highlights issues with its definition. He notes that the abovementioned definitions fail to draw a distinction between disability and other social problems, such as poverty and gender or racial discrimination. Social exclusion basically limits involvement in life situations and even in certain activities. The ICF could focus on health and impairment to distinguish disability from other social problems. However, they cannot form logical foundations. Health is defined by the World Health Organization as follows: ‘Health is a state of complete physical, mental and social well-being and not merely the absence of disease or infirmity’ (14 U.N.T.S. 185). Because social exclusion in general harms social well-being, it follows that social exclusion other than disability also accompanies ill health and is thus health-related.
The concept of impairment also has flaws: tail indifference and metric indifference. The former means that the definition lacks any indication of whether to focus on the upper tail or the lower tail of the distribution concerning body functions and structures. For instance, under the definition, a visual acuity of 6.0 can be called an impairment in a similar way as a visual acuity of 0.01 can be called an impairment. In addition, because the abilities of many professional athletes statistically deviate from the average, they can be considered to be impaired and as conducting training to exacerbate their impairment. However, such a definition of impairment is meaningless. In the final analysis, the definition requires value judgements for each tail of the distribution, which cannot be solely described by statistics.
The latter (metric indifference) means that the definition lacks any indication of which aspects of the body’s functions and structures are to be the focus. This issue leads to a statistical deviation in the ability to raise one’s eyebrows being treated as an impairment in the same sense as a deviation in the ability to move one’s hands, which is unrealistic. Thus, the ICF definition of impairment is defective because it unreasonably assumes the choice of a tail and the choice of metric. 1
As Jerome Bickenbach (1999) notes, rather than marginalising impairment, a disability definition needs to logically incorporate impairment to be distinguished from other social problems. In this regard, this paper adopts the following definition, which is based on Niklas Luhmann’s social systems theory and its accompanying constructionism. Disability: social exclusion attributed to a link between some fragmented body information and social treatments Social exclusion: general restrictions on participation or placement in one or more function systems, ephemeral or invariable, against an individual/individuals Fragmented body information: information in a social system referring to the human organism (including intellectual and mental aspects) of an excluded person (body information), which refers to a highly limited detail of body functions or structures, rather than to an individual as a whole Information: an event that selects system states
2
that is attributed to the environment by a system Social treatment: an action on a certain person/persons Attribution: identification by an observer of the selection of system states Impairment: the body information that constitutes a disability (Sakakibara, 2016: 146)
The aforementioned disability definition can be statistically operationalised as an association between a measure of social exclusion and a bodily condition presupposing numerous social treatments. Many different specifications are possible, and we can focus on different exclusion-related variables while the list of bodily conditions is indeterminate. This is not a defect, however. Disability takes various forms according to the social context; we may mention work disability and educational disability, but we do not have to suppose that they are equal to each other. In addition, different bodily conditions may become relevant in work and education. The indeterminacy of the list of such conditions is also realistic; in fact, from time to time, new impairments, e.g. many autistic spectrum disorders and learning disabilities, are added. Therefore, the list of bodily conditions must be open to changes. For these reasons, the operationalisation is acceptable although different specifications are allowed. It is necessary to report what exclusion measures and list of bodily conditions are used to derive the conclusion.
Here, disability is formulated as a statistical association. Whether an association exists may be judged based on the significance or strength of the relationship or an information criterion, which can be combined. The strength of association can be termed severity; severe disability is a strong statistical relationship between a social exclusion measure and a bodily condition. Severity in this sense can be applied to a comparison in a disability type (e.g. lower visual acuity may concur with a severer disability) or between disability types (e.g. a hearing disability may be severer than a taste disability), the latter of which is the focus of this paper.
Impairment is a bodily condition that constitutes the confirmed association. Bodily conditions on the list are not impairments per se; rather, they are ‘impairment candidates’ (Sakakibara, 2016: 373). All bodily conditions must undergo a statistical analysis to determine whether they actually relate to the exclusion measure in question.
Although social treatments form an important component of disability, disability statistics cannot identify all the relevant treatments. They range from others’ gaze on the micro level to enactment of laws such as the ADA on the macro level, and in many cases, one cannot help but consider these treatments to be a ‘black box’. 3 This is one reason the statistical analysis here is no more than correlational rather than causal. 4 A confirmed statistical association between a bodily condition and work exclusion does not necessarily mean that the former is the cause of the latter (e.g. impairment limits employability) or that the latter produces the former (e.g. unemployment harms health). Rather, such an association is based on numerous unspecified social treatments. We can assume an interaction of these treatments and the bodily condition have caused the exclusion. Such an assumption is the kind of attribution that constitutes a disability. Although statistical analysis cannot exhaust an infinite number of causal relationships full of unknown factors, it can make the abovementioned attribution seem more or less reliable to us by indicating the extent to which the bodily condition is relevant to the exclusion.
We focus on the lack of employment opportunities as a social exclusion measure. The UPIAS maintained that this is the fundamental exclusion that causes exclusion from other social areas. In particular, this paper analyses employment status, including unemployment and incapacity. This does not mean that the author assumes that employment is the only crucial type of exclusion that must be addressed or that employment status (working, unemployed, inability to work, etc.) is the only important aspect of employment. The scope of this paper is limited to disability in the context of employment status. Disability in other social areas (e.g. education, family) and other aspects of work (e.g. full-time/part-time and occupation) will be addressed in other articles.
Materials and methods
This paper analyses microdata for the Census of Population of Ireland, which was carried out in 10 April 2011 and contains seven impairment or basic activity limitation variables, as well as a sufficient number of cases. This survey was chosen to demonstrate what can be concluded from national census microdata that contain disability-related questions. Since many governments conduct censuses, we can perform similar analyses when variables concerning disability are included in the censuses. Moreover, the results of the analyses of different censuses can be compared if the censuses adopt common variables. Therefore, developing a census-based method can contribute to international disability statistics.
Ireland is a member state of the European Union (EU, 2018) and the Organisation for Economic Co-operation and Development (OECD, 2018). Ireland was named the ‘Celtic Tiger’ (Donovan, 2016: 1) when it enjoyed rapid economic growth during the mid-1990 s. However, the growth turned into a property bubble. From around the time of the bankruptcy of Lehman Brothers in 2008, Ireland encountered an economic and financial crisis (Donovan, 2016). It entered into a troika programme consisting of the European Commission, the European Central Bank, and the International Monetary Fund (Joint Committee of Inquiry into the Banking Crisis, 2016). The Irish economy began to recover in 2013 (Donovan, 2016: v). After the downturn between 2008 and 2010, the real gross domestic product (GDP) increased in 2011, the survey year, although it was still influenced by the economic crisis. In 2011, the unemployment rate had almost peaked at over 14% (Donovan, 2016: 2). Consequently, an analysis of the census of this year may yield different results from those of many other years. However, the results cannot be dismissed as an anomaly; circumstances in the period of depression may better reflect the disabling social structure, e.g. last hired and first fired.
Ireland adopts both the antidiscrimination approach and the quota approach regarding disability employment in the public sector. The Employment Equality Act of 1998 bans employment discrimination on the grounds of disability, along with gender, age, religion, etc. (Government of Ireland. Oireachtas, INT.b). In addition, Ireland sets a disability employment target of 3% in public bodies, for which Part 5 of the Disability Act of 2005 provides a legal framework (Department of Justice, Equality and Law Reform, INT.; Government of Ireland. Oireachtas, INT.a; National Disability Authority, 2012). In an ad hoc module of the EU Labour Force Survey in 2011 (Eurostat, 2018), the unemployment rates of persons both with and without difficulty in performing basic activities (17.9% and 14.8%, respectively) are higher than the corresponding average unemployment rates of the countries in the EU-28 (12.1% and 9.6%, respectively). According to the data, the inactivity rate of persons with difficulty performing basic activities is over 60%, while that of persons without difficulty is below 30%.
The report of the National Disability Survey (Central Statistics Office, 2010) provides more detailed information about the impact of bodily conditions on work exclusion. This survey was conducted in 2006 by the Central Statistics Office of Ireland following the 2006 census. Among individuals who reported one or more bodily limitations in the census (370,500), 14,518 persons were interviewed in the National Disability Survey. The survey report provides tables regarding their employment status. For instance, among adults whose disability limited or affected them before 65 years of age, the rate of persons who are working, unemployed, and unable to work are 16.8%, 4.0% and 48.0%, respectively. These figures are grouped by gender and age in one table and by disability type in another. However, these variables are not simultaneously entered into a multivariate model, meaning that gender and age are not controlled for in the association between bodily conditions and employment status. Consequently, a problem of confounding factors is possible; the apparent lower employment rate of persons with a bodily condition may actually be linked with, for example, their older mean age instead of the bodily condition itself. To avoid such a problem as much as possible, this paper conducts multivariate analysis and assesses the effect of disability type on work exclusion by adjusting for other conditions.
The census covered all persons present in Ireland on the census night (Minnesota Population Center, INT.). Enumerators delivered blank questionnaires and recorded details about households (Central Statistics Office, 2012: 115). Three types of questionnaires were used: the household form, the listing form, and the individual form. The microdata were based on the household form (Minnesota Population Center, INT.).
The microdata are obtained through the IPUMS International database (Minnesota Population Center, 2017). The data are a 10% random anonymised subsample including 474,353 cases from the entire population (4,588,252). There were 303,773 persons of working age (age 15–64) present on the census night. From these individuals, 286,845 valid responses were obtained (i.e. no variables in the logit models below are missing).
A multinomial logistic regression analysis was conducted using R. The dependent variable was self-reported employment status, which was categorised as follows:
Working for payment or profit Looking for first regular job Unemployed Student or pupil Looking after home/family Retired from employment Unable to work due to permanent sickness or disability Other (Central Statistics Office, 2011, Question 27)
The options other than option 1, and especially options 3 and 7, are possible for a person with some bodily limitations who is not employed, which is addressed in this analysis.
As previously discussed, disability type variables were entered into the logit models separately as independent variables. The following disability-related question was asked:
Do you have any of the following long-lasting conditions or difficulties?
Blindness or a serious vision impairment Deafness or a serious hearing impairment A difficulty with basic physical activities such as walking, climbing stairs, reaching, lifting, or carrying An intellectual disability A difficulty with learning remembering or concentrating A psychological or emotional condition A difficulty with pain, breathing, or any other chronic illness or condition (Central Statistics Office, 2011, Question 16)
The possible responses are dichotomous: ‘Yes’ or ‘No’.
There are slightly different wordings in the questionnaire text; (c), (e), and (g) refer to ‘difficulty’, while (a), (b), (d), and (f) use diagnostic categories. Although such a difference is undesirable, there are few censuses with unified terminology whose microdata are available at present. Washington Group (INT.) formulated short and extended question sets regarding difficulties in performing basic activities. The Model Disability Survey proposed by the World Health Organization (INT.) provides a more detailed example of disability-related questions, including the specific weight a person can lift and the distance a person can walk. However, before such a standardised terminology becomes widespread, it is still meaningful to analyse the effects of each variable in the Irish census. We can estimate the associations between bodily conditions and employment status. We note that estimation and comparison are bound to the wording used, e.g. ‘a physical impairment’ could yield a different result from ‘a difficulty with basic physical activities such as walking …’, although, for the sake of brevity, the impairments in the questionnaire are referred to as visual, hearing, physical, intellectual, learning, psychological-emotional and other.
People who have certain bodily conditions and people who do not may also differ in other attributes. For instance, it is likely that persons with physical impairment tend to be older. Some attributes may themselves affect participation in work by placing a person in a socially disadvantaged status. In the data analysed, age (continuous), gender (men/women), education (primary, lower secondary, upper secondary, third level (non-degree) and third level (degree or higher)), religion (Roman Catholic, Church of Ireland/Protestant, other stated religions and no religion), ethnicity (Irish or Irish traveller and other stated ethnicity) and language ability (can/cannot speak Irish) can be such attributes and were adopted as control variables. By adjusting for these factors, we could approach the net correlation of the disability type variables on work exclusion. However, among the control variables above, education may constitute a component of the social disablement processes in which disabled people are excluded, i.e. persons who acquire some bodily conditions when they are young are likely to be first excluded from education and then from work. In this case, both the direct effects of disability type variables and the indirect effects via education are of interest.
These variables were entered into logit models. Dummy variables were made for categorical variables. Different models were applied. Models 1 and 2 were simpler, as adjustments were made for only gender, age and bodily limitation variables. These models were adopted as a basis for the future comparison of different countries; since age and gender are available in most census microdata, similar models can be applied to the data, provided that body-related variables are incorporated. Model 3 is a more detailed model with all the aforementioned control variables entered. This model was adopted to further explore the structure of disablement in Irish society.
Model 1 is a binomial model that predicts a ‘working’ dummy variable, whereas Models 2 and 3 are multinomial models with ‘working’ as the reference category. The binomial model is easy to apply to many datasets. On the other hand, the multinomial models enable an in-depth analysis of non-working categories. In particular, unemployment and incapacity can be distinguished in these models. Although they are both non-working categories, they have different implications and should be discerned in a detailed analysis. In models 2 and 3, only persons who were working, unemployed or incapacitated were considered.
Categorical variables including education were used as dummy variables. Regarding age, a squared term was entered into the models to better fit the curves of employment status, illustrated in Figure 1. The significance of the three models is indicated by likelihood ratio tests, and their improvement on intercept models is represented by the AICs.
Employment status by gender and age group.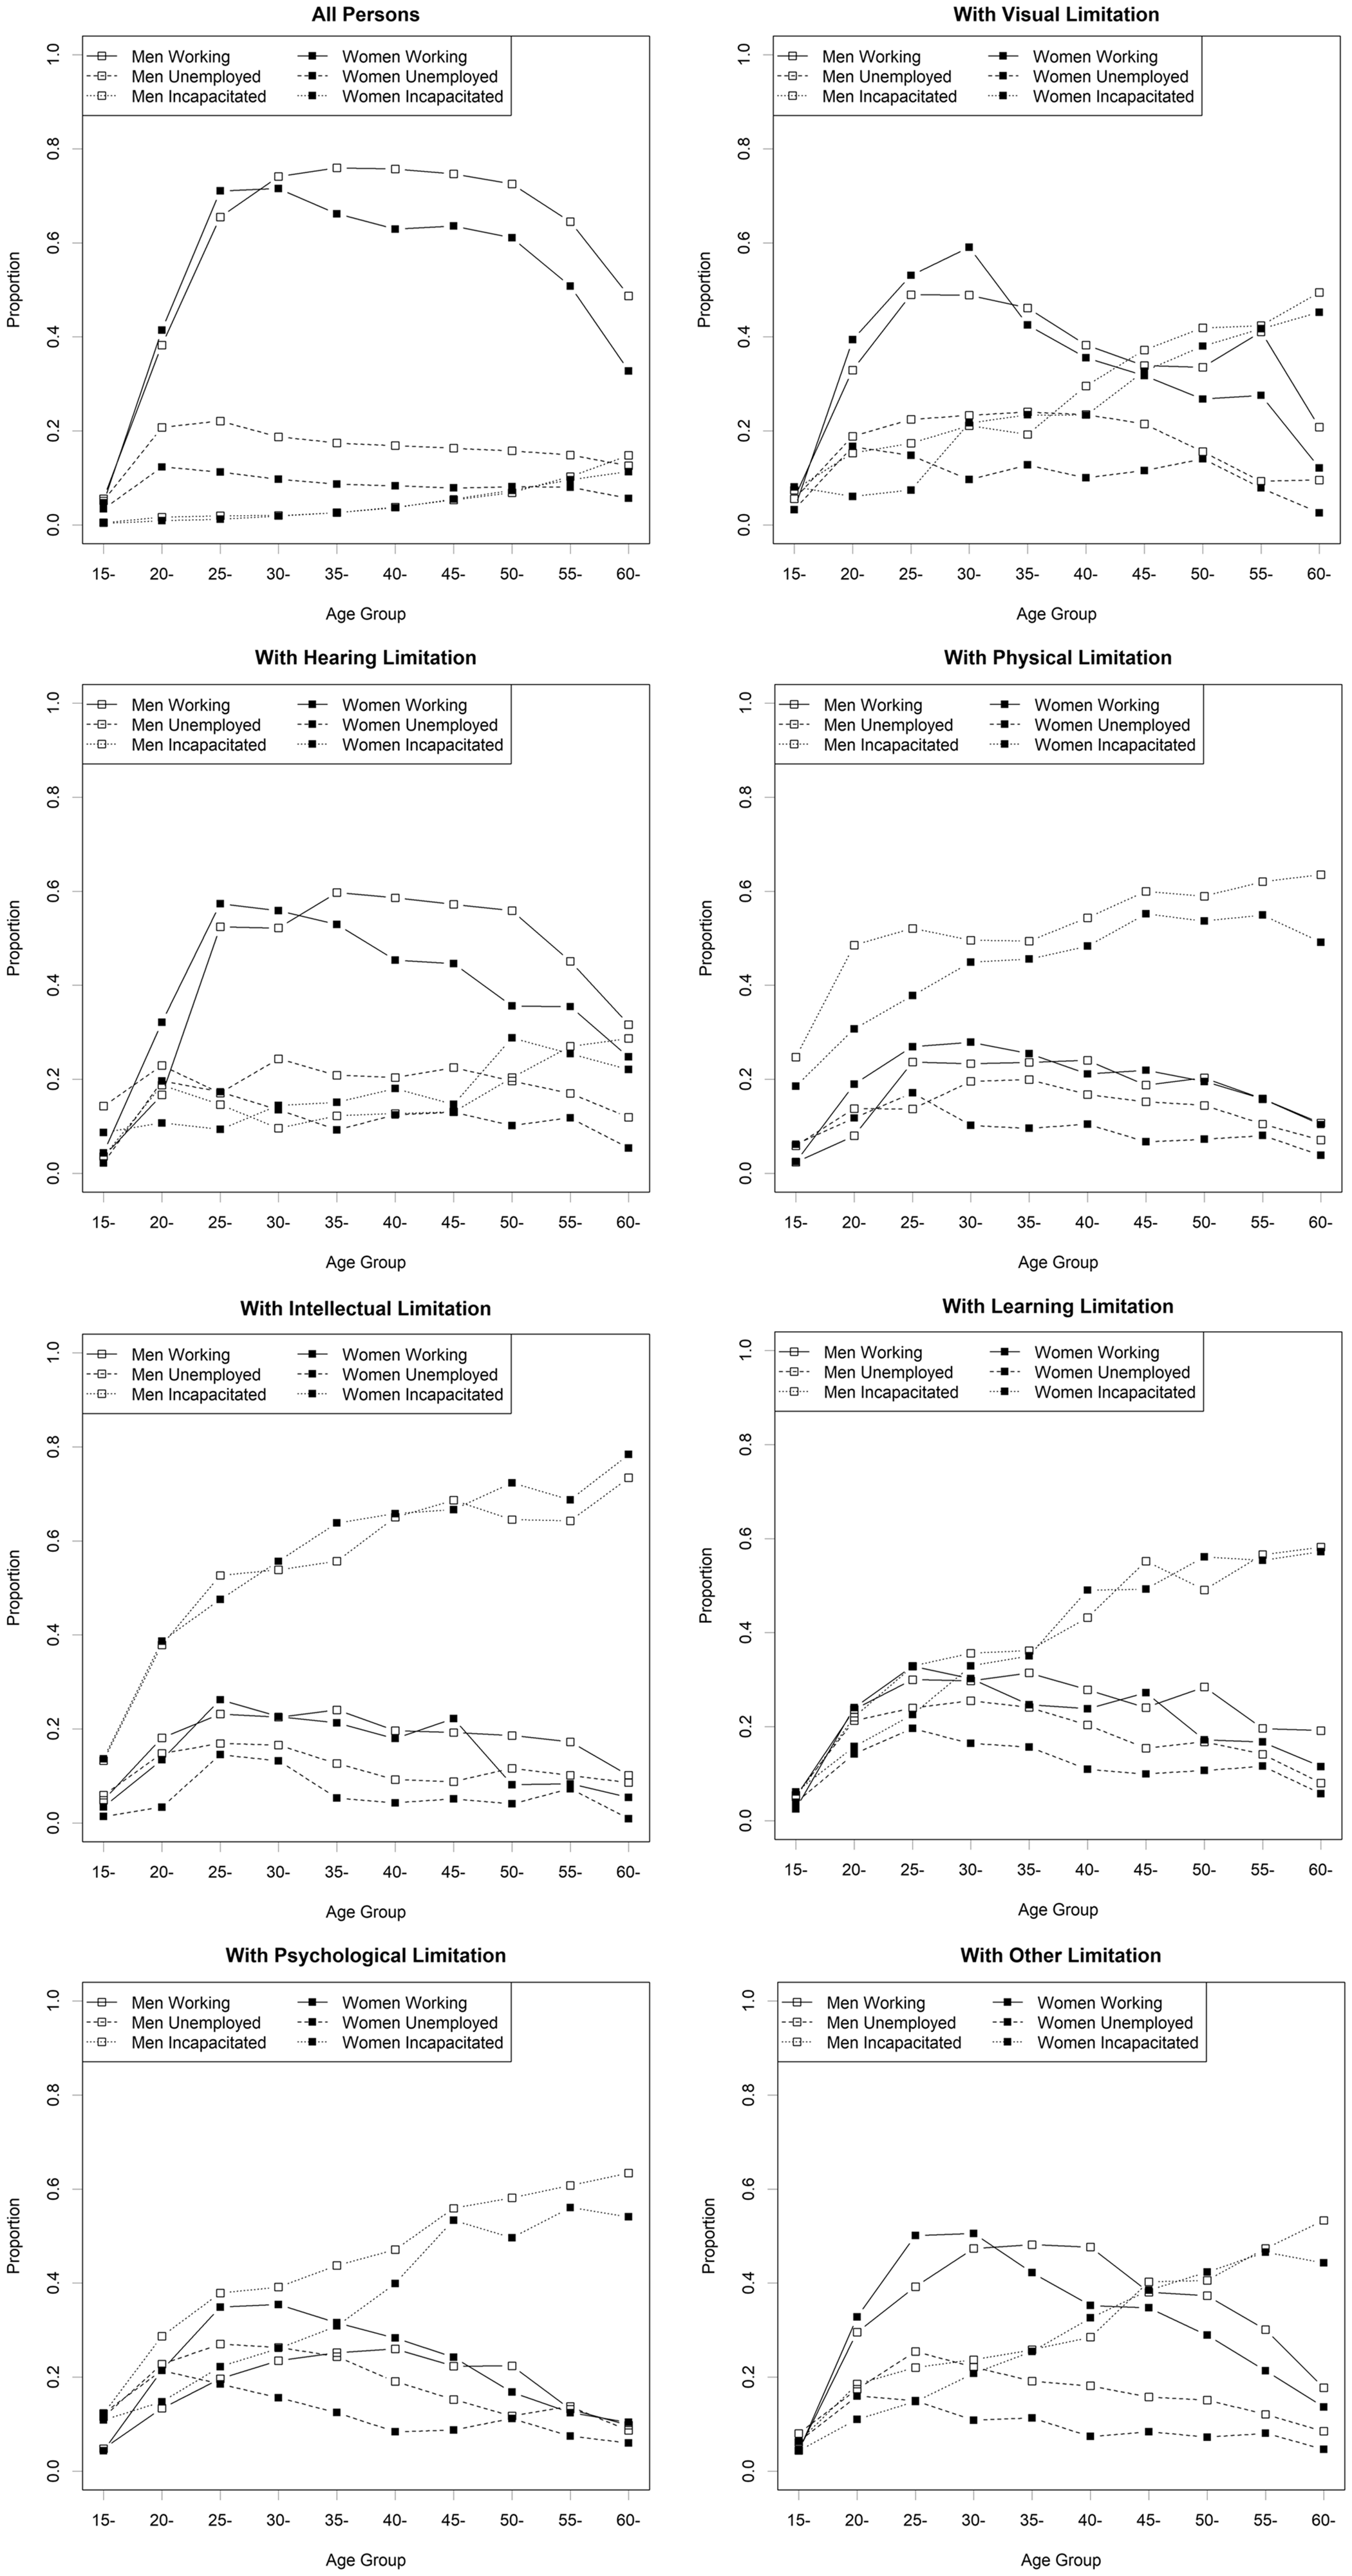
Results
Basic statistics by disability type.

The table suggests that people with the conditions surveyed, especially physical and intellectual limitations, were less likely to be working than the population mean. For self-reported unemployment rates, a clear overall tendency among persons with and without the limitations above is not evident, at least in this table. On the other hand, the rate of persons who describe themselves as ‘unable to work due to permanent sickness or disability’ (‘incapacitated’ in Table 1) is dramatically higher among persons with the aforementioned limitations, especially physical and intellectual limitations than the population mean.
Sociodemographic attributes other than employment status are also included in Table 1. The mean age is younger among persons with intellectual and learning limitations and older among persons with other limitations. Persons with limitations, and in particular, those with intellectual and learning limitations, are less likely to have completed higher education (tertiary-level education with a degree or higher). To adjust for these differences in sociodemographic variables, we conducted a multivariate analysis.
Figure 1 illustrates the rate of those who responded that they are either working, unemployed, or unable to work due to sickness and disability (denoted as ‘incapacitated’ in the legends) by gender and age group. The rate of working men with and without bodily limitations in their 30 s, 40 s, and early 50 s was over 70%, with the 35- to 39-year age group having the highest rate (75.94%). The corresponding rate among women reached a peak (71.54%) in the early 30 s and dropped to approximately 10% lower than the rate among men in the older age groups. The self-reported unemployment rate is higher among men than among women; in the 20- to 29-year age groups, the rates are approximately 20% for men and approximately 10% for women. The incapacity rates do not exceed 5% in younger age groups and for the early-40 s age group.
Overall, the employment rate among persons with some bodily limitations was lower. The highest rates for men and women, respectively, for specific limitations were as follow: 48.98% and 59.03% for visual limitations, 59.71% and 57.33% for hearing limitations, 24.03% and 27.89% for physical limitations, 24.05% and 26.21% for intellectual limitations, 31.43% and 32.84% for learning limitations, 26.01% and 35.43% for psychological limitations, and 48.17% and 50.53% for other limitations. The highest unemployment rates for each gender and limitation are approximately 10–20%. The incapacity rates are much higher among people with limitations. For instance, among men and women in their late 30 s, the incapacity rates were, respectively, 19.23% and 23.40% for visual limitations, 12.23% and 15.13% for hearing limitations, 49.39% and 45.59% for physical limitations, 55.70% and 63.83% for intellectual limitations, 36.19% and 35.07% for learning limitations, 43.76% and 30.89% for psychological limitations and 25.84% and 25.43% for other limitations. Regarding physical and intellectual limitations, the incapacity rates are higher than the employment rates for all gender and age groups.
Logistic regression analysis of employment status.
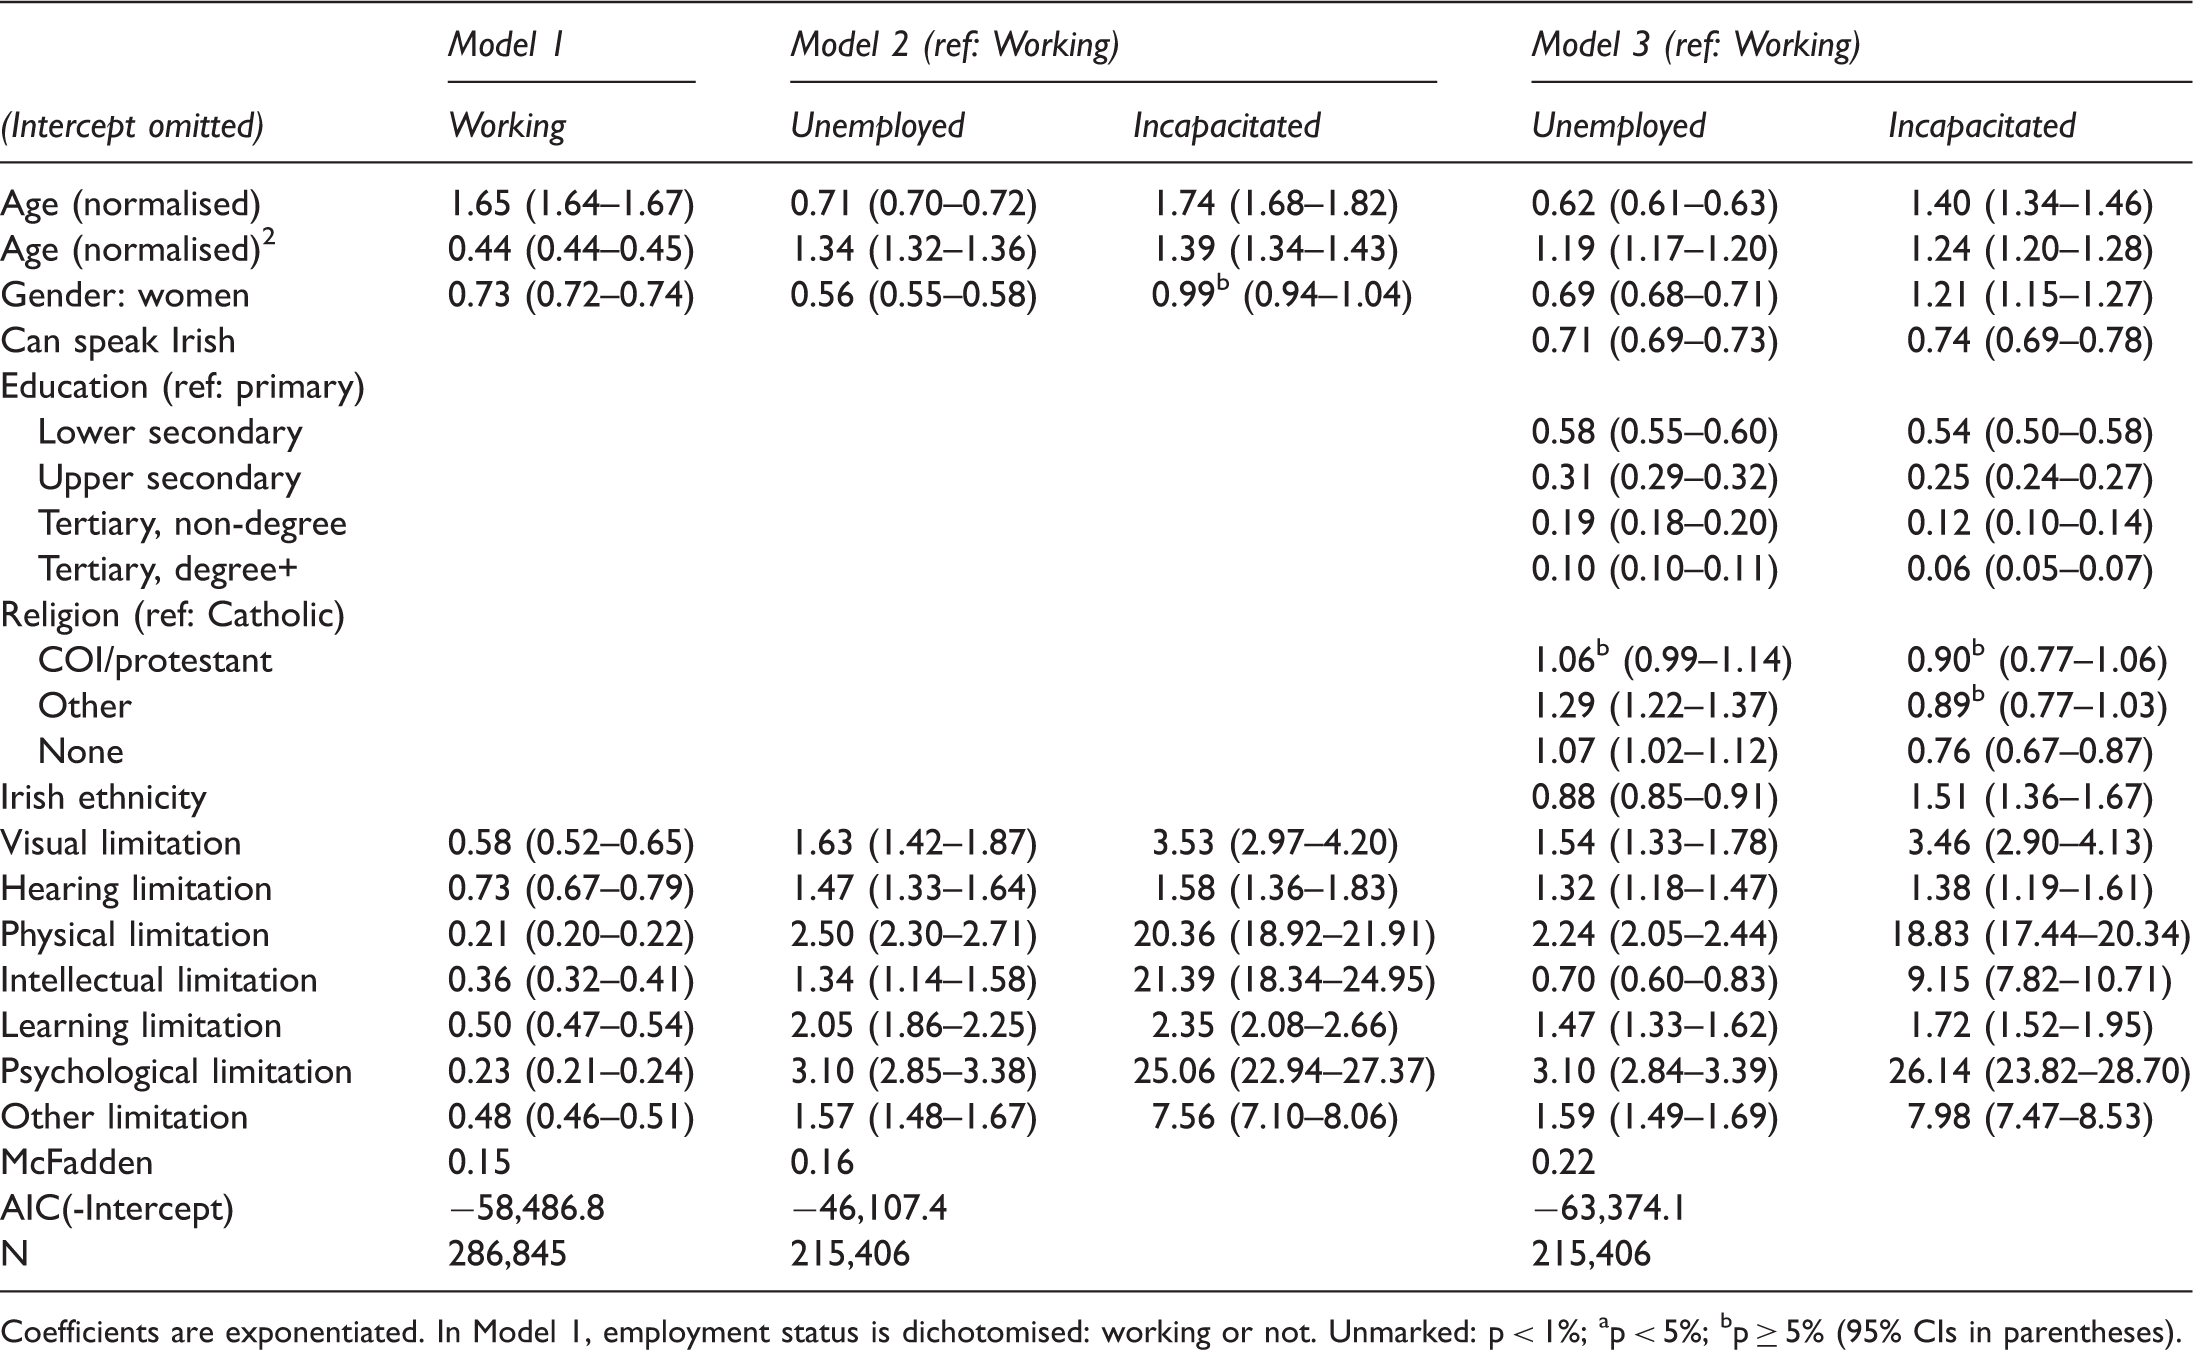
Coefficients are exponentiated. In Model 1, employment status is dichotomised: working or not. Unmarked: p < 1%; ap < 5%; bp ≥ 5% (95% CIs in parentheses).
In Model 2, the adjusted odds ratios regarding unemployment/working and with/without limitations range from 1.34 for intellectual limitations to 3.10 for psychological-emotional limitations. On the other hand, the incapacity (an inability to work due to sickness or disability)/working odds ratios are higher, ranging from 1.58 for hearing limitations to 25.06 for psychological-emotional limitations. All the adjusted odds ratios regarding unemployment/working and incapacity/working exceed 1 and are significant. The incapacity/working odds ratios are high for psychological-emotional, physical, and intellectual limitations. 6
Model 3 controls for more social status variables. The adjusted odds ratios regarding unemployed/working and educational levels decrease as the educational level increases. The same tendency can be found in the ratios regarding incapacity/working and educational levels. With regard to bodily limitations, unemployment/working odds ratios range from 0.70 for intellectual limitation to 3.10 for psychological limitation. On the other hand, incapacity/working odds ratios range from 1.38 for hearing limitation to 26.14 for psychological-emotional limitation. Although psychological-emotional, physical, and intellectual limitations rank high in incapacity/working odds ratios, the ratio for intellectual limitations (9.15) is somewhat lower.
Although this paper is basically based on complete-case analysis, to consider the information of missing data, inverse probability weights were calculated using logit models and were utilised in the analysis of Model 3. 7 The unemployment/working odds ratios for all variables and the incapacity/working odds ratios for control variables remain almost unchanged (approximately 0.01 at maximum). Some of the incapacity/working odds ratios slightly increase, e.g. from unweighted 9.15 to 9.63 for intellectual limitation, from 18.83 to 19.18 for physical limitation, and from 26.14 to 26.29 for psychological limitation. Overall, however, the effect sizes are not considerably changed by weighting.
Model 3 without the age terms was estimated with age groups 15–34, 35–54 and 55–64 years to examine the possibility of an age-limitation intersection. Age-specific coefficients include both positive and negative values with one category only (the unemployment/working odds for intellectual limitation), which is not significant; in other categories, the tendency is consistent (e.g. 1.47, 1.6 and 1.43 for learning limitation for each age group). The sizes of the age-specific coefficients for each limitation category also resemble one another. Although the sizes of the age-specific coefficients change considerably when the effect sizes are large overall (e.g. 30.15, 21.15 and 14.00 for physical limitation for each age group), it remains quite large. In light of these points, age-limitation intersection is disregarded in what follows.
Now we must assess the difference made by grouping disability types together. The limitation variables in Model 2 were integrated into one dichotomous variable (with/without one or more of the limitations). The unemployment/working and incapacity/working odds ratios for this category were estimated as 2.16 and 52.43, respectively. One reason the latter is so large is arguably the existence of multiple limitations, whose total effect roughly corresponds to the effects of all limitations multiplied. To address this problem, the number of reported limitations was used instead, and the estimated odds ratios were 1.95 and 9.14. The latter falls roughly in the middle of the incapacity/working odds ratios for hearing limitation (1.58) and intellectual limitation (21.39), yet it differs from both ends of the range (1.58–21.39) too widely to be representative.
Discussion
The bodily limitation variables adversely affect employment status by increasing unemployment and incapacity in comparison with working status. In particular, the variables are more closely associated with incapacity. The effects of the variables on the unemployment/working odds are comparatively weak. Although unemployment and incapacity are common in that they refer to the status of not working, they are different in that self-reported unemployment indicates that the respondent feels that s/he (or a family member) is an active member of the labour force, whereas self-reported incapacity indicates otherwise. Thus, the exclusion accompanied by bodily limitations is mainly exclusion from active participation in the labour force.
Although bodily limitations and self-reported incapacity are associated, the strength of association varies widely by type of bodily limitation. Physical, intellectual, and psychological-emotional limitations dramatically increase the incapacity/working odds (nearly 20 times at maximum). Hearing limitations do so only moderately, although tens of percent increase is still influential. This reveals the heterogeneity of disability, which is lacking in a statement such as ‘people with disabilities are 52.43 times as likely to be inactive’. Although such a general statement is not always meaningless, the cross-impairment estimate may or may not be representative, and the representativeness must first be assessed by the type-sensitive approach adopted in this paper. When the effect size of disability types is extremely different, the general statistic is not quite representative. According to the results, the effects on incapacity vary too tremendously to be integrated, at least based on the 2011 Irish data and the analytical strategies adopted here.
In addition, if some bodily limitations are reverse-correlated with exclusion (i.e. exclusion is alleviated) or are not correlated significantly, they are no longer impairments. Within this framework, the successful inclusion of persons with certain bodily limitations can be observed in two ways. First, as stated above, bodily limitations are no longer significantly and strongly correlated with work exclusion and thus is no more impairment. This does not deny continuing data collection about this bodily limitation in order to check if it will not be correlated with work exclusion again. Second, if we have to synthesise the results into a general statistic for convenience, the statistic has to reflect the number of people with impairments (i.e. bodily limitations correlated with work exclusion) as well as the average effect size. Such a statistic can indicate the progress of inclusion through the decreased number of people with impairments; if persons with a certain bodily limitation came to be successfully included at work, they can be dropped from impairment category.
Psychological-emotional, physical, and intellectual limitations have the strongest correlation with incapacity. Although persons with physical limitations tend to be older, the analysis indicates that age is not the only factor in the strong association between physical limitations and incapacity. Even when controlling for the age-related effect, which increases with age for the most part, physical limitations have a high correlation with incapacity, meaning that physical disability still exists after the adjustment.
On the other hand, the odds ratio concerning intellectual limitations in Model 3 is much lower than that in Model 2, albeit still high. The cause of the gap may be the indirect effect of intellectual limitations on employment status via education. In a fourth model, in which only educational dummy variables are added to Model 2, the odds ratio concerning intellectual limitations and incapacity/working is 9.55 (8.16–11.17), which was closer to the estimated ratio in Model 3 than in Model 2. Although a path analysis has yet to be conducted, the aforementioned result suggests that there are chain effects in disability, or so-called ‘accumulated disadvantages’ (Hoshika, 2007: 200); exclusion in a social context associated with bodily limitations in turn leads to exclusion in another context. Conversely, whereas the coefficients for the bodily limitation variables in Model 3 are instrumental in the exploration of the structure of social exclusion, they may underestimate the overall effect of the limitation variables.
The gap between models with and without educational adjustment is probably most evident in intellectual limitations because this limitation is mainly congenital or acquired during school age. Persons with other limitations are supposed to be more heterogeneous, with limitations acquired later accounting for a greater proportion of such individuals. Although it would be desirable to consider the age at which a limitation was acquired, such information is not contained in the survey.
Conclusion
The bodily conditions, which have traditionally been treated as ‘impairments’, are certainly impairments, and their association with exclusion from the labour market means that disability as a type of social exclusion still occurs. In other words, barrier removal in a broad sense is unfinished, at least in Ireland; people with certain bodily conditions are still hindered from full participation in society. Even physical limitations, which was the original focus of the social model of disability, remains a severe impairment, i.e. strongly associated with social exclusion. Disability is yet to be eliminated. 8
The data indicate that incapacity is a primary problem in disability issues. Although it may appear to be a voluntary withdrawal from the labour force, the collective tendency towards reporting incapacity is certainly a type of social exclusion that operates before the willingness to work comes into action. This type of exclusion is the strongest in that it is the least likely to encounter resistance.
Many people who consider themselves to be incapacitated can receive disability pension. Thus, they somehow manage to be included in the economy and other social areas. However, this does not deny that they experience grave work exclusion. Disability pension in the case of incapacity does not eliminate the deprivation of employment opportunity per se.
Although disability can be operationalised as the association between social exclusion measures and bodily conditions presupposing numerous social treatments, we cannot disregard heterogeneity in disability, including variety by type. It is no longer justifiable for statistical analyses to bundle different disability types into one category without careful examination. Although work limitations can cross disability types, it cannot be a reliable explanatory variable (Kruse and Schur, 2003:35ff.). Disability statistics should examine the relationship of each type of bodily condition to exclusion, whether objectively or subjectively.
Indeed, the analysis in this paper reveals remarkable heterogeneity. As mentioned above, psychological-emotional, physical and learning limitations are closely connected with self-reported unemployment, and psychological, intellectual and physical limitations are correlated with self-reported incapacity, even after the enactment of disability equality legislation. Based on the significance of physical limitations, this result cannot be completely explained by the aforementioned post-industrial hypothesis, although it partially describes the exclusion against persons with intellectual limitations. At any rate, the heterogeneity implies that more needs to be done about the most disadvantaged conditions. For instance, the public sector can allot additional employment quotas for persons with these conditions as a positive action. In addition, presenting diverse model cases of employment concerning these limitations might remain to be meaningful in addressing work incapacity; such examples would help people recognise that in many cases, individuals with specific limitations are actually able to work. The type-sensitive approach adopted here can inform us about which disability type should be focused on in disability inclusion policy and to what extent.
This paper has the following limitations. First, although it focuses on employment status, work exclusion and social exclusion in general are not reduced to the type of employment status variable referred to in this paper. Differences between a full-time job and a part-time job, as well as the type of occupation, are relevant. Second, there are only limited numbers of types of disabilities in the data. National census questionnaires are usually limited and cannot include a variety of disability types. Although health-specific surveys can somewhat increase the number of disability types assessed, we must also develop a subjective approach (Sakakibara, 2018) that can address a much longer list of conditions. Third, this paper depends on dichotomous variables concerning bodily conditions, and the data do not contain further information, e.g. visual acuity. We expect further breakthroughs in this field that overcome these limitations.
Footnotes
Acknowledgements
The author wishes to acknowledge the statistical office that provided the underlying data making this research possible: Central Statistics Office, Ireland. The author is also grateful to the Minnesota Population Center, which manages the IPUMS International database.
Declaration of conflicting interests
The author declared no potential conflicts of interest with respect to the research, authorship, and/or publication of this article.
Funding
The author disclosed receipt of the following financial support for the research, authorship, and/or publication of this article: This work was supported by JSPS KAKENHI (Grant No. 18K12950).