
Abstract
Although there is much research on School-Wide Positive Behavioural Interventions and Supports (PBIS) in the United States, there is little such research in Canada. The purpose of the current study was to provide a case study example of the relation between implementing PBIS and student academic and behavioural outcomes, as well as student perceptions of the school environment. Data were collected in one school as it moved from partial to full implementation of PBIS. The results of the study indicated positive academic and behavioural outcomes for students, as well as increased perceptions of safety, understanding of school expectations, and decreased perceptions of bullying. The results of this study are discussed with implications regarding PBIS in Canada and the importance of fidelity of implementation of school-based interventions.
Rates of problem behaviour and violence are increasing among youth in Canada, presenting classroom teachers with additional challenges in an already demanding role (Day, Golench, MacDougal, & Beals-Gonzalez, 2002). Furthermore, recent research (Pickett, Iannotti, Simons-Morton, & Dostaler, 2009) indicates that rates and patterns of physical aggression in Canada mirror those in the United States, where aggression among youth has been described as a public health concern (Hamburg, 1998). Problem behaviours, such as physical aggression and harassment, are not only disruptive to the teaching environment, but also lead to an increased likelihood of negative outcomes for students, such as mental health problems, violent crimes, school dropout, and alcohol and drug abuse (McCurdy, Mannella, & Eldridge, 2003; Tremblay et al., 2004). Research shows that the school social environment can act as either a protective or risk factor for problem behaviour, and it is therefore important that schools focus on promoting a positive social culture (Pickett et al., 2009). An approach that is growing in use in Canada to address these challenges and increase the social and academic success of students is School-Wide Positive Behavioural Interventions and Supports (PBIS; Chapman & Hofweber, 2000; McIntosh, Bennett, & Price, 2011).
PBIS
PBIS is a systems-level approach that is used in schools to build a positive school culture and support the teaching and learning environment for all students and teachers in a school. In contrast to a structured or manualized program, PBIS is used as a framework to guide schools in choosing practices to encourage success of all students. School teams select practices that are evidence-based and will meet the unique needs of the school (Sugai & Horner, 2009).
The three-tier model of public health forms the structure of PBIS, with the goal of providing a continuum of support to the entire population of a school. As such, primary or universal tier interventions are selected to provide preventive behaviour support for the majority of students across all settings of the school, including classrooms, hallways, and playgrounds. School personnel achieve this aim by selecting, clearly defining, and teaching school expectations, and forming a system of acknowledgement for positive behaviours. In addition, a continuum of instructional consequences for problem behaviours are used to provide clarity and additional practice in expected behaviours (Sugai & Horner, 2009; Turnbull et al., 2002). Data are collected and monitored to increase positive student–teacher interactions and reduce the use of exclusionary discipline, both of which are important mechanisms for enhancing student long-term outcomes (McIntosh, Horner, & Sugai, 2009).
Although the primary tier of interventions aims to support all students in a school, a proportion of students will require more intensive support, provided through secondary and tertiary tiers. The secondary tier includes ongoing interventions that are targeted to a smaller group of students that do not respond to the primary tier or are considered to be at risk for problem behaviours (Sugai & Horner, 2009; Turnbull et al., 2002). The tertiary tier of PBIS provides individualized support to students who have more intensive behaviour needs and do not respond to secondary tier interventions (Horner et al., 2009). At this level of support, selected practices are individually tailored to meet the needs of the students and promote appropriate behaviour (Sugai et al., 2010).
The PBIS approach is based on research showing that simply training school personnel on how to use evidence-based practices does not guarantee their use (Joyce & Showers, 1980). Instead, there is an emphasis within the approach to design systems that support practice implementation; first, school personnel choose and implement interventions based on the criteria that they are feasible to implement and are suited to the needs of their students (Dunlap, Sailor, Horner, & Sugai, 2009). Second, an emphasis on data collection and evaluation guides decision making, provides feedback, and aids in the formation of goals. Third, systems of support, such as ongoing training and coaching, are put in place to ensure that practices continue to be implemented with fidelity (the degree to which a practice is carried out as the developers intended) and are producing desired outcomes (Carr et al., 2002; Dunlap et al., 2009).
Key Features of PBIS
Although interventions chosen by schools will differ based on the needs of each school, there are a few core underlying key features that form the basis of PBIS (Sugai et al., 2010; Turnbull et al., 2002). Key features to provide whole school support include defining and teaching a small number of positively stated expectations that are applied to all areas of the school. For instance, a school may expect their students to “Be Kind, Be Responsible, and Be Respectful” and students would then be taught how these expectations are shown in different settings in the schools (e.g., classrooms, hallways, playgrounds). Posters with the expectations, often created by students, are placed around the school to provide visual reminders of expected behaviours. A teaching matrix, with specific examples of each expectation in each setting around the school, is created to ensure staff understanding and consistency in teaching the expectations. Students are then acknowledged for demonstrating prosocial behaviour, and a continuum of consequences is implemented to ensure that problem behaviours are addressed instructionally and consistently instead of simply punitively. Often, acknowledgement of expected behaviours includes specific verbal praise paired with a tangible ticket, which can be displayed in the hallway or entered in a raffle for school supplies. It is important to note that the mechanism for supporting behaviour is the acknowledgement of success, not the ticket itself. The ticket represents a system for supporting staff by reminding them to engage in positive conversations with students about their behaviour.
The following example demonstrates how key features of PBIS are applied to meet the unique environment of a particular school. An elementary school in Texas selected two themes, be responsible and be respectful, as their school-wide expectations (Menendez, Payne, & Mayton, 2008). School personnel explicitly defined and taught the expectations to students, using specific examples for a variety of locations. For instance, respect in the classroom was defined as following the teacher’s directions. Similarly, other examples of showing respect and responsibility were provided and explicitly taught for not only the classroom, but the hallways, playgrounds, and other areas of the school. In addition, the school implemented a system whereby students were acknowledged with “Busy Bee” tickets. Tickets were given to a student who was observed demonstrating responsible or respectful behaviour, and the student could place his ticket into a “hive” in the classroom. A draw was then conducted in each classroom, giving students who had received a ticket the chance to receive a mystery motivator and further verbal praise.
Another key feature is the ongoing collection of office discipline referral (ODR) information as a measure of overall school behaviour and for use for decision making, as this information can provide a proxy measure of behaviour that can be informative regarding the effectiveness of the intervention. For instance, schools may track the number of ODRs on an ongoing basis to identify areas of strength and areas to target, such as specific expectations, locations, or groups of students that require additional support (McIntosh, Campbell, Carter, & Zumbo, 2009). Other data that are commonly collected include standardized state or provincial achievement test scores, suspension rates, and attendance information (i.e., tardies, absences).
Evidence Base of PBIS
Much research shows that PBIS is related to a range of positive outcomes (Horner, Sugai, & Anderson, 2010). In particular, outcomes include increases in prosocial behaviour and decreases in problem behaviour, as well as decreases in disciplinary actions such as ODRs, suspensions, and expulsions (Lassen, Steele, & Sailor, 2006; Nelson, Martella, & Marchand-Martella, 2002). PBIS is also related to the organizational health of a school and teachers’ perceptions of their ability to affect student learning (Bradshaw, Koth, Bevans, Ialongo, & Leaf, 2008; Kelm & McIntosh, 2012; Ross & Horner, 2006). In addition to improving the school social environment, implementation of PBIS is also related to increases in academic achievement and school survival skills, such as work habits and social growth (Nelson, 1996). These effects have been shown in randomized controlled trials (e.g., Horner et al., 2009; Waasdorp, Bradshaw, & Leaf, 2012), as well as case studies of PBIS implementation (e.g., Menendez et al., 2008; Taylor-Greene et al., 1997).
The Current Study
The number of positive outcomes related to PBIS has influenced the popularity of this approach, and the literature provides a wide variety of examples of different practices chosen by schools within the PBIS framework. Although there is much research examining the many outcomes of PBIS in the United States, few studies have investigated PBIS in Canada (Chapman & Hofweber, 2000; Kelm & McIntosh, 2012). As this approach is gaining popularity in Canada (New Brunswick Department of Education, 2004), there is a need to examine whether the positive academic and behavioural outcomes associated with PBIS generalize to a distinct Canadian setting, even though the Canadian educational system is generally similar to that of the United States. Although similar results would be expected, replication in new settings provides stronger evidence of external validity for commonly used practices. Case studies, non-experimental pre–post evaluations of implementation and their effects on student outcomes, represent an efficient method of replication that can complement the findings of randomized controlled trials (Biglan, 2004).
The purpose of this article is to report results from a case study of a Canadian school that was partially implementing PBIS in 2007-2008 (Year 1 of the case study) and fully implementing in 2008-2009 (Year 2). Research indicates that the fidelity of implementation of a practice is related to its effectiveness (Domitrovich et al., 2008; Durlak & DuPre, 2008; Dusenbury, Brannigan, Falco, & Hansen, 2003). This study aimed to examine whether an increase in PBIS implementation fidelity was related to positive outcomes for students, as it related specifically to problem behaviour, academic achievement, and student perceptions of school safety.
To provide additional descriptive information regarding the changes seen in the school, the study aimed to gather and analyze perceptions of PBIS by key figures in the school, including parents, teachers, and students. The success of a practice depends largely on how it is perceived. It is critical that the stakeholders perceive that the outcomes of a practice are valuable, that the practice itself is responsible for producing the outcomes, and that the practice is easy to implement, for it to be sustained over time (McIntosh, Filter, Bennett, Ryan, & Sugai, 2010).
Method
Setting
The setting for this case study was a small elementary school within a medium-sized district in British Columbia, with approximately 15,000 students and 49 schools. Although the school personnel initially received training in PBIS in the 2003-2004 academic year, the current case study focuses on the year prior to reaching full implementation (Year 1), and the year of full implementation (Year 2). In Year 1, the school served just less than 200 students. Twenty-six percent of students in the school were Aboriginal, and 6% of students were designated as students with special needs. The school was part of a district with an ongoing PBIS initiative, in which some schools had been implementing for more than 10 years. By Year 2, 16 schools (33% of the district) were implementing PBIS.
Measures
Fidelity of PBIS implementation
To examine fidelity of implementation, the School-wide Evaluation Tool (SET; Sugai, Lewis-Palmer, Todd, & Horner, 2001) was used. This tool is a research-validated measure of fidelity of PBIS implementation with strong psychometric properties (Horner et al., 2004). The SET is conducted by trained external evaluators, using direct observation and interviews to assess the extent to which the critical features of PBIS are implemented. The SET provides schools with an overall percent of critical features implemented score, and a school is considered to be implementing with fidelity if they receive a SET score at or above 80% in the teaching expectations subscale and 80% on the overall implementation scale (Horner et al., 2004). This school achieved a SET score of 80% on the teaching expectations subscale and 83% overall for the year of evaluation, indicating that they were implementing PBIS with fidelity. All behaviour, achievement, and perceived safety data were evaluated by comparing results in Year 1 to results in the following year, when the school was implementing PBIS with fidelity.
Problem behaviour
Levels of problem behaviour were measured using ODRs and suspensions collected across both years. ODRs are standardized forms used by schools to record serious incidents of problem behaviour (e.g., defiance, physical aggression). Often, ODRs are issued for incidents that require administrative involvement. ODRs represent standardized forms, providing teachers with a common procedure to record problem behaviours. Research indicates that ODR data represent a valid and reliable tool to monitor and evaluate problem behaviour in a school (Irvin, Tobin, Sprague, Sugai, & Vincent, 2004; McIntosh, Campbell, et al., 2009). Suspensions are also commonly collected to provide an indication of level of problem behaviours in a school (Luiselli, Putnam, Handler, & Feinberg, 2005; McIntosh, Campbell, et al., 2009). The school entered and analyzed ODR and suspension information through the School-Wide Information System (SWIS; May et al., 2008), a web-based program.
Academic achievement
To evaluate academic achievement, scores on the Foundation Skills Assessment (FSA), a provincial high-stakes achievement test, were used. The FSAs assess foundation skills in reading, writing, and numeracy and are aligned with the provincial curriculum. They are administered each year to all students in Grades 4 and 7 across British Columbia. Because comparing achievement scores for schools with different student populations is often invalid, data from the FSAs were used to compare the school and the district across years. Research indicates that the FSAs are a reliable assessment of skills in reading and numeracy; however, reliability in the assessment of writing is lacking (British Columbia Ministry of Education, 2008).
School safety
To examine student perceptions of safety, three questions from a provincial student satisfaction survey were used. The Satisfaction Survey is administered to all students in British Columbia as part of the FSAs and is used to gain insights from students on their opinions of their schooling, school climate, and safety at school. This study used students’ responses to the following three questions: (a) Do you feel safe at school? (b) At school, are you bullied, teased, or picked on? and (c) Do you know how your school expects students to behave? Research indicates that this survey is a reliable and valid measure of student perceptions of their school climate (British Columbia Ministry of Education, 2007).
Descriptive feedback
To gain further information to the perceptions of PBIS in addition to students, teachers and parents were asked to provide their opinions of the PBIS approach in the school. All teachers and selected parents were provided a comment card to describe their opinions and reactions to PBIS.
Procedure
Year 1
By 2007-2008, the school had defined expectations (Safe, Helpful, Accountable, Respectful, Positive [SHARP]), and teachers were provided with lesson plans to teach the expectations on their own time. There was also an existing behaviour matrix; however, there were a large number of behaviours included in the matrix, which the staff found overwhelming. The school expectations were acknowledged with a points system in which points could be earned and used for pizza parties. However, points were not paired with behaviour feedback (i.e., students were not told what behavioural expectation they displayed to receive the point). At this time, the school had a program for tracking ODRs, but the information was not used for decision making. Although fidelity of implementation data were not collected that year, based on the lack of a documented system for teaching school expectations, it would not have been possible for the school to meet criteria for adequate PBIS implementation (i.e., at least 80% on the expectations taught scale of the SET).
Year 2
In 2008-2009, several changes occurred to increase the fidelity of PBIS implementation. First, although the SHARP expectations were maintained, the expectations matrix was re-examined and condensed to provide a more manageable list of expected behaviours for students to remember (see Figure 1). In addition, expectations were explicitly and systematically taught to students on the first day of school through a school-wide orientation. Specifically, five stations were set up around the school, and students, who were divided in five groups, visited each station, where they were taught and provided practice in the expectations in each location. The previous acknowledgement system was closely examined and transformed to provide more immediate acknowledgement to students for displaying expected behaviours. In addition, the acknowledgement was tied to specific feedback to students. Specifically, students were given “Be Sharp” tickets immediately after performing an expected behaviour, and teachers gave them immediate and specific feedback regarding what behaviour they displayed to earn the ticket.
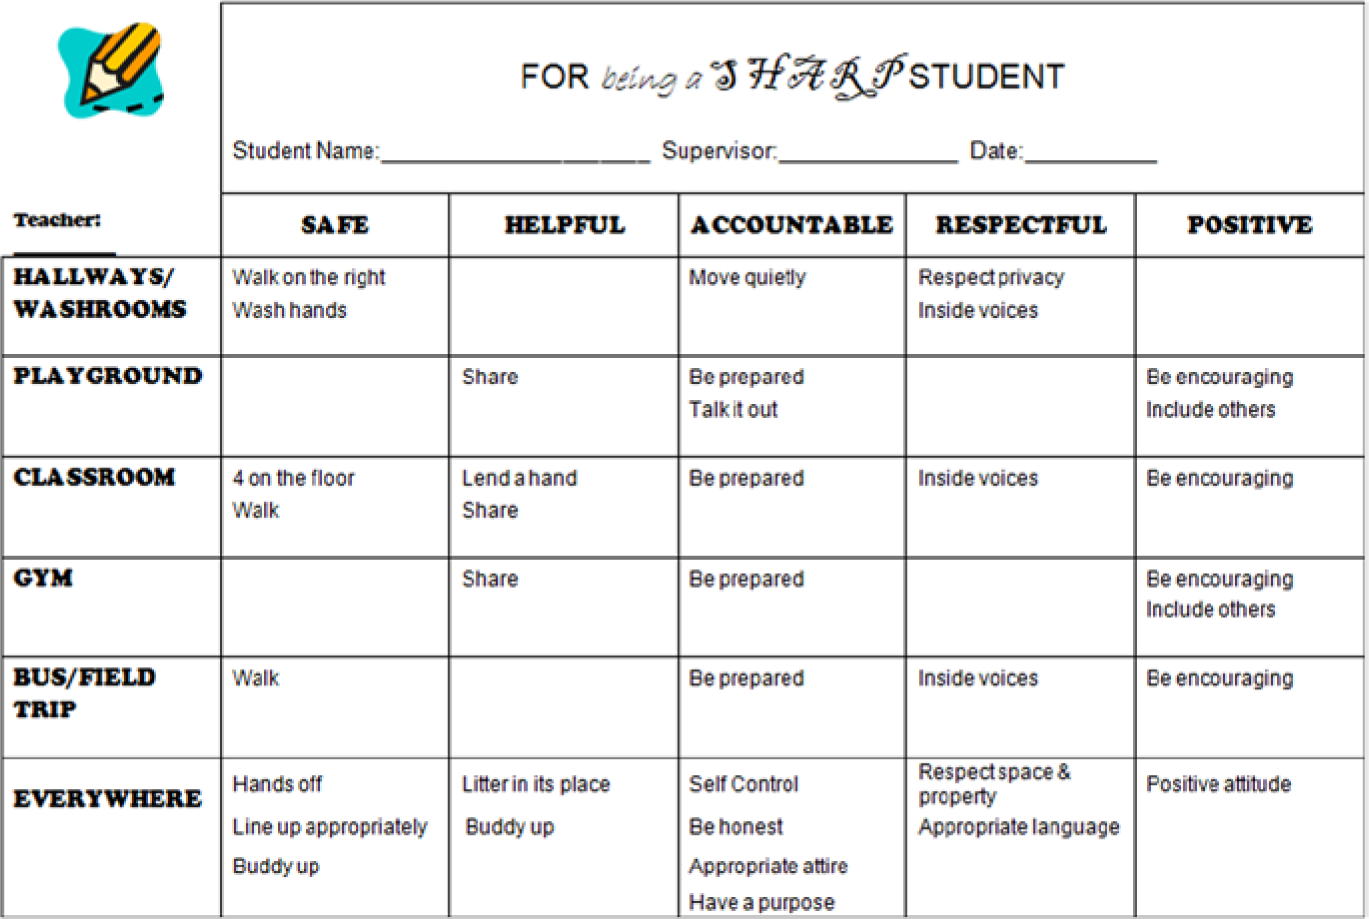
School-wide expectations matrix revised in Year 2.
In Year 2, data continued to be collected in a similar manner as the previous year; however, an emphasis was placed on analyzing and using the data to guide decision making. For instance, at one point during the year, the data indicated an increase in ODRs for disrespectful behaviour, which led the school team to create specific booster lessons around the topic of respect. To build engagement and support from school staff, the PBIS team informed staff about all team decisions on a regular basis. Specifically, the systems and strategies were reviewed at a professional development day prior to the start of the school year, and data (e.g., ODRs) were reviewed with staff at monthly staff meetings. In addition, a system was put in place to provide teachers with incentives for handing out “Be Sharp” tickets. Specifically, teachers’ names were drawn for a chance to win a “get out of recess supervision free” card. An orientation was conducted for all new students and staff who joined the school after the start of the year. Finally, parents were given updates on PBIS in the school’s newsletter.
Design
The current study utilized available data gathered at the school and district level to examine descriptive changes in behavioural and academic outcomes related to increase in fidelity of PBIS implementation from partial implementation to full implementation. Percent change in the variables of interest were examined. In addition, to examine the practical implications of a decrease in ODRs, a cost–benefit calculator (Scott & Barrett, 2004; see www.pbismaryland.org) was used to examine time regained. To calculate the number of minutes regained for students and school staff, it was estimated that each ODR resulted in 30 min out of class for students, and 15 min of school staff time spent process an ODR (e.g., stopping class, writing the ODR, meeting with the student, informing a caregiver).
Results
Problem Behaviour
Results from the ODR data, illustrated in Figure 2, show that ODRs were reduced by more than half from partial implementation (518 ODRs) to full implementation (252); a reduction of 266 ODRs. This reduction of 266 ODRs represented a substantial and clinically important decrease in referrals, and a large savings in staff and student instructional time. Specifically, the saving of 266 ODRs represented 3,990 min of staff time, or eight 8-hr working days, regained. For students, this reduction in ODRs represents 7,980 min, or seventeen 6-hr school days, that students were in the classroom as opposed to waiting outside the office. In addition, out of school suspensions were reduced by half from the previous year, as displayed in Figure 3.
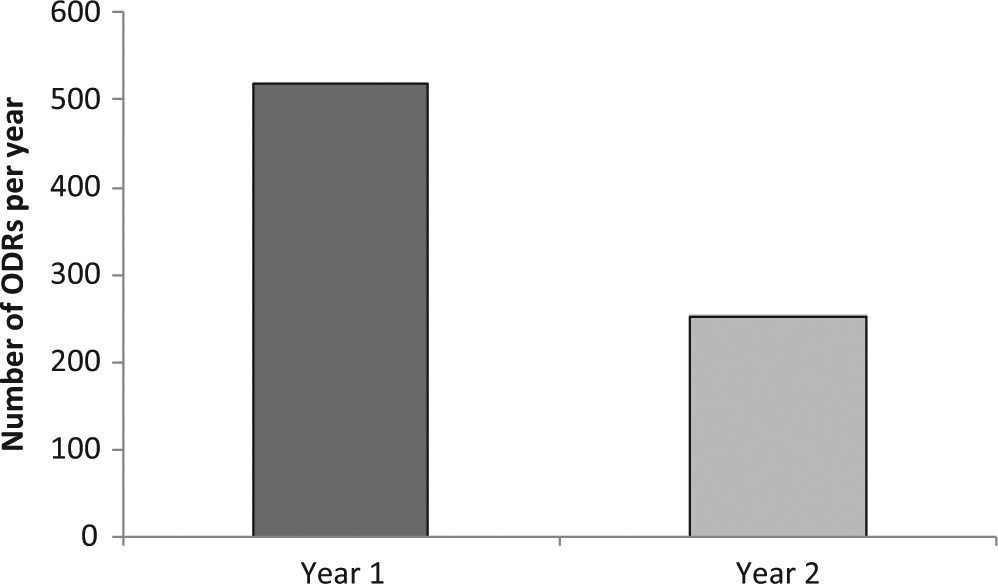
Number of office discipline referrals (ODRs) for Year 1 and Year 2.
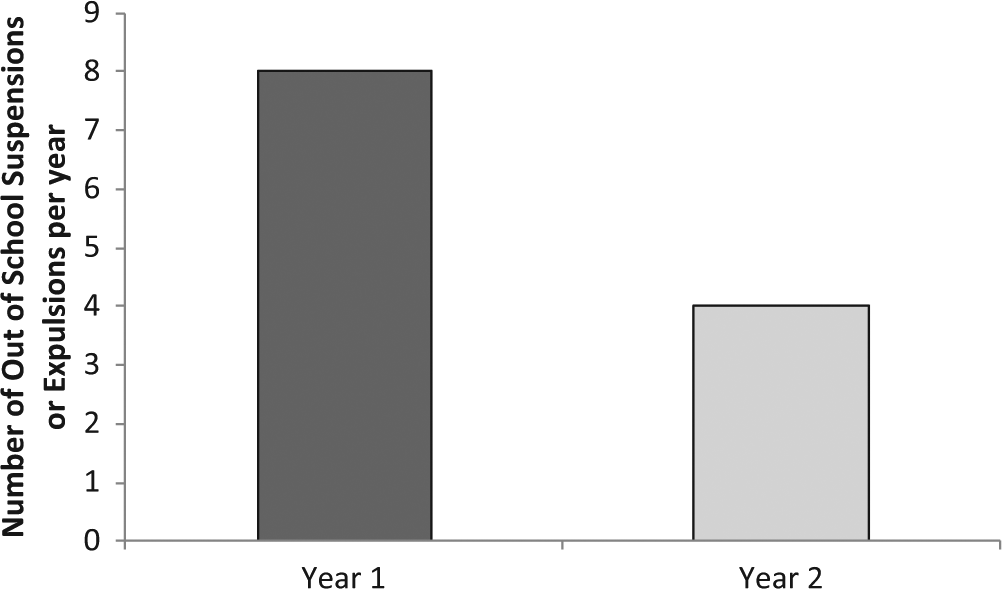
Number of out of school suspensions or expulsions for Year 1 and Year 2.
Academic Achievement
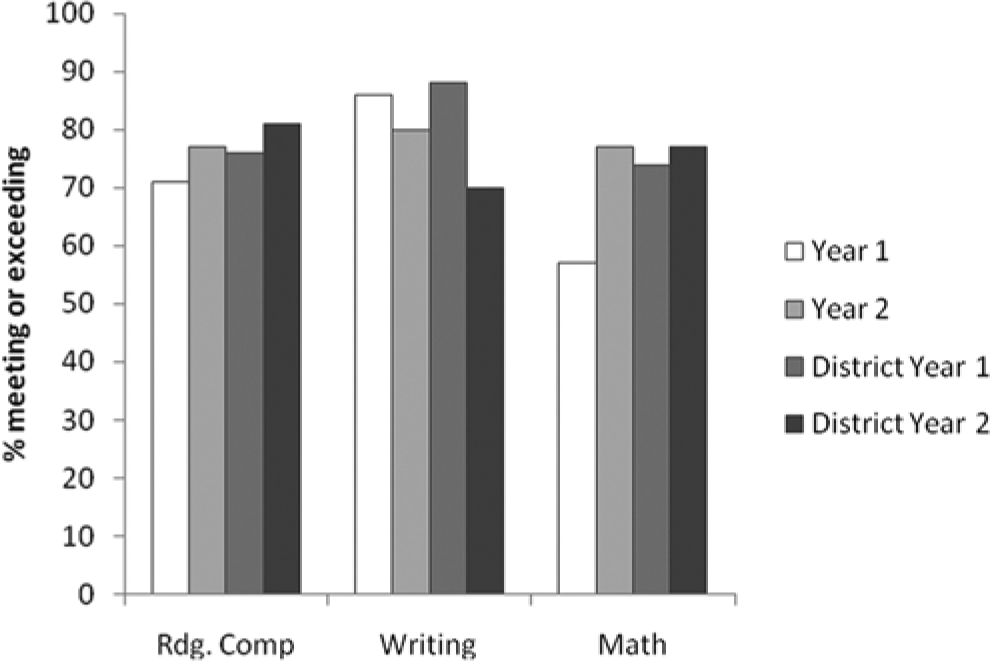
The student achievement results for Grades 4 and 7 are shown in Figures 4 and 5, showing the percent of students meeting or exceeding academic expectations. The results show a large increase in FSA scores for Grade 4 students from the partial to the full implementation academic years in all areas assessed. Changes were much more positive for Grade 4 students in the participating school when compared with results from the district as a whole. Changes for Grade 7 students in the school compared with the district were also generally more positive for the students at the participating school than the district, apart from reading scores. Specifically, the results showed a 44% increase in reading from the previous year, a 56% increase in writing, and a 25% increase in math. These results differ from changes in scores for the district as a whole, which indicated a drop in reading by 3%, a negligible change in writing (1%) and a slight increase in math by 8. For Grade 7 students, there was a modest increase in reading achievement for the school (9%) and the district (7%). Although there was a decrease of 7% in writing scores for the school from partial to full implementation, this decrease was less of a concern than the 21% decrease seen in the district. Finally, there was a 35% increase in math scores for the school, compared with a 4% increase for the district.
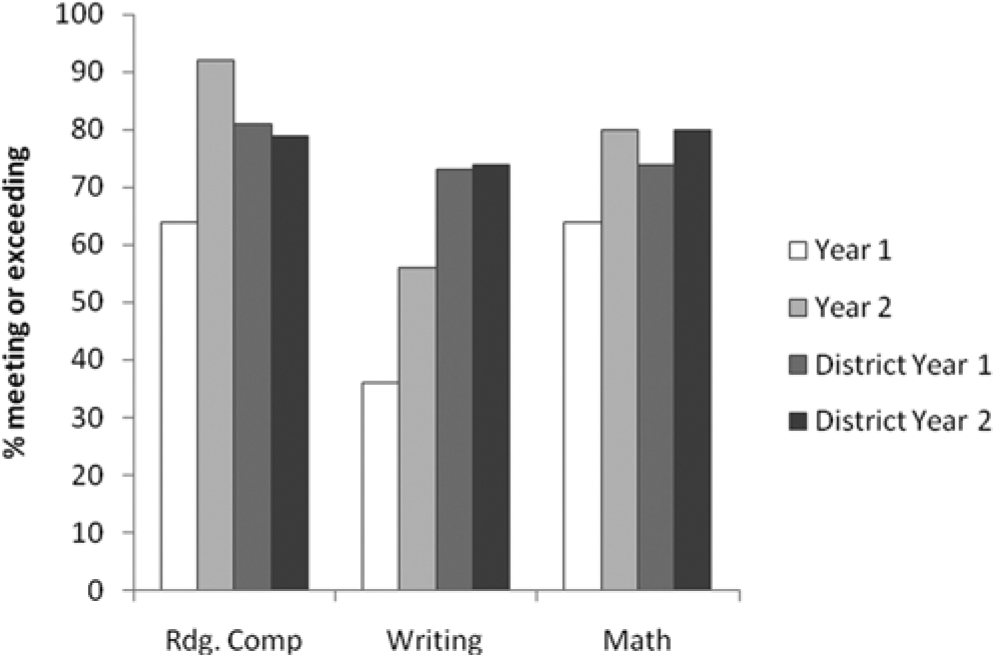
Percent of Grade 4 students meeting or exceeding expectations in academic skills, as assessed by the Foundation Skills Assessment for the school compared with the district results in Year 1 and Year 2.
Percent of Grade 7 students meeting or exceeding expectations in academic skills, as assessed by the Foundation Skills Assessment for the school compared with the district results in Year 1 and Year 2.
School Safety
The results from the student Satisfaction Survey are shown in Figures 6 and 7, showing students who responded “many times” or “all the time” to each question in partial implementation compared with full implementation. Responses from Grade 4 students in the participating school indicated notable increases in their perceptions of safety, understanding of what is expected of them, and decreases in perceptions of bullying. As expected, Figure 6 shows an increase from the previous year in Grade 4 students’ perceptions of safety of 15%, compared with a negligible change of 1% for students in the district. Similarly, Grade 4 students at the participating school reported a 36% increase in their understanding of what is expected of them, compared with a 1% change for Grade 4 students in the district. Finally, Grade 4 students reported a 69% decrease in feelings of being, compared with a 15% decrease reported by students in the district. Similarly, responses from Grade 7 students indicated considerable increases in perceptions of safety and decreases in feelings of bullying when compared with students in the district. Figure 7 indicates that in Year 2, Grade 7 students reported a 24% increase in perceptions of safety, compared with no change in perceptions of safety reported by students in the district. Grade 7 students at the participating school also reported a considerable decrease of 72% in their feelings of being bullied at school, compared with 10% decrease reported by students in the district. Grade 7 students in the school and the district reported a similar degree of change in their perceptions of understanding of what is expected of them at school (2%).
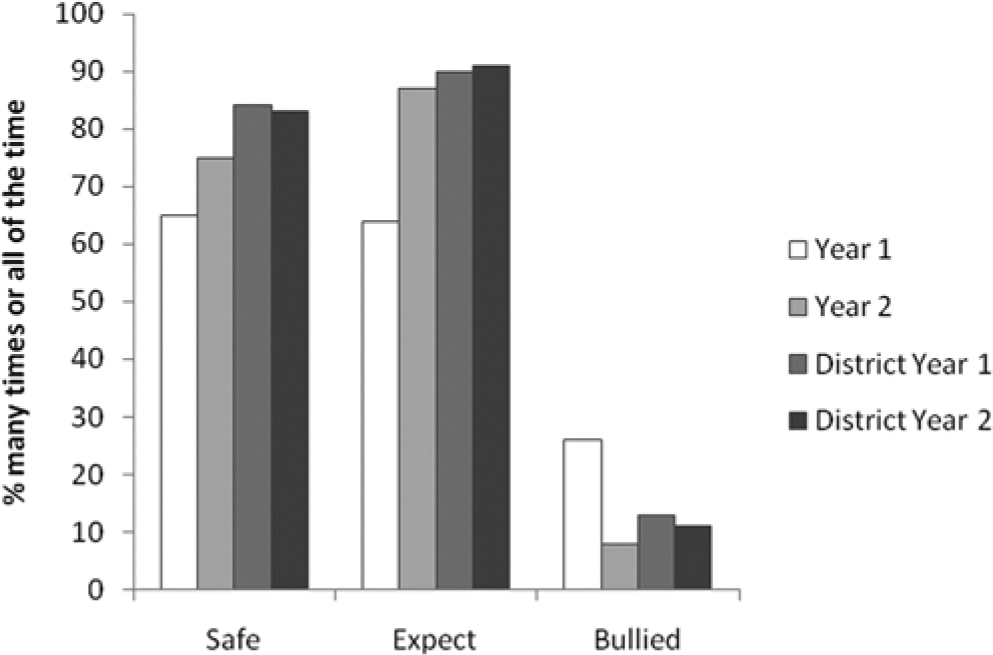
Percent of Grade 4 students responding “many times” or “all of the time” to the Student Satisfaction Survey questions. Results represent responses from the school and the district in Year 1 and Year 2.
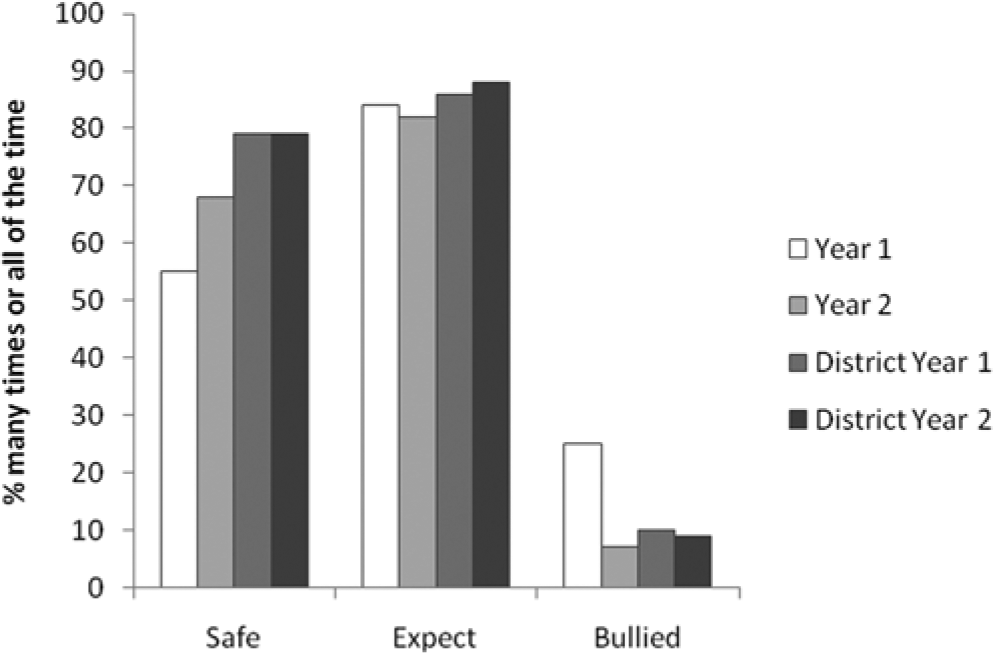
Percent of Grade 7 students responding “many times” or “all of the time” to the Student Satisfaction Survey questions. Results represent responses from the school and the district in Year 1 and Year 2.
Descriptive Feedback
Interviews with stakeholders provided valuable insights to perceptions of PBIS in the school. One staff member commented, The implementation of [PBIS] has given [this school] a positive feeling. Children know and understand what is expected of them and why the guidelines are in place. Kindergarten students are taught the SHARP matrix when they start at the school and constant reminders and re-teaching throughout the grades help students remember the expectations. Staff spend limited time dealing with negative behaviours and instead are able to teach children. [PBIS] has truly been a positive initiative for our terrific kids!
Another staff member reported, “[PBIS] helps to create a school community where respect and responsibility are valued and education can be a focus.” A parent noted, “Everyone knows what the behaviour expectations are. The school sends home information on the matrix and on how it is working.”
Discussion
Based on the increased rate of problem behaviours in Canadian youth, schools are in need of support for preventing and addressing these behaviours and promoting social responsibility among students. PBIS provides schools with a framework for supporting student behaviour and promoting a positive school environment. In PBIS, all students are supported through a three-tier model of instruction. That is, primary interventions are put in place to support the entire student population through the use of explicit instruction and positive reinforcement. Secondary tier interventions, such as small group social skills instruction or mentoring, are used to support students who are deemed to be “at-risk” for problem behaviours. Finally, tertiary tier interventions are selected to support students who are “high risk” or display intensive behaviour problems.
Although much research has demonstrated that there are many positive outcomes related to PBIS, there is little such research in Canada. The current case study examined the social and academic outcomes of a Canadian school that reached full implementation of PBIS in 2008-2009. The study also examined primary stakeholders’ perceptions of PBIS after the school had reached implementation. The results of this study indicated a practically significant decrease in problem behaviours, as indicated by a reduction of 266 ODRs in 1 year. In addition, results from standardized achievement assessments indicated substantially increased student achievement in reading, writing, and math for Grade 4 students, and increases in math performance for Grade 7 students, with school changes better than the average district changes at all grade levels and subjects. The data from a student survey indicated increases in students’ perceptions of safety and decreases in feelings of being bullied for students in Grades 4 and 7. Finally, although students in Grade 4 reported an increase in their understanding of what is expected of them at school, Grade 7 students did not. These changes were especially noteworthy when compared with the minimal changes that were seen in the average responses from students in the district. Taken together, these results are consistent with those of previous case studies (Menendez et al., 2008; Taylor-Greene et al., 1997) and randomized control trials (Horner et al., 2009; Waasdorp et al., 2012), indicating that PBIS is related to decreases in student problem behaviour and increases in academic achievement. However, the student survey measures used in this study are unique, indicating that the changes in school practices and student outcomes are also associated with student perceptions of school climate.
The results of the current study have implications regarding the importance of implementing a practice with fidelity. Fidelity of implementation refers to the degree to which a practice is implemented as intended by the program developers (Dusenbury et al., 2003). In this case, although several key features of PBIS were being implemented prior to reaching full implementation, several significant positive student outcomes were observed when the fidelity of implementation was increased. These results align with previous research regarding the importance of implementing a practice with fidelity to achieve the intended outcomes (Domitrovich et al., 2008; Durlak & DuPre, 2008; Dusenbury et al., 2003). Furthermore, these results provide implications regarding the importance of collecting and monitoring fidelity of implementation data. It is possible that a practice may be implemented in a school with the best intentions, when in reality, critical features of the practice have been adapted, changed, or removed, compromising its effectiveness. By collecting and reviewing fidelity of implementation data, it becomes possible to systematically review the quality of implementation of each feature of PBIS, allowing school personnel to examine which aspects of the practice may require attention and review.
These results provide further evidence that implementation of PBIS is related to decreases in levels of problem behaviours, and that the outcomes seen in the United States are applicable to Canada, as would be expected. A decrease in problem behaviours is important not only for the benefit of the social environment of the school, but also in the amount of time saved for teaching and learning. These results indicated that from partial to full implementation, there was a significant savings in time for both students and teachers. This saving in instructional time may be related to the finding that there were academic gains in reading, writing, and mathematics for Grade 4 students, and in mathematics for Grade 7 students.
Finally, reactions from school staff and parents indicated an overall appreciation of the PBIS approach in their school. It could be speculated that the more frequent communication among staff, parents, and students regarding PBIS and the outcomes related to it may have increased their understanding and acceptance of the approach. In particular, it is possible that presenting data at monthly staff meetings may have highlighted the link between PBIS and positive outcomes, which may have led staff to hold PBIS in high regard.
Limitations
The current study was limited by several factors. Although this case study provides preliminary evidence of the positive outcomes related to PBIS, the design was not experimental. Threats to internal validity are always present in descriptive case studies. Moreover, because the study examined only one school, results may not be generalizable to the rest of British Columbia or Canada. Furthermore, the study used extant data and did not rely on original data collection, except for fidelity of implementation during Year 2, and no fidelity of implementation data were available for Year 1.
Conclusion
Much research across the United States has demonstrated the positive outcomes related to PBIS; however, there have been relatively few comparable studies conducted in Canada. The current study indicated that fidelity of implementation is related to the outcomes of PBIS, and when implemented with high fidelity, PBIS was related to substantial improvement in student academic and behaviour outcomes, students generally felt safer in their schools, were less likely to feel bullied, and had a better understanding of what was expected of them. Finally, feedback from parents and staff was positive, reflecting an opinion that the PBIS approach was valued by stakeholders.
Footnotes
Declaration of Conflicting Interests
The author(s) declared no potential conflicts of interest with respect to the research, authorship, and/or publication of this article.
Funding
The author(s) received the following financial support for the research, authorship, and/or publication of this article: This work was supported by the Social Sciences and Humanities Research Council of Canada (SSHRC; F09-05052). Opinions expressed herein are those of the authors and do not necessarily reflect the position of SSHRC, and such endorsements should not be inferred.