
Abstract
The psychometric properties of a new multidimensional measure of test anxiety, the Test Anxiety Measure for College Students (TAM-C), based on theory and current research were examined in a sample of 312 Canadian college students online. The TAM-C consists of a Facilitating Anxiety scale and five test anxiety (Cognitive Interference, Physiological Hyperarousal, Social Concerns, Task Irrelevant Behaviors, and Worry) scales. Results of confirmatory factor analyses validated the TAM-C six-factor structure. In addition, composite reliabilities were reported to be adequate. Furthermore, convergent and discriminant evidence of validity was found for the TAM-C scores. These findings are the first to be reported on the psychometric properties of the TAM-C scores outside the United States. Although additional research is needed with the TAM-C, it has the potential to become a useful measure to Canadian mental health professionals in their work with test-anxious college students.
Stress is reported to be a widespread problem on Canadian college campuses (MacKean, 2011). Researchers have found that approximately 50% of college students experience moderate levels of stress-related problems. Stress-related problems found in the college student population include anxiety and depression (Keyes et al., 2012; Lunau, 2012). Research conducted at the University of Alberta found that more than half of the 1,600 college students surveyed were overwhelmed with anxiety (Regehr, Glancy, & Pitts, 2013). College students who experience moderate to high levels of stress, including anxiety, are more likely to struggle academically and to drop out of school (Gerwing, Rash, Gerwing, Bramble, & Landine, 2015; Pritchard & Wilson, 2003). Tests and course grades are reported to be the primary sources of stress and anxiety found among the college student population (Cassady & Johnson, 2002; Furr, Westefeld, McConnell, & Jenkins, 2001).
Test Anxiety and College Students
Test anxiety is defined as a situation-specific form of trait anxiety (Spielberger & Vagg, 1995) and is a long-standing problem on college campuses (Szafranski, Barrera, & Norton, 2012). According to Spielberger’s (1966) state–trait model of anxiety, trait anxiety is a relatively stable personality characteristic and refers to the differences in anxiety proneness found among individuals, whereas state anxiety is the fear, tenseness, and worry individuals experience in specific situations, such as evaluative situations, and is more transitory in nature. Test-anxious students perceive testing situations as threatening and they feel tense, worried, and nervous when they take tests (Gierl & Rogers, 1996). Gerwing and colleagues (2015) found that 38.5% of their sample of 1,099 Canadian college students reported experiencing test anxiety during their college years. Negative correlates of test anxiety include lower grade point averages (GPAs), higher dropout rates (Gerwing et al., 2015), and higher rates of mental health problems (Bodas & Ollendick, 2005). Therefore, it would be important for mental health professionals who work with Canadian college students to use measures of test anxiety based on current research and theory to help identify those individuals who are test anxious, so appropriate interventions can be implemented to reduce their test anxiety.
The Test Anxiety Measure for College Students (TAM-C)
The TAM-C (Lowe, 2018) is a 43-item self-report measure designed to assess test anxiety in the college student population. The TAM-C consists of six scales, five test anxiety (Cognitive Interference, Physiological Hyperarousal, Social Concerns, Task Irrelevant Behaviors, and Worry) scales and one Facilitating Anxiety scale. The TAM-C was developed in the United States and fills a gap in the test anxiety literature, as most multidimensional measures of test anxiety designed for college students are more than 20 years old (e.g., the most popular test anxiety measure, the Test Anxiety Inventory, developed by Charles Spielberger was published in 1980), have old norms and old items (Lowe, Lee, & DeRuyck, 2004), are not based on theory and current research, do not capture the multiple dimensions of the test anxiety construct (Zeidner, 1998), and/or do not assess the facilitating or performance enhancement aspects of anxiety (Lowe, 2018).
Lowe (2018) conducted the only published study where a series of confirmatory factor analyses (CFAs) were performed on the responses of 360 U.S. college students on the TAM-C. Lowe tested several models, including a two-factor model (a Test Anxiety factor and a Facilitating Anxiety factor), a six-factor model (five test anxiety factors, including Cognitive Interference, Physiological Hyperarousal, Social Concerns, Task Irrelevant Behaviors, and Worry factors, and a Facilitating Anxiety factor), and a six-factor model (same six factors in the six-factor model) with a higher order factor.
The two-factor model is based on Alpert and Haber’s (1960) work. Alpert and Haber indicated that there are two types of anxiety, facilitating anxiety and debilitating (test) anxiety. Facilitating anxiety enhances test performance, whereas test anxiety hinders test performance. Research has shown that students with high levels of test anxiety demonstrate poor performance on exams (Alpert & Haber, 1960), whereas students with high levels of facilitating anxiety perform better on tests (Rafferty, Smith, & Ptacek, 1997).
The six-factor model is based on a number of theories and research, including Alpert and Haber’s (1960) work, Wine’s (1971) cognitive attention model, Liebert and Morris’s (1967) bidimensional theory, Friedman and Bendas-Jacob’s (1997) work in the area of social derogation, and Sarason and Mandler’s (1952) work on task anxiety drives. According to Wine’s (1971) cognitive attentional model of test anxiety, test-anxious students have a difficult time focusing their attention on an exam when they take a test because their attention is divided between the task (i.e., the test) and self-preoccupied (e.g., self-deprecatory) thoughts, resulting in lower test performance. In contrast, students with low test anxiety focus their attention on the task. In their bidimensional theory, Liebert and Morris (1967) stated that test anxiety consists of a worry component and an emotionality component. Test-anxious students worry about failing and the repercussions of failing exams. They may also experience autonomic responses (e.g., tenseness), the emotionality component, now called physiological hyperarousal (see Joiner et al., 1999), in testing situations. Friedman and Bendas-Jacob’s (1997) work supports a social derogation component of test anxiety. Test-anxious students are concerned about disparagement they may experience from others if they do not perform well on tests. In Sarason and Mandler’s (1952) work, test-anxious individuals are believed to have strong anxiety drives and these strong anxiety drives lead to task irrelevant behaviors, such as avoidance behaviors in testing situations. Lowe and colleagues’ (Lowe, 2014; Lowe, Grumbein, & Raad, 2011) research supports not only avoidance behaviors but also off-task behaviors, such as restive behaviors, as part of the task irrelevant behaviors facet of test anxiety.
Besides the two-factor model and the six-factor model of test anxiety, Lowe (2018) also examined a six-factor model with a higher order factor, which includes the same six factors in the six-factor model mentioned above. Research has supported multidimensional (e.g., Lowe, 2014, 2018) and higher order models (e.g., Benson & El-Zahhar, 1994; Lowe et al., 2011) with advancements in research and theory in the field of test anxiety (Lowe, 2018).
The author tested the two-factor, six-factor, and six-factor model with a higher order factor, and found the six-factor model to be the best fitting model for the TAM-C in a sample of U.S. college students. However, it is unclear whether a six-factor model would be validated with a sample of college students in another country, such as Canada.
Test Anxiety and the Canadian and U.S. Cultural Contexts
There are similarities as well as dissimilarities between the Canadian and U.S. cultures. Both countries have a similar origin in the United Kingdom (Bowman, 2000), are considered high income countries (Bassani, 2005), and have a similar proportion of their GDP that goes to education (Sherman, Honegger, McGivern, & Lemke, 2003). Both countries are democratic societies, and have universal education (Bowman, 2000), freedoms of speech and religion (Bowman, 2000), and similar cultural values (Bassani, 2005). Even though there are cultural similarities found in these two countries, differences do exist (Bassani, 2005), including differences in social policies, well-being, with Canadians having greater well-being than individuals as a group in the United States, largely due to universal health care in Canada and more economic disparities in the United States, and the nature of diversity, with Canada having a higher proportion of foreign-born migrants (Bowman, 2000).
When looking specifically at postsecondary education in Canada and the United States, both countries have extensive postsecondary educational systems. However, there are some major differences within these educational systems. For example, the admissions process at Canadian universities is more competitive overall than at U.S. universities. In addition, Canada has a larger percentage of its universities that are publicly funded than universities in the United States. Furthermore, Canada has a larger proportion of its minorities attending Canadian universities than U.S. minorities attending U.S. universities (Bowman, 2000).
Bodas and Ollendick (2005) indicated that the psychosocial cultural context must be considered when conducting research in the area of test anxiety, as the pattern and level of test anxiety may differ (Bodas & Ollendick, 2005; Sharma & Sud, 1990). This suggests that measures used to assess test anxiety must show validity in the country where researchers and clinicians plan to use them (Mowbray, Jacobs, & Boyle, 2015). Therefore, the psychometric properties of a new measure of test anxiety developed in the United States, such as the TAM-C, would need to be examined with samples of college students in other countries, such as Canada, prior to its clinical use in those countries.
Correlates of Test Anxiety
Drive theorists (e.g., K. W. Spence and J. T. Spence) view test anxiety as simply general anxiety in testing situations (Zeidner, 1998). According to drive theorists, individuals with general anxiety experience an increase in autonomic reactions, self-disparaging thoughts, and task irrelevant behaviors when exposed to stressful situations (Zeidner, 1998). Likewise, individuals with high levels of test anxiety experience similar reactions, thoughts, and behaviors in stressful testing situations. Therefore, the scores of measures of test and general anxiety should have positive correlations with each other and these positive correlations would provide support for the convergent evidence of validity for the scores of a test anxiety measure. Research has shown positive, medium to large correlations (rs = .30-.84) between scores of measures of test and general anxiety (Lowe, 2014, 2018; Reynolds, Richmond, & Lowe, 2003b).
Small to medium inverse relations have been reported between test anxiety and academic performance (mean rs = −.12 and −.29; Hembree, 1988). Chapell and colleagues (2005) conducted a study with 4,000 undergraduate students and examined the relationship between test anxiety and college GPA. The authors found a small, negative correlation of −.15 between the total scores of a test anxiety measure and college GPA. In contrast, positive, small to large correlations (rs = .12-.58) have been found between facilitating anxiety and GPA in samples of college students (Hembree, 1988; Lowe, 2018). These findings would also provide support for the convergent evidence of validity for the scores of a measure of test anxiety.
In contrast, negligible to small correlations (rs = −.14 to .10) have been reported between scores of test anxiety measures and Lie Scale scores (Lowe, 2014, 2018; Lowe et al., 2011). Negligible to small correlations between the scores of dissimilar constructs, such as test anxiety and lie (i.e., defensiveness), would provide discriminant evidence of validity for the scores of a measure of test anxiety.
The purpose of the present study was to examine the psychometric properties of the TAM-C, a new multidimensional measure of test anxiety based on current research and theory, in a sample of Canadian undergraduate students. New measures of test anxiety are needed that are multidimensional, based on current research and theory, capture the complexity of the test anxiety construct, and include updated test items and norms. However, before measures, such as measures of test anxiety, can be used in university and clinical settings in another country, they need to show validity in the country where they planned to be used (Mowbray et al., 2015). Many Canadian college students experience stress-related problems, including anxiety associated with tests. Therefore, a new, multidimensional measure based on theory and current research, such as the TAM-C, may be useful to mental health professionals who work with Canadian college students to identify those students who are test anxious. No studies have been conducted to date with Canadian college students on the TAM-C.
In the present study, the reliability and validity of the TAM-C scores were examined in a sample of Canadian college students. The author hypothesized the following:
Method
Participants
The participants included 312 Canadian undergraduate college students, 132 (42.3%) males and 180 (57.7%) females. The college students ranged in age from 18 to 26 years (M = 21.60 years, SD = 2.35 years). The number of students in their first, second, third, and fourth year of college was 82 (26.3%), 84 (26.9%), 66 (21.2%), and 80 (25.6%), respectively. College students self-identified their ethnic background—Aboriginal (2.6%), Asian (16.7%), Black (5.4%), Caucasian (67.3%), Latino (1.0%), Multiracial (2.9%), Pacific Islander (1.9%), and Other (3.8%). The students majored in a variety of disciplines, with liberal arts and social sciences (37.2%), business (17.3%), and health sciences (12.5%) accounting for the majority of the sample. All students were fluent in English and attended college in Canada. The provinces where the students resided included Alberta (12.8%), British Columbia (12.8%), Manitoba (3.2%), New Brunswick (1.6%), Newfoundland and Labrador (1.6%), Nova Scotia (3.2%), Ontario (50.0%), Prince Edward Island (0.3%), Quebec (12.2%), and Saskatchewan (1.3%). One percent of the college students did not identify a Canadian province where they lived.
The description of the Canadian college student sample in the current study is similar in many ways to the demographics of the Canadian college student population and/or the Canadian population. Approximately, 56% to 59% of Canadian college students are reported to be female (The Association of Universities and Colleges of Canada, 2011; Intini, 2013). The ethnic background of the Canadian population includes North American Aboriginal origins (4.6%); Other North American origins (27.6%); European origins (50.3%); Caribbean origins (1.6%); Latin, Central, and South American origins (1.4%); African origins (1.9%); Asian origins (12.5%); and Oceania origins (0.19%; Statistics Canada, 2011). The majority of Canadians live in the provinces of Ontario (38.5%), Quebec (23.0%), British Columbia (13.1%), and Alberta (11.7%), with fewer Canadians residing in the provinces of Manitoba (3.6%), Saskatchewan (3.2%), Nova Scotia (2.6%), New Brunswick (2.1%), Newfoundland and Labrador (1.5%), and Prince Edward Island (0.4%). The remainder of the Canadian population lives in the Northwest Territories, Yukon, and Nunavut (Statistics Canada, 2017).
Instruments
Adult Manifest Anxiety Scale–College Version (AMAS-C)
The AMAS-C (Reynolds, Richmond, & Lowe, 2003a) is a 49-item self-report measure designed to assess general anxiety in the college student population. The AMAS-C consists of a Total Anxiety scale, four anxiety (Physiological Anxiety, Social Concerns/Stress, Test Anxiety, and Worry/Oversensitivity) subscales, and a Lie scale. The Total Anxiety scale measures overall general anxiety. The Physiological Anxiety subscale assesses the physical symptoms of anxiety and the Social Concerns/Stress subscale measures the concerns an individual has about the perceptions of significant others toward oneself. The Test Anxiety subscale assesses the nervousness experienced during evaluative situations and the Worry subscale measures worrisome thoughts and unproductive rumination. The Lie scale assesses an overstated or erroneous view of oneself (Reynolds et al., 2003b). College students record their responses on a dichotomous scale, using a yes/no format. Reynolds and colleagues reported Cronbach’s alphas of .72 to .94 for the AMAS-C scores. Factorial, convergent, discriminant, and predictive validity evidence supporting the AMAS-C scores has been found (Lowe, 2013; Reynolds et al., 2003b).
The TAM-C
The TAM-C (Lowe, 2018) is a 43-item self-report instrument designed to assess test anxiety among the college student population. The TAM-C consists of five test anxiety scales, Cognitive Interference (eight items; for example, I have a hard time paying attention when I take a test), Physiological Hyperarousal (seven items; for example, my muscles ache when I take a test), Social Concerns (seven items; for example, I fear my instructor will berate me in front of the class if I do poorly on a test), Task Irrelevant Behaviors (six items; for example, I stay home on days when I am scheduled to take a test), and Worry (eight items; for example, I get nervous before I have to take a test) scales and one Facilitating Anxiety (seven items; for example, I know I will perform well on a test when I am slightly worried about it) scale. Raters respond to the TAM-C items on a 4-point Likert-type scale, with response options ranging from 1 (never) to 4 (almost always). Lowe (2018) reported internal consistency reliability estimates of .75 to .92 for the TAM-C scores in a sample of U.S. college students as well as factorial, convergent, and discriminant evidence of validity for the TAM-C scores.
Procedures
The college students completed the measures on a web-based survey (i.e., Qualtrics) in May of 2016. There are some advantages (e.g., ease of data collection and test administration, access to remote subgroups) and challenges (e.g., privacy and confidentiality issues, potential sampling bias, use of incentives) associated with online research (Kraut et al., 2004). However, extra efforts were made to address these challenges in the current study. This included the selection of an electronic platform that addresses many privacy and confidentiality issues associated with conducting research online. Qualtrics follows the Health Information Technology for Economic and Clinical Act requirements to protect data. High-end firewalls were used. Data were stored in a specific location, not in a cloud. A strong password account was used and access to the account was restricted to authorized individuals (i.e., the researcher only). These steps were taken to protect the privacy and confidentiality of each participant and his or her data. The college students were part of a research panel provided through Qualtrics and they received a link inviting them to participate in the survey. A research panel consists of individuals, who in this case, were college students, who agreed to voluntarily take the researcher’s survey. Those students read an information statement and then consented to participate in the study by clicking the forward button. In the information statement, participants were informed that their name would not be associated with the research findings; that any identifiable information would not be shared unless required by law, university policy, or student permission; and that it was possible with Internet communications an accident or intentional hacking may occur and someone other than the intended recipient may see their responses.
Once the students consented to participate in the study, they provided demographic information on themselves. Demographic information requested included their gender, age, years of schooling, year in college, college major, name and location of college, province where they resided, and self-reported GPA. After this information was provided, the students were instructed to read the directions for each measure and to complete them. The students received a small amount of money to compensate them for their time in participating in the study. The present study was approved by the author’s institutional review board and more specifically, the coordinator of the university’s institutional review board who has more than 5 years of experience and is well versed in research conducted online.
Results
Sources of Validity
Evidence based on the internal structure
Before the data were collected, a sample size heuristic (i.e., number of observations per variable rule, in this study, seven observations per variable) was used to determine the sample size for the proposed models to be tested. After the data were collected, three CFAs were performed to determine whether a two-factor (Test Anxiety and Facilitating Anxiety) model, a six-factor (Cognitive Interference, Physiological Hyperarousal, Social Concerns, Task Irrelevant Behaviors, Worry, and Facilitating Anxiety) model, or a six-factor model with a higher order factor (same factors in the six-factor model, but with the addition of one higher order factor) provided the best model fit to the data. Mplus 7.11 statistical software (Muthén & Muthén, 1998-2013) was used to conduct the three CFAs. The robust weighted least squares (robust mean- and variance-adjusted chi-square [WLSMV]) estimator was used to estimate the model parameters because of the ordered categorical nature of the data (see Wang & Wang, 2012). Model fit was evaluated using multiple fit indices, including a comparative fit index (CFI) and a Tucker–Lewis index (TLI) value of .90 and .95, indicating an adequate (Byrne, 1994) and a good model fit (Hu & Bentler, 1999), respectively. In addition, root mean square error of approximation values were <.06 and ≤.08, indicating a good model fit (Hu & Bentler, 1999) and an adequate model fit to the data (Browne & Cudeck, 1993), respectively.
The fit indices for the two-factor model, six-factor model, and six-factor model with a higher order factor are presented in Table 1. The two-factor model had a poor model fit. In contrast, both the six-factor model and the six-factor model with a higher order factor had an adequate model fit. The six-factor model and the six-factor model with a higher order factor are nested models. Therefore, a chi-square difference test was conducted. The result of the chi-square difference test was significant, ΔWLMSVχ2(9) = 91.818, p < .0001, indicating that the six-factor model is a better model fit to the data than the six-factor model with a higher order factor. Standardized factor coefficients for the six-factor model are presented in Table 2 and ranged from .50 to .88. Standardized factor coefficients between the factors ranged from .01 to .90.
Summary of the Fit Indices for the Two-Factor Model, Six-Factor Model, and Six-Factor Model With a Higher Order Factor for the TAM-C (n = 312).
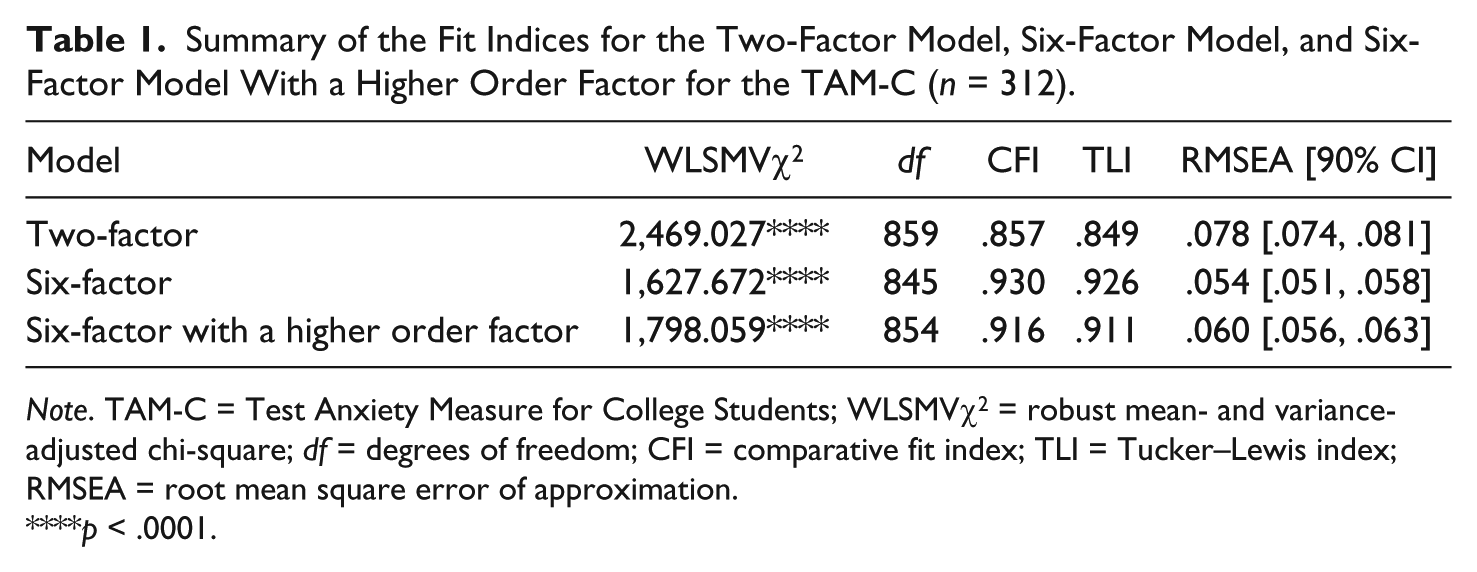
Note. TAM-C = Test Anxiety Measure for College Students; WLSMVχ2 = robust mean- and variance-adjusted chi-square; df = degrees of freedom; CFI = comparative fit index; TLI = Tucker–Lewis index; RMSEA = root mean square error of approximation.
p < .0001.
Standardized Factor Coefficients for the Six-Factor Model Factor for the TAM-C.
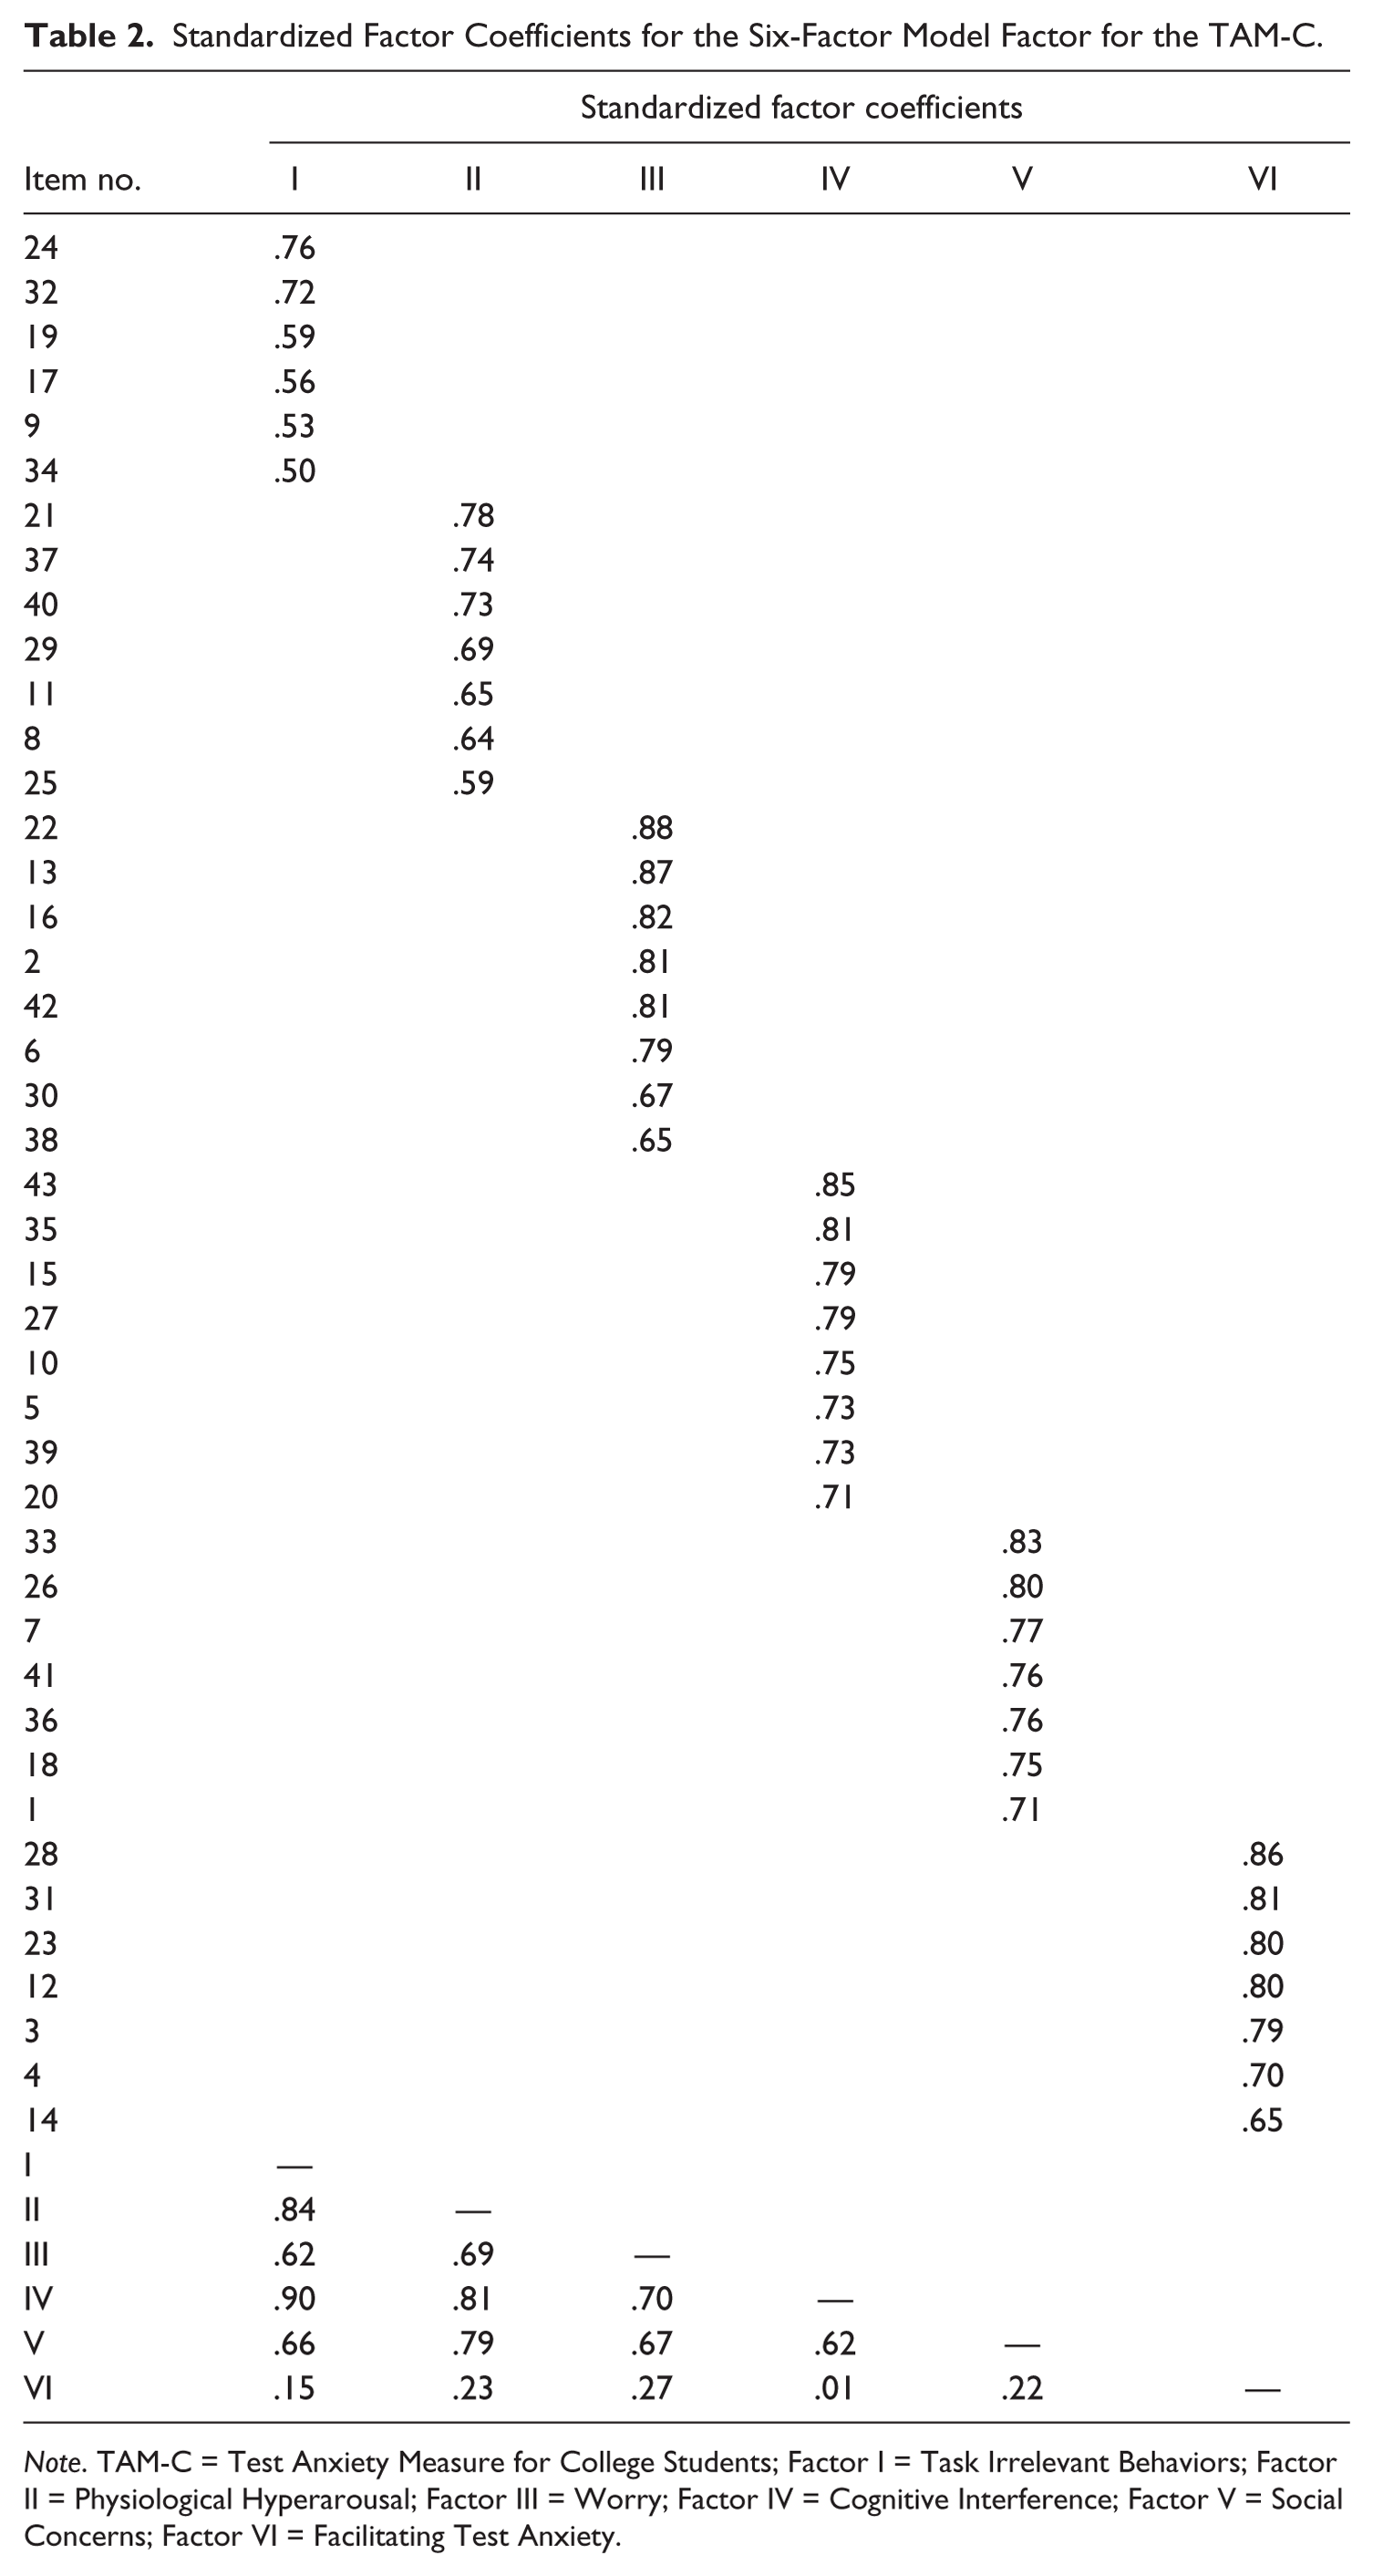
Note. TAM-C = Test Anxiety Measure for College Students; Factor I = Task Irrelevant Behaviors; Factor II = Physiological Hyperarousal; Factor III = Worry; Factor IV = Cognitive Interference; Factor V = Social Concerns; Factor VI = Facilitating Test Anxiety.
Reliability
Composite reliabilities (CRs) were computed for the six factors of the TAM-C using Raykov’s (1997) formula. The latent reliabilities ranged from .78 to .93 (Cognitive Interference CR = .92, Physiological Hyperarousal CR = .86, Social Concerns CR = .91, Task Irrelevant Behaviors CR = .78, Worry CR = .93, and Facilitating Anxiety CR = .91).
Evidence based on external relations
Bivariate correlations were conducted between the TAM-C scores and the AMAS-C scores (see Table 3). Small to large correlations of .25 to .72 were reported between the TAM-C test anxiety scores and the AMAS-C anxiety scores. The TAM-C Physiological Hyperarousal and Worry scores had their highest correlations with the AMAS-C Total Anxiety and Test Anxiety scores as well as the scores of a similar dimension found on the AMAS-C. The TAM-C Cognitive Interference and Social Concerns scores had their highest correlations with the AMAS-C Total Anxiety and Test Anxiety scores. The TAM-C Task Irrelevant Behaviors scores correlated highest with the AMAS-C Total Anxiety, Test Anxiety, and Physiological Anxiety scores. In addition, a small, positive correlation was found between the TAM-C Facilitating Anxiety scores and students’ self-reported GPA. Furthermore, small, negative correlations were found between the TAM-C test anxiety scores and students’ self-reported GPAs. The smaller correlations with self-reported GPA and the TAM-C scores suggest that test and facilitating anxiety and academic achievement are related, but different constructs. Overall, these findings provide support for the convergent evidence of validity for the TAM-C scores. In contrast, the TAM-C scores had negligible correlations with the AMAS-C Lie scores, supporting discriminant evidence of validity for the TAM-C scores.
Correlations Between the TAM-C Scores and AMAS-C Scores and GPAs.
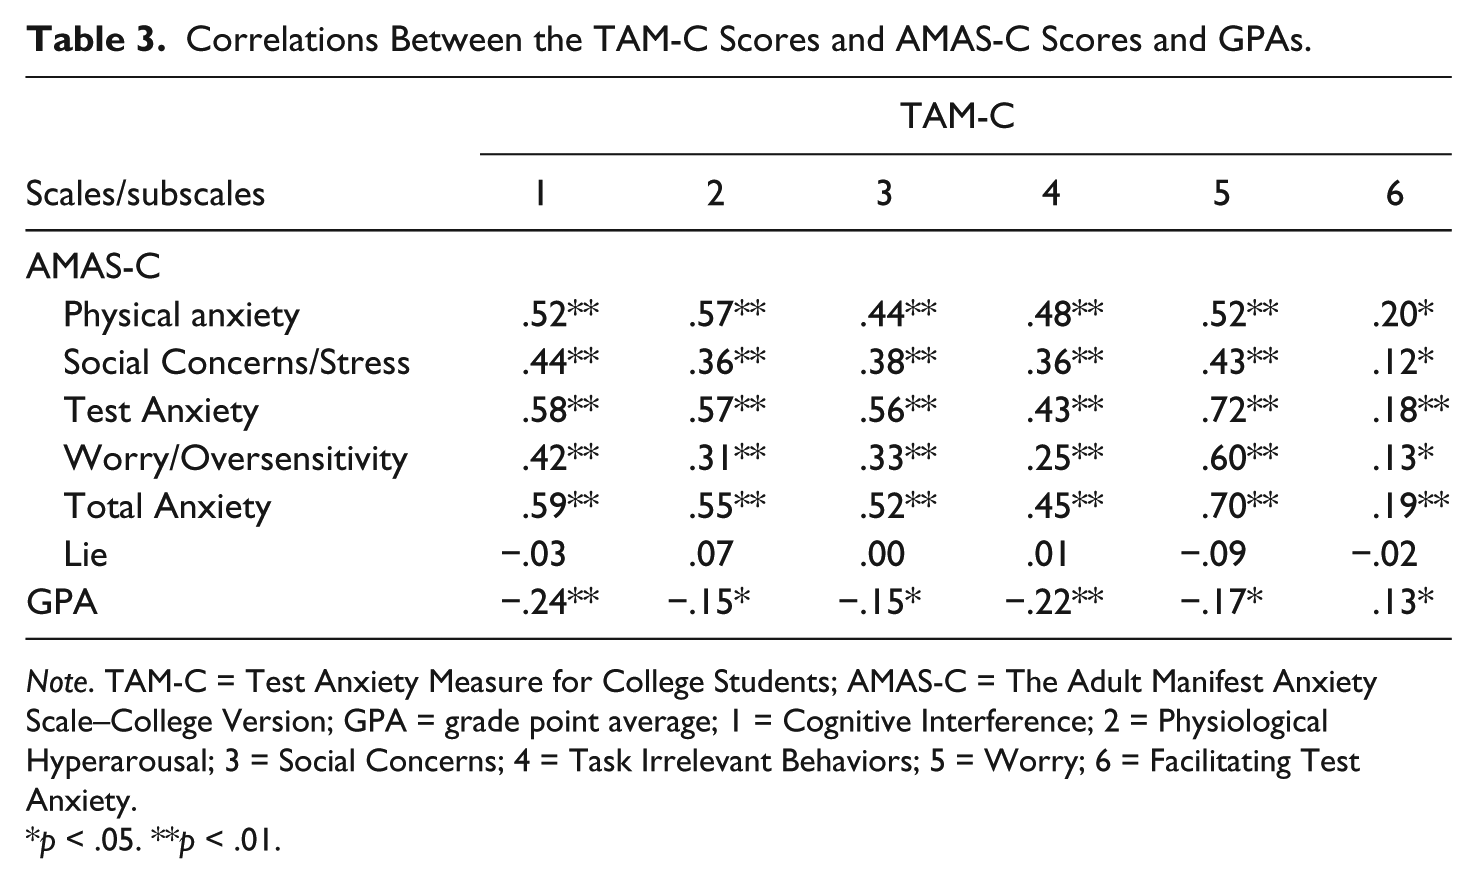
Note. TAM-C = Test Anxiety Measure for College Students; AMAS-C = The Adult Manifest Anxiety Scale–College Version; GPA = grade point average; 1 = Cognitive Interference; 2 = Physiological Hyperarousal; 3 = Social Concerns; 4 = Task Irrelevant Behaviors; 5 = Worry; 6 = Facilitating Test Anxiety.
p < .05. **p < .01.
Discussion
Overall, the findings provide support for the psychometric properties of the TAM-C scores in a sample of Canadian college students. The results of CFAs validated the six-factor structure of the TAM-C scores with Canadian college students. These findings are similar to the results reported with U.S. college students on the TAM-C (Lowe, 2018). The same items loaded on the same factors in both the Canadian and U.S. college student samples. However, it should be noted that a high standardized factor coefficient was found between the Cognitive Interference and Task Irrelevant Behaviors factors with the Canadian college student sample in the current study. Research has found standardized coefficients (or correlations) of similar magnitude between factors of test anxiety (Everson, Millsap, & Rodriguez, 1991; Hembree, 1988).
CRs for the TAM-C six factors were reported to be adequate in the Canadian college student sample and indicate strong intrafactor correlations for the scores of the measure (see Mueller & Hancock, 2008). These findings are somewhat similar to the adequate reliability coefficients of .75 to .92 reported with a U.S. college student sample on the TAM-C (Lowe, 2018). However, Cronbach’s coefficient alphas were reported for the TAM-C scores in the U.S. college student sample, whereas CRs were reported for the TAM-C scores in the Canadian college student sample. Cronbach’s coefficient alphas are based on observed scores and CRs are based on latent variables.
Medium to large correlations (rs = .31-.72) were found between the TAM-C test anxiety scores and the scores of the AMAS-C anxiety scale and subscales in the Canadian college student sample, with one exception. A small correlation of .25 was reported between the TAM-C Task Irrelevant Behaviors scores and the AMAS-C Worry/Oversensitivity scores. These correlations reported are similar to the medium to large correlations (rs = .30-.72) found between the TAM-C test anxiety scores and the scores of the AMAS-C anxiety scores with a U.S. college student sample (Lowe, 2018). Although the magnitude of the correlation between the scores of the TAM-C Task Irrelevant Behaviors scores and the AMAS-C Worry/Oversensitivity scores reported with the Canadian college student sample was small, it was not much different in magnitude than the correlation (r = .32) between the TAM-C Task Irrelevant Behaviors scores and the AMAS-C Worry/Oversensitivity scores with a U.S. college student sample (Lowe, 2018). It should be noted that a high correlation between the TAM-C Task Irrelevant Behaviors scores and the AMAS-C Physiological Anxiety scores was found with the Canadian college student sample. This finding was not surprising as some of the AMAS-C Physiological Anxiety items assess behavioral responses associated with general anxiety (see Reynolds et al., 2003b). In addition, a small, positive correlation (r = .13) was found between the TAM-C Facilitating Anxiety scores and Canadian students’ self-reported GPA. Likewise, a small, positive correlation (r = .12) was reported between the TAM-C Facilitating Anxiety scores and U.S. students’ self-reported GPA (Lowe, 2018). Moreover, small, negative correlations (rs = −.15 to −.24) were found between the TAM-C test anxiety scores and Canadian students’ self-reported GPA in the current study. These findings are similar to Chapell and colleagues’ (2005) findings of a small, negative correlation of −.15 between the scores of a test anxiety measure and self-reported GPA in a sample of U.S. college students. Overall, these findings provide evidence of convergent validity of the TAM-C scores in a sample of Canadian college students.
In contrast, negligible correlations (rs = −.09 to .07) were found between the TAM-C scores and the AMAS-C Lie scale scores with the Canadian college student sample. These results are somewhat similar to the findings of negligible to small correlations (rs = .00-.10) between the TAM-C scores and the AMAS-C Lie scale scores reported with a U.S. college student sample (Lowe, 2018). Overall, these findings provide evidence of discriminant validity for the TAM-C scores in a sample of Canadian college students.
The findings from the present study are the first to be reported on the psychometric properties of the TAM-C scores with a sample of college students outside of the United States. Mowbray and colleagues (2015) have stated that measures used to assess test anxiety must show validity in the country where individuals plan to use them, as the pattern and level of test anxiety may differ in different countries (Bodas & Ollendick, 2005; Sharma & Sud, 1990). Even though there are many cultural similarities between Canada and the United States, there are also many differences between the two countries. Therefore, it would be important to conduct studies to assess the psychometric properties of a new measure of test anxiety, such as the TAM-C, developed in the United States prior to its clinical use in a different country, such as Canada.
The TAM-C is a unique measure, as it includes both Test Anxiety and Facilitating Anxiety scales. Research has shown test anxiety and facilitating anxiety are significantly better predictors of college students’ academic performance when used together than when either of these predictors is used alone (Alpert & Haber, 1960), although research still needs to be conducted to determine whether similar results would be found with the TAM-C.
There are several limitations associated with the present study. Although the demographics of the current sample is similar in many ways to the Canadian college student population and the Canadian population, there are some differences. A larger portion of the Canadian college students in the current study were liberal arts and social science majors (37.2%), resided in the province of Ontario (50.0%), and were Asian (16.7%), and a smaller portion were Caucasian (67.3%) and lived in the province of Quebec (12.2%) in comparison with the Canadian student population or Canadian population. A sample of convenience, such as the sample used in the current study, may limit the generalizability of the findings of a study. Therefore, the results of the present study should be interpreted with caution. Replication of the present study with a more diverse Canadian college student sample that includes more non–liberal arts and social science majors, and students from the province of Quebec and fewer Asian students and students from the province of Ontario should be conducted to determine whether the results are similar to the findings reported in the current study. A second limitation is the reliance on college students’ self-report only. Self-report has the potential to introduce common method bias. Although a potential problem, research has shown that adolescents and adults tend to be better informants of their own internalizing issues than reports completed by other individuals (Whitcomb & Merrell, 2013). However, future research studies should include multitrait, multimethod models within a structural equation modeling framework to examine convergent and discriminant evidence of validity of the TAM-C scores. A third limitation is the possibility of sampling bias in the present study. Certain subgroups, such as college students with test anxiety, may have chosen not to participate in the current study. In addition, the use of a small incentive to compensate students for their time may have also resulted in sampling bias, as the incentive may have influenced students’ decision to participate in and to complete the survey. Furthermore, although an extra effort was made to protect the privacy and confidentiality of the participants and the participants were informed that it was possible with Internet communications that an accident or intentional hacking may occur and someone other than the intended recipient may see their responses, knowledge of this information may have resulted in some students deciding not to volunteer for the study, resulting in the possibility of sampling bias. However, it is important to note that the possibility of sampling bias is not restricted to online surveys, but it is also a problem that may be encountered in research conducted via traditional methods. A fourth limitation is that a sample size heuristic was used to determine the size of the sample for the proposed models to be tested in the present study. However, Nevitt and Hancock (2004) have shown that even when the number of observations per variable rule is met, extreme nonnormality may result in problems in accurately estimating the parameter values. Therefore, the results reported in the current study should be interpreted with caution. In future studies with the TAM-C where different models are tested, power analyses (i.e., simulated Monte Carlo studies) should be conducted to determine whether a reasonable amount of power and precision exists for the parameter estimates in the proposed models to be tested. A fifth limitation is that even though self-reported GPA is a popular variable used to measure academic performance in research and it has a high correlation of .90 with actual grades (Kuncel, Credé, & Thomas, 2005), personality traits (e.g., conscientiousness; Cheng & Ickes, 2009), and intelligence (Kuncel et al., 2005) have been found to moderate self-reported GPA. Therefore, the relationship between test anxiety and self-reported GPA in the present study should be interpreted with caution. Future studies with the TAM-C should investigate personality traits and intelligence as potential moderating variables in the relationship between test anxiety and self-reported GPA. In addition to these limitations and the need to conduct further studies with the measure, another future research direction is measurement invariance studies with the TAM-C across age, gender, and Canadian and U.S. college students.
In sum, the findings from the present study provide evidence for the validity of the TAM-C scores in a sample of Canadian college students. This is the first study conducted with the TAM-C in a sample of college students outside the United States. The TAM-C is a multidimensional measure of test anxiety based on current research and theory in the field and includes a unique feature, a Facilitating Anxiety scale. New measures of test anxiety are needed for college students and although additional research needs to be conducted with the TAM-C in Canada and the United States prior to its use in university and clinical settings, it does appear to be a promising, new measure of test anxiety designed specifically for college students.
Footnotes
Declaration of Conflicting Interests
The author(s) declared the following potential conflicts of interest with respect to the research, authorship, and/or publication of this article: I am one of the co-authors of the Adult Manifest Anxiety Scale–College Version. The Adult Manifest Anxiety Scale–College Version is published by Western Psychological Services, a test publishing company in the United States, and I receive a small royalty from the company.
Funding
The author(s) received no financial support for the research, authorship, and/or publication of this article.