
Abstract
This study is part of a larger initiative toward understanding the acculturation of immigrant adolescents using the Longitudinal Study of Young People in England 2004-2010 database. A necessary step in using a database for cross-ethnic comparisons is first to verify whether its items and scales are equivalent. I examined item- and scale-level differential functioning (DF; n = 4,663, six ethnic minority groups) on four of the database’s sociocultural scales: Feelings About School (11 items), Relational Family Efficacy (four items), Being Bullied (five items), and Perceived Teacher Discrimination (four items) using an item response theory (IRT)–based framework. Findings demonstrated no meaningful DF on items and, in most cases, scales as well. Second, distinct ethnic group patterns are present. Third, the Perceived Teacher Discrimination scale was not functioning for the majority of the ethnic minority groups which is of grave concern. Implications for future comparative studies and immigration policy makers are discussed.
Background on Immigration Policy
The United Kingdom engaged in a number of strategic efforts to maintain itself as a world power soon after World War II (WWII). One of these efforts was to welcome in citizens of its former colonies and gain recognition as a settler society (Fomina, 2010). A settler society is one that has a long history of encouraging and welcoming immigration (Sam & Berry, 2010). The perception of the United Kingdom as a settler society was fostered by the British Nationality Act of 1948 (www.legislation.gov.uk) which granted those born in the United Kingdom or British colonies the status of U.K. citizenship. In fact, Britain actively recruited labor migrants from its colonies due to its labor market needs in the aftermath of WWII (Ali & Gidley, 2014). Thus, ethnic minority groups from India, Pakistan, and the West Indies have had a strong presence in the United Kingdom since the 1950s, as these nations are “old” commonwealth countries and have had in their past a somewhat unrestricted process of settling within the United Kingdom.
Since the 1960s, the United Kingdom’s government introduced a series of restrictions on immigration to make it more difficult for individuals from commonwealth countries to enter and remain in the United Kingdom. These restrictions began with distinctions between full citizens with full rights and British subjects with limited rights and the enforcement of work permits, to the reversal of citizenship for commonwealth countries (Fomina, 2010; Hatton & Wheatley Price, 1999). Subsequent policies centered on making it more difficult for asylum seekers and refugees to gain access to the United Kingdom or limited the amount of support they could receive once there (Fomina, 2010). Despite the growing restrictions on the United Kingdom’s immigration policy during the 1960s, large numbers of Indians and Pakistanis still arrived in the 1960s and 1970s, as well as African Asians from Uganda in the early 1970s and Bangladeshi immigrants following in the 1980s (Crawley, 2009). Chinese immigrants have always had a presence in the United Kingdom, though a wave of Chinese immigrants came in the 1980s and 1990s along with Nigerians and Ghanaians (Van Hear, Pieke, & Vertovec, 2004).
It is necessary to point out that the United Kingdom also has a long history of racism toward Black and Asian immigrants (Hatton & Wheatley Price, 1999; Young, 2003). Nevertheless, the United Kingdom also has a more recent history of antidiscriminatory acts to support race relations and immigrant integration (Ali & Gidley, 2014). One significant outcome of the 1960s antidiscriminatory acts was an advocacy to not distinguish immigrants from the general population because the majority were from British colonies and at that time were technically British (Ali & Gidley, 2014). In line with this, to date, the United Kingdom’s national databases tend to differentiate people groups by ethnicity, not immigrant or generation status (Crawley, 2009). Thus, throughout the remainder of this article, I use the terms ethnic minority and immigrant interchangeably.
One unintended consequence of not distinguishing immigrants from the general population within national databases is that we are currently limited in what we can know about the plight of first-, second-, and third-plus-generation immigrants there. Thus, there are fewer opportunities to quantitatively examine immigrant psychological and sociocultural adaptation to United Kingdom’s society using large-scale databases simply because variables for generation status are often not reported.
Given this background, it is important to begin identifying large-scale databases that would allow us to examine the acculturation of immigrant groups within the United Kingdom. Notably, immigration policy in the early 2000s shifted from assimilation to integration (Ali & Gidley, 2014; Young, 2003). Recent immigration policy outlined in the Borders, Citizenship & Immigration Act of 2009 focuses on the integration of ethnic minorities through local initiatives rather than a top-down approach, with a shift in emphasis onto community cohesion rather than multiculturalism (Ali & Gidley, 2014). Furthermore, the United Kingdom has placed a priority on developing integration programs for ethnic minority adolescents to facilitate their transitioning there and to alleviate social injustices these groups have historically experienced (Ali & Gidley, 2014; Young, 2003). An important question to address then is to what extent do immigrant adolescents perceive themselves as integrated into society?
Fields that have taken the lead in studying immigrant populations within their settler societies have been within the domains of social anthropology, economics, sociology, and cross-cultural psychology. For example, centers such as the Center for Research and Analysis of Migration and the Sussex Center for Migration Research within the United Kingdom have lead the way in laying a foundation of what we know about the adaptation of immigrant groups through the lens of economics and multidisciplinary studies. This article adopts a cross-cultural psychology perspective for understanding immigrant adolescents within settler societies (Berry, Phinney, Sam, & Vedder, 2006; Sam & Berry, 2010). Berry and colleagues demonstrated that when examining the acculturation of immigrant groups within settler societies, researchers should focus on measures of their psychological, sociocultural, and economic adaptations within their settler societies. A major limitation to quantitatively examining psychological and sociocultural adaptation factors for United Kingdom’s adolescent immigrants is finding a national database that contains these types of variables as well as containing information on immigrant status.
It is fortunate that the Longitudinal Study of Young People in England (LSYPE) 2004-2010 database (Department for Education, National Centre for Social Research, 2012) contains variables that allow researchers to distinguish between adolescents who are first versus second-plus generation. The LSYPE 2004-2010 database was designed to provide an evidence base for further policy development in England (Department for Education, National Centre for Social Research, 2012). In fact, the LSYPE 2004-2010 “is one of the main information sources for the formation and appraisal of policies relating to young people and will continue to be so for at least the next 10 years. The baseline data will be used to monitor the progress of the cohort group, evaluate the success of policies aimed at this group and provide an evidence base for further policy development” (Department for Education, National Centre for Social Research, 2012, abstract). According to Department for Education (2010), “It is the only major longitudinal study focusing on young people’s experiences and entry into adulthood” (p. 9). These claims are notable because this database is among the few that can be used to establish the literature base on immigrant adolescents living in the United Kingdom.
Measurement Invariance of Item and Scales Within Large-Scale Databases
One of the challenges with using national large-scale databases is that they are oftentimes not designed with a particular theory in mind. For example, the LSYPE 2004-2010 was not designed with the intention of examining the acculturation of immigrant adolescents per se, but rather, the design was a wide fishing net to capture as many aspects related to adolescent development that would inform a wide range of policies. Second, while there are groups of items intended to measure certain constructs, only some have undergone a priori validity testing. For example, the LSYPE 2004-2010 contains the 12-item General Health Questionnaire which boasts of well-established psychometric properties worldwide as well as for this cohort (Bowe, 2017). However, the database also contains many more groups of items intended to measure other attitudes, behaviors, and traits (e.g., academic self-concept, parent involvement with school, perceived discrimination) of which there is no validity evidence reported within the technical manuals. Thus, while researchers use individual items or various combinations of items for comparative analyses, few report validity evidence to deem such comparisons appropriate (e.g., see methodologies of Demack, Platts-Fowler, Robinson, & Stevens, 2010; Strand, 2007; Strand & Winston, 2008).
A necessary step toward establishing the comparative literature base on immigrant adolescents in England using the LSYPE 2004-2010 database is to first verify that the scales and items in the database are equivalent (Stark, Chernyshenko, & Drasgow, 2006). Measurement equivalence provides validity evidence on whether an item, scale, or instrument designed to assess a particular attitude or behavior has the same meaning across different groups. If equivalency is established, researchers could go ahead and make group comparisons on derived scores because inferences made would be valid (Raju, Laffitte, & Byrne, 2002).
Equivalency can be inferred through studies that examine either measurement invariance, item bias, and differential item/scale/test functioning (Zumbo, 1999), as these studies are all fundamentally trying to determine whether or not there is enough evidence to support group comparisons on derived scores.
Measurement equivalence is typically examined through confirmatory factor analysis (CFA) or item response theory (IRT) approaches (Stark et al., 2006). This study defines measurement equivalency within the IRT framework and describes it in terms of differential functioning (DF) of items or scales. According to (Zumbo, 1999), differential item functioning (DIF) occurs when “examinees from different groups show differing probabilities of success on (or endorsing) the item after matching on the underlying ability that the item is intended to measure” (p. 12). Similarly, scale-level DF (scale DF) refers to differences in the expected total score among individuals having the same level of ability but belonging to different groups (Stark et al., 2004).
I utilized an IRT-based approach for this study rather than a CFA-based approach for a number of reasons. First, IRT approaches capitalize on the amount of variation per item rather than assuming a standard variation. Second, these approaches do not assume the item responses are continuous and linear. Third, these approaches do not assume equal accuracy in measurement across the entire range. Fourth, IRT approaches are more sensitive to group differences for measures of central tendency and the use of extreme scores (Raju et al., 2002; Tay, Meade, & Cao, 2015). I do acknowledge though there is some evidence that CFA approaches such as the means and covariance methods can perform equally as well as IRT methods for polytomous items under certain conditions related to scale size, sample size, source of DIF, and magnitude of DIF (Kim & Yoon, 2011; Stark et al., 2006). Finally, IRT-based software affords the calculation of effect size indices at the item and scale levels. Effect size indices are important to report because statistical significance does not necessarily translate into meaningful differences (Teresi, Ramirez, Lai, & Silver, 2008). A summary of different effect sizes used for determining DIF are found in Teresi et al. (2008). Effect size indices used for determining scale DF are discussed in Meade (2010).
This study examined DF at both item and scale levels because researchers tend to use specific items or groups of items found within this database without necessarily reporting validity evidence. The literature demonstrates that important sociocultural factors to consider for immigrant adolescents are feelings/attitudes toward school and school adjustment (Berry et al., 2006), collective family efficacy (Kao, Lupiya, & Clemen-Stone, 2014), family cultural possessions (Marks, 2005), participation in religious practices (Connor, 2012), and participation in sports/exercise and risky behavior (Abraído-Lanza, Chao, & Florez, 2005), among others. This study examined the scales of Feelings About School, Relational Family Efficacy, Being Bullied, and Perceived Teacher Discrimination as these are important sociocultural factors that are relevant to the developmental stage of adolescence and were actually collected in the LSYPE database.
Method
Database
Data came from the first LSYPE 2004-2010 project (N = 15,770), which was a nationally representative longitudinal cohort study of young people in England during the years 2004-2010. Data collection began in 2004 when the adolescents were 13 and 14 years of age and continued in yearly intervals until 2010. Information in this database was collected from interviews with the Young Person (adolescent), the Main Parent, and the Secondary Parent. The information collected provides data about the adolescent’s family background, personal characteristics, attitudes, experiences and behaviors, and attainment in education, among many more variables. More information about the first LSYPE 2004-2010 database, its sampling procedures, and methods for handling missing data can be found in the LSYPE user guide found at this website: https://www.ukdataservice.ac.uk/
Demographics
The LSYPE 2004-2010 project asked adolescents to indicate their ethnic group from a choice of 16 options. The sample sizes of the ethnic groups are in Table 1. For this study, I placed biracial adolescents into the category of their ethnic minority group. For example, I combined White and Black Caribbean biracial adolescents with those who were Black Caribbean, as García Coll and Marks (2012) pointed out that biracial adolescents tend to identify more with their ethnic minority heritage; further society tends to view them as such.
Ethnic Characteristics of Adolescents in the LSYPE 2004-2010 Database.
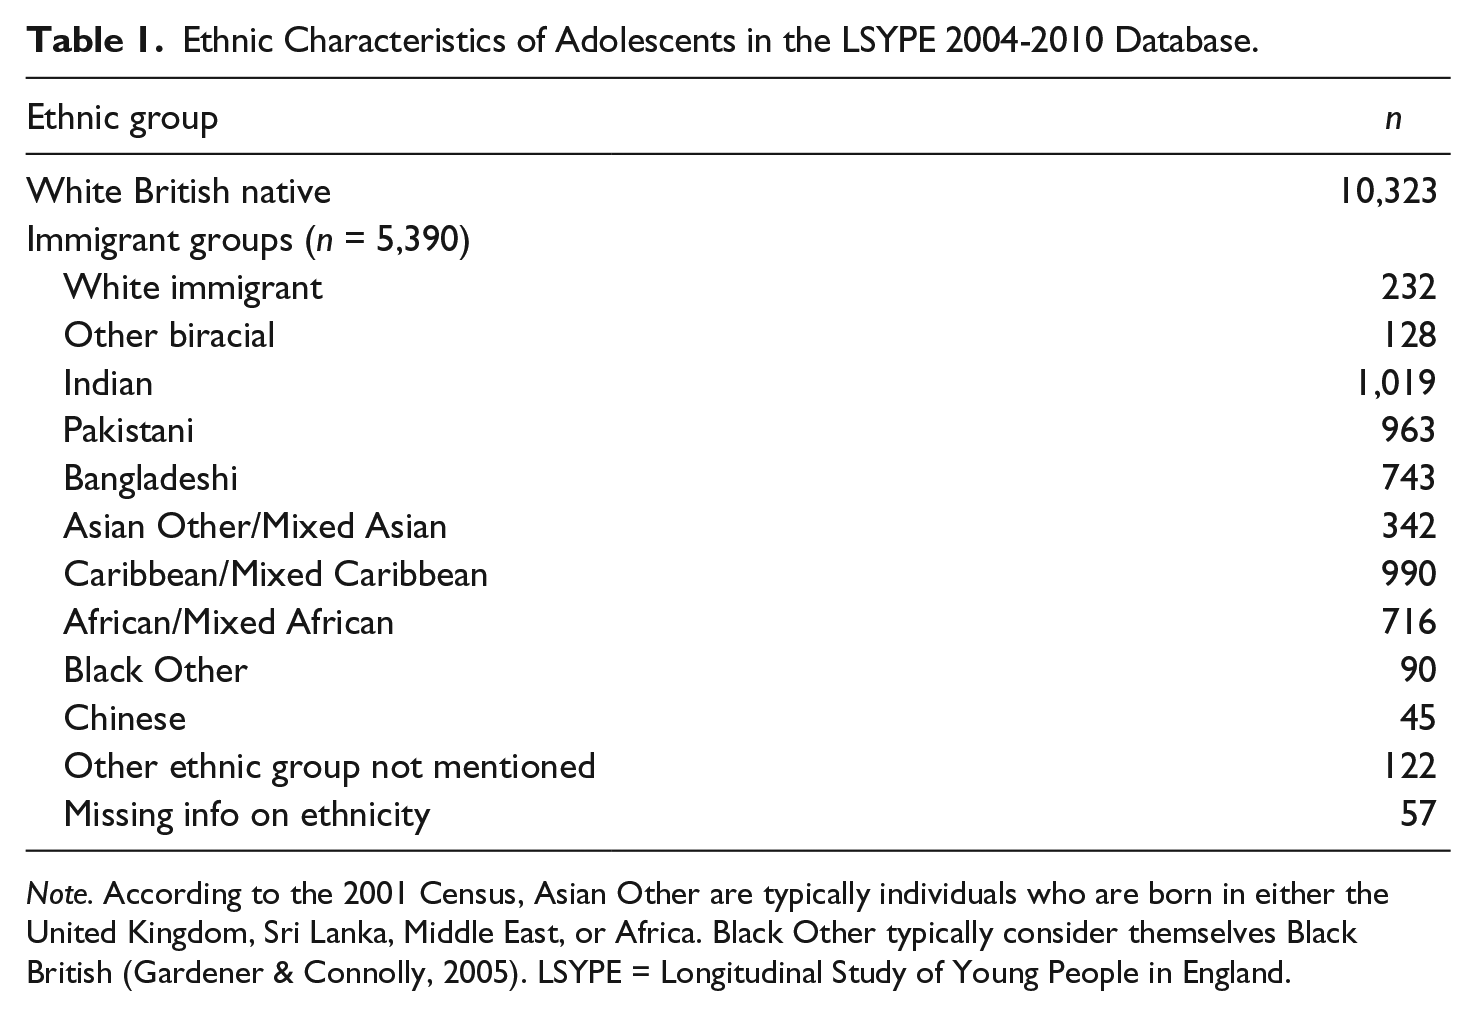
Note. According to the 2001 Census, Asian Other are typically individuals who are born in either the United Kingdom, Sri Lanka, Middle East, or Africa. Black Other typically consider themselves Black British (Gardener & Connolly, 2005). LSYPE = Longitudinal Study of Young People in England.
Scales
Data were obtained from the wave that represented the largest sample size for the construct under study. Thus, data for Feelings About School and Relational Family Efficacy were taken from Wave 1 and data for Being Bullied and Perceived Teacher Discrimination were taken from Wave 2. This study limited itself to the examination of cross-sectional data only, as the goal was to establish equivalence between groups and not equivalence over time.
Feelings About School scale
There were 13 items measuring adolescents’ feelings about school. These items were on a 4-point ordinal scale (strongly agree, agree, disagree, strongly disagree). I omitted two of the 13 items because they did not fall into attitudinal domains recognized in the literature (Croll, Atwood, Fuller, & Last, 2008); furthermore, other scholars using this database have also found these two items problematic for this scale (e.g., see Strand, 2007). I coded items such that higher values indicated more positive feelings about school.
Relational Family Efficacy scale
There were four items describing adolescents’ family relations with their mothers. Adolescents indicated their perception of their relationship on a 4- or 5-point scale (e.g., “very badly, fairly badly, fairly well, very well” or “never/not at all, hardly ever, less than once a week, more than once a week”). I coded items in the direction such that higher values indicated more family relational efficacy. I collapsed the first two categories for the first item in the scale because there were few responses in the first category.
Being Bullied scale
There were five items asking adolescents whether they experienced a certain form of bullying within the last school year. Items were dichotomous (yes/no) and coded in the direction such that higher numbers indicated no bullying.
Perceived Teacher Discrimination scale
There were four items asking the adolescents about their perceptions of discrimination or unfair treatment from teachers. One item was dichotomous (yes/no) and the remaining three were on a 5-point scale (all, most, some, hardly any, none). I coded items such that higher values indicated fewer perceptions of teacher discrimination. I collapsed the first two categories for the second item in the scale because there were few responses in the first category.
Analysis
Unidimensionality
First, I assessed the unidimensionality of each of the scales for each ethnic group separately using configural factor analyses because this is a prerequisite step to DIF analyses (Tay et al., 2015). Fit indices’ values inform on the degree of fit for each ethnic group. This study adopted a cutoff criteria of .05 for the root mean square error of approximation (RMSEA) and .95 for the Tucker-Lewis index (TLI) and comparative fit index (CFI) for good fit; .08 for the RMSEA and .90 for the TLI and CFI for reasonable/adequate fit; and .10 for the RMSEA and less than .90 for the TLI and CFI for poor fit (Brown, 2006). This study deemed that configural analyses held if at least two of three fit indices demonstrated adequate or better fit. If configural analyses did not hold, analyses stopped here.
DIF Analyses
Next, I used the lordif package (Choi, Gibbons, & Crane, 2011) in R to conduct DIF analyses. Lordif is unique in that it allows a hybrid approach of logistic regression and IRT. I used this hybrid approach rather than pure IRT methods because my analyses were computationally intensive and ordinal regression methods make fewer demands on processors than pure IRT methods (Teresi et al., 2008). Second, the logistic regression methods allowed me to calculate uniform, nonuniform, and overall DIF for each item (Teresi et al., 2008). The lordif package uses IRT latent trait scores as the conditioning variable rather than observed scores (Choi et al., 2011), which corrects the disadvantage of pure logistic regression approaches (Teresi et al., 2008). A second important capability of lordif is that it allows an omnibus test of DIF over all ethnic groups. Omnibus testing provides researchers with preliminary information as to whether two-group testing of DIF (i.e., referent vs. focal group) is necessary. A detailed explanation of the exact algorithm for lordif is found in Choi et al. (2011).
For all DF analyses, I used Indian adolescents as the referent (except in omnibus testing) as it is recommended to use nondominant groups rather than the dominant group in acculturation studies (Berry et al., 2006). Note that the Indian group is one of the most established ethnic minority groups in the United Kingdom (Crawley, 2009) and had the largest ethnic minority sample size within the database. Focal groups included all ethnic minority groups that had a sample size of at least 200 (see Scott et al., 2009, for sample size suggestions). Asian Other was not included in analyses because this was a heterogeneous Asian group representing individuals from Africa, Sri Lanka, Middle East, or the United Kingdom.
I used both the McFadden’s pseudo-R2 values and the likelihood ratio χ2 test (Jodoin & Gierl, 2001) for DIF detection. Lordif provides the option of using Monte Carlo simulations to set the alpha level. To save processing time, I instead used a Bonferroni correction for multiple testing as recommended by Stark et al. (2006) and set the alpha level to α = .05 / [No. of items × No. of focal groups]. I used the following guidelines for interpreting moderate and large effect sizes for DIF: .035 ≤ R2Δ – U < .070 as medium effect size; R2Δ – U ≥ .070 as large effect size; and anything less than .035 as negligible (Jodoin & Gierl, 2001).
The LSYPE 2004-2010 contains school clusters and various types of weights to accommodate for design effect, oversampling, and nonresponse. Clusters, but not weights, were included in single-group configural analyses testing, as it did not seem appropriate to use weights in single-group analyses. Weights or clusters were included in DF analyses in lordif as these analyses did not include the entire LSYPE sample.
Scale DF Analyses
To determine whether scale DF was present, I calculated and interpreted a scale-level effect size index called the Expected Test Score Standardized Difference (ETSSD; Meade, 2010). Values of .2, .4., and .8 represent small, medium, and large effect sizes, respectively (Meade, 2010). My steps were as follows: First, I calculated equated item parameters in R using the ltm package; second, I imported these values into the VisualDF software (http://www4.ncsu.edu/~awmeade/; Meade, 2010) to calculate the ETSSD for each scale.
Results
Configural Invariance Analyses
Configural invariance held for all ethnic groups on the Feelings About School scale, the Relational Family Efficacy scale, and the Being Bullied scale. Configural invariance only held on the Perceived Teacher Discrimination scale for the White Immigrant, White Native, and Indian adolescent groups (see Table A2 in the appendix). Thus, I decided to proceed with DIF testing on the three scales using all ethnic minority groups, but on the Perceived Teacher Discrimination scale, I limited analyses to just the Indian and White immigrant groups.
Dif
Table 2 presents the items in their respective scales that lordif flagged as having DIF. I reported McFadden’s pseudo-R2 values only in Table 2. Lordif could not complete DIF analyses for items on the Relational Family Efficacy scale or the Perceived Teacher Discrimination scales, as an error message reported that a minimum of five items per scale is needed. Thus, a second limitation of this study is that DIF analyses could only be conducted on two of the scales that passed the test for configural analyses. An error message was also generated when comparing Indian to Pakistani adolescents on the Being Bullied scale (unable to fit the model using lrm.fit). Note in Table 2 that the effect size index demonstrated that uniform, nonuniform, and overall DIF on each item were negligible.
Effect Sizes of the Amount of Uniform, Nonuniform, and Overall DIF Present by Item.
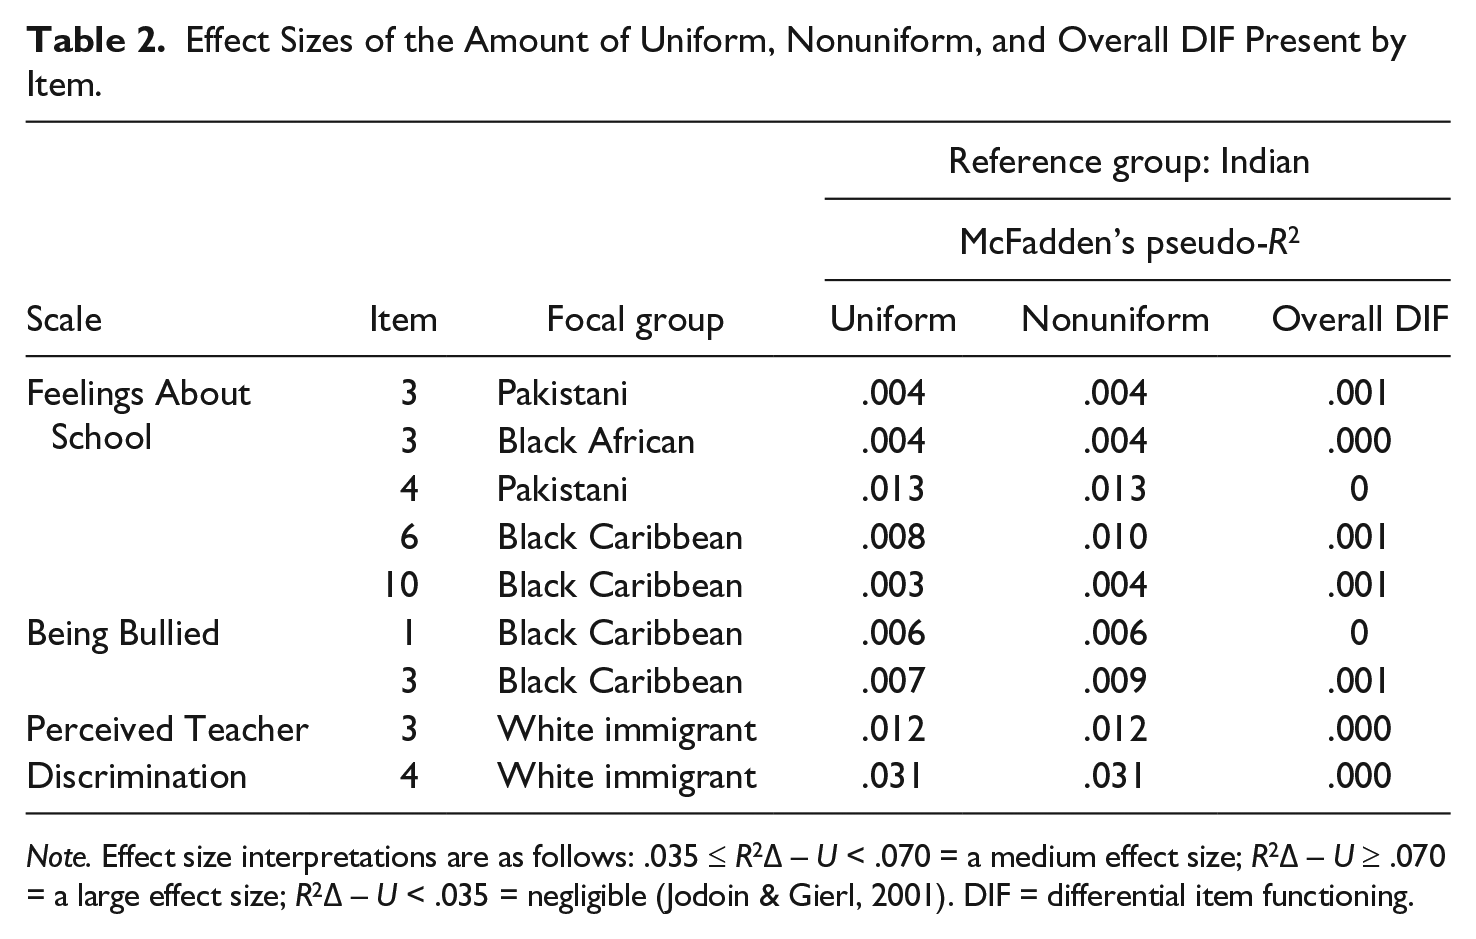
Note. Effect size interpretations are as follows: .035 ≤ R2Δ – U < .070 = a medium effect size; R2Δ – U ≥ .070 = a large effect size; R2Δ – U < .035 = negligible (Jodoin & Gierl, 2001). DIF = differential item functioning.
Scale DF
There is varying amounts of scale DF between Indian adolescents and certain ethnic minority groups, depending on the scale (Table 3), but in the majority of cases, it did not reach the threshold of a moderate effect.
Scale-Level Effect Sizes for the Four Sociocultural Scales.

Note. ETSSD of .20, .50, and .80 represent small, medium, and large effect sizes, respectively (Meade, 2010). ETSSD = Expected Test Score Standardized Difference.
NA meant error message received in obtaining equated item parameters.
NA indicates groups that did not pass the test for configural invariance on that scale.
For the Feelings About School scale, there is no meaningful DF between Indian adolescents versus Pakistani, Bangladeshi, or Black African adolescents. In contrast, scale DF reached a medium negative effect between Indian versus White immigrant and Black Caribbean.
For the Family Efficacy scale and the Being Bullied scale, some scale DF was present but in no instance did it reach the level of a moderate effect. Thus, taken together, there was no meaningful scale DF on 14 of the 16 comparisons.
Finally, note that scale-level DF could not be calculated on the Perceived Teacher Discrimination between Indian and White Immigrant adolescents due to an error message in R when attempting to estimate equated item parameters.
Discussion
Overall, the level of DIF was negligible on all individual items within their respective scales. Similarly, the amount of scale DF was small or negligible on 14 of the 16 group comparisons. Thus, in the majority of cases, researchers can appropriately make ethnic group comparisons using these sociocultural items and scales.
Interestingly, there was somewhat of a consistent pattern between Indian adolescents and Pakistani, Bangladeshi, and Black African adolescents for the Feelings About School scale and the Family Cohesion scale. That is, there was no scale DF detected between these groups. The fact, then, that Black African adolescents are often collapsed with Black Caribbean adolescents in research literature appears problematic as this group might share sociocultural characteristics more common with Indian, Pakistani, and Bangladeshi adolescents rather than adolescents who share their race category.
It is notable that the Perceived Teacher Discrimination scale could not pass the test for even configural invariance for four of the six ethnic minority groups. This means that the items for this scale do not measure the same construct for ethnically diverse adolescents in England. In contrast, the items on this scale did meet configural invariance for White natives and White immigrants suggesting that at the very least, this scale may be meaningful for those who phenotypically appear to be a part of the dominant population. This finding points to yet another reason why researchers should be cautious in defaulting to using the dominant group as the referent group in bias studies.
Teachers play a large role in facilitating adolescent adaptations to the school environment; therefore, it is incumbent on education researchers and policy makers to develop a scale that would measure Perceived Teacher Discrimination effectively. Given the critique of citizenship education in U.K. schools (Crawley, 2009; Gillborn, 2006; Osler, 2016), an argument can be made to possibly measure the effectiveness of this curriculum by measuring students’ perceptions of discrimination within the school setting before and after ethnic diversity was introduced into civic education in 2007. The LSYPE 2004-2010 can serve as the baseline data because the first three waves occurred before the change in curriculum.
Finally, I draw your attention to the fact that in every instance that precipitated scale DF, the direction was negative. That is, Indian adolescents had a tendency to endorse better sociocultural outcomes on every scale as compared with other ethnic minority groups. This finding is consistent with previous findings with Indian children and adolescents demonstrating better mental health outcomes as well (Green, McGinnity, Meltzer, Ford, & Goodman, 2005). When examining DF, it is necessary to consider the possibility of item- or scale-level impact as well. That is, the scale DF observed in this study might not be actual bias but rather real differences in the trait between the ethnic groups (Zumbo, 2007). For example, Rothon, Head, Klineberg, and Stansfeld (2011) found that Indian adolescents were less likely to experience bullying as compared with White adolescents. It is quite possible, then, that the small negative effect size for the White immigrant group on the Being Bullied scale actually reflects their experiences within England’s schools (recall that higher values represent better sociocultural adaptation for these scales). The ability to distinguish between bias and real population differences though lies within the acumen of a panel of experts (Zumbo, 2007) and is beyond the scope of this study.
Conclusion
In conclusion, my findings demonstrate that in the majority of comparisons, measurement equivalency holds; thus, scholars in most cases can legitimately make ethnic group comparisons on these sociocultural items and scales to inform policy. Future studies using this database can compare these ethnic groups on these scales to see who fares better or worse within United Kingdom’s society. Future studies can also examine the presence of the immigrant paradox between first- and second-plus-generation immigrant adolescents to see how consistent these outcomes are with what we already know from the health fields. The Department for Children, Schools and Families has embarked upon the second LSYPE project, and this project is known as Next Steps. The first round of data collection began in 2013. Future research studies can compare data from the LSYPE 2004-2010 with data from Next Steps to see whether there are perception changes among immigrant adolescents regarding their sociocultural adaptations. These future studies can guide immigration policy makers on which adolescent groups might need better supports in the government’s efforts to facilitate community cohesion.
Footnotes
Appendix
Results of the Configural Analysis Tests for Feelings About School and Perceived Teacher Discrimination Scales.

| Scale | Ethnic group | n | χ2model fit | χ2model fit (df) | χ2baseline model | χ2baseline model (df) | RMSEA |
CFI | TLI |
|---|---|---|---|---|---|---|---|---|---|
| Feelings About School | Indian | 995 | 232.73 | 34 | 4,679.83 | 55 | .08 [.07, .09] |
.96 | .93 |
| White native | 9,989 | 3,622.21 | 34 | 67,077.15 | 55 | .10 [.10, .11] |
.95 | .91 | |
| White immigrant | 229 | 92.09 | 34 | 1,355.04 | 55 | .09 |
.96 | .93 | |
| Black Caribbean | 953 | 327.57 | 34 | 5,223.23 | 55 | .10 |
.94 | .91 | |
| Pakistani | 917 | 208.25 | 34 | 4,102.18 | 55 | .08 |
.96 | .93 | |
| Bangladeshi | 695 | 172.87 | 34 | 2,079.03 | 55 | .08 |
.93 | .89 | |
| Black African | 689 | 137.60 | 34 | 3,404.75 | 55 | .06 |
.98 | .97 | |
|
|
|||||||||
| Relational Family Efficacy | Indian | 981 | 5.12 | 2 | 524.71 | 6 | .05 |
.99 | .98 |
| White native | 9,598 | 81.80 | 2 | 5,232.71 | 6 | .06 |
.99 | .95 | |
| White immigrant | 223 | 5.84 | 2 | 185.24 | 6 | .09 |
.98 | .94 | |
| Black Caribbean | 898 | 3.78 | 2 | 600.46 | 6 | .03 |
1.0 | .99 | |
| Pakistani | 894 | 6.59 | 2 | 429.16 | 6 | .05 |
.99 | .97 | |
| Bangladeshi | 672 | 3.05 | 2 | 345.83 | 6 | .03 |
1.0 | .99 | |
| Black African | 643 | 1.11 | 2 | 580.81 | 6 | .00 |
1.0 | 1.0 | |
|
|
|||||||||
| Perceived Teacher Discrimination | Indian | 859 | 27.63 | 2 | 1,449.49 | 6 | .12 |
.98 | .95 |
| White native | 8,803 | 107.57 | 2 | 6,404.58 | 6 | .08 |
.98 | .95 | |
| White immigrant | 185 | 1.99 | 2 | 188.67 | 6 | .00 |
1.0 | 1.0 | |
| Black Caribbean | 765 | 75.31 | 2 | 891.18 | 6 | .22 |
.92 | .75 | |
| Pakistani | 794 | 61.43 | 2 | 1,096.90 | 6 | .19 |
.95 | .83 | |
| Bangladeshi | 597 | 33.16 | 2 | 500.86 | 6 | .16 |
.94 | .81 | |
| Black African | 534 | 42.29 | 2 | 694.38 | 6 | .19 |
.94 | .82 | |
|
|
|||||||||
| Bullying | Indian | 858 | 4.99 | 5 | 195.09 | 10 | .00 |
1.0 | 1.0 |
| White native | 8,827 | 241.53 | 5 | 4,138.56 | 10 | .07 |
.94 | .89 | |
| White immigrant | 195 | 6.34 | 5 | 77.24 | 10 | .04 |
.98 | .96 | |
| Black Caribbean | 773 | 16.14 | 5 | 263.85 | 10 | .05 |
.96 | .91 | |
| Pakistani | 782 | 7.14 | 5 | 249.34 | 10 | .02 |
.99 | .98 | |
| Bangladeshi | 585 | 4.23 | 5 | 123.91 | 10 | .00 |
1.00 | 1.01 | |
| Black African | 531 | 6.40 | 5 | 188.96 | 10 | .02 |
.99 | .98 | |
Note. n = sample size; df = degrees of freedom; RMSEA = root mean square error of approximation; 90% CI = 90% level for the confidence interval; CFI = comparative fit index; TLI = Tucker–Lewis index (Brown, 2006).
Declaration of Conflicting Interests
The author(s) declared no potential conflicts of interest with respect to the research, authorship, and/or publication of this article.
Funding
The author(s) received no financial support for the research, authorship, and/or publication of this article.