
Abstract
Implementation of evidence-based, Tier 1 social-emotional learning (SEL) programming that supports healthy relationships skills is recognized as a key mental health promotion and violence prevention strategy for youth. However, work specifically exploring how to support the high-quality implementation of such programming with Canadian teachers and schools is just beginning to emerge. Drawing on implementation frameworks that emphasize the importance of setting, provider, and implementation process characteristics for understanding program implementation outcomes, this prospective, longitudinal study explores implementation of the Fourth R, a SEL-based healthy relationships program, in a Western Canadian province using a sample of middle school teachers. The aim of this mixed-methods study was to illuminate relationships among teachers’ attitudes toward evidence-based programming, perceptions of organizational climate, and training experience with program implementation outcomes (dosage, quality, fidelity). Findings of this exploratory study identified that these characteristics influenced implementation dosage, quality, and fidelity in differential ways. Qualitative data drawn from teacher interviews supported quantitative findings and highlighted the importance of organizational support for high-quality implementation. We discuss areas for further study, given that there are significant gaps in knowledge about teachers’ attitudes toward evidence-based programming, school climate, and other systemic factors in the Canadian context, as well as relevance of study findings to the field of school psychology.
Keywords
Introduction
Universal, Tier 1 resources (e.g., efforts focused on universal strategies, such as social-emotional learning [SEL] programs, and designed to meet the needs of 80%-85% of students in the building; Alberta Education, 2017) implemented by teachers in the classroom as part of daily teaching practice are an important part of integrated school mental health strategies (Short, 2016). However, the implementation of these resources has not traditionally been a focus within Canadian educators’ scope of practice and thus questions exist as to how ready teachers and schools are to implement these programs in the field. This issue is critical because a growing body of literature within implementation science indicates the importance of high-quality program implementation to achieving positive student outcomes (Wanless & Domitrovich, 2015). Thus, information on factors predicting implementation of Tier 1 programs is important for school-based mental health teams as part of strategy development and training. This article uses mixed methods to explore teacher factors and implementation quality in a sample of 79 Canadian teachers who were implementing an evidence-based, Tier 1 SEL program for middle school students.
Importance of Implementation Quality
Across multiple disciplines, there is now recognition that the implementation of interventions with evidence of effectiveness (i.e., evidence-based programs [EBPs]) is a critical part of health promotion and prevention (Brownson, Baker, Leet, & Gillespie, 2003; Flay et al., 2005; McCall, 2009). However, while such programs may be a necessary part of strategies to improve child and adolescent well-being, having access to manuals alone is not sufficient (Gottfredson et al., 2015). Particularly, how to promote the real-world implementation of such interventions is a growing topic of interest among school-based researchers and practitioners, given both the failure to move EBPs into practice (Fixsen, Blase, Naoom, & Wallace, 2009) and the critical links between implementation and youth outcomes (Durlak & DuPre, 2008; Wanless & Domitrovich, 2015). In seminal research on the link between implementation and program outcomes, Durlak and DuPre (2008) reviewed studies examining more than 540 health promotion/prevention interventions that also reported implementation data, finding that effect sizes were 2 to 3 times higher when programs were implemented with good 1 dosage (i.e., extent of the original program delivered) and fidelity (i.e., delivery that resembles the original program). Since Durlak and DuPre’s (2008) work, multiple other papers have demonstrated the importance of the implementation–outcome link, including in the school context (e.g., Bradshaw, Koth, Thornton, & Leaf, 2009; Durlak, 2015; Forman et al., 2013; Wanless & Domitrovich, 2015).
Predictors of Implementation Outcomes
In the same paper, Durlak and DuPre (2008) also noted that, while high-quality implementation overall predicted better outcomes, there was a large degree of variability in implementation across individual providers. Given this, research in implementation science increasingly focuses on exploring how various characteristics at the level of the intervention itself, at the provider level, and at the larger school/macro level affect implementation outcomes, to understand potential points of intervention for improving implementation quality (Domitrovich et al., 2008). To summarize these characteristics and their influence on implementation in a systematic way, implementation frameworks, such as the Consolidated Framework for Implementation Research (CFIR; Damschroder et al., 2009), can be used. Developed from a review of implementation theories, the CFIR specifies how five key domains—the outer setting (e.g., external characteristics, target population needs), the inner setting (e.g., implementation climate, organizational culture), provider characteristics (e.g., knowledge and beliefs, self-efficacy for intervention use), intervention characteristics (e.g., adaptability, relative advantage, cost), and the process of implementation (e.g., planning for implementation, the ability to carry out implementation according to the plan)—influence overall program implementation. Such frameworks give a conceptual basis for studies of implementation in school mental health and can be used to help organize findings from the school-based implementation literature.
To date, some work has explored the association between provider and intervention characteristics and program implementation in school-based settings. Looking at the implementation quality of a universal SEL program for elementary students, Domitrovich et al. (2015) found that two characteristics influenced implementation—emotional exhaustion (a provider characteristic, associated with poorer implementation quality) and whether the intervention structure fit well with their teaching style (an intervention characteristic, associated with higher implementation quality). Similarly, in a sample of K-8 teachers from Chicago, Malloy et al. (2015) found that attitudes toward SEL programs (a provider characteristic) predicted program dosage. Beliefs around program effectiveness and flexibility of program content were also related to implementation fidelity of a substance use prevention program in a U.S. national sample of middle school teachers (Ringwalt et al., 2003).
Work on implementation of school-based mental health programs also points to the potential role of perceptions of organizational characteristics in supporting higher implementation quality (i.e., inner setting characteristics; Gottfredson & Gottfredson, 2002; Han & Weiss, 2005; Wanless & Domitrovich, 2015). For example, in a sample of teachers from 20 elementary schools in Hawaii, Beets and colleagues (2008) found that perceived school climate predicted teacher beliefs about their responsibility to deliver school-based prevention programs, and that, in turn, these beliefs predicted the amount of curriculum actually delivered. Gregory, Henry, Schoeny, and The Metropolitan Area Child Study Research Group (2007) also found that more supportive perceived school climate was associated with dosage of violence prevention programming in a sample of teachers from 10 elementary and two middle schools in Chicago and adjoining area. A solid body of research also identifies the importance of perceived principal support to universal program implementation quality (e.g., Johnson, Pas, Loh, Debnam, & Bradshaw, 2017; Ringwalt et al., 2003); in the larger mental health services field, leadership qualities have also been demonstrated as key to promoting a positive implementation climate (i.e., a shared understanding of the types of practices and behaviors that are rewarded, supported, and expected in the organization; Aarons, Ehrhart, Farahnak, & Sklar, 2013) and positive provider attitudes about program adoption (Aarons, 2006). In the Canadian context, however, work in the school setting has primarily focused on the implementation of positive behavior interventions at the elementary level (Kelm, McIntosh, & Cooley, 2014; McIntosh, Moniz, Craft, Golby, & Steinwand-Deschambeault, 2014). Thus, there is a need to examine the implementation of SEL programs in Canadian secondary school settings.
Current Research
Since 2012, we have been involved in the provincial (Alberta) scale-up of a program called the Fourth R (Dozois, Wells, & Crooks, 2016; Exner-Cortens, Wells, Lee, & Spiric, 2019). This program is designed to promote healthy relationships and prevent dating violence among middle school students through the acquisition of SEL skills (Crooks, Zwarych, Hughes, & Burns, 2015). Consistent with universal program principles, the Fourth R is implemented as part of regular curriculum (i.e., is not an add-on or stand-alone program) and is aligned with curricular expectations (including hours requirements) in all provinces and territories. Although multiple versions of the Fourth R are available (e.g., a version for Grades 9-12 English, an Indigenous Perspectives version), the most widely implemented version is delivered as part of regular health/physical education curriculum in Grades 7 to 9. Multiple studies now demonstrate the efficacy of the Fourth R for promoting healthy relationships when implemented in the context of evaluation studies (Crooks et al., 2015; Crooks, Scott, Ellis, & Wolfe, 2011; Wolfe, Crooks, Chiodo, Hughes, & Ellis, 2012; Wolfe et al., 2009).
Exploring implementation in a sample of teachers from six provinces who had been trained in the Fourth R in the previous 2 to 8 years (n = 197), Crooks, Chiodo, Zwarych, Hughes and Wolfe (2013) found that 72% of respondents had implemented the Fourth R in the past year, and that the majority of the sample (64.6%) were able to implement 60% or more of the program (see Note 1). However, a number of barriers to implementation were also present, including time frames that were difficult to meet and difficulties implementing role-plays (a core component of the program). In this sample, self-reported high-fidelity implementation (i.e., implementation rates above 80%) was predicted by preparedness following training, perceiving more benefits of the program, and greater systems-level support/accountability (i.e., provider and inner setting characteristics), although all of these were measured retrospectively.
Over the past 6 years, we have noted a number of similar implementation barriers in the Alberta context (Dozois et al., 2016). However, while prior Fourth R implementation work provides some guidance for how to approach implementation barriers, the majority of the sample included in this past work was not from Western Canada (only 11.7% were from Alberta, with approximately half the sample from Ontario), and differences in the policy and educational environments, as well as geography, between provinces may mean that what facilitates or challenges implementation in one setting is not as relevant in another. This prior work was also entirely retrospective. Given this, the purpose of this preliminary, exploratory investigation was to prospectively explore the associations between provider characteristics and the implementation of the Fourth R as part of a provincial scale-up effort, to more systematically understand implementation challenges in this context.
Method
Participants and Procedures
All participants in this study were trained to implement the evidence-based Fourth R program (Wolfe et al., 2009), a program developed in Canada. In this study, 96% offered the program as part of health/physical education curriculum in Grades 7 to 9; the remainder taught the Grade 9 and Grade 11 English curriculums. The Fourth R is recognized as a complementary program in the Collaborative for Academic, Social, and Emotional Learning (CASEL, 2015) guide for effective middle and high school SEL programs and is on the Public Health Agency of Canada’s Canadian Best Practices Portal as a promising practice for violence prevention. Fourth R teacher training takes place one time over a half- or full-day and focuses on increasing familiarity with program content, building capacity to facilitate skill-building activities with students, and discussing the importance of high-quality implementation to program success (for more details on program content, training, and implementation, please see Crooks et al., 2015). Schools in this project received training as part of a larger, 6-year initiative called the Alberta Healthy Youth Relationships (AHYR) Strategy (full details on the strategy are available in Exner-Cortens et al., 2019). In brief, at the beginning of the initiative, the AHYR project team contacted schools and school jurisdictions to let them know that they could access free Fourth R training (as long as they provided staff release time), but as the initiative grew, schools/school jurisdictions would contact the AHYR team to receive training. Training was provided at the school or school division, at a time that was convenient for participating schools. Trainings were all conducted by Fourth R master trainers, who are certified to provide Fourth R program training and prepare teachers for implementation. All schools received free Fourth R training, as well as free Fourth R program manuals for implementing teachers; however, no additional formal implementation support from the AHYR team was part of the initial strategy (though teachers could and did reach out to the project team with questions and received informal consultation through this mechanism). At the time this research was conducted, Fourth R training had been offered to 903 teachers in 35 school divisions across the province. This project was approved by a university research ethics board.
Qualitative
We began our implementation study by collecting semi-structured, individual interview data from 11 currently implementing Fourth R teachers in Alberta in spring 2016. The purpose of these interviews was to more deeply understand experiences with Fourth R implementation prior to proceeding with the quantitative implementation study described below (for more details on the qualitative methodology, please see Supplemental Material). We recruited interview participants in spring 2016, by asking currently implementing teachers whether they were willing to participate in a telephone interview. All interviews were conducted by a doctoral-level project research assistant. Prior to the interview, the 11 teachers completed a short survey asking them to rank their top 3 perceived barriers to Fourth R implementation, and these barriers were then explored more deeply during telephone interviews that lasted approximately 30 min.
Quantitative
Participants for the quantitative portion of this study were 79 middle school teachers. Between August 2015 and December 2016, teachers who were trained in the Fourth R were asked to take part in surveys exploring implementation in Alberta. The consent rate across all trainings in 2015 and 2016 was just more than 50% (n = 197). To increase the reach of this project, we also sent a recruitment email to all teachers who had been trained in the Fourth R in Alberta between June 2012 and June 2015 and for whom we had contact information, to ask them to participate in the project. The consent rate from teachers trained during this period was 15% (n = 63). Together, this eligible sample size (N = 260) represented 29% of all teachers trained since the initiative started in June 2012. In September 2016, all teachers who had consented to the research project were sent a start-of-year implementation survey by email. This survey was completed by 151 teachers (response rate = 58%). In April 2017, teachers who had responded to the start-of-year implementation survey were sent an end-of-year implementation survey by email.
Quantitative Measures
Implementation characteristics
Three characteristics were selected based on a review of the implementation literature, as well as pilot data from the 11 teachers who participated in project interviews.
Process of implementation characteristic: Time since training. Providers indicated how many years it had been since they received their initial Fourth R training (less than 1 year, between 1 and 2 years ago, between 2 and 3 years ago, between 3 and 4 years ago).
Provider characteristic: Attitudes toward EBPs. No scale that assessed these items with teachers in the context of school mental health was located. Thus, we created an 11-item Attitudes Toward EBP scale by combining relevant items from several existing scales (Mathiesen & Hohman, 2013; Melnyk, Fineout-Overholt, Feinstein, Sadler, & Green-Hernandez, 2008; Rice, Hwang, Abrefa-Gyan, & Powell, 2010; Ubbink, Guyatt, & Vermeulen, 2013). Example items include “when implementing evidence-based programs, it is very important to include all the elements as outlined by the program manual” and “the use of evidence-based programs is ‘cookbook’ teaching that disregards practical experience” (1 = strongly disagree, 5 = strongly agree; α = .73). Exploratory factor analysis demonstrated that a one-factor solution was appropriate.
Inner setting characteristic: Perceptions of organizational climate. Teachers responded to five items from the Chicago Public Schools 5Essentials Teacher Survey (UChicago Impact, 2017). Example items include “we have so many different programs in this school that I can’t keep track of them all” and “once we start a new program in this school, we follow up to make sure that it’s working” (1 = strongly disagree, 4 = strongly agree; α = .66).
Implementation outcomes
We included three implementation outcomes on the end-of-year survey (Durlak & DuPre, 2008). Dosage was assessed by asking “Thinking about all the Fourth R programs you taught this year, approximately what percentage of program lessons were you able to implement?” (less than 25%, between 25% and 50%, approximately 50%, between 50% and 75%, between 75% and 100%, 100%). Based on the sample distribution, this item was dichotomized for analyses (1 = less than 50%, 0 = more than 50%). Quality was assessed by asking teachers to think about 13 characteristics that might have made the Fourth R difficult to implement (e.g., time frames difficult to meet) and to select all that applied (where 1 = yes and 0 = no; there was also space for teachers to write in additional reasons). Fidelity was assessed by asking teachers to report the extent to which they completed core Fourth R skills practice activities (active listening, assertive communication, delay/negotiation/refusal skills) with their students. Response choices were did not attempt, attempted but not complete, and completed. Based on the sample distribution, this item was dichotomized for analyses, 1 = completed and 0 = did not complete (did not attempt or attempted but did not complete). All measures come from standard Fourth R implementation surveys (Crooks et al., 2015).
Analysis
Qualitative
Detailed notes were taken during each interview and used as the basis for analyses. Audio recordings of each interview were also taken and used to supplement handwritten notes, to ensure that the interview was captured accurately. Notes were themed using deductive qualitative content analysis techniques (Sandelowski, 2000). First, the first author and the doctoral-level project research assistant independently reviewed interview notes and met to discuss emerging themes. From this discussion, three theme areas were identified: barriers to implementation, supports for implementation, and understanding of EBPs. The project research assistant then reviewed the interview notes to categorize the data under each of these broad themes and identify subthemes (e.g., under barriers, the subthemes of role-plays, time frames, support staff, external influences, content, format). Data comprising themes and subthemes were then reviewed by the first author.
Quantitative
Data for the full sample were first summarized using descriptive statistics. We then explored associations between implementation outcomes and characteristics in the subsample of participants who had implemented Fourth R in the 2016-2017 school year (n = 57) using bivariate statistics. If more than one characteristic was associated with an implementation outcome, both were subsequently included in a logistic regression model. We also calculated effect sizes for each outcome variable using Cohen’s d for continuous variables and Cramer’s V for categorical variables.
Results
Sample Descriptives
Qualitative
The 11 interviewees represented six school divisions (public and Catholic) and two private schools. Respondents came from several areas in the province, though most were from two large population centres (72.7%). 2 These participants had all taught the Fourth R in the 2015-2016 academic year and had, on average, 18 years of experience working with youth, but had only been teaching the Fourth R for on average 1 year (81.8% were trained in the last year, 18.2% were trained 3-4 years ago).
Quantitative
Participants who responded to the fall 2016 survey (N = 151) represented 20 school divisions (public and Catholic) and two private schools, though most came from two large population centres (68.2%). Of these participants, 68.9% said they planned to teach Fourth R programming in the coming year (reasons for not teaching again were primarily because their workload/teaching assignment had changed). Of those who also completed the spring 2017 survey (n = 79), just more than half (54.4%) had received training in the past year, with the remainder receiving training in the 2015-2016 academic year (25.3%) or between the 2012-2013 and 2014-2015 academic years (20.3%). Based on training data (available for 115 participants), the participants were predominately female (74.8%) and had, on average, 14 years of experience working with youth (SD = 7.31 years, range = 1-32 years).
Implementation Outcomes: Triangulating Quantitative and Qualitative Findings
Implementation barriers
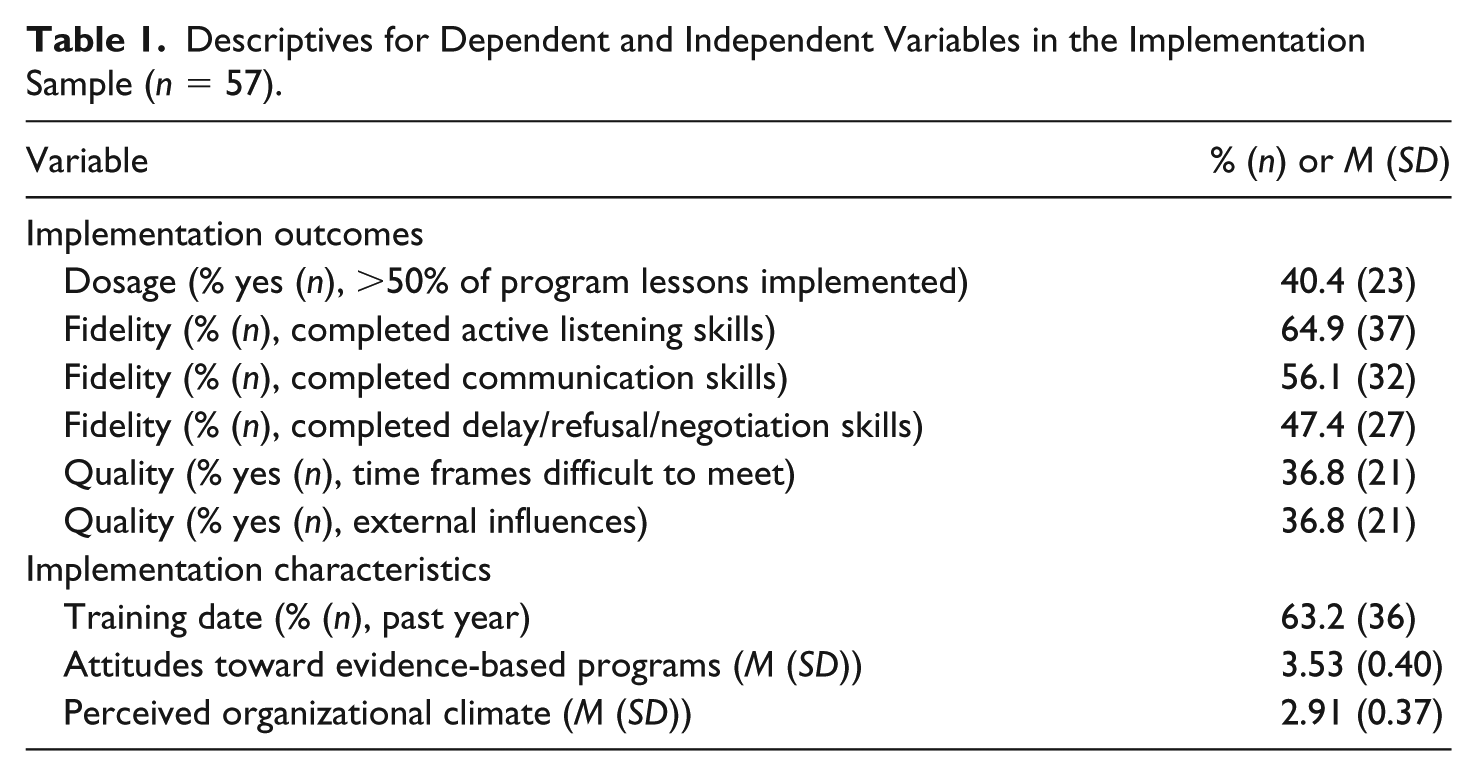
Of the 79 participants who completed surveys in fall 2016 and spring 2017 (see Supplemental Material for a comparison of those who did and did not complete the spring 2017 survey), 72.2% (n = 57) implemented the Fourth R in the 2016-2017 school year (i.e., reported that they had taught Fourth R programming in the past school year; Table 1). Among this group, only 40.4% were able to implement more than 50% of Fourth R material over the course of the academic year; related to this, the two most common barriers to implementation quality were that time frames were difficult to meet and that the facilitators encountered external influences (e.g., disruptions, assemblies; Table 1). In terms of skills implementation, the largest number of facilitators reported that they completed the active listening skills activities, followed by communication skills activities, and finally delay/refusal/negotiation skills activities (Table 1). The order of completion parallels the order in which these skills are taught in the curriculum, and also represents increasing complexity across the three skills. Thus, it is difficult to know whether this decline in implementation fidelity was because teachers ran out of time or due to the increasing complexity of later skills.
Descriptives for Dependent and Independent Variables in the Implementation Sample (n = 57).
The interview data we collected from 11 Fourth R teachers in spring 2016 mirror the survey data in terms of common barriers to implementation. 3 In this sample, trouble meeting time frames was the most commonly listed barrier to implementation (with more than half the interview sample listing this as one of their top 3 barriers). Explaining why this barrier existed, most teachers described problems with health scheduling, including short duration of their classes, the schedule cycle, and infrequent health class scheduling as the reason for time barriers. Less common time-related challenges included the additional time it takes to present the lessons to youth who are learning English, time required to prepare Fourth R lessons, and class sizes.
The second most common barrier in the interview sample was external influences (45.5% of the interview sample listed this as a top 3 barrier). External influences included assemblies, other programs/groups that were scheduled to present during health time, and “all the extra things that occur at the school.” Together, qualitative data also support the lower level of dosage reported in quantitative survey data: “The program is never difficult to implement, it is just difficult to get through the lessons and the units . . . I don’t ever get through the Fourth R. Ever. This is a consistent issue year to year.”
In terms of skill implementation, a substantial minority of interview respondents listed “role plays difficult to carry out” and “youth resisted role play exercises” as top 3 implementation barriers. Reasons for these difficulties included immaturity/youth having trouble taking the role-plays seriously (e.g., “the training I did was really good . . . but in those videos, the kids are awesome. They are ideal. They acted so perfect. In reality, we have more resistance—and with immaturity, even more so”), as well as a lack of social media-based scenarios. As role-plays are a key component of delay/refusal/negotiation skill development (core Fourth R skills), potential issues with role-plays may, in part, explain the lower quality score for this activity in the survey sample.
Associations with implementation characteristics
In the survey sample, dosage was associated with the year the provider was trained, such that providers were somewhat more likely to implement greater than 50% of the program in the 2016-2017 school year if they had been trained prior to 2015 (d = 0.31, p = .072, standardized residual, trained before 2015 and implemented more than 50% = 1.6; Table 2). Implementation fidelity (both the completion of communication and delay/refusal/negotiation skills) was associated with more positive attitudes toward EBPs (d = 0.56, p = .052, mean difference [MD] = 0.21, 95% confidence interval [CI] = [−0.0016, 0.43], and d = 0.52, p = .069, MD = 0.20, 95% CI = [−0.016, 0.42], respectively; Table 3). Finally, providers were less likely to say time frames were difficult to meet if they also reported more positive attitudes toward EBPs (d = −0.50, p = .081, MD = −0.20, 95% CI = [−0.42, 0.025]; Table 3), and if they perceived a better organizational climate (d = −0.67, p = .025, MD = −0.24, 95% CI = [−0.44, −0.031]; Table 3). For this outcome, perceived organizational climate remained a predictor in a model controlling for the provider’s EBP perception scores (odds ratio [OR] = 0.11, p = .024, 95% CI = [0.016, 0.75]); however, EBP perceptions themselves no longer predicted implementation quality once controlling for perceived organizational climate (OR = 0.33, p = .15, 95% CI = [0.067, 1.51]). The three characteristics considered in this study were not associated with the number of external influences the provider encountered when implementing the Fourth R.
Bivariate Statistics and Effect Sizes for Associations Between Year Trained and Implementation Outcomes.
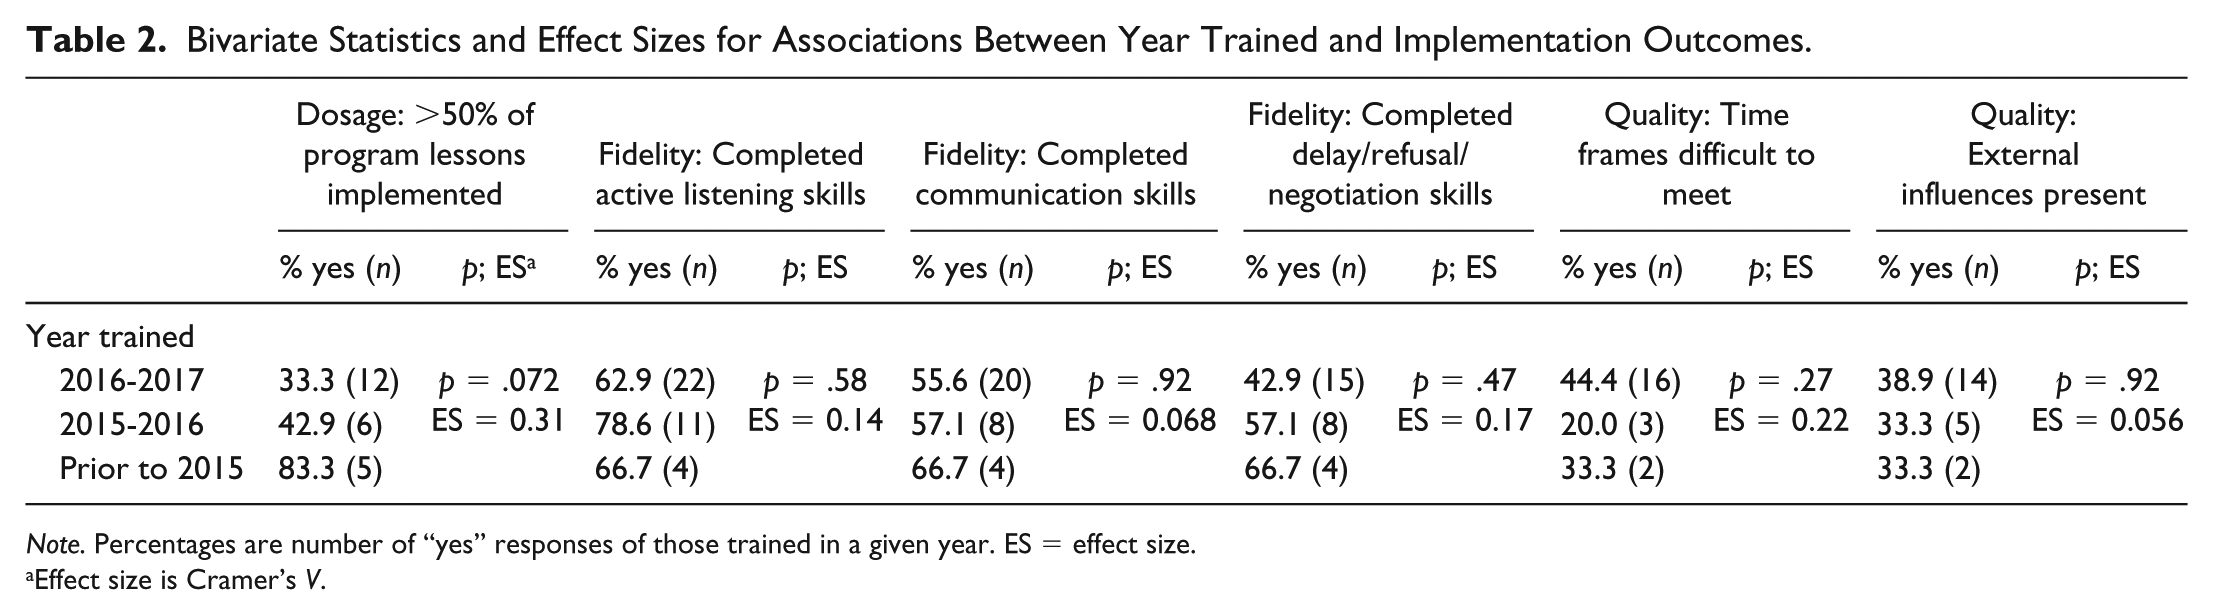
Note. Percentages are number of “yes” responses of those trained in a given year. ES = effect size.
Effect size is Cramer’s V.
Bivariate Statistics and Effect Sizes for Associations Between Continuous Implementation Characteristics and Implementation Outcomes.
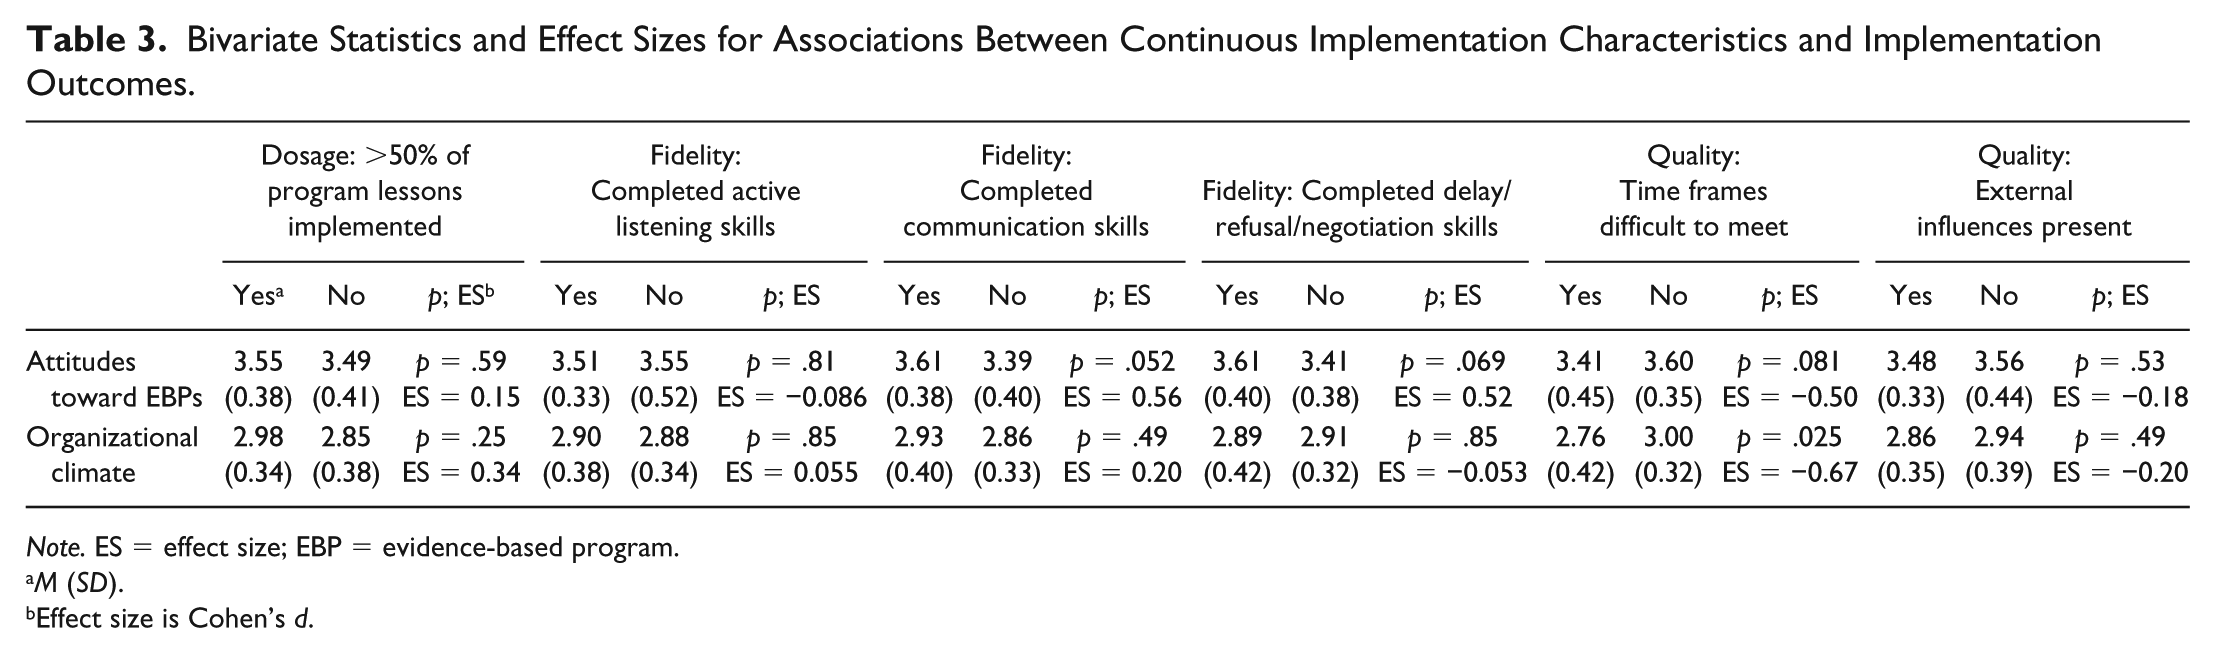
Note. ES = effect size; EBP = evidence-based program.
M (SD).
Effect size is Cohen’s d.
In the interview sample, we asked about facilitator’s own understanding/perceptions of EBPs, as well as their perception of organizational attitudes toward EBPs. In terms of their own understanding, the majority (nine out of 11) knew what EBPs were (i.e., could provide a general definition), and once the definition was clarified for the two respondents who did not know/were unsure, all 11 respondents stated that a program being an EBP was an important designation when they decided about resource adoption for their classroom. However, interviewees did not feel as confident about their school’s perception of EBPs; only half (six of 11) thought it was probably or definitely important, with the other five stating maybe, that they did not know/were unsure, or that they perceived that it was not. Several respondents also commented that although EBPs were important to them personally, they were not as sure about other teachers in their building: “other teachers—they don’t seem to trust it.” Thus, as in the survey sample, there are differences in organizational climate for EBP adoption and implementation that are important over and above the provider’s own attitudes.
Discussion
In our prospective survey of Western Canadian middle school teachers, we found that having more positive attitudes toward EBPs was associated with somewhat better implementation quality and fidelity, and that perceiving a stronger organizational climate was associated with higher implementation quality, specifically around time issues. Finally, providers who had been trained less recently (and presumably had, thus, been implementing longer/had the ability to continue implementing) reported better implementation dosage. In interview data, additional support was provided for the top implementation barriers noted in the survey sample, and the importance of own versus organizational perceptions about EBPs was also highlighted.
Although preliminary due to the small sample size, this mixed-methods, prospective study demonstrates the importance of assessing provider’s own attitudes toward EBPs as well as perceptions of the larger organizational climate, two variables that are less frequently studied overall in the school-based implementation literature. However, we note that these characteristics have been frequently studied in the larger mental health services field, with support for the relationship between these two characteristics and their importance in understanding implementation (Aarons et al., 2013; Novins, Green, Legha, & Aarons, 2013). For example, Aarons and Sawitzky (2006) assessed attitudes toward evidence-based practices in a sample of 301 mental health service providers and found that positive provider attitudes were associated with supportive, motivating, and achievement-focused organizational cultures, supporting our findings around the connection between these two characteristics.
In terms of interpreting effect sizes from this study, Tanner-Smith, Durlak, and Marx (2018) present mean effect size distributions for universal prevention programs (while these effect sizes are for program outcomes and not implementation, we feel their use as a benchmark is an improvement over acontextual, universal effect sizes) and report that “with few exceptions, the median average effect of universal prevention programs for various outcomes tended to fall within the range of 0.07-0.16 standard deviations” (p. 1098). Median effect sizes in our study were 0.14 for fidelity, 0.21 for quality, and 0.31 for dosage, or within the range of and slightly larger than those in the Tanner-Smith et al. (2018) review. To provide a more definitive benchmark, similar work exploring average effect sizes for program implementation is needed.
Our quantitative findings reflect and extend prior work on Fourth R implementation nationwide (Crooks et al., 2013). The past-year implementation rate in our study (72.2%) was identical to the implementation rate in the national study (72%), and reasons for not implementing in the past year were also very similar (e.g., primarily because teaching assignment had changed). Main barriers in both our quantitative and qualitative samples also replicated those in the national study (time frames, external influences, role-plays). However, our dosage was much lower than in this prior study; in the national study, approximately 40% of respondents implemented more than 80% of the program, whereas in our study, only 17.5% of respondents indicated that they implemented more than 75% of the program. Reasons for this difference may represent policy or other structural differences between provinces, a topic deserving further study. However, qualitative and quantitative findings highlighted that actual time allocated to required health classes in Alberta, as opposed to the recommended number of hours listed as part of curricular expectations for junior high (which in Alberta is 50 hr; Alberta Education, 2016), is a barrier to successfully completing all program sessions in many schools. Because the recommended number of hours exceeds the number of hours required to implement all Fourth R lessons (~20-30 hr, depending on grade level 4 ), we feel this implementation challenge speaks to broader issues of lack of prioritization and accountability for health education. Other implementation research we have conducted demonstrates that this lack of accountability is a problem nationally (Crooks et al., 2013). School teams preparing to implement the program can thus think about how they will ensure adequate dosage given potential scheduling constraints, a factor which is important to consider as the match between class time and required programming time has been shown to influence implementation quality and dosage in other research (Mihalic, Fagan, & Argamaso, 2008). School teams can also take on an advocacy role, to ensure that required health education is viewed as parallel in importance to the implementation of more traditional subjects such as literacy and numeracy, and that the recommended number of hours are devoted to health education within their school setting.
In terms of dosage, our findings suggest that those providers who were still implementing the Fourth R two or more years after training were able to get through more of the program. Although time since training is not typically studied as a process of implementation characteristic, we included it as we felt it was an indicator of implementation planning within the school. Indeed, in other work we have done exploring the implementation of the Fourth R in Alberta, we have found that implementation rates drop off substantially the year after the provider is trained, primarily due to a number of school- and system-level barriers (most commonly, changes to teaching assignment, indicating a lack of planning for implementation); this is also true at the national level (Crooks et al., 2013). Thus, providers who are still implementing are potentially in environments with more effective implementation planning and execution (e.g., where health scheduling is done to accommodate the program, where the recommended number of hours are given to health education), as planning is linked to higher implementation quality (e.g., Spoth, Guyll, Redmond, Greenberg, & Feinberg, 2011). Per our qualitative data, it is also possible that more supportive systems recognize the importance of allowing a teacher the time needed to develop expertise in implementing an EBP (e.g., ensuring that teachers receive the same teaching assignment for several years), encouraging more sustainable implementation.
In terms of fidelity, the two skills that were associated with positive attitudes toward EBPs (i.e., communication and delay/refusal/negotiation skills) both require role-plays for successful completion, and role-plays may be a difficult teaching format for some educators, potentially due to time or personal comfort barriers (Haignere, Culhane, Balsley, & Legos, 1996), or lack of training/experience in implementing these types of scenarios; thus, the one-time training offered as part of this project may not have been enough to build role-play capacity for teachers who were not already comfortable. Our qualitative data also specifically highlighted youth resistance as a potential reason for difficulty implementing role-plays. When asked about potential strategies for overcoming this barrier, interview respondents discussed additional training on role-plays as an important support (e.g., “examples of where the kids haven’t bought in—what are ways we can deal with this?” [Grade 9 teacher]), again suggesting the need for longer training/greater implementation support.
It is also possible that promoting more positive attitudes about the importance of EBPs may help providers overcome internal barriers to role-play implementation. To our knowledge, attitudes toward EBPs have received limited attention in the Canadian literature, but the findings of this study suggest they are an important provider characteristic for inclusion in future research (and as noted above, they have been shown to be important in the larger mental health services field). However, it is important to note that not all teachers faced issues with implementing role-plays. As one teacher commented, “the kids loved it, their demonstrations and examples of passive, aggressive, assertive . . . their role play was well done. It was easy to see they totally got it” (Grade 8 teacher). Thus, as role-play is a key feature of many effective prevention programs (Nation et al., 2003), future research can also focus more deeply on determining provider and classroom characteristics that predict difficulties with role-play implementation, to suggest potential strategies for addressing this barrier.
Finally, in terms of quality, we found that better perceived organizational climate was associated with providers facing less time pressure, and that associations with organizational climate mattered over and above the provider’s own attitudes toward EBPs; this reflects prior research in the larger mental health services field highlighting the key relationship between inner setting characteristics (e.g., leadership, organizational climate) and positive provider attitudes toward EBPs (Aarons, 2006; Aarons & Sawitzky, 2006). As suggested by this literature, even if a provider’s own attitudes are positive, it is difficult to implement well if organizational climate does not support implementation (as also highlighted in our qualitative data). In their study of the effects of school climate on implementation (10 elementary, two middle schools), Gregory and colleagues (2007) found that supportive climate was associated with higher implementation dosage, whereas in our study, it was associated with quality. This may be because of differences between the structure of elementary and middle school environments (e.g., in middle school, the teacher likely only has the student for class once [or less] a day, meaning there is less time to make up content [a dosage factor] across the day). In addition to a supportive climate, in one of the few studies looking at non-elementary programming, Johnson et al. (2017) found that greater principal support was associated with greater openness to adopt new SEL practices among high school teachers in Maryland, and qualitative work by Barwick, Barac, Akrong, Johnson, and Chaban (2014) also found that a key motivator for practice change among Canadian educators included organizational support for implementation, such as administrator buy-in. Thus, organizational climate may function in multiple ways in the school setting and is deserving of additional study.
Limitations
There were several limitations to the present study. First, our sample sizes for both quantitative and qualitative data were small, and as such, these findings should be considered exploratory. For the quantitative data, because of the small sample size and sampling strategy, generalizability is limited. Our small sample size also meant we had limited power to detect significant effects. Specifically, power analysis indicated that to detect an effect size of 0.12 (the middle of the effect size range in the Tanner-Smith et al. (2018) study) in an independent samples t test with power = 0.80 and α = .05, the needed sample size was approximately 2,182 people (R V3.2.4). Given our actual final sample size of Fourth R implementers (n = 57), the actual effect size we would be able to detect in this type of test with power = 0.80 and α = .05 was 0.76; thus, our sample size was much smaller than desirable, but reflects what we were realistically able to capture as part of a voluntary program implementation strategy and evaluation project. However, we feel that our findings nonetheless speak to the importance of considering not just individuals who are implementing but the systems within which they are implementing. Our response rate was also fairly low, but likely typical for this type of research. Finally, although we had prospective quantitative data, our interview data represented retrospective reflection on Fourth R implementation. We also developed our own measure to assess attitudes toward EBPs; although items on our measure are similar to the Divergence and Openness subscales of the original Evidence-Based Practice Attitude Scale (EBPAS; Aarons et al., 2010), as mentioned above, we did not find any existing measures that fit the school context, and so needed to develop a school-specific measure. To assess organizational climate, we were unable to administer any measure that was perceived as evaluative; however, we acknowledge that in future work, the use of more detailed organizational climate scales, such as the Implementation Climate Scale (Lyon et al., 2018), would be beneficial. Dosage and fidelity were also self-reported and are thus subject to social desirability bias.
Relevance to the Practice of School Psychology
School psychologists in Canada are increasingly asked to help their divisions plan integrated mental health strategies and scale-up Tier 1 programs. Discussion of implementation is a critical piece of strategy planning (Bradshaw, Debnam, Koth, & Leaf, 2009; Owens et al., 2014), and as our results highlight, also need to accompany large scale-up efforts. The current research demonstrates that factors that affect time for delivery (whether because of the structure of the school day or because of external influences) are potentially key factors to address when deciding on the adoption of universal resources as part of tiered approaches, as time issues have key implications for implementation dosage and fidelity. For example, school psychologists can prompt questions such as: do the implementation requirements of this program (e.g., number and length of sessions) fit with our current school context? If not, what changes might need to be made (and are those changes feasible)? School psychologists can also advocate for the prioritization of health education within the school building. The potential for school psychologists to provide local coaching and technical assistance (e.g., around role-play implementation) can also be explored (Owens et al., 2014; Reinke, Stormont, Herman, & Newcomer, 2014).
The current research also points to the importance of considering process of implementation, provider, and inner settings characteristics as part of successful implementation of school mental health initiatives. We see school psychologists as playing a key role in helping school divisions think through implementation planning as part of strategy development and feel the results of this research demonstrate the importance of attending to potential implementation challenges during this process. To this end, we recommend school psychologists use the CFIR, or other structured implementation frameworks, as part of a systematic implementation planning process when new resources come into the building. Finally, we note that the one-time training model used in this project was not optimal and does not represent best practice in program implementation; however, our funding was designated for the purpose of scale-up (i.e., training as many teachers as possible) in response to high rates of domestic violence in the province and did not support more in-depth fidelity monitoring (even though fidelity monitoring is key to implementation success; Novins et al., 2013). This represents a tension in real-world practice (i.e., using resources to get the program to as many teachers as possible via training with no monitoring vs. using resources to train a smaller number of teachers but offering more implementation support) that needs to be navigated with both funders and practitioners. In our own practice, we have moved away from the large scale-up model toward an implementation support structure because of the issues identified in this article (Exner-Cortens et al., 2019), and use the data we have collected to advocate for why funding scale-up alone is not enough to effectively solve social problems. For Fourth R nationally, focus has also moved to testing different implementation support models as part of larger scale-up. We thus encourage school psychologists who work in these spaces to use our study to continue to advocate for resourcing for both training and implementation support.
Conclusion
This study is the first to prospectively explore the implementation of a middle school SEL program in a Western Canadian province, and also one of the first to present data on teacher perceptions of organizational climate in Canada, both of which are important to the design of professional development and mental health strategy planning activities. Overall, quantitative and qualitative data highlight the need for systematic and comprehensive approaches to the scale-up of EBPs. This includes a need to consider multiple systems and their interactions. Future work is needed to more deeply understand how service providers are influenced by multiple interacting factors as they implement EBPs in the school setting.
Supplemental Material
CJSP_Supplemental_Material – Supplemental material for Predictors of Healthy Youth Relationships Program Implementation in a Sample of Canadian Middle School Teachers
Supplemental material, CJSP_Supplemental_Material for Predictors of Healthy Youth Relationships Program Implementation in a Sample of Canadian Middle School Teachers by Deinera Exner-Cortens, Vanja Spiric, Claire Crooks, Maisha Syeda and Lana Wells in Canadian Journal of School Psychology
Footnotes
Acknowledgements
We would like to thank the participating teachers. Thanks also to Lianne Lee and Elena Esina for their support with research project design and implementation, and to Dr. Sarah Fotheringham for her support with teacher interviews. These data were previously presented in part at the 25th Annual Society for Prevention Research Meeting, Washington, DC.
Authors’ Note
Vanja Spiric is now with NorQuest College, Edmonton, AB.
Declaration of Conflicting Interests
The author(s) declared the following potential conflicts of interest with respect to the research, authorship, and/or publication of this article: The third author is a developer of the Fourth R program. The first, second, fourth, and fifth authors have no conflicts of interest to report. All analyses in this paper were run by the first author.
Funding
The author(s) disclosed receipt of the following financial support for the research, authorship, and/or publication of this article: This research was supported in part by funding from the Government of Alberta Ministry of Human Services, the Public Health Agency of Canada, and anonymous donors.
Notes
Supplemental Material
Supplemental material for this article is available online.
Author Biographies
References
Supplementary Material
Please find the following supplemental material available below.
For Open Access articles published under a Creative Commons License, all supplemental material carries the same license as the article it is associated with.
For non-Open Access articles published, all supplemental material carries a non-exclusive license, and permission requests for re-use of supplemental material or any part of supplemental material shall be sent directly to the copyright owner as specified in the copyright notice associated with the article.