
Abstract
Repeated measurements of student ability (i.e., progressing monitoring) is an essential element of informed decision-making when adjusting instruction. An important characteristic of progress monitoring measures is frequent administration to identify areas of concern and to evaluate academic growth. The purpose of this study was to determine if STAR Math is sensitive to small incremental growth across a semester. Within two southern school districts, 114 fifth grade students’ progress monitoring data were collected weekly, and a latent growth curve was used to estimate students’ change in math ability. Results indicated STAR Math is sensitive to small incremental growth, with a statistically significant and positive slope, suggesting students using STAR Math showed improvement in ability over the semester.
The National Assessment of Educational Progress (Institutes for Educational Sciences, 2013) indicates an upward trend in mathematics scores of U.S. fourth and eighth grade students over the last 23 years; however, international tests suggest the United States is still behind other developed nations in math achievement (Program for International Student Assessment, 2012). To continue to improve overall student achievement, it is important that educators are able to identify students at risk academically and adjust instruction accordingly to close the gap between current performance and desired performance. Repeated measurements of student ability (i.e., progressing monitoring) are essential to informed decision-making related to students at risk and adjusting instruction. In addition, data from progress monitoring can lead to more efficient communication with stakeholders, such as parents (Fuchs & Fuchs, 2008).
An important characteristic of progress monitoring measures is that they can be administered frequently throughout the school year to identify students at risk academically and to evaluate academic growth. Progress monitoring helps in evaluating students’ response to instruction or intervention and also assists in guiding instruction and adjusting interventions (Fuchs & Fuchs, 2008). To be able to make these kinds of decisions, progress monitoring tools should be psychometrically sound, which means instruments should be valid, reliable, efficient, and sensitive to change in student ability. When psychometrically sound progress monitoring data are used, instructional decisions are better informed, which leads to increased student learning and reduced special education referrals.
Much of the progress monitoring research to date has focused on the psychometrics and utility of Curriculum Based Measurement (CBM). CBM in mathematics have probes that are developed either by sampling the curriculum or using robust indicators of general mathematic ability which are not necessarily drawn from the curriculum (Fuchs & Deno, 1991). CBM in mathematics have been shown to be psychometrically sound (see Foegen et al., 2007) and to have clinical utility for prediction of academic distress (e.g., Keller-Margulis et al., 2008), and their use in universal screening is considered to be best practice.
Although much of the research has focused on CBM, Computer Adaptive Testing (CAT) has increased in popularity among educators due to ease of use, decrease in teacher time, and increase in statistical accuracy (van der Linden & Glas, 2000). CAT is a form of computer-based testing, based in item response theory (see Reise & Waller, 2009), that uses student performance on past items to select appropriately difficult items. STAR Math (STAR-M) is a CAT designed to estimate student skill in numeration concepts, computation processes, word problems, estimation, data analysis and statistics, geometry, measurement, and algebra. In a direct comparison, Shapiro et al. (2015) found that both STAR-M and CBMs (i.e., AIMSWeb Math Computation and Math Concepts/Applications) predicted student growth well, with STAR-M demonstrating linearity across third, fourth, and fifth grades. In addition, the researchers showed that scores obtained just prior to end-of-year testing predicted end-of-year performance better than growth over time.
Although, CATs are gaining in popularity and appear to have merits, it is important that rigorous research is carried out to examine their psychometric properties. Fuchs (2004) outlined three stages of research for the psychometric development of progress monitoring measures. The first stage (Stage 1) examines the technical adequacy of static scores (measure of ability at a single point in time). For example, studies examining the validity (i.e., content, concurrent and predictive) and reliability (i.e., test retest, alternate forms) should be conducted to determine the efficacy of the measure. The second stage (Stage 2) should examine growth scores or slope estimates such as growth over time or sensitivity to growth over time. The third and final stage (Stage 3) should investigate how a measure (CBM or CAT) is used to improve student achievement (i.e., instructional utility). Treatment sensitivity is, perhaps, the most crucial psychometric element of measures designed to measure response to intervention or treatment, and must be demonstrated across multiple studies and, ideally, multiple treatments (De Los Reyes & Langer, 2018; Hunsley & Mash, 2008; Youngstrom et al., 2017).
Stage 1 Research
For Stage 1 research pertaining to CAT, Renaissance Learning (the educational software company that developed STAR-M) has collected and analyzed scores on STAR-M and other established measures of mathematic achievement, including survey-level achievement tests, diagnostic tests in mathematics, and state accountability tests. The analyses have resulted in more than 400 concurrent and predictive validity studies conducted for STAR-M, involving more than 400,000 students. The average correlations observed in these studies range from .55 to .80, which are considered to be respectable correlations (Renaissance Learning, 2014). Renaissance Learning (2014) reports the reliability of STAR-M in the high range (split-half reliability r = .94, alternate-form reliability r = .91). They also note concurrent validity, using a meta-analysis of 276 correlations, suggests a correlation in the moderate range, with an overall average across grades reported as .64 (Renaissance Learning, 2014). Predictive validity also yields respectable correlations with a range of .62 to .76 (Renaissance Learning, 2014).
Additional research by Shapiro and Gebhardt (2012) compared the concurrent validity, predictive and diagnostic accuracy of CBM and STAR-M. They examined benchmark assessment data from STAR-M, CBM Computation, CBM Concepts and Applications, and state accountability tests from students in Grades 1 to 4. Correlations between STAR-M, CBM Computation, and CBM Concepts and Applications ranged between .41 and .51, with CBM Concepts and Applications and STAR-M having the highest correlation. The predictive validity analyses found that STAR-M was indicative of student ability on the statewide test to a higher degree than CBM. Overall, in terms of diagnostic accuracy, STAR-M had substantially higher sensitivity and accuracy than CBM Computation and CBM Concepts and Applications.
To date, research for CAT of achievement has focused largely on Stage 1. Most of the previous research in mathematics progress monitoring measures has been correlational research relying on static data (e.g., Methe et al., 2015), confirming that STAR-M meet the standards of technical adequacy at Stage 1. The following section focuses on Stage 2 research related to progress monitoring measures.
Stage 2 Research
Stage 2 research hits at the core of examining the slope estimates such as growth over time or sensitivity to growth over time and can play an important role in school improvement and accountability, as required in accountability standards outlined in the Every Student Succeeds Act. Even though CBM and CAT measures allow for frequent administrations, previous research has primarily focused on static scores for concurrent and predictive validity. Slope estimates can add to the predictive validity of an outcome measure to identify students who might not pass state achievement tests, and estimating growth rates could be very useful to school districts that are concerned with accountability.
When considering Stage 2, progress monitoring measures should have many alternate forms that are designed to be administered frequently (bimonthly, monthly, etc.), making it possible to calculate growth rates for students (Deno, 2003). Slopes representing rates of improvement are used by educators for educational decisions, and slope estimates are useful when the average rate of improvement across populations and grades (Deno et al., 2001; Wayman et al., 2007) are studied to determine if students are making adequate growth. As an instructional tool, the benefit of examining average rate of improvement by population and grade allows educators to make more informed decisions about intensity of instruction, intervention, and/or placement.
The majority of the studies (e.g., Chard et al., 2005; Deno et al., 2001; Foegen, 2000; Shapiro et al., 2005) only administered the measures a few times a year instead of weekly or monthly. Overwhelmingly, the studies used infrequent administrations to report an average weekly rate of improvement; however, these studies’ primary purpose was to determine if the measures screened appropriately, not to monitor progress of students. Consequently, using an average rate of improvement resulted in estimated linear slope values. Assuming that weekly improvement rates are linear (i.e., slopes that do not vary each week) may not be an accurate interpretation of improvement. Thus, frequent progress monitoring may be needed to accurately interpret improvement rates for students receiving interventions or remedial services in either general or special education. As such, there is a strong need to conduct Stage 2 research to determine if progress monitoring measures are sensitive to growth in shorter increments of time. The purpose of this study is to address this question using STAR-M. Specifically, the question is “How sensitive is STAR-M to incremental growth over time; that is, can STAR-M indicate growth in a short time frame, such as weekly?”
Methods
Setting and Participants
During the spring 2015 semester, students from six schools located in two southern school districts (identified as District 1 and District 2) participated in a research pilot study to examine the effects of an instructional management system. This portion of that broader study focused on whether STAR-M measures weekly changes in math ability (i.e., growth) over time. Due to limited student counts in each grade, this analysis included the STAR-M results of only fifth grade students from both districts. Because not all schools include fifth grade, the analysis represents fifth grade students from three of the schools participating in the study: two from District 1 and one from District 2.
Students
Across the three schools containing fifth grade, a total of 114 students in fifth grade participated in the STAR assessment. Forty-eight percent (n = 59) of the students were male and 52% were female. One hundred and two students were African American (83%), 18 were Caucasian (15%), and 2 were Asian (2%). All students qualified for free-and-reduced-lunch (FRL) programs.
The mathematics proficiency of students is measured annually through the statewide, standardized testing program and provides an indication of mathematical ability prior to the study. Although proficiency based on the standardized assessments was not made available for the 114 students participating, overall standardized test results from the prior spring administration in fourth grade mathematics (which, presumably, would include this study’s fifth grade students) for the two schools in District 1 indicate mathematics proficiency of 39.0% in one school and 59.6% proficiency in the other school. Prior year mathematics proficiency of fourth graders in the school from District 2 was 57.7%.
STAR Math (STAR-M)
There are eight strands in STAR-M which measure: Numeration Concepts, Computation Processes, Word Problems, Estimation, Data Analysis and Statistics, Geometry, Measurement, and Algebra. The STAR-M test is divided into two parts. The first 16 items, which comprise the first part of the test, includes items from the Numeration Concepts and the Computation Processes strands. The second part of the test, or the final eight items, includes items from all remaining strands. The specific makeup of the strands used in the final eight items depends on the student’s grade level (Renaissance Learning, 2014).
STAR-M was given on a weekly basis, or every fifth school day, during the spring semester of 2015. Although the test administration occurred in a group setting, such as in a computer lab or classroom, STAR-M is designed for the student to work at his or her own pace and typically lasts between 20 and 25 min.
Procedures
As stated previously, this study focused on whether STAR-M measures small incremental change in math ability (i.e., growth) over time. To that end, a latent growth curve was used to estimate students’ change in math ability, over one semester, using STAR-M as a measure of student ability in mathematics. Although considering how factors, such as learning disabilities or instructional interventions affect learning or rate of learning, are critical, they were beyond the scope of the research questions associated with this study. Demographic data beyond race, gender, and FRL status were not available and, consequently, could not be considered as covariates in the analysis. In addition, fifth grade enrollment was disparate by school and by district precluding consideration of whether there were school-level or district-level effects. Because race and gender were available, each was initially included as covariates in the analysis; however, neither was significant contributors and was subsequently not included in the analysis.
In the latent growth curve, two latent variables were estimated: the student’s initial math knowledge represented as a scale score (intercept) and the rate of linear growth in the student’s knowledge (slope) across all measurement points. The initial latent growth model, identified as Model 1 and presented in Figure 1, includes each weekly administration of STAR-M, with the exception of Week 8 when technical difficulties prevented fifth grade students from participating in that week’s administration of STAR-M. The software package Mplus© version 7.0 (Muthén & Muthén, 1998–2017) was used to estimate the latent growth curve for Model 1 using the data from the two school districts run as a single unit (n = 114) due to the small number of students in some schools. Because the measures of interest are the means and variances of the latent variables, the parameters between the latent variables and observed variables were fixed. Although the paths between the intercept and each time point are fixed at one, the paths between the slope and each time point are fixed at 0, 1, 2, and so on, in a linear pattern. A positive growth parameter would mean an increase in math ability over the 17 weekly assessments
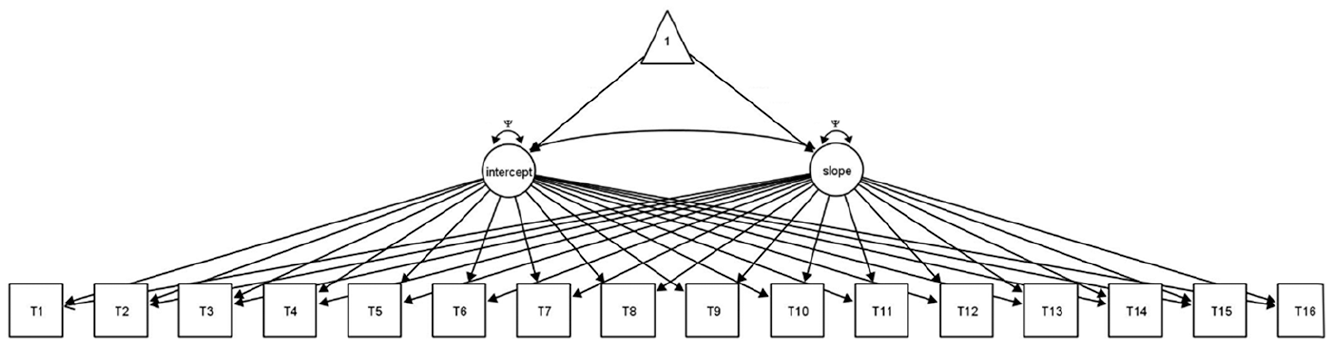
Latent growth curve model of all time points.
As evidenced in Table 1, not all students participated in STAR-M at each time point. The reasons for missing assessment scores varied, such as student absences or school events beyond the control of the teacher. Consequently, there is considerable variability in participation between some measurement points. Missing data analysis indicated that data were missing at random when viewed over the course of the study. Because of the variability in participation, however, a second latent growth model, identified as Model 2 and illustrated in Figure 2, was examined to address the number of students participating in the assessment while also attempting to retain a measure of time consistency between testing points, resulting in a model that included only Weeks 1, 4, 7, 12, and 16.
Descriptive Statistics for Each Weekly Assessment.
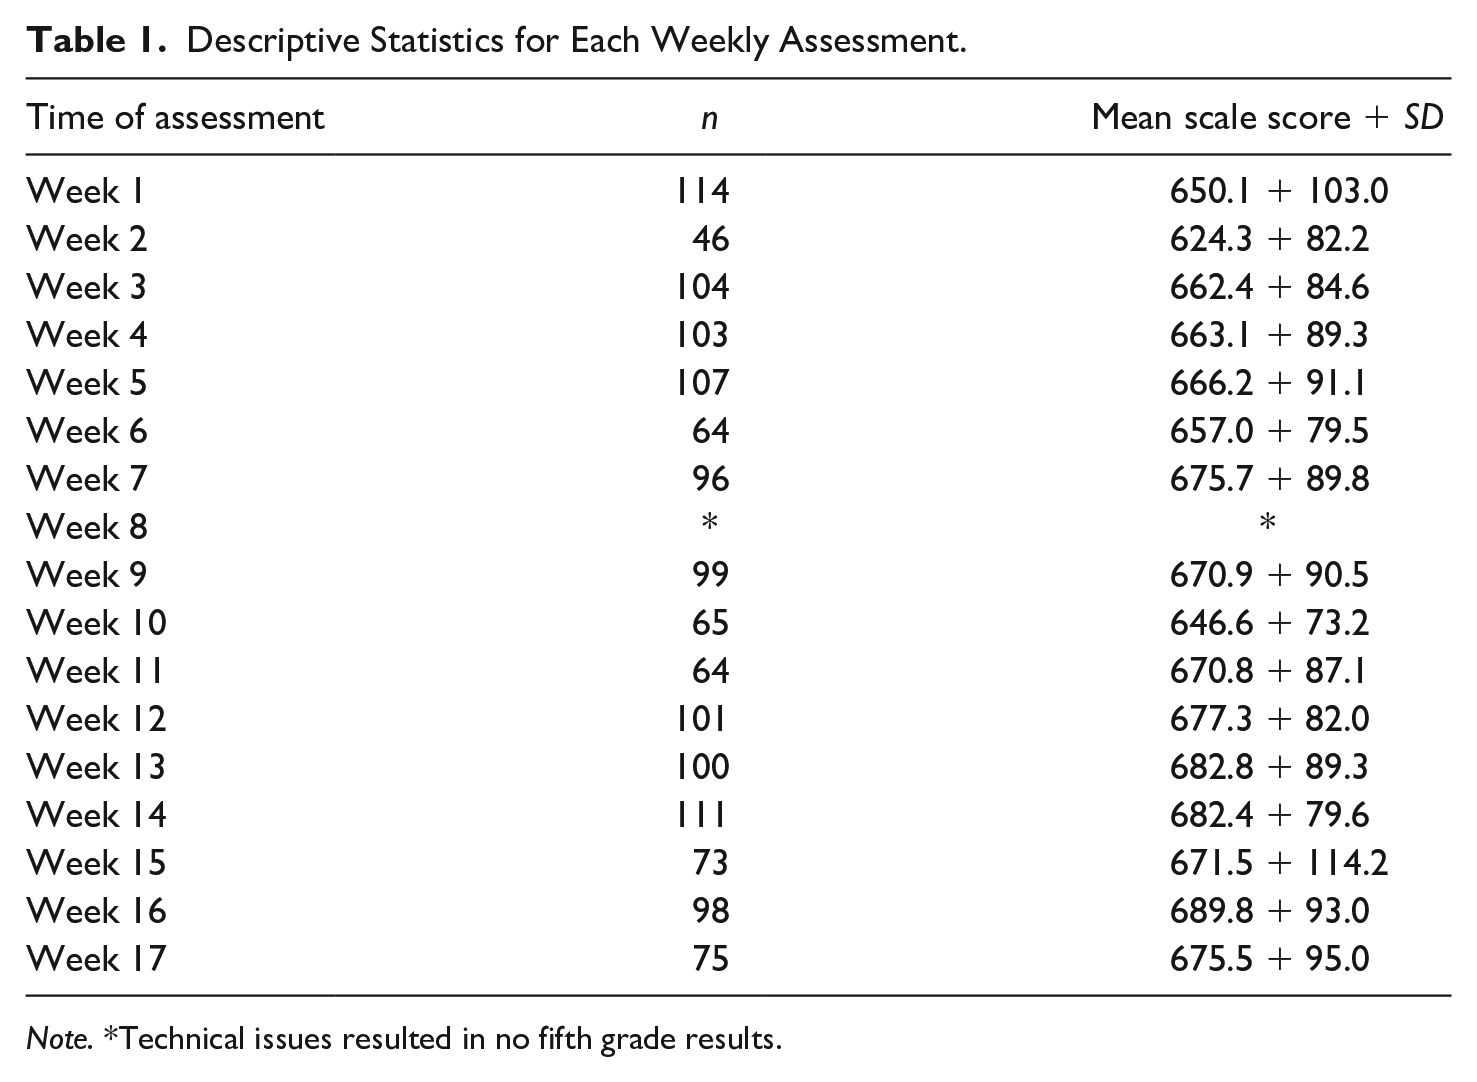
Note. *Technical issues resulted in no fifth grade results.
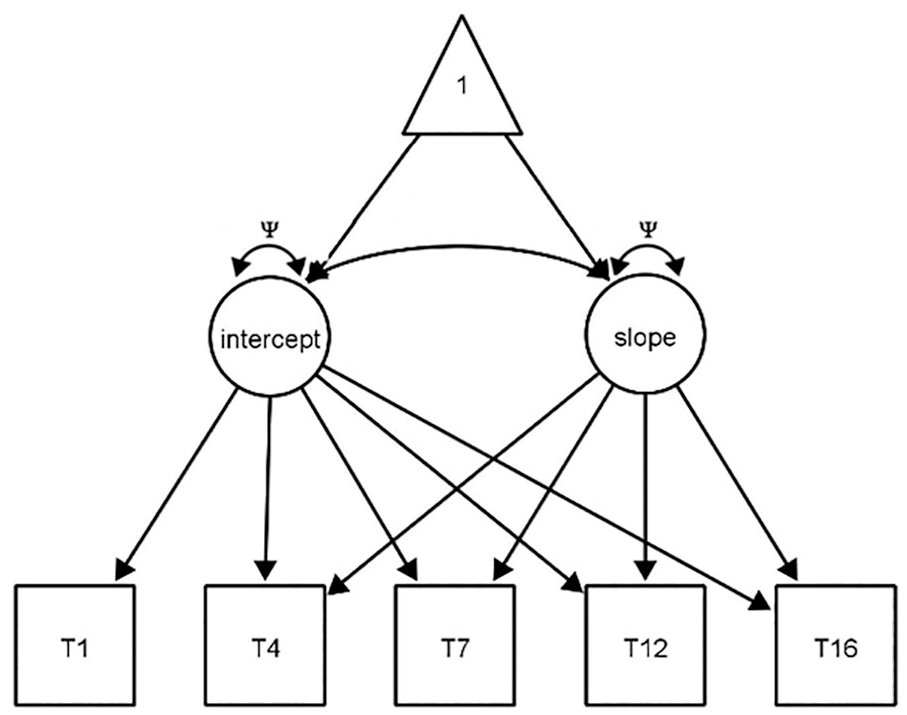
Latent growth curve model of STAR-math across five time points.
Results
Descriptive statistics for each assessment are provided in Table 1. Model estimation terminated normally for Model 1, χ2(131) = 201.535; root mean square error of approximation (RMSEA) = .07; Tucker-Lewis Index (TLI) = .962, and for Model 2, χ2(10) = 11.785; RMSEA = .04; TLI = .996. When considering how well each model fit the data, both the RMSEA and TLI were used to evaluate model fit. As described by West et al. (2012), the RMSEA is a “badness-of-fit” indicator (see, for example, Kline, 2011; West et al., 2012) providing a measure of how bad the model fits the data, that is, as model fit improves, the RMSEA value declines. Thus, lower values for RMSEA are preferable, with values less than 0.05 representing a close fit, values less than 0.08 representing an adequate fit, and values above 0.10 representing a poor fit (West et al., 2012). Similarly, Steiger (2007) noted a strict cut-off of 0.07 for RMSEA.
The RMSEA for Model 1, including all time points, is 0.07, 90% confidence interval (CI) = [0.049, 0.087] and the RMSEA for Model 2, including limited time points, is 0.04 90% CI = [0.000, 0.113], both within the criteria noted by Steiger (2007) as well as by West and associates (2012). The 90% confidence interval, however, suggests the true RMSEA could represent a close fit or a poor fit. However, Kenny et al. (2015) note that the RMSEA is affected by both sample size and degrees of freedom and may not be an appropriate indicator of fit in models based on small samples or with few degrees of freedom.
The TLI, however, is not affected by lower sample size, and is bound by 0 and 1 (West et al., 2012). Because the TLI is a goodness-of-fit index, as model fit improves, so do the TLI values. Generally, TLI values greater than 0.95 are considered to represent a good fit for model acceptability. The TLI for the model including all time points is 0.962, and the TLI for the model including limited points is 0.996, both of which are above the value for determining a good fit for model acceptability. Consequently, based on current values for the RMSEA and TLI fit indices, the latent growth curves presented in Figures 1 and 2 are considered a good fit to the data.
Because a latent growth curve was used to estimate students’ change in math ability, describing the growth involved interpreting both the intercept and the slope of the growth curve. In this context, the intercept represents the students’ mathematical ability, expressed as a scale score, at the beginning of the study. The variance of the intercept is statistically significant (p < .001) for Model 1 (M = 656.38, SD = 83.13) and for Model 2 (M = 652.64, SD = 85.49), indicating that not all students started at the same point, that is, not all students started with the same level of mathematical knowledge. Because this study was focused on whether STAR-M captures change in ability over time and not on what may cause students to have differing levels of ability when entering the study, the causes of the variation in starting points was beyond the scope of the study and was not considered. Pertinent to this study was empirically establishing that not all students were starting with the same level of mathematical knowledge.
The slope, as a measure of linear growth in mathematical ability over the study, is positive for Model 1 (M = 1.95, SD = 0.35, p < .001) and for Model 2 (M = 8.94, SD = 9.75, p < .001), indicating that both models suggest improved ability over the semester. The variance of the slope is also statistically significant for Model 1 (p = .001) and for Model 2 (p = .046), indicating that not all students changed at the same rate (i.e., some students progressed at a faster rate than other students). Likewise, the interaction between the intercept (the student’s initial mathematical knowledge) and the slope (mathematical growth over the semester) is statistically significant for both models (Model 1, p = .008; Model 2, p = .038) and negative, suggesting that the scores of students who scored higher on the first assessment demonstrated less growth over the semester.
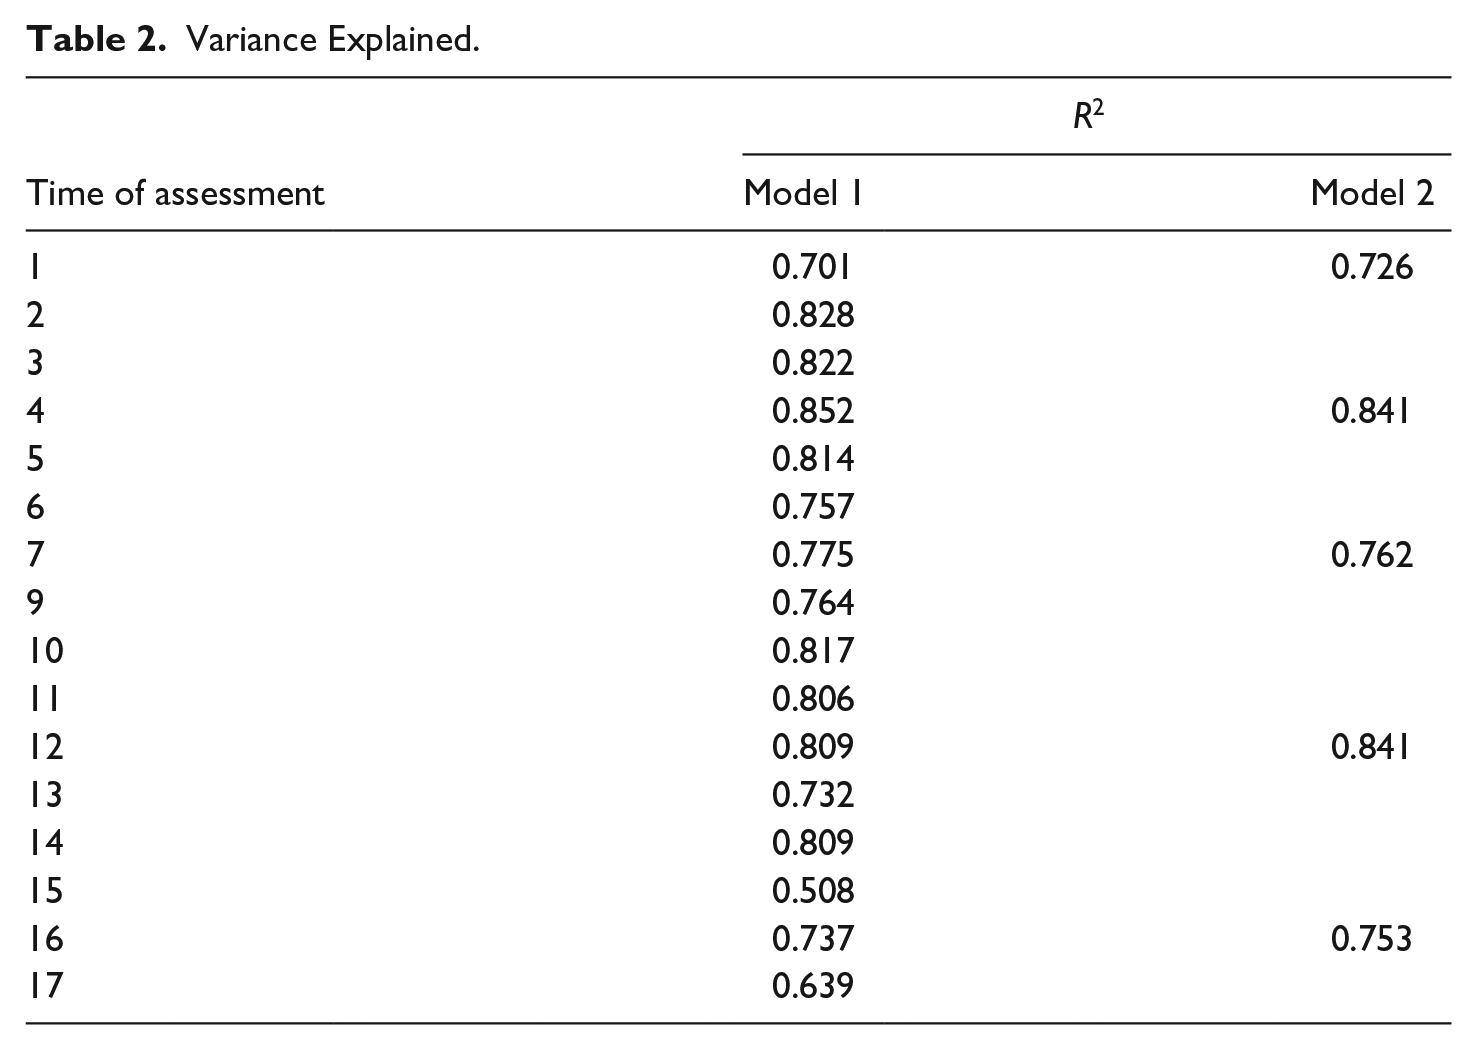
As a statistical measure, R2 is the percentage of variation explained and has been identified as a measure of effect size (Rosenthal, 1994). Values for R2 range from 0 to 1, and the higher the value, the more variation in the data explained by the model. In this study, R2 values at each time point are significant (p < .001) in both models and all assessment points accounted for at least half the variance (Table 2), suggesting that each time point contributed meaningfully to measuring change over time. Expressed as a correlation, the strength of the relationship between each time point and the change, or correlation between each time point and change, ranges from .71 to .92 for Model 1 and from .85 to .92 for Model 2. Social science researchers typically use Cohen’s (1988) suggestions for interpreting correlations: a correlation of at least .10 is small, a correlation of at least .30 is moderate, and a correlation of at least .50 is large. Using Cohen’s criterion, the relationships between the time points and the overall growth represent large correlations and indicate stability in measurements over time.
Variance Explained.
Although R2 provides a measure of variance explained by each time point, and statistical significance conveys the likelihood that results differ from chance expectations, neither relays the size of the effect or the likelihood that the study would have found an effect, if there was an effect to be found. That is, effect size can provide a better representation of the practical impact of a treatment, such as STAR-M. Although many effect sizes exist, Cohen’s d is a measurement of effect size that is popular and easily understood. Essentially, Cohen’s d is the difference between two means (here, ability at Week 1 and at Week 16) divided by the pooled standard deviation of the two conditions. Cohen (1988) suggested interpreting the effect size as negligible below 0.15, small between 0.15 and 0.39, medium between 0.40 and 0.74, and large at 0.75 or above. The effect size (d = 0.40) associated with the change in mathematical ability between the pretest on mathematical ability (Week 1) and the posttest (Week 16) is a medium effect.
Discussion
The assertion that assessment data must drive instruction has been around for decades (Fairchild & Zins, 1986; Stufflebeam, 1968; Weiss, 1977). In 2009, then-U.S. Secretary of Education Arne Duncan noted that effective teachers and administrators regularly review data looking for areas to improve instruction. Progress monitoring is an essential element of informed decision-making and, central to progress monitoring in mathematics, is the identification of students at risk of experiencing academic problems by using repeated measurement of academic ability to inform instruction of individual students.
Consequently, it is imperative to understand, for individual students, whether progress monitoring tools are effective in measuring student progress over time. In addition, it is important that tools to monitor progress are able to detect changes in shorter intervals. Our results show that STAR-M can measure statistically significant differences in ability at weekly intervals. In addition, the statistically significant negative interaction between the pretest scores and rate of change suggests that students who started with less mathematical knowledge progressed more rapidly than students who started at a higher level. Our study also demonstrated that the gains are also captured with fewer administrations of the assessment.
In the study, we were also interested in considering whether the total number of data points were enough to effectively inform instruction and whether progress monitoring measures student progress over time. In this study, results from STAR-M administrations given weeks apart captured changes in student ability with the same, or better, levels of statistical significance as the results from weekly administrations of STAR-M. However, although this study demonstrated that less frequent administrations provided the same level of growth measurement, the number of time-points necessary to effectively inform instruction remains unanswered. Further research should consider addressing this question as well as other questions related to the psychometric properties of STAR-M as a progress monitoring tool.
When considering whether STAR-M measures student progress over time, our study provides empirical evidence that a student’s starting point and how they change over time is statistically significant. Because the slope is statistically significant and is positive, the results of this study suggest that students using STAR-M showed improvement in ability over the course of the study.
Likewise, the statistically significant interaction between starting point and rate of growth provides empirical evidence that STAR-M is sensitive to a student’s starting point and how that student will grow over time. We consider it equally important that students who initially performed at a lower level showed the most improvement over time. This finding could be a result of regression to the mean, that is, some students underperformed on the pretest, whereas other students may have over performed on the pretest. This finding could also indicate that STAR-M is sensitive enough to detect those changes, which is particularly important. Being able to detect changes in any student is important to establish whether growth is occurring. It is especially important to detect those students who are performing below others to ensure they are responding to instruction.
Another key point pertaining to students who performed higher initially making smaller growth gains across the semester is the consideration of ceiling effects or the idea that a student who starts at a higher level has less room to grow. In addition, the smaller growth gains may be related to instruction given to higher performing students topped out, that is, the instructional focus may have been on remediating lower performing students rather than on challenging higher performing students. A key feature of adaptive testing is that successive questions are more difficult as prior questions are answered correctly. As a result, it seems reasonable to consider whether the more complex questions challenge students, leading to more learning and better ability when compared to non-adaptive tests, such as CBM. However, our results did not support this conclusion.
It is important to note that the current study was limited to two school districts within a single southern state in the United States, potentially contributing to selection bias. Consequently, a broader study may provide a more comprehensive picture of progression slopes for all STAR-M participants. Despite this limitation, we believe that the findings of this study have meaningful implications for educators. Our findings empirically support that not all students start at the same point, and that growth over time is dependent on a student’s starting point. The findings also support the use of using STAR-M as a progress monitoring tool that captures changes in student ability, whether weekly or less frequently.
Future research should also examine STAR-M sensitivity in comparison to other measures with known sensitivity, such as CBM. In addition, future research should examine the number of data points necessary to effectively inform instruction and to make more informed decisions about student interventions. Finally, the current study should be replicated with a larger sample and with different demographics.
Footnotes
Declaration of Conflicting Interests
The author(s) declared no potential conflicts of interest with respect to the research, authorship, and/or publication of this article.
Funding
The author(s) disclosed receipt of the following financial support for the research, authorship, and/or publication of this article: The first author served as a paid consultant for Renaissance Learning. The second and third authors received no remuneration.